Embed Size (px)
Citation preview
Glass | Paper | Plastics | Wood | Metals | Minerals
for sorting plants
QUALITY MANAGEMENTSYSTEM
Focus on
Quality
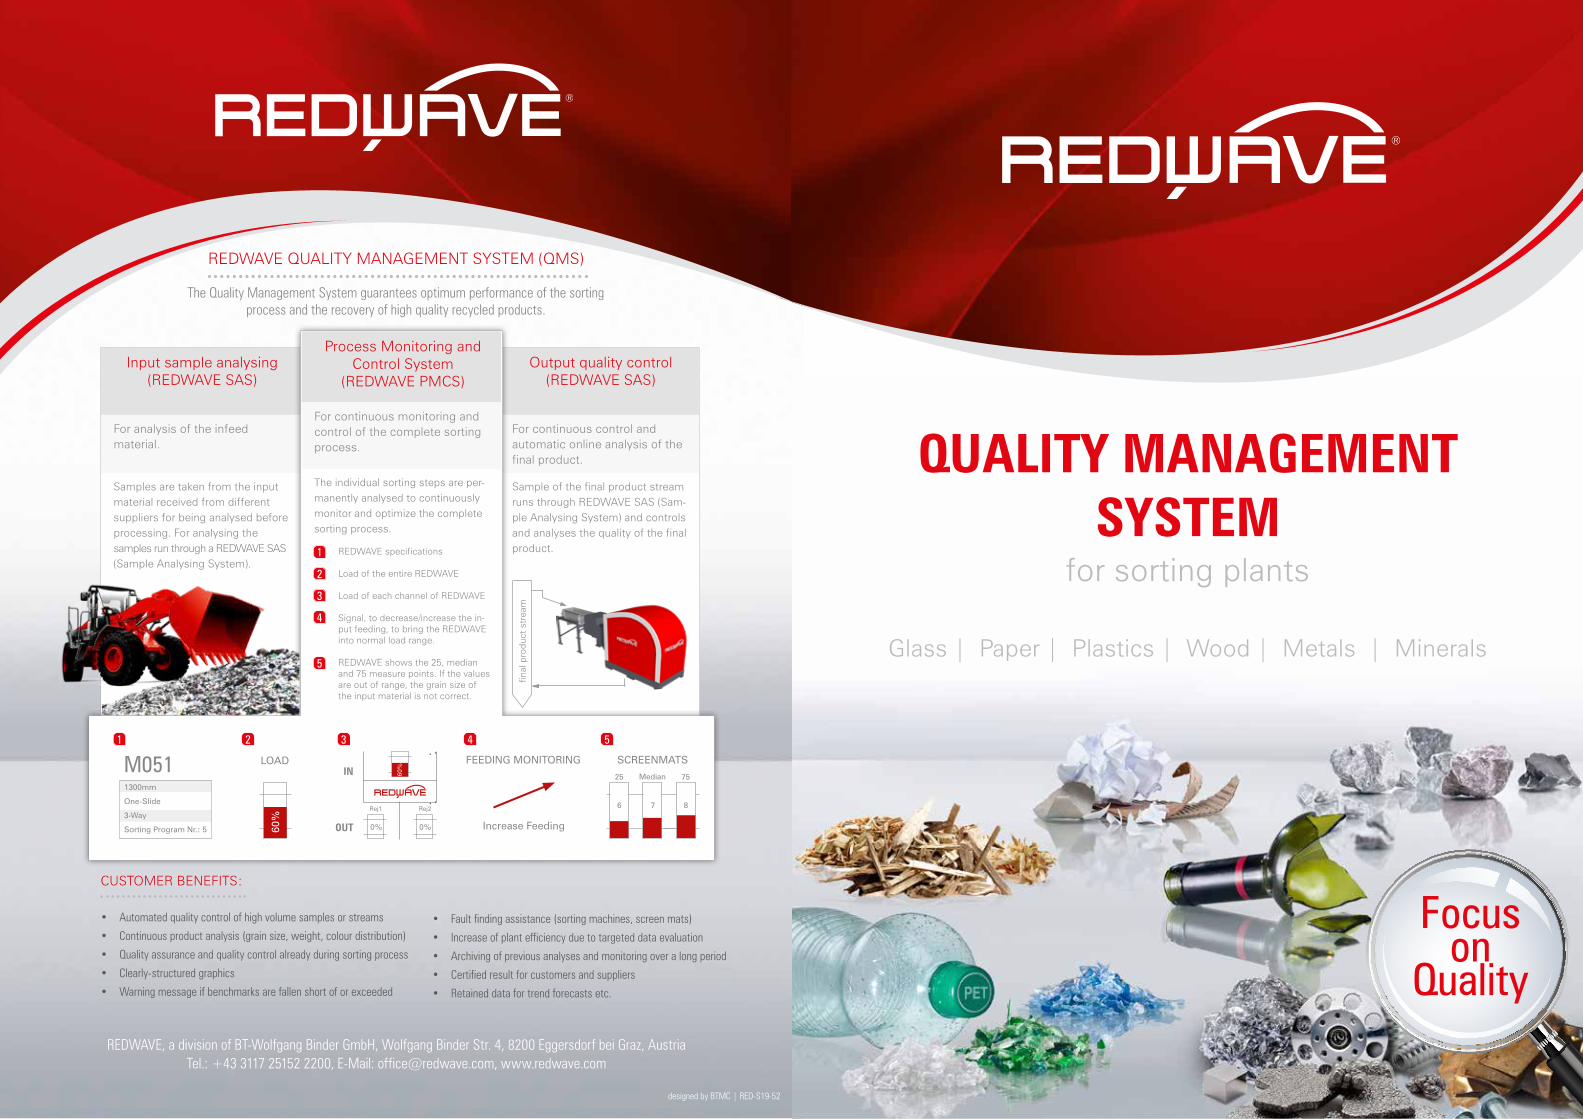
Input sample analysing(REDWAVE SAS)
Process Monitoring and Control System
(REDWAVE PMCS)
Output quality control(REDWAVE SAS)
For analysis of the infeed material.
For continuous monitoring and controlling of the complete sorting process.
For continuous control and automatic online analysis of the final product.
Samples are taken from the input material received from different suppliers for being analysed before processing. For analysing the samples run through a REDWAVE SAS (Sample Analysing System).
The individual sorting steps are per-manently analysed to continuously monitor and optimize the complete sorting process.
Sample of the final product stream runs through REDWAVE SAS (Sam-ple Analysing System) and controls and analyses the quality of the final product.
CUSTOMER BENEFITS:
• Automated quality control of high volume samples or streams
• Continuous product analysis (grain size, weight, colour distribution)
• Quality assurance and quality control already during sorting process
• Clearly-structured graphics
• Warning message if benchmarks are fallen short of or exceeded
REDWAVE QUALITY MANAGEMENT SYSTEM (QMS)
The Quality Management System guarantees optimum performance of the sorting process and the recovery of high quality recycled products.
• Fault finding assistance (sorting machines, screen mats)
• Increase of plant efficiency due to targeted data evaluation
• Archiving of previous analyses and monitoring over a long period
• Certified result for customers and suppliers
• Retained data for trend forecasts etc.
Process Monitoring and Control System
(REDWAVE PMCS)
For continuous monitoring and control of the complete sorting process.
The individual sorting steps are per-manently analysed to continuously monitor and optimize the complete sorting process.
• REDWAVE specifications
• Load of the entire REDWAVE
• Load of each channel of REDWAVE
• Signal, to decrease/increase the in-put feeding, to bring the REDWAVE into normal load range.
• REDWAVE shows the 25, median and 75 measure points. If the values are out of range, the grain size of the input material is not correct.
1
1
2
3
4
5
2 3 4 5
LOAD
60%
SCREENMATS25 Median
876
75
FEEDING MONITORING
Increase Feeding
M0511300mm
One-Slide
3-Way
Sorting Program Nr.: 5
60%
0%0%
IN
OUT
Rej1 Rej2
REDWAVE, a division of BT-Wolfgang Binder GmbH, Wolfgang Binder Str. 4, 8200 Eggersdorf bei Graz, Austria Tel.: +43 3117 25152 2200, E-Mail: [email protected], www.redwave.com
designed by BTMC | RED-S19-52
final
pro
duct
str
eam
GLASS APPLICATIONAvailable data for quality report:
• Product quality:
Counted pieces or objects of analysed material
by assigning theoretical weight, percentages of classes can be reported:
% of flint glass
% of amber glass
% of green glass
% of CSP (Ceramics, Stones, Porcelain) content
% of metal content
% of lead content
% of other heavy metals (Strontium, Barium, etc.)
% of glass ceramics (heat resistant glass)
• Colour distribution (shows if the colour quality of the fraction is according to spec)
• Size distribution (shows if the screen mats are according to spec)
• Recording which material is analysed via time and/or batch numbers
• General process plant data and trends are recorded
If one of the figures is above or below a certain threshold a warning or request for action is sent to the plant control system.
PAPER APPLICATIONAvailable data for quality report:
Percentage of material classes of visible two-dimensional surface
by assigning theoretical weight, percentages of classes can be reported:
• Deinking content by:
office paper, white office paper, high gloss magazine cover, magazines,
magazines in light plastic packaging, newspaper, offset print or flexo print
• Contamination content by:
corrugated brown, cardboard, grey cardboard, printed cardboard,
polymers such as PE, PP, PET, PVC, PS, ABS, …
• Recording which material is analysed via time and/or batch numbers
• General process plant data and trends are recorded
If one of the figures is above or below a certain threshold a warning or request for action is sent to the plant control system.
PLASTICS APPLICATIONAvailable data for quality report:
Percentage of material classes of visible two-dimensional surface
by assigning theoretical weight, percentages of classes can be reported:
• Desired product: e.g. PET
• Undesired product: PE, PP, PVC, PS, ABS, PA, PC, PC+ABS, PMMA, POM, PUR, Silicon, …
• Recording which material is analysed via time and/or batch numbers
• General process plant data and trends are recorded
If one of the figures is above or below a certain threshold a warning
or request for action is sent to the plant control system.
WOOD APPLICATIONAvailable data for quality report: Percentage of material classes of visible two-dimensional surface
by assigning theoretical weight, percentages of classes can be reported:
• Desired product: e.g. virgin wood, painted wood, plywood, chipboard, OSB, …
• Undesired product: Medium Density Fibre (MDF) material
• Recording which material is analysed via time and/or batch numbers
• General process plant data and trends are recorded
If one of the figures is above or below a certain threshold a warning or request for action is sent to the plant control system.
METAL APPLICATIONAvailable data for quality report:
Percentage of material classes of visible two-dimensional surface
by assigning theoretical weight, percentages of classes can be reported:
• Desired product: e.g. Fe
• Undesired product: Cu, Zn, Cr, Mo, Ni, Sn, Pb,…
• Size distribution (shows if the screen mats are according to spec)
• Recording which material is analysed via time and/or batch numbers
• General process plant data and trends are recorded
If one of the figures is above or below a certain threshold a warning or request for action is sent to the plant control system.
MINERAL APPLICATIONAvailable data for quality report:
• Input control
• Product quality
• Colour distribution (shows if the colour quality of the fraction is accord. to spec)
• Recording which material is analysed via time and/or batch numbers
If one of the figures is above or below a certain threshold a warning or request for action is sent to the plant control system.
www.redwave.com www.redwave.com
• Metal content
• Mass flow control
• General process plant data and trends are recorded
• Grain size distribution (shows if the screen mats
are according to spec)