Embed Size (px)
Citation preview
PNNL-20861
Prepared for the U.S. Department of Energy under Contract DE-AC05-76RL01830
Redundancy of Supply in the International Nuclear Fuel Market: Are Fabrication Services Assured? AM Seward TW Wood CM Toomey CJ Perkins BE Ford October 2011
DISCLAIMER This report was prepared as an account of work sponsored by an agency of the United States Government. Neither the United States Government nor any agency thereof, nor Battelle Memorial Institute, nor any of their employees, makes any warranty, express or implied, or assumes any legal liability or responsibility for the accuracy, completeness, or usefulness of any information, apparatus, product, or process disclosed, or represents that its use would not infringe privately owned rights. Reference herein to any specific commercial product, process, or service by trade name, trademark, manufacturer, or otherwise does not necessarily constitute or imply its endorsement, recommendation, or favoring by the United States Government or any agency thereof, or Battelle Memorial Institute. The views and opinions of authors expressed herein do not necessarily state or reflect those of the United States Government or any agency thereof. PACIFIC NORTHWEST NATIONAL LABORATORY operated by BATTELLE for the UNITED STATES DEPARTMENT OF ENERGY under Contract DE-AC05-76RL01830 Printed in the United States of America Available to DOE and DOE contractors from the Office of Scientific and Technical Information,
P.O. Box 62, Oak Ridge, TN 37831-0062; ph: (865) 576-8401 fax: (865) 576-5728
email: [email protected] Available to the public from the National Technical Information Service, U.S. Department of Commerce, 5285 Port Royal Rd., Springfield, VA 22161
ph: (800) 553-6847 fax: (703) 605-6900
email: [email protected] online ordering: http://www.ntis.gov/ordering.htm
This document was printed on recycled paper.
(9/2003)
PNNL-20861
Redundancy of Supply in the International Nuclear Fuel Market: Are Fabrication Services Assured?
AM Seward TW Wood
CM Toomey CJ Perkins
BE Ford
October 2011
Prepared for
the U.S. Department of Energy
under Contract DE-AC05-76RL01830
Pacific Northwest National Laboratory
Richland, Washington 99352

iii
Abstract
For several years, Pacific Northwest National Laboratory (PNNL) has been assessing the reliability of
nuclear fuel supply in support of the U.S. Department of Energy/National Nuclear Security
Administration. Three international low enriched uranium (LEU) reserves, which are intended back up
the existing and well-functioning nuclear fuel market, are currently moving toward implementation.
These backup reserves are intended to contribute to the provision of credible assurance of the
uninterrupted supply of LEU to countries to operate their nuclear power reactors in the event that their
primary fuel supply is disrupted, whether for political or other reasons. The efficacy of these backup
reserves, however, may be constrained without redundant fabrication services. This report presents the
findings of a recent PNNL study that simulated outages of varying durations at specific nuclear fuel
fabrication plants. The modeling specifically enabled prediction and visualization of the reactors affected
and the degree of fuel delivery delay. The results thus provide insight on the extent of vulnerability to
nuclear fuel supply disruption at the level of individual fabrication plants, reactors, and countries. The
simulation studies demonstrate that, when a reasonable set of qualification criteria are applied, existing
fabrication plants are technically qualified to provide backup fabrication services to the great majority of
the world’s power reactors. Fewer than 10 percent of existing nuclear power reactors cannot be inferred
to have technically qualified backup fabrication sources. The report concludes with an assessment of the
redundancy of fuel supply in the nuclear fuel market, and a description of potential extra-market
mechanisms to enhance the security of fuel supply in cases where it may be warranted. This report is an
assessment of the ability of the existing market to respond to supply disruptions that occur for technical
reasons. A forthcoming report will address political disruption scenarios.

v
Executive Summary
For a number of years, multilateral approaches to the nuclear fuel cycle have been under international
discussion as an attractive alternative to the development of national enrichment and reprocessing
facilities. Particularly as nuclear energy is anticipated to expand globally, multilateral fuel cycle services
would enable the development of nuclear energy in newcomer states without incurring the proliferation
risks associated with an increased number of sensitive nuclear facilities. Multilateral approaches to the
nuclear fuel cycle also are highly relevant from an economic and energy security perspective.
Assured fuel supply—the concept that states can have credible assurance that the supply of fuel to
operate their nuclear power reactors will remain uninterrupted in the event of a disruption from their
primary supplier—has been at the center of these discussions. Three low-enriched uranium (LEU)
reserves that are intended as backup reserves in the event of supply disruptions from normal market
sources are currently moving toward implementation. There has been significant monetary investment in
these LEU reserves. They are specifically intended to avoid interference with the operation the current
normally functioning market, but rather, to instill confidence in states to rely on the market for providing
nuclear fuel.
The efficacy of these LEU banks, however, may be constrained without redundant nuclear fuel
fabrication services. The banks consist of LEU, but do not provide assurance of fabricated fuel. Can a
typical reactor owner be certain of finding back-up fabrication services should technical or political
disruptions affect its primary supplier? The answer depends largely on the resiliency of the fabrication
sector, primarily on the degree of production redundancy for specific fuel designs. This report presents
Pacific Northwest National Laboratory (PNNL) analysis of the technical redundancy, or ―depth,‖ of the
nuclear fuel market as it relates to the ability of the market to provide backup fabrication services.
For several years, PNNL has been analyzing the reliability of nuclear fuel supply in support of the
U.S. Department of Energy (DOE)/National Nuclear Security Administration (NNSA).1 PNNL
conducted an initial assessment of the fabrication market in FY 2009, with an assessment of technical
redundancy among vendors of fuel and possible substitution of fabrication services among vendors.2 A
more recent analysis, which is the focus of this report, characterized the functioning and efficacy of the
fuel fabrication market in circumstances where primary supply is disrupted at the fabrication plant level.3
Modeling outages of varying durations at specific fabrication plants enabled prediction and visualization
of the effects of these outages; specifically, the reactors affected and the degree of fuel delivery delay.
Through the application of a set of constraints and assumptions on a fabricator’s technical ability to build
specific fuel designs, the modeling provided some initial insight into the extent of vulnerability to nuclear
fuel supply disruption at the level of individual fabrication plants, reactors, and countries.
1 PNNL presented its analyses of the nuclear fuel fabrication sector to the Reliable Fuel Services Working Group
(RNFSWG) of the International Framework for Nuclear Energy Cooperation (IFNEC) in Warsaw in October 2009
and in Vienna in February 2010. PNNL also briefed the International Atomic Energy Agency (IAEA) on this work
in February 2010, August 2010, and April 2011. PNNL further presented on the role and efficacy of assured fuel
supply incentives to the Nuclear Suppliers Group (NSG) meeting in Noordwijk, The Netherlands, in June 2011. 2 PNNL published the results of this initial assessment in FY 2010: Redundancy of Fuel Fabrication Services in the
International Nuclear Fuel Market (PNNL-19234) 3 Technical capability implies that a nuclear fuel vendor has the capital equipment, process capability, and
engineering knowledge to build fuel meeting specifications for a given reactor. It does not imply that the vendor has
a fabrication capability that has been certified by regulatory authorities.
vi
To conduct the analysis, PNNL developed a data-based model of the fuel fabrication market to
simulate fabrication plant outages. The analysis relied on NAC International’s FuelTrac database, which
enabled PNNL to populate its database with information on every fuel reload to each of the 382 light
water reactors (LWRs) operating globally from 1997 to 2009. Each outage was introduced with a random
start date, with all fabrication plant functions assumed to be lost for the specified outage duration.
Outage durations were 30, 60, or 90 days.
With the original fabrication plant unavailable, the model attempts to reschedule all fuel reload orders
affected by the outage. Two outcomes can occur: (1) the order can be reassigned to an alternative
fabrication plant, or (2) it can be rescheduled to be fulfilled at a later date at the outaged fabrication plant.
A set of alternative fabrication criteria, based on the historical delivery data and set of fuel design and
reactor model matrices, were used to define a set of qualified backup fabrication plants for each fuel
reload order disrupted by an outage.
Three hundred simulations were run for each outage scenario. A number of statistics were output at
the conclusion of each simulation iteration, when all reload orders had been filled. These statistics, which
characterize the impact of the fabrication plant outages, include the number of reload orders affected, the
number of days of delay experienced for each order, and the specific combination of the vendor and fuel
type that were ultimately used to fill the affected orders. Thousands of iterations were run that provided
the basis for the study results.
The simulation studies demonstrate that, when a reasonable set of qualification criteria are applied,
existing fabrication plants are technically qualified to provide backup fabrication services to the majority
of the world’s power reactors. Even in the event of a 90-day outage at a given fabrication plant, about 75
percent of reactors could expect fuel delivery delays of fewer than 35 days. Despite the historical
tendency of reactor operators to remain loyal to a single fuel vendor, technical redundancy in the LWR
fuel market is adequate to provide credible assurance of backup fabrication services to the majority of
global LWRs.
Only 30 reactors (of a total of 382) were found to be significantly vulnerable to long fuel delivery
(and thus refueling) delays greater than the nominal 60 day ―coast-down‖ period in which reactor power
can be de-rated, permitting continued safe operation beyond a planned refueling outage. This small set of
reactors comprises 10 reactor designs and is confined to five countries. The reactors tend to be those
where a design or design variant is unique or nearly unique in terms of fuel specification; that is, the
reactor is in a very small ―market niche‖ that does not attract competition for fuel business, and thus
creates no technical redundancy in the supplier side of the market.
For the small set of vulnerable reactors, extra-market mechanisms might enhance the reliability of
fuel supply.4 These mechanisms might include 1) reciprocal contingency supply contracts between
vendors with appropriate capabilities, 2) addition of dedicated standby fabrication capacity, 3) creation of
fabricated fuel reserves at the reactors of reactor-type level, and 4) creation of ―generic‖ components for
fuel (pins or possibly assemblies), which could be economically stockpiled for large classes of reactors.
4 Three of these options, excluding that of the generic fuel assembly insert, were developed by PNNL and were
briefed to the IAEA in April 2011. Nuclear Fuel Fabrication and Reliable Nuclear Services: Status Report by
PNNL. April 2011. (PNNL-SA-79335)
vii
The analysis also has provided some clarity on how the market could function to provide backup fuel
fabrication services in times of stress. It is important to distinguish between the technical capabilities
modeled in this study and the cooperative behavior required to bring them to bear in a disruption scenario.
PNNL assessed only the technical capabilities in this study.
For the small set of reactors identified in this analysis as vulnerable to supply disruptions, industry
engagement is necessary to design backup fabrication scenarios. The willingness to provide backup
supply services as envisioned here is not predicted, but cooperation among suppliers could prove rational
and attractive. PNNL intends to vet the findings of this analysis with industry, seek industry input on the
design of backup fuel assurance mechanisms in cases where they may be warranted, and determine
industry willingness to cooperate in this regard.
The recent PNNL analysis has shed light on a key question in the implementation of assured fuel
services mechanisms, and has identified several areas that require further analysis. A significant question
raised by the PNNL analysis is whether regulatory approvals (i.e., fuel and reactor licensing) could be
granted either before or quickly after an event to permit effective utilization of technical redundancy
among fuel vendors identified in our analysis. This question will be pursued via discussions with selected
regulators, reactor operators, and vendors.
Furthermore, the nature of the delay scenarios assumed in the PNNL analysis is not specified except
with regard to duration and the property that all fabrication plant functions are assumed to be lost for this
duration. There are several classes of supply disruption events not well represented by these
assumptions, such as disruptions in the upstream supply of materials or components, transportation
constraints specific to a geographic region, or scenarios where a country’s political motives interfere with
supply from facilities under its control. All of these cases will be examined qualitatively, and selected
cases will be treated with a modeling approach similar to that employed in the current study.
Furthermore, fuel supply disruptions could be either technical or political in nature. This report is an
assessment of the ability of the existing market to respond to supply disruptions that occur for technical
reasons. A forthcoming report will address political disruption scenarios. Finally, the analysis described
in this report assessed the redundancy of fuel supply for the existing population of LWRs. A similar
study will be initiated to assess the depth of technical redundancy in fuel fabrication for new and
anticipated reactors.

ix
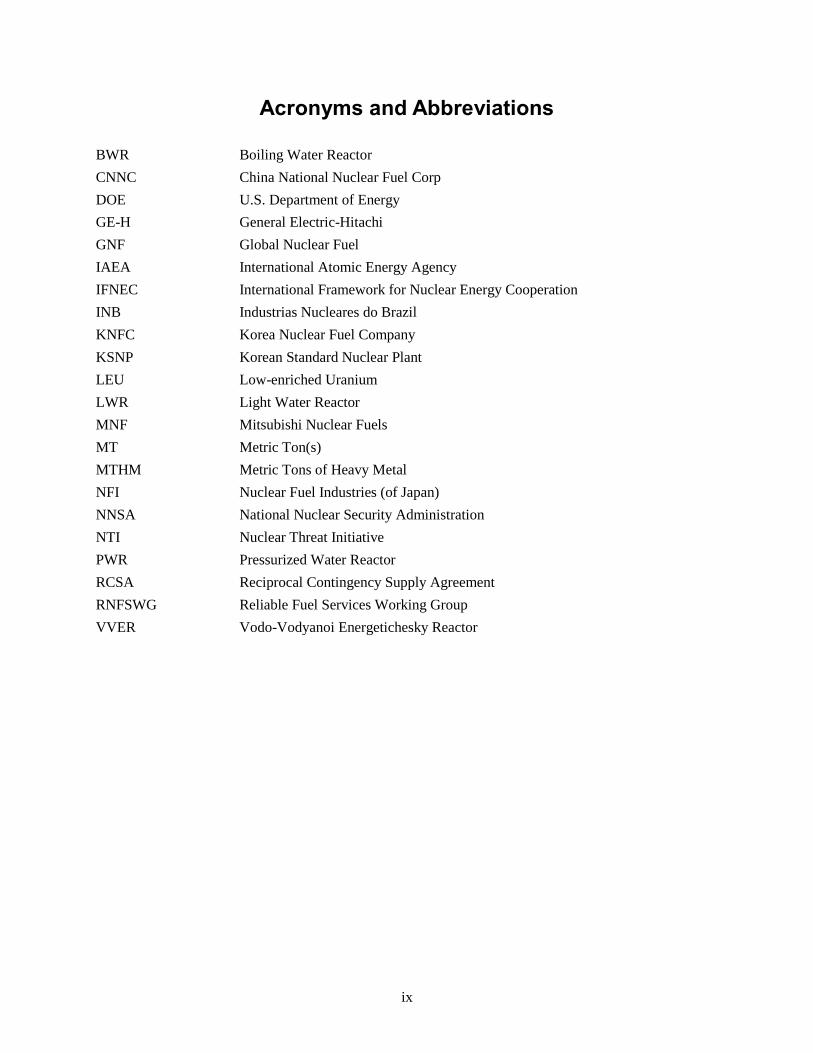
Acronyms and Abbreviations
BWR Boiling Water Reactor
CNNC China National Nuclear Fuel Corp
DOE U.S. Department of Energy
GE-H General Electric-Hitachi
GNF Global Nuclear Fuel
IAEA International Atomic Energy Agency
IFNEC International Framework for Nuclear Energy Cooperation
INB Industrias Nucleares do Brazil
KNFC Korea Nuclear Fuel Company
KSNP Korean Standard Nuclear Plant
LEU Low-enriched Uranium
LWR Light Water Reactor
MNF Mitsubishi Nuclear Fuels
MT Metric Ton(s)
MTHM Metric Tons of Heavy Metal
NFI Nuclear Fuel Industries (of Japan)
NNSA National Nuclear Security Administration
NTI Nuclear Threat Initiative
PWR Pressurized Water Reactor
RCSA Reciprocal Contingency Supply Agreement
RNFSWG Reliable Fuel Services Working Group
VVER Vodo-Vodyanoi Energetichesky Reactor

xi
Contents
Abstract ................................................................................................................................................. iii
Executive Summary .............................................................................................................................. v
Acronyms and Abbreviations ............................................................................................................... ix
1.0 Introduction .................................................................................................................................. 1
1.1 Assured Fuel Supply and Backup Nuclear Fuel Reserves ................................................... 1
1.2 Fabrication Sector Relevance ............................................................................................... 3
1.3 International Nuclear Fuel Market ....................................................................................... 3
2.0 PNNL Nuclear Fuel Fabrication Market Analyses ....................................................................... 7
2.1 PNNL Analyses: Scope and Intent ...................................................................................... 7
2.2 PNNL Analysis: Approach and Methodology .................................................................... 7
2.3 PNNL Analysis: Key Findings ............................................................................................ 10
2.3.1 Magnitude of Delays ................................................................................................. 10
2.3.2 Cost of Fuel Delivery Delays .................................................................................... 12
2.3.3 Incidence and Magnitude of Delays by Reactor Model ............................................ 12
2.3.4 Incidences of Delay ................................................................................................... 13
2.3.5 Back-up Fabrication Outcomes ................................................................................. 14
3.0 Conclusions .................................................................................................................................. 15
3.1 Reciprocal Contingency Supply Agreements ....................................................................... 15
3.2 Backup Fabrication Capacity ............................................................................................... 16
3.3 Stockpiled Fuel Reserves ..................................................................................................... 16
3.4 Generic Fuel Assembly Insert .............................................................................................. 16
4.0 Next Steps ..................................................................................................................................... 17
Appendix – PNNL Nuclear Fuel Fabrication Market Model ................................................................ A.1
xii
Figures
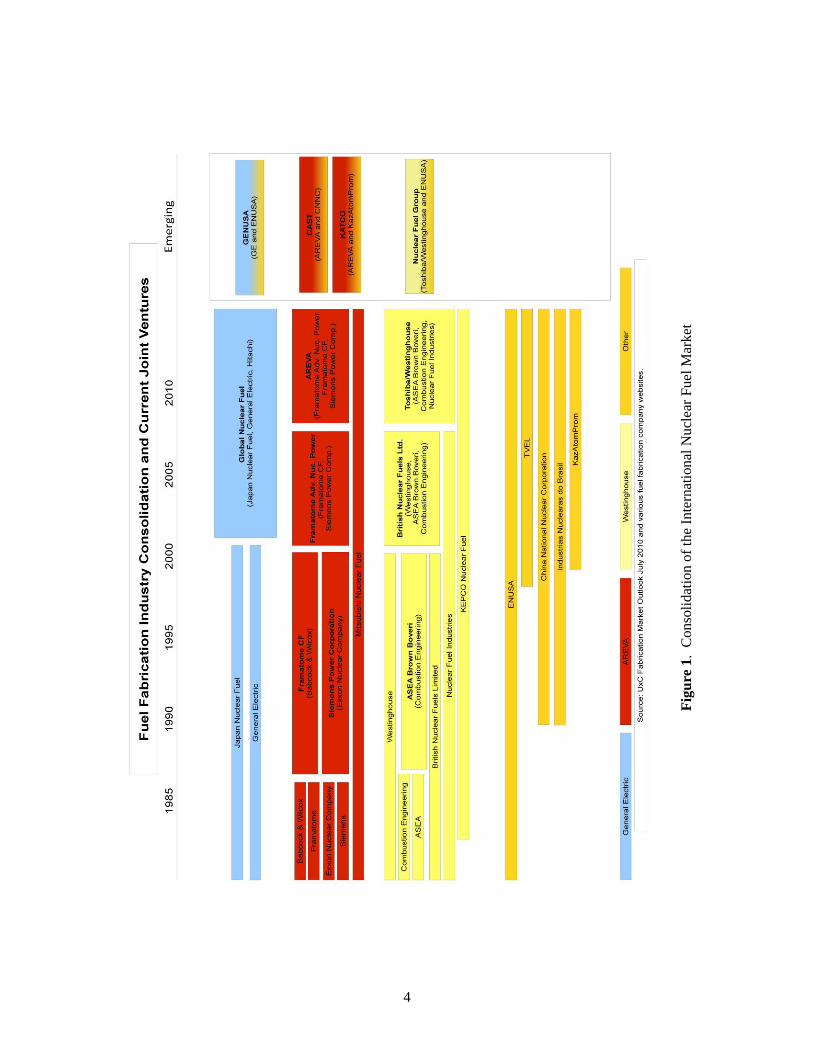
Figure 1. Consolidation of the International Nuclear Fuel Market .................................................... 4
Figure 2. Alternative Fabrication Plant Reassignment Logic ............................................................ 9
Figure 3. Magnitude of Fuel Delivery Delays ................................................................................. 12
Figure 4. Costs of Nuclear Fuel Delivery Delays ............................................................................ 12
Figure 5. Incidence of Delay vs. Magnitude of Delay by Reactor Model ....................................... 13
Figure 6. Incidence of Delay by Original Fabrication Plant – 90 Day Scenario ............................. 14
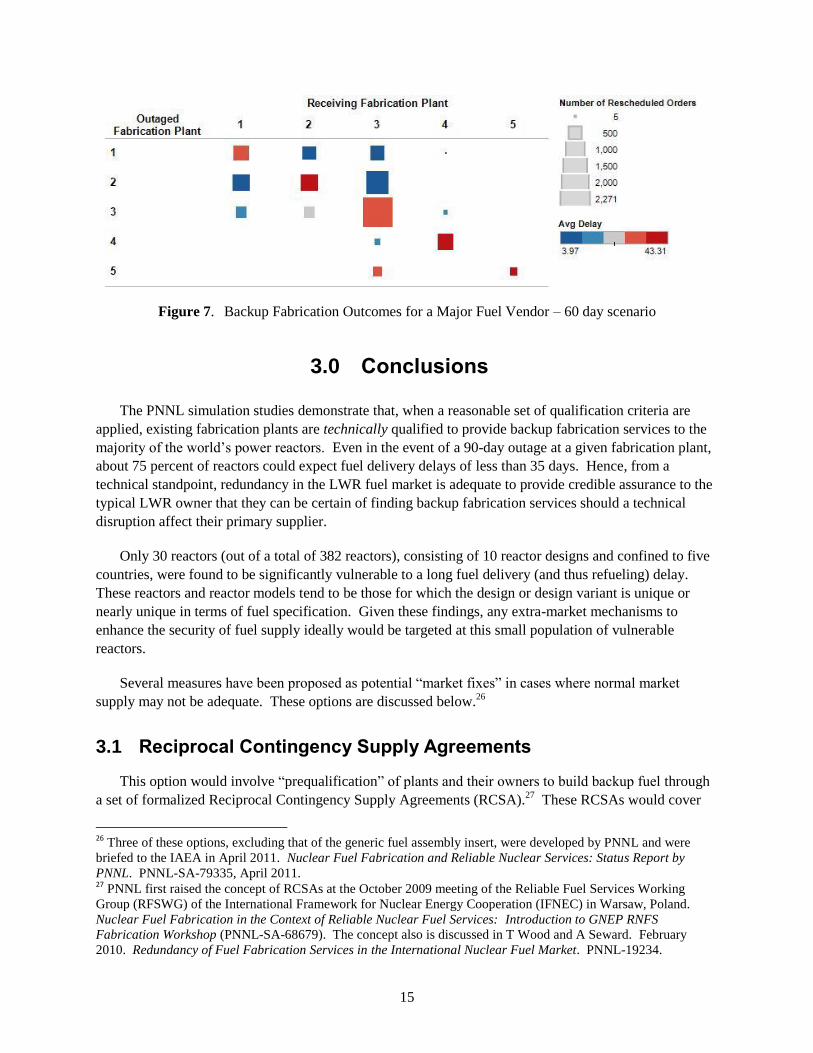
Figure 7. Backup Fabrication Outcomes for a Major Fuel Vendor – 60 day scenario ..................... 15
Figure A.1. Conceptual Scheme of the Fuel Fabrication Reliability Model. .................................. A.1
Figure A.2. Alternative Fabrication Plant Reassignment Logic. .................................................... A.4
Tables
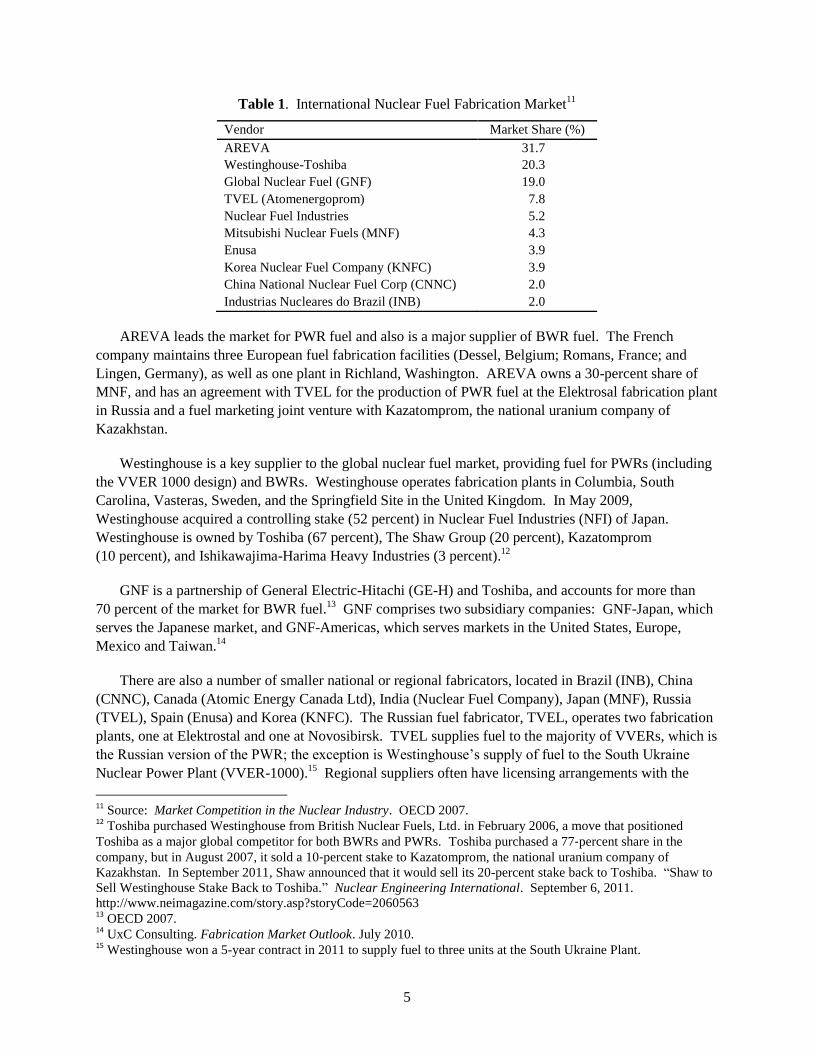
Table 1. International Nuclear Fuel Fabrication Market.................................................................... 5
1
1.0 Introduction
1.1 Assured Fuel Supply and Backup Nuclear Fuel Reserves
In recent years, much international attention has focused on multilateral approaches to the nuclear
fuel cycle as an attractive alternative to the development of national enrichment and reprocessing
facilities. The nonproliferation considerations driving discussions on multilateral approaches—in
particular assured fuel supply—are particularly salient given the potential global expansion of nuclear
energy. Taking into account the effects of the Fukushima-Daiichi nuclear accident in Japan, the
International Atomic Energy Agency (IAEA) anticipates that growth in the nuclear power industry will be
slowed but not reversed.1 Multilateral approaches to the fuel cycle would enable the development of
nuclear energy in newcomer states without increasing proliferation risks associated with an increased
number of enrichment and reprocessing facilities.2
Multilateral approaches to the nuclear fuel cycle are also highly relevant from an energy security and
economic perspective. The magnitude of the capital investment required for new nuclear power facilities
is significant. Multilateral fuel cycle services would allow states to avoid building, operating, and
safeguarding costly enrichment and reprocessing facilities, and may be a more cost effective option for
smaller states or those with limited resources. Particularly for states that intend to build fewer than 15 to
20 nuclear power plants, multilateral options offer better economies of scale. At the same time, they
might offer an enhanced degree of assurance of adequate and timely nuclear fuel supply.
In 2005, (former) IAEA Director General Mohammed ElBaradei convened an expert group to
evaluate the options for multilateral approaches to the nuclear fuel cycle. The findings of this group,
released in February 2005, concluded that the ―… secure availability of nuclear energy rests on
assurances of supply of nuclear material, equipment, services and support for those having nuclear
plants….‖ and that multilateral approaches ―… may represent an effective alternative to national
solutions, depending upon conditions of the assurances of supply of fuel and/or services that are credible
and viewed by the potential clients as dependable, reliable and economical.‖3 The expert group
concluded that ―[O]ne of the most critical steps is to devise effective mechanisms for assurances of supply
of materials and services, which are commercially competitive, free of monopolies and free of political
1 According to the latest projections by IAEA, which take into account the potential effects of the Fukushima-
Daiichi accident on March 11, 2011, the world's installed nuclear power capacity is anticipated to grow from 367
GW(e) today to 501 GW(e) in 2030 in the updated low projection, and to 746 GW(e) in 2030 in the updated high
projection. ―IAEA Projects Slower Nuclear Growth after Fukushima.‖ IAEA Staff Report. September 22, 2011.
http://www.iaea.org/newscenter/news/2011/nuclgrowth.html 2 ―The potential benefits of [multilateral approaches] for the nonproliferation regime are both symbolic and practical.
As a confidence-building measure, multilateral approaches have the potential to provide enhanced assurance…that
the most sensitive parts of the civilian nuclear fuel cycle are less vulnerable to misuse for weapons purposes.‖
Multilateral Approaches to the Nuclear Fuel Cycle: Expert Group Report Submitted to the Director General of the
Atomic Energy Agency. INFCIRC/640. 22 February 2005. p. 101. 3 As noted in a January 2010 Note by the IAEA Secretariat, such assured LEU supply mechanisms could reduce the
noncommercial barriers to starting nuclear power programs and could further strengthen the nuclear nonproliferation
regime by reducing vulnerabilities that might lead states to develop national enrichment and reprocessing. IAEA.
―Assurance of Supply.‖ Note by the Secretariat. 2010/Note 1, January 28, 2010.
2
constraints.‖ A final conclusion of the report was that ―… [e]ffective assurances of supply would have to
include back-up sources of supply.‖4
The release of the expert group’s report spurred the introduction of 12 proposals by governments and
other stakeholders on potential measures to enhance the reliability of nuclear fuel supply.5 The specific
type of fuel assurance measure that has received the most attention is the creation of LEU reserves (or
―banks‖) to be available in the event of supply disruptions to normal market sources of supply. [Such fuel
supply disruptions could either be technical or political in nature. This report is an assessment of the
ability of the existing market to respond to supply disruptions that occur for technical reasons. A
forthcoming report will address political disruption scenarios.]
Currently, three such ―banks‖ intended to ensure a backup supply of LEU to states experiencing a
―non-commercial‖ supply disruption are moving toward implementation: 1) an IAEA Reserve of 60 to
80 metric tons (MT) LEU, 2) a Russian reserve of 120 MT LEU at the Angarsk Fuel Cycle Center, and
3) an American Fuel Reserve of 230 MT LEU down-blended from weapons material. The Russian
reserve was approved by the IAEA Board of Governors in December 2009, and the IAEA and the Russian
Federation signed an agreement to regulate its operations in March 2010. In December 2010, the material
was placed under IAEA’s safeguards. The IAEA reserve was initiated by the Nuclear Threat Initiative
(NTI) in 2006 and formally approved by the IAEA Board of Governors in December 2010. In August
2011, the Notice of Availability for the American Fuel Reserve was published in the Federal Register.
There has been significant international monetary investment in these backup reserves. Together, the
three reserves amount to 410 MT of LEU, which is enough to build about 13 to 15 typical reload batches
of nuclear fuel for a 1000 MWe LWR.6 The banks are specifically intended to avoid interference with the
operation of the current normally functioning market.7
A number of political, technical, and legal issues, as well as operational aspects, remain to be
resolved prior to the implementation of nuclear fuel banks as effective and credible backup supply
mechanisms. A key criticism of the fuel banks has been that they provide for the supply of LEU, but not
of fabricated fuel. This concern was voiced at the June 2009 IAEA Board of Governors meeting by
certain Member States, who argued that, from a technical perspective, the fuel supply assurances provided
by the various fuel bank proposals do not provide a guarantee of fuel supply, specifically for countries
that do not possess an indigenous fuel fabrication capability.
The operation of a nuclear reactor is dependent on the supply of highly specialized, fabricated fuel
assemblies. The efficacy of the proposed fuel assurances would seem to depend on either the existing
fabrication markets or some additional assurance related to the fuel fabricators. The relevance of the
fabrication market to the implementation of a credible and effective assured fuel supply is discussed in the
next section.
4 Ibid. p. 5.
5 These proposals are described in Rauf T and Z Vovchok. March 2008. ―Fuel for Thought.‖ IAEA Bulletin (49):2.
6 LWRs include pressurized water reactors (PWR), boiling water reactors (BWR), and Russian Vodo-Vodyanoi
Energetichesky Reactors (VVER). LWRs account for 90 percent of global nuclear generating capacity. 7 Rauf and Vovchok 2008.
3
1.2 Fabrication Sector Relevance
Prior nuclear fuel assurance studies have not looked in great detail at the fuel fabrication sector.8 Yet
the efficacy of the assured fuel supply measures (e.g., LEU banks) that have been adopted may be
constrained without redundant fabrication services. Unlike LEU, which is the material contained in the
three nuclear fuel reserves now moving toward implementation, fabricated fuel is a not a commodity.
It is a highly engineered, highly specialized product that is not generally substitutable among reactors.
Fabricated fuel assemblies are tailored to the specifications of individual reactors, which are determined
by the physical characteristics of the reactor, the operating utilities’ fuel cycle management strategy, and
national and/or in some cases regional licensing requirements.9 Depending on the requirements of a
particular reactor, each fuel load is specifically designed through collaborations between the fuel vendor
and the reactor operator.10
Each fuel design must be licensed for use in the country in which the reactor
operates. Thus, specific fabrication plants may not have the technical or regulatory ability to fill a short-
term need.
Hence, beyond the assurance of timely and technically adequate LEU supply, the reliability of fuel
supply depends primarily on the degree of production redundancy (for specific fuel designs) in the
fabrication sector. Can a typical reactor owner be certain of finding backup fabrication services should a
technical or political disruption affect its primary supplier? This technical redundancy, or ―depth,‖ is the
key market characteristic assessed in this study. Before turning to the scope, intent, and findings of the
PNNL analysis, the following section presents an overview of the nuclear fuel fabrication sector.
1.3 International Nuclear Fuel Market
As shown in Figure 1, the international nuclear fuel market has undergone a marked consolidation
over the past several decades. At the same time there been an increasing trend of alliances, partnerships,
joint ventures, and mergers as companies seek market share.
Today, there are three major global suppliers of LWR fuel: AREVA, Westinghouse, and Global
Nuclear Fuel (GNF). There are also a number of smaller regional and national fuel fabricators. Table 1
presents their respective shares of the LWR fuel market.
8 There are several important ways in which the supply of fuel fabrication services may be said to be assured to the
operators of nuclear power plants, including 1) assurance of technical performance, 2) assurance of industry capacity
adequate to meet future demands in growing market, and 3) the degree of redundancy for specific fuel types
provided by the market. The first two points have been addressed by other work. Several articles (Ito el al. 1998,
NEA/OECD 2006, Watteau et al. 2001) document the steady and substantial improvement in technical performance
of nuclear fuels, as measured by fuel pin integrity and burnup achieved, that has occurred during the last 30 years.
Regarding assurance of industry capacity adequate to meet future demands in growing market, Rothwell (2009)
shows fuel fabrication services to be assured in this sense for LWRs, which constitute some 90 percent of global
nuclear capacity. There has been little work published, however, on the redundancy of technical capacity in the
current fuel fabrication market. 9Steven Kidd. January 14, 2010. ―Nuclear Fuel Fabrication: Outside the Fuel Cycle?‖ Nuclear Engineering
International. http://www.neimagazine.com/story.asp?sc=2055169 10
World Nuclear Association. ―Nuclear Fuel Fabrication.‖ http://www.world-
nuclear.org/info/nuclear_fuel_fabrication-inf127.html
4
Fig
ure
1.
Conso
lidat
ion o
f th
e In
tern
atio
nal
Nucl
ear
Fuel
Mar
ket
5
Table 1. International Nuclear Fuel Fabrication Market11
Vendor Market Share (%)
AREVA 31.7
Westinghouse-Toshiba 20.3
Global Nuclear Fuel (GNF) 19.0
TVEL (Atomenergoprom) 7.8
Nuclear Fuel Industries 5.2
Mitsubishi Nuclear Fuels (MNF) 4.3
Enusa 3.9
Korea Nuclear Fuel Company (KNFC) 3.9
China National Nuclear Fuel Corp (CNNC) 2.0
Industrias Nucleares do Brazil (INB) 2.0
AREVA leads the market for PWR fuel and also is a major supplier of BWR fuel. The French
company maintains three European fuel fabrication facilities (Dessel, Belgium; Romans, France; and
Lingen, Germany), as well as one plant in Richland, Washington. AREVA owns a 30-percent share of
MNF, and has an agreement with TVEL for the production of PWR fuel at the Elektrosal fabrication plant
in Russia and a fuel marketing joint venture with Kazatomprom, the national uranium company of
Kazakhstan.
Westinghouse is a key supplier to the global nuclear fuel market, providing fuel for PWRs (including
the VVER 1000 design) and BWRs. Westinghouse operates fabrication plants in Columbia, South
Carolina, Vasteras, Sweden, and the Springfield Site in the United Kingdom. In May 2009,
Westinghouse acquired a controlling stake (52 percent) in Nuclear Fuel Industries (NFI) of Japan.
Westinghouse is owned by Toshiba (67 percent), The Shaw Group (20 percent), Kazatomprom
(10 percent), and Ishikawajima-Harima Heavy Industries (3 percent).12
GNF is a partnership of General Electric-Hitachi (GE-H) and Toshiba, and accounts for more than
70 percent of the market for BWR fuel.13
GNF comprises two subsidiary companies: GNF-Japan, which
serves the Japanese market, and GNF-Americas, which serves markets in the United States, Europe,
Mexico and Taiwan.14
There are also a number of smaller national or regional fabricators, located in Brazil (INB), China
(CNNC), Canada (Atomic Energy Canada Ltd), India (Nuclear Fuel Company), Japan (MNF), Russia
(TVEL), Spain (Enusa) and Korea (KNFC). The Russian fuel fabricator, TVEL, operates two fabrication
plants, one at Elektrostal and one at Novosibirsk. TVEL supplies fuel to the majority of VVERs, which is
the Russian version of the PWR; the exception is Westinghouse’s supply of fuel to the South Ukraine
Nuclear Power Plant (VVER-1000).15
Regional suppliers often have licensing arrangements with the
11
Source: Market Competition in the Nuclear Industry. OECD 2007. 12
Toshiba purchased Westinghouse from British Nuclear Fuels, Ltd. in February 2006, a move that positioned
Toshiba as a major global competitor for both BWRs and PWRs. Toshiba purchased a 77‐percent share in the
company, but in August 2007, it sold a 10‐percent stake to Kazatomprom, the national uranium company of
Kazakhstan. In September 2011, Shaw announced that it would sell its 20-percent stake back to Toshiba. ―Shaw to
Sell Westinghouse Stake Back to Toshiba.‖ Nuclear Engineering International. September 6, 2011.
http://www.neimagazine.com/story.asp?storyCode=2060563 13
OECD 2007. 14
UxC Consulting. Fabrication Market Outlook. July 2010. 15
Westinghouse won a 5-year contract in 2011 to supply fuel to three units at the South Ukraine Plant.
6
original vendors of the plants for which they produce. Enusa, for instance, has a licensing agreement with
Westinghouse for its PWR fuel and with General Electric for its BWR fuel.16
The supply of nuclear fuel is based on long-term contracts. Historically, nuclear fuel markets have
been characterized by a high degree of ―vendor allegiance.‖ In fact, approximately two-thirds of the
382 LWRs in the PNNL study database used only a single nuclear fuel vendor during the 13-year period
of record for fuel delivery data. This high degree of vendor allegiance is in part driven by the highly-
specialized nature of fuel fabrication, the demanding technical requirements of fabricated fuel, and
the stringency of fuel licensing. Some reactor operators do occasionally switch fuels, largely to promote
competition among vendors and continued innovation in fuel design and performance.
Typically, the supplier of the reactor supplies the first core and the initial fuel reloads. However, a
competitive LWR fuel market has developed in which fabricators are able to build fuel for reactors of
their competitors’ designs. As vendors looked to fill surplus capacity at their own plants that was no
longer being used for the first cores, they began to design and fabricate fuel of their competitors’
designs.17
Today, with ―… several suppliers competing to supply virtually every different fuel design, a
trend of continuous fuel design improvements has emerged with a continued focus on increasing burnup
and improving fuel performance.‖18
Non‐price competition has driven continued innovation in fuel design, but there also has been
significant cost competition among vendors bidding on a given fuel contract. Among a set of vendors
that are technically qualified to build fuel that meet a given reactor's fuel specifications, the price bids are
very carefully calculated in light of fuel productivity factors. The resulting pressure for cost efficiency in
fuel fabrication operations has resulted in an industry with little excess capacity19
and in which vendors
have incentives to specialize in specific fuel types for which they are most competitive.
Switching fuel designs and/or vendors is a complicated and expensive process. To switch fuel
designs, the reactor must operate for two to three years with a mixed core, which can be difficult to
license and can limit the coverage of fuel warranties from both fuel vendors; the alternative is to reload
the whole core with the new fuel, which is extremely costly and is rarely done.20
Others characteristics of the nuclear fuel market that might strongly influence a reactor’s vulnerability
to supply disruptions include seasonality of production and operator fuel purchasing behavior.
Seasonality of production in the nuclear fuel fabrication market is quite pronounced. Fabrication plants
whose reactor customers are on 12-month refueling cycles, for instance, have to deliver about three-
quarters of their annual volume within the first five months of a year.21
Furthermore, almost all reactors
use ―just-in-time‖ fuel delivery to minimize carrying costs. The exceptions are the Japanese and a few
16
OECD 2007. 17
Kidd 2010. 18
Ibid. 19
Geoffrey Rothwell. ―Cost Structure and Market Sustainability of the International Light Water Reactor Fuel
Fabrication Market.‖ April 2008. 20
OECD 2007. Such was the case for the Temelin nuclear power plant in the Czech Republic. The second unit of
the two-unit VVER-1000 plant was brought online in 2003, and fuel was initially supplied by Westinghouse. In
2006, TVEL won a 10-year contract, and the decision was made to remove all the Westinghouse fuel from the core
and reload it with TVEL fuel. ―Temelin to Use only Russian Fuel from 2010.‖ World Nuclear Association. October
20, 2009 21
Kidd 2010.
7
reactor operators in Western Europe who purchase additional reloads to be stored at the reactor site.
These two factors suggest that the timing of a supply disruption, coupled with the reactor operator’s fuel
purchasing behavior, could have strong implications for the vulnerability of the plant to such a disruption.
The following section presents an overview of the scope and intent of PNNL’s analysis of the nuclear
fuel fabrication market, which focused on the resiliency of the fabrication sector to provide redundant
technical production capacity for specific fuel designs. Assessing the question of whether existing
fabrication plants are technically qualified to provide backup fabrication services to cover the 382 LWRs
in operation today has important implications for the necessity, feasibility, and design of backup supply
mechanisms.
2.0 PNNL Nuclear Fuel Fabrication Market Analyses
2.1 PNNL Analyses: Scope and Intent
For several years, PNNL has been assessing the reliability of nuclear fuel supply in support of DOE/
NNSA.22
PNNL’s analyses of the nuclear fuel fabrication sector have the ultimate goals of assessing both
existing market depth, and the need for and feasibility of possible extra-market measures in the fuel
fabrication market to increase the assurance of nuclear fuel supply. PNNL’s analysis of the fabrication
sector has been greatly facilitated by the purchase of NAC International’s FuelTrac, which is a
comprehensive database containing information on every LWR fuel assembly reload from 1997 to 2009.
PNNL conducted an initial assessment of the fabrication market in FY 2009, with an assessment of
technical redundancy among vendors of fuel, and possible substitution of fabrication services among
vendors.23
In a more recent analysis, which is the focus of this report, PNNL characterized the
functioning and efficacy of the fuel fabrication market in circumstances where the primary supply is
disrupted. Modeling outages at specific fabrication plants enabled prediction and visualization of the
effects of these outages; specifically, the reactors affected and the degree of fuel delivery delay. The
analysis has provided some clarity on how the market could function to provide backup fuel fabrication
services in times of disruption, and offered insight on the extent of vulnerability to nuclear fuel supply
interruption at the level of individual fabrication plants, reactors, and countries. The next section
describes the basic design and functioning of the model; more detail is presented in Appendix A.
2.2 PNNL Analysis: Approach and Methodology
PNNL developed a data-based model of the fuel fabrication market to simulate outages of varying
durations at particular nuclear fuel fabrication plants. The model was populated with data from FuelTrac,
22
PNNL presented its analyses of the nuclear fuel fabrication sector to the Reliable Fuel Services Working Group
(RNFSWG) of the International Framework for Nuclear Energy Cooperation (IFNEC) in Warsaw in October 2009
and in Vienna in February 2010. PNNL also briefed the IAEA on this work in February 2010, August 2010, and
April 2011. PNNL further presented on the role and efficacy of assured fuel supply incentives to the Nuclear
Suppliers Group meeting in Noordwijk, The Netherlands, in June 2011. 23
PNNL published the results of this initial assessment in 2010. See Thomas Wood and Amy Seward. 2010.
Redundancy of Fuel Fabrication Services in the International Nuclear Fuel Market. PNNL-19234, Pacific
Northwest National Laboratory, Richland, Washington.
8
containing information on every fuel reload to each of the 382 LWRs operating globally from 1997 to
2009. The FuelTrac database tracks fuel reload shipments in terms of fuel assemblies and metric tons of
heavy metal (MTHM) from the fabrication plant to the reactor, and includes information on fuel type,
MTHM of fuel supplied, delivery and requirements dates, etc.
The basic entity modeled is a fuel reload order. Each fuel reload order is assigned a set of key
attributes: the original delivery and required dates, specific fuel assembly type and characteristics,
quantity of fuel in MTHM, and the destination nuclear reactor. PNNL also added information to the
database on the design of the destination reactor (e.g., reactor model [Westinghouse three-loop, VVER-
1000, etc.).
To run the model, the user specifies the number of iterations to be run, the fabrication plant
experiencing the outage, and the outage duration (30, 60, 90, or 120 days). The outage start date is set
randomly at the outset of each iteration. All fabrication plant functions are assumed to be lost for the
duration of an outage. With the outaged fabrication plant unavailable, the model attempts to reassign all
fuel reload orders affected by the outage.
The model optimizes each reassignment on the basis of fabricator cross-qualification and order
fulfillment date. If the model finds an alternative fabrication plant capable of fabricating the required fuel
assembly type and fulfilling the order on or before the required date, the order is reassigned to that
alternative fabrication plant. If the model finds one or more alternative fabrication plants capable of
fabricating the required fuel assembly type, but none of those alternative plants is capable of fulfilling the
order on or before the required date, the model reassigns the order to the fabrication plant that is able to
fulfill the order the soonest. In some cases, this may be the outaged fabrication plant itself. If the model is
unable to find any alternative fabrication plant capable of fabricating the required fuel assembly type, the
order is rescheduled to be fulfilled at the outaged plant upon restart.
Cross-qualification of alternative fabrication plants is determined on the basis of historical delivery
data and the set of fuel design and reactor model matrices. In the event that one or more alternative
fabrication plants is qualified to fabricate the required fuel assembly type, the model implements an
algorithm that bins the alternative plants according to priority level and searches each bin successively. At
each priority level, each qualified plant’s production schedule is examined to determine capacity for
additional production. If a plant has sufficient additional production capacity to fulfill the order on or
before the required date, the order is reassigned.
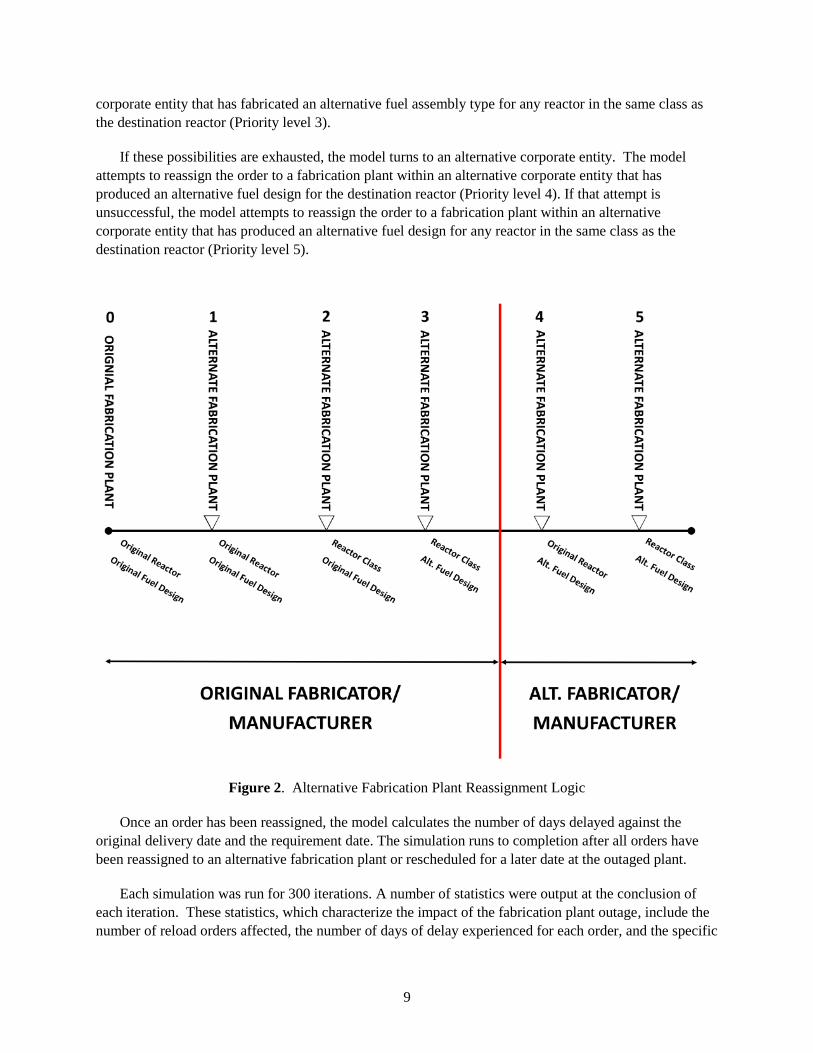
Reassignment priority levels are based on corporate ownership of the outaged fabrication plant, fuel
assembly type, and destination reactor design. Figure 2 illustrates the logic scheme used to reassign
affected fuel orders to an alternative fabrication plant.
The model gives first priority to the corporate owner of the outaged fabrication plant (e.g.,
Westinghouse, AREVA). First, the model attempts to reassign the order to another fabrication plant
within the same corporate entity as the outaged fabricator that has fabricated the required fuel assembly
type for the destination reactor (Priority level 1). If there is no alternative fabricator at that priority level
capable of fulfilling the order on or before the required date, the model attempts to reassign the order to
another fabrication plant within the same corporate entity that has fabricated the required fuel assembly
type for any reactor in the same class as the destination reactor (Priority level 2). If that attempt is
unsuccessful, the model attempts to reassign the order to another fabrication plant within the same
9
corporate entity that has fabricated an alternative fuel assembly type for any reactor in the same class as
the destination reactor (Priority level 3).
If these possibilities are exhausted, the model turns to an alternative corporate entity. The model
attempts to reassign the order to a fabrication plant within an alternative corporate entity that has
produced an alternative fuel design for the destination reactor (Priority level 4). If that attempt is
unsuccessful, the model attempts to reassign the order to a fabrication plant within an alternative
corporate entity that has produced an alternative fuel design for any reactor in the same class as the
destination reactor (Priority level 5).
Figure 2. Alternative Fabrication Plant Reassignment Logic
Once an order has been reassigned, the model calculates the number of days delayed against the
original delivery date and the requirement date. The simulation runs to completion after all orders have
been reassigned to an alternative fabrication plant or rescheduled for a later date at the outaged plant.
Each simulation was run for 300 iterations. A number of statistics were output at the conclusion of
each iteration. These statistics, which characterize the impact of the fabrication plant outage, include the
number of reload orders affected, the number of days of delay experienced for each order, and the specific
10
combination of the fabrication plant and fuel type that were ultimately used to fill the affected orders.
Thousands of iterations were run, providing the basis for the post-simulation statistical analysis.
2.3 PNNL Analysis: Key Findings
The simulation studies demonstrate that, when a reasonable set of qualification criteria are applied,
existing fabrication plants are technically qualified to provide backup fabrication services to the majority
of the world’s power reactors, provided that regulatory certification for alternative fabricators could be
established. It is important to distinguish between the technical capabilities modeled in this study and the
cooperative behavior required to bring them to bear in a disruption scenario. In this study, PNNL
assessed only technical capabilities. The willingness to provide backup supply services as envisioned
here is not predicted, but it is clear that cooperation among suppliers could prove to be rational and
attractive. This is discussed in greater detail in the Conclusion section.
Most reactors have had only one vendor during the relevant period of record.24
However, the existing
market depth is sufficient to provide considerable technical redundancy for almost all LWRs. Even in the
event of a 90-day outage at a given fabrication plant, about 75 percent of reactors could expect fuel
delivery delays of fewer than 35 days.
Only 30 reactors were found to have significant vulnerability to long fuel delivery (and thus
refueling) delays beyond the nominal 60-day ―coast-down‖ period in which reactor power can be derated,
thereby permitting continued safe operation beyond a planned refueling outage. This small set of reactors
comprises 10 reactor designs and is confined to five countries. The reactors tend to be those for which a
design or design variant is unique or nearly unique in terms of fuel specification; that is, it is a very small
―market niche‖ that does not attract competition for fuel business and, thus, create technical redundancy
in the supplier side of the market.
This small population of reactors is quite likely to suffer delays if an outage occurs at their primary
suppliers. In these cases, delays would average between 50 and 70 days for a 90-day outage at their
primary supplier.
2.3.1 Magnitude of Delays
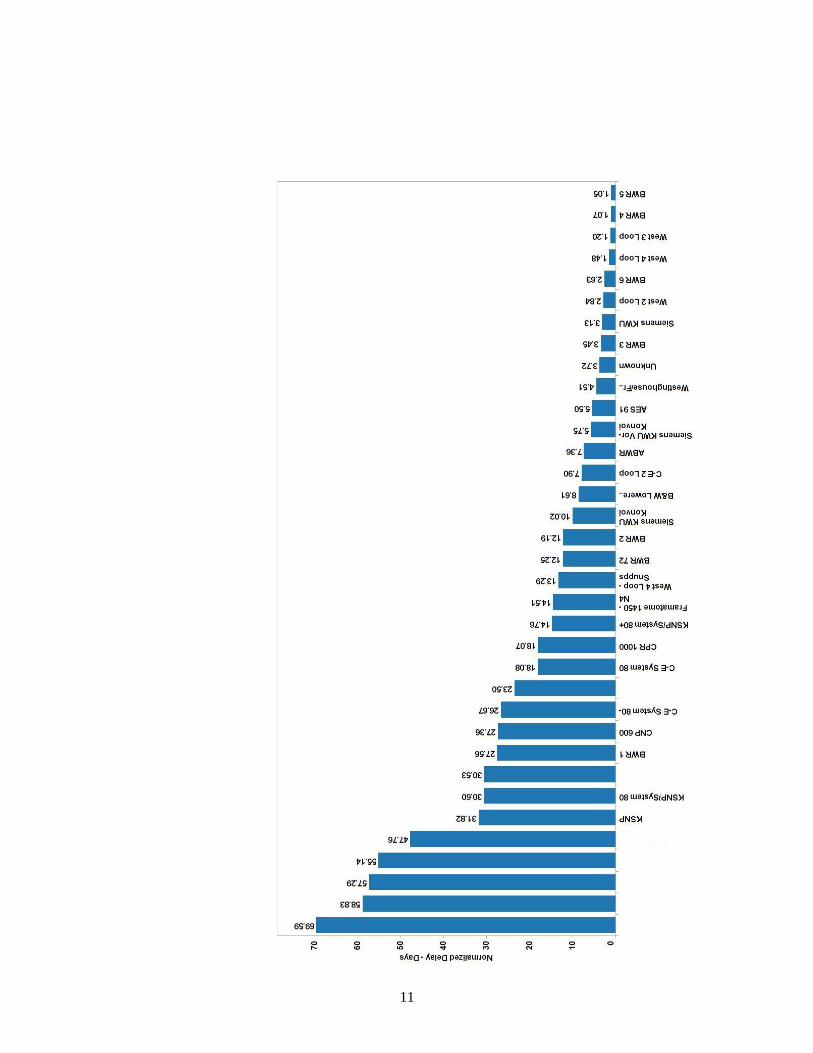
Figure 3 shows average delays for each reactor model class, excluding those models that would have
delays of less than 1 day.25
In terms of impact at the reactor, delays of less than 50 to 60 days may
generally be accommodated by de-rating reactor power to maintain safety margins. This practice
is costly in terms of power production and revenue but far preferable to a reactor shutdown. The
―flexibility window‖ ends typically about 60 days after a scheduled refueling, at which time the reactor
must be shut down. Thus, average delays of over 60 days for a given reactor model indicate the scenario
that generates them has large consequences.
24
Over half of all reactors (i.e., more than 250 reactors) have used only a single vendor. Most of these reactors are
western PWRs or Russian VVERs. Almost all BWRs use multiple vendors. 25
The values are averaged, and then normalized by the number of reactors in a class.
11
12
Figure 3. Magnitude of Fuel Delivery Delays
2.3.2 Cost of Fuel Delivery Delays
The cost of a protracted fuel delivery delays is quite substantial. Figure 3 depicts the cost of fuel
delivery delays as a function of delay duration, and its intersections with production costs of individual
reloads and total fuel production. The purple and red horizontal lines are the thresholds beyond which
costs of fuel delivery delays exceed typical fabrication cost and total fuel cost. Costs exceed fuel
fabrication costs after a 30-day delay and exceed total fuel costs after a 60-day delay. After some 60-day
delays, reactors are forced to shut down at a cost of about $1 million per GWe-day.
2.3.3 Incidence and Magnitude of Delays by Reactor Model
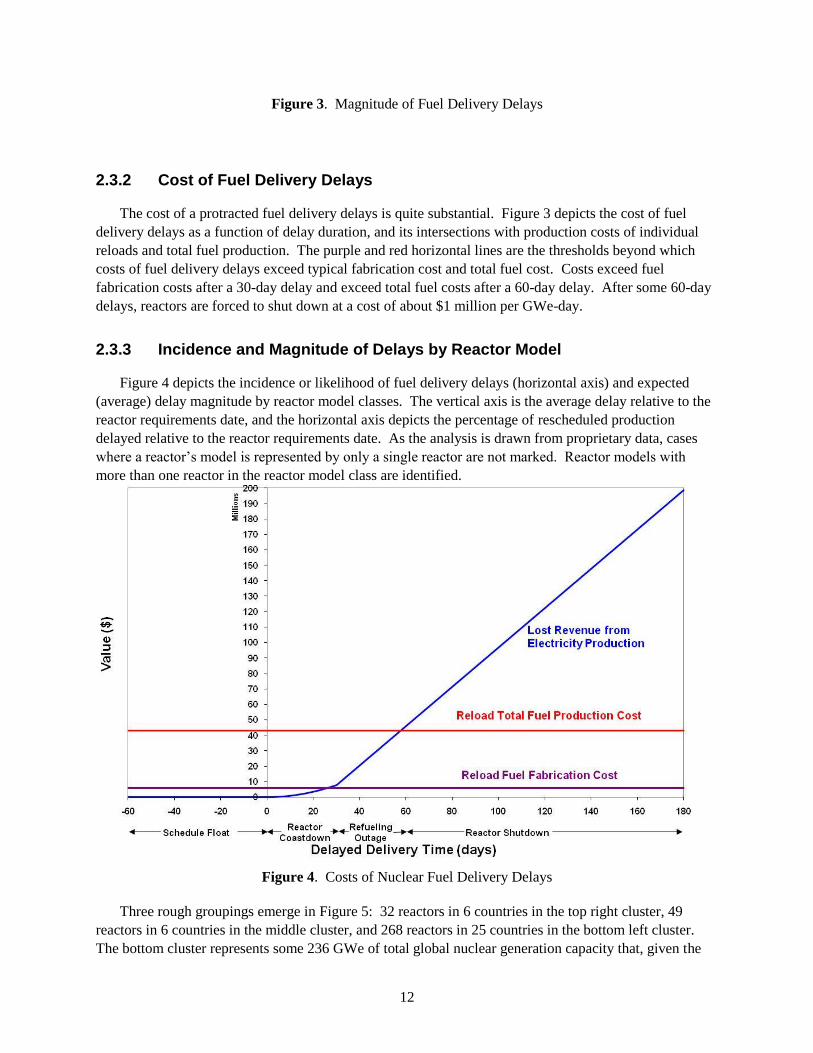
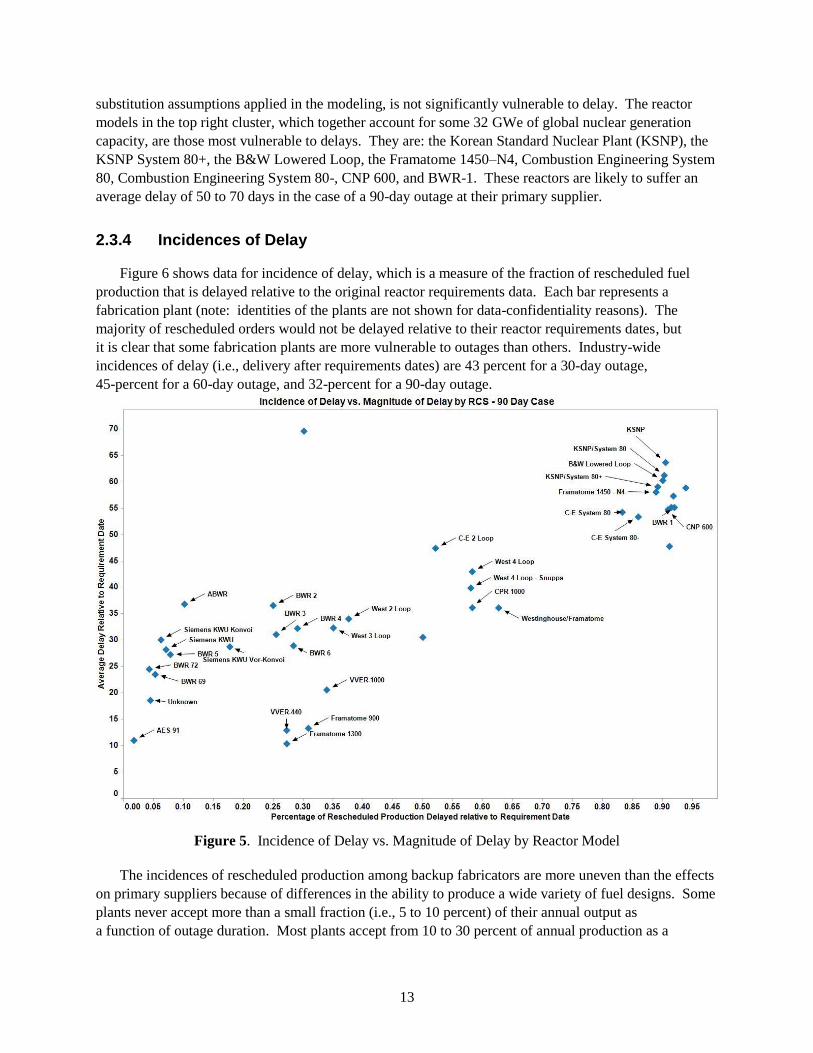
Figure 4 depicts the incidence or likelihood of fuel delivery delays (horizontal axis) and expected
(average) delay magnitude by reactor model classes. The vertical axis is the average delay relative to the
reactor requirements date, and the horizontal axis depicts the percentage of rescheduled production
delayed relative to the reactor requirements date. As the analysis is drawn from proprietary data, cases
where a reactor’s model is represented by only a single reactor are not marked. Reactor models with
more than one reactor in the reactor model class are identified.
Figure 4. Costs of Nuclear Fuel Delivery Delays
Three rough groupings emerge in Figure 5: 32 reactors in 6 countries in the top right cluster, 49
reactors in 6 countries in the middle cluster, and 268 reactors in 25 countries in the bottom left cluster.
The bottom cluster represents some 236 GWe of total global nuclear generation capacity that, given the
13
substitution assumptions applied in the modeling, is not significantly vulnerable to delay. The reactor
models in the top right cluster, which together account for some 32 GWe of global nuclear generation
capacity, are those most vulnerable to delays. They are: the Korean Standard Nuclear Plant (KSNP), the
KSNP System 80+, the B&W Lowered Loop, the Framatome 1450–N4, Combustion Engineering System
80, Combustion Engineering System 80-, CNP 600, and BWR-1. These reactors are likely to suffer an
average delay of 50 to 70 days in the case of a 90-day outage at their primary supplier.
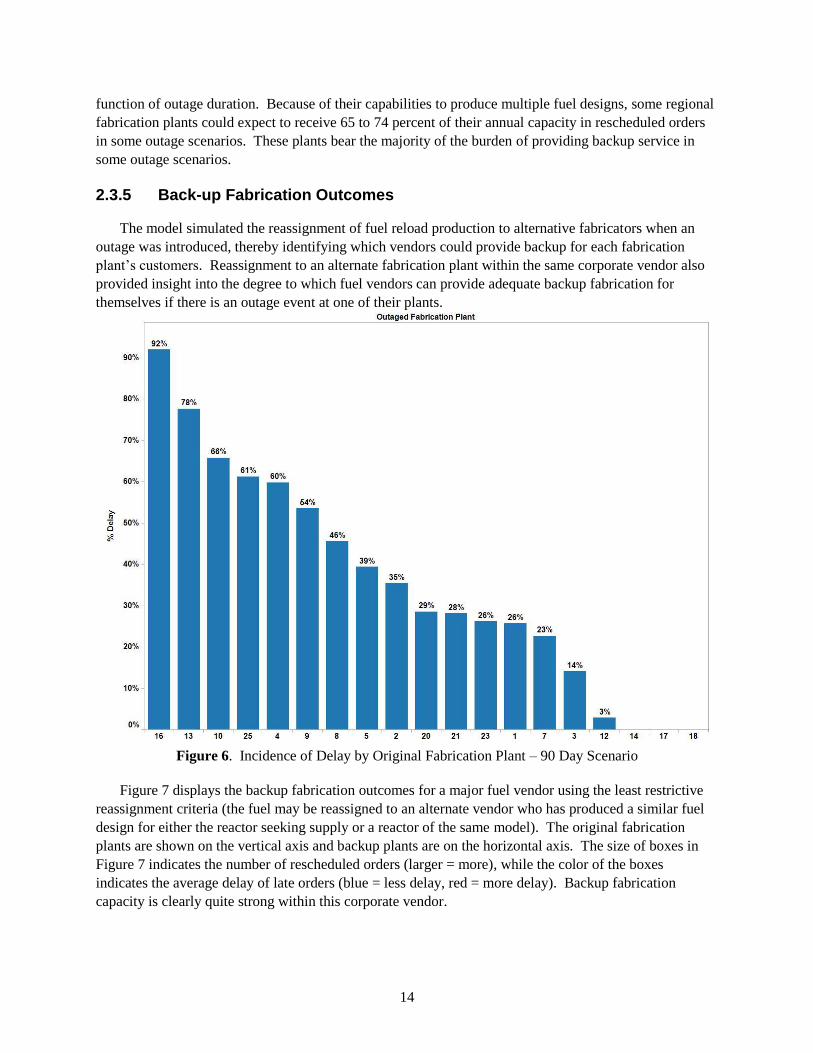
2.3.4 Incidences of Delay
Figure 6 shows data for incidence of delay, which is a measure of the fraction of rescheduled fuel
production that is delayed relative to the original reactor requirements data. Each bar represents a
fabrication plant (note: identities of the plants are not shown for data-confidentiality reasons). The
majority of rescheduled orders would not be delayed relative to their reactor requirements dates, but
it is clear that some fabrication plants are more vulnerable to outages than others. Industry-wide
incidences of delay (i.e., delivery after requirements dates) are 43 percent for a 30-day outage,
45-percent for a 60-day outage, and 32-percent for a 90-day outage.
Figure 5. Incidence of Delay vs. Magnitude of Delay by Reactor Model
The incidences of rescheduled production among backup fabricators are more uneven than the effects
on primary suppliers because of differences in the ability to produce a wide variety of fuel designs. Some
plants never accept more than a small fraction (i.e., 5 to 10 percent) of their annual output as
a function of outage duration. Most plants accept from 10 to 30 percent of annual production as a
14
function of outage duration. Because of their capabilities to produce multiple fuel designs, some regional
fabrication plants could expect to receive 65 to 74 percent of their annual capacity in rescheduled orders
in some outage scenarios. These plants bear the majority of the burden of providing backup service in
some outage scenarios.
2.3.5 Back-up Fabrication Outcomes
The model simulated the reassignment of fuel reload production to alternative fabricators when an
outage was introduced, thereby identifying which vendors could provide backup for each fabrication
plant’s customers. Reassignment to an alternate fabrication plant within the same corporate vendor also
provided insight into the degree to which fuel vendors can provide adequate backup fabrication for
themselves if there is an outage event at one of their plants.
Figure 6. Incidence of Delay by Original Fabrication Plant – 90 Day Scenario
Figure 7 displays the backup fabrication outcomes for a major fuel vendor using the least restrictive
reassignment criteria (the fuel may be reassigned to an alternate vendor who has produced a similar fuel
design for either the reactor seeking supply or a reactor of the same model). The original fabrication
plants are shown on the vertical axis and backup plants are on the horizontal axis. The size of boxes in
Figure 7 indicates the number of rescheduled orders (larger = more), while the color of the boxes
indicates the average delay of late orders (blue = less delay, red = more delay). Backup fabrication
capacity is clearly quite strong within this corporate vendor.
15
Figure 7. Backup Fabrication Outcomes for a Major Fuel Vendor – 60 day scenario
3.0 Conclusions
The PNNL simulation studies demonstrate that, when a reasonable set of qualification criteria are
applied, existing fabrication plants are technically qualified to provide backup fabrication services to the
majority of the world’s power reactors. Even in the event of a 90-day outage at a given fabrication plant,
about 75 percent of reactors could expect fuel delivery delays of less than 35 days. Hence, from a
technical standpoint, redundancy in the LWR fuel market is adequate to provide credible assurance to the
typical LWR owner that they can be certain of finding backup fabrication services should a technical
disruption affect their primary supplier.
Only 30 reactors (out of a total of 382 reactors), consisting of 10 reactor designs and confined to five
countries, were found to be significantly vulnerable to a long fuel delivery (and thus refueling) delay.
These reactors and reactor models tend to be those for which the design or design variant is unique or
nearly unique in terms of fuel specification. Given these findings, any extra-market mechanisms to
enhance the security of fuel supply ideally would be targeted at this small population of vulnerable
reactors.
Several measures have been proposed as potential ―market fixes‖ in cases where normal market
supply may not be adequate. These options are discussed below.26
3.1 Reciprocal Contingency Supply Agreements
This option would involve ―prequalification‖ of plants and their owners to build backup fuel through
a set of formalized Reciprocal Contingency Supply Agreements (RCSA).27
These RCSAs would cover
26
Three of these options, excluding that of the generic fuel assembly insert, were developed by PNNL and were
briefed to the IAEA in April 2011. Nuclear Fuel Fabrication and Reliable Nuclear Services: Status Report by
PNNL. PNNL-SA-79335, April 2011. 27
PNNL first raised the concept of RCSAs at the October 2009 meeting of the Reliable Fuel Services Working
Group (RFSWG) of the International Framework for Nuclear Energy Cooperation (IFNEC) in Warsaw, Poland.
Nuclear Fuel Fabrication in the Context of Reliable Nuclear Fuel Services: Introduction to GNEP RNFS
Fabrication Workshop (PNNL-SA-68679). The concept also is discussed in T Wood and A Seward. February
2010. Redundancy of Fuel Fabrication Services in the International Nuclear Fuel Market. PNNL-19234.
16
the regulatory and legal requirements to make a technical capability to provide back-up supply feasible in
practice. This would be a very different undertaking for the majority of reactors for which security of
supply is not a significant concern versus the 30 reactors identified in the PNNL study as vulnerable to
supply disruptions. For the majority of reactors, cross-qualification of backup supply among vendors
would exploit the existing technical capability of the market to provide backup fabrication, which is much
deeper than historical vendor allegiances suggest. Even for historically single-vendor reactors, there
typically exist alternate fabrication vendors whose past experience includes successful fuel manufacture
for ―sister‖ reactors (i.e., reactors of the same model and basic fuel geometry).
For the 30 reactors identified in the study as vulnerable to supply disruptions, the technical
redundancy within the market to provide adequate backup fabrication does not exist. Thus, for these 30
reactors, cross-qualification would not be a matter of formalizing reciprocal backup among qualified
vendors. Rather, it would entail developing the technical ability of an alternate vendor to produce a
viable fuel design, which could be a rather costly endeavor. At the 2006 International Meeting on LWR
Fuel Performance in Salamanca, Spain, G. Varley noted, ―[the] one time entry costs that are inevitable for
qualification of an alternative supplier are not trivial, and it is not necessarily easy to keep [suppliers]
interesting in bidding, especially if the buyer is small with limited or no ability to distribute supply among
more than one fabricator at a time.‖28
3.2 Backup Fabrication Capacity
Another option is to create additional reserve capacity to be used only in the rare case of a market
disruption. When capacity exceeds demand in the fuel fabrication market and from an economic
standpoint, investment in new fabrication facilities would not make sense economically. Such investment
might be justified from an energy security perspective, however, where such investment might enhance
supply security.
3.3 Stockpiled Fuel Reserves
Fabricated fuel also could be stockpiled at the reactor site, as is the practice for a small number of
reactor operators today. However, such ―ahead-of-time‖ reload purchasing is not more widely practiced
largely because of economic considerations. A variant of the stockpiling concept would address this
carrying cost issue by sharing carrying costs among sets of reactors with very similar fuel specifications.
In cases where fuel assemblies are essentially identical, several nuclear plant owners could maintain a
stockpile of fuel assemblies to provide an emergency fuel supply for all of the reactors.
3.4 Generic Fuel Assembly Insert
A ―generic‖ fuel assembly insert could be viable option for plant owners of plants that have similar,
but different, fuel designs, possibly supplied by different vendors. Such an ―emergency spare‖ would be
designed to be compatible with fuel currently being used in a set of reactors.
28
G Varley. ―For a Few Dollars More: A Story about Security of Supply.‖ Presented at 2006 International Meeting
on LWR Fuel Performance, October 22-26, 2006, Salamanca, Spain.
17
The extent to which one or more of these extra-market mechanisms might mitigate or prevent the
effects of fabrication supply outages requires further evaluation. It is clear that any action taken to
enhance the security of supply should be tailored to the small set of reactors for which supply security is
likely to be a concern in an assured fuel services framework.
4.0 Next Steps
The PNNL analysis offers some degree of clarity on the possible nature of industry backup in the
event of a disruption in supply from a reactor’s primary fuel vendor, and provides some clarity on how
the market could function to provide backup fuel fabrication services in times of stress. It is important to
distinguish, however, between the technical capabilities modeled in this study and the cooperative
behavior required to bring them to bear in a disruption scenario. In this study, PNNL assessed only the
technical capabilities.
For the small set of reactors identified in this analysis as vulnerable to supply disruptions, industry
engagement is necessary to design backup fabrication scenarios. The willingness to provide backup
supply services as envisioned here is not predicted, but cooperation among suppliers could prove rational
and attractive. PNNL intends to vet the findings of this analysis with nuclear industry representatives,
seek industry input on the design of backup fuel assurance mechanisms in cases where they may be
warranted, and determines industry willingness to cooperate in this regard.
The analysis to date has characterized the ability of the nuclear fuel market to accommodate
unforeseeable disruptions and has identified a set of plants, reactors, and countries that are vulnerable to
supply disruptions. While the recent analysis has shed light on a key question in the implementation of
assured fuel services mechanisms, it also has identified several areas that require further analysis. A
significant question raised by the PNNL analysis is whether regulatory (fuel and reactor licensing)
approvals could be granted either ahead of time or quickly after an event to permit the effective utilization
of technical redundancy among fuel vendors identified in our analysis. An answer to this question will be
pursued via discussions with selected regulators, reactor operators, and vendors.
Furthermore, the nature of the delay scenarios assumed in the PNNL analysis is not specified except
with regard to duration and the property that all fabrication plant functions are assumed to be lost for the
duration. There are several classes of supply disruption events not well represented by these
assumptions, such as disruptions in the upstream supply of materials or components, transportation
constraints specific to a geographic region, or scenarios where a country’s political motives interfere with
supply from facilities under its control. All of these cases will be examined qualitatively, and selected
cases will be treated using a modeling approach similar to that employed in the current study.
Finally, the current analysis has assessed the redundancy of fuel supply for the existing population of
LWRs. A similar study will be initiated to assess the depth of technical redundancy in fuel fabrication for
new and anticipated reactors designs.

Appendix
PNNL Nuclear Fuel Fabrication Market Model

A.1
Appendix
PNNL Nuclear Fuel Fabrication Market Model
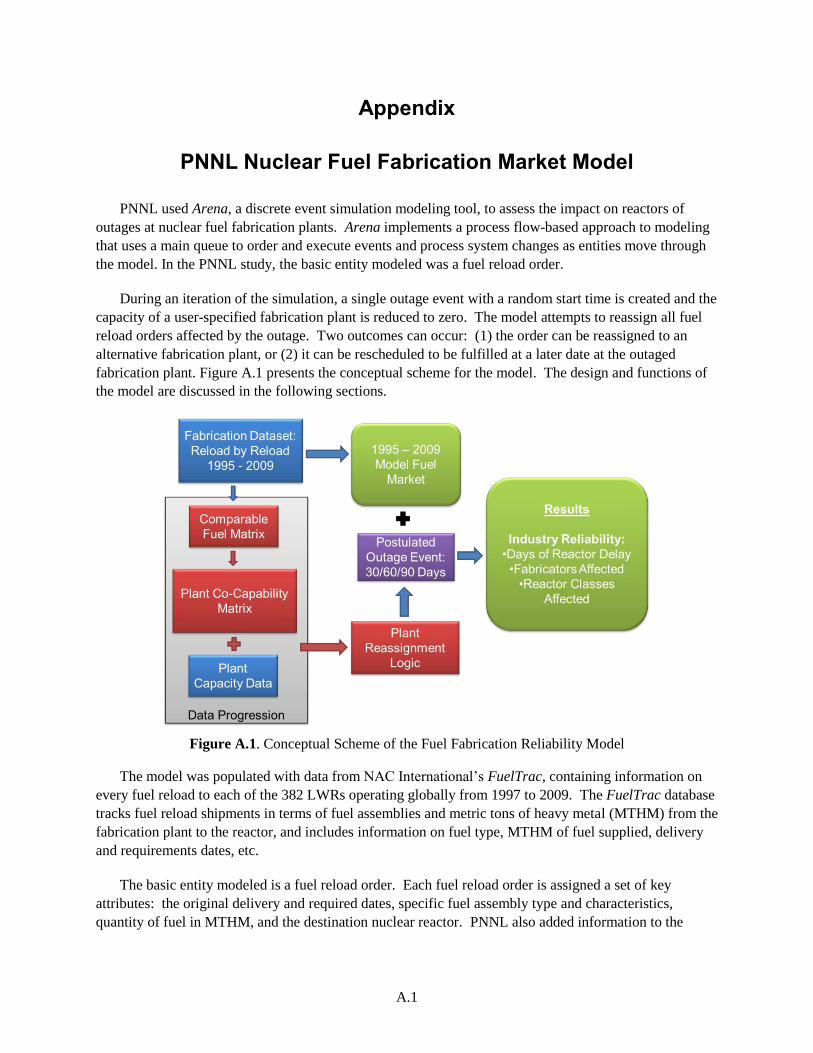
PNNL used Arena, a discrete event simulation modeling tool, to assess the impact on reactors of
outages at nuclear fuel fabrication plants. Arena implements a process flow-based approach to modeling
that uses a main queue to order and execute events and process system changes as entities move through
the model. In the PNNL study, the basic entity modeled was a fuel reload order.
During an iteration of the simulation, a single outage event with a random start time is created and the
capacity of a user-specified fabrication plant is reduced to zero. The model attempts to reassign all fuel
reload orders affected by the outage. Two outcomes can occur: (1) the order can be reassigned to an
alternative fabrication plant, or (2) it can be rescheduled to be fulfilled at a later date at the outaged
fabrication plant. Figure A.1 presents the conceptual scheme for the model. The design and functions of
the model are discussed in the following sections.
Figure A.1. Conceptual Scheme of the Fuel Fabrication Reliability Model
The model was populated with data from NAC International’s FuelTrac, containing information on
every fuel reload to each of the 382 LWRs operating globally from 1997 to 2009. The FuelTrac database
tracks fuel reload shipments in terms of fuel assemblies and metric tons of heavy metal (MTHM) from the
fabrication plant to the reactor, and includes information on fuel type, MTHM of fuel supplied, delivery
and requirements dates, etc.
The basic entity modeled is a fuel reload order. Each fuel reload order is assigned a set of key
attributes: the original delivery and required dates, specific fuel assembly type and characteristics,
quantity of fuel in MTHM, and the destination nuclear reactor. PNNL also added information to the
A.2
database on the design of the destination reactor (e.g., reactor model [Westinghouse three-loop, VVER-
1000, etc.).
A.1 Running the Model
To run the model, the user provides the following inputs:
1. List of fabrication plants against which outage simulations are to be run;
2. Outage duration – 30, 60, 90, or 180 days;
3. Reassignment priority levels to activate (see page A.3);
4. Number of iterations to run per simulation.
The outage start date is set randomly at the outset of each iteration. All fabrication plant functions
are assumed to be lost for the duration of an outage.
A.2 Model Process Flow
The fuel order entity moves through the model by navigating a simple process flow. The fuel order
entity is created at time zero and immediately proceeds to an order pool, where the order is held until 365
days prior to its production start date.1 Once released from the order pool, the fuel order proceeds to the
fabrication plant queue, where the order waits until the scheduled production start date. The order then
proceeds to fuel fabrication, where it is held for 60 days. At the end of 60 days, fabrication is complete.
The order proceeds to a shipping module, where it remains for a period to simulate the time required to
ship the order from the fabrication plant to the destination reactor. At the end of that period, the order
reaches the destination reactor, and fulfillment is complete.
A.2.1 Production Start Date
The production start date is calculated by subtracting the sum of the 60 day fabrication time and the
assumed shipping time from the delivery date. For each order,
Where
= Production start date;
= Delivery date;
= Shipping time, in days.
To simulate shipping time, PNNL calculated the distance between each pair of fabrication plants and
reactors in the database, and constructed a travel time and method matrix. The matrix includes shipping
times for sea, ground, and air transportation modes.
1 Arena uses a continuously running clock for time based events. This model uses a base time unit of a single day.
The initial delivery and required dates are drawn from the historical data set and provide the basis for calculating
delays.
A.3
A.3 Outage Simulation
At some point during each iteration of the simulation an outage event occurs, reducing the capacity of
the specified fabrication plant to zero. Consequently, all affected orders must be reassigned to other
fabrication plants, or rescheduled to be fulfilled at the outaged plant upon restart. When the outage
occurs, the simulation halts and control passes from the main process flow to an order reassignment
optimization module. The reassignment module completes three tasks before returning control to the
main process flow: (1) remove all orders currently under production at the outaged fabrication plant, (2)
remove all additional orders in the fabrication plant assembly queue that are scheduled begin production
during the outage, and (3) reassign all removed orders.
The reassignment module uses a continuously-updating, best-solution search algorithm. Starting with
the order with the earliest originally scheduled delivery date, each order is reassigned on the basis of
fabricator cross-qualification and order fulfillment date. If the module finds an alternative fabrication
plant capable of fabricating the required fuel assembly type and fulfilling the order on or before the
required date, the order is reassigned to that alternative fabrication plant. If the module finds one or more
alternative fabrication plants capable of fabricating the required fuel assembly type, but none of those
alternative plants is capable of fulfilling the order on or before the required date, the module reassigns the
order to the fabrication plant that is able to fulfill the order the soonest. In some cases, this may be the
outaged fabrication plant itself. If the module is unable to find any alternative fabrication plant capable of
fabricating the required fuel assembly type, the order is rescheduled to be fulfilled at the outaged plant
upon restart.
A.3.1 Reassignment Priority Levels
Cross-qualification of alternative fabrication plants is determined on the basis of historical delivery
data and the set of fuel design and reactor model matrices. In the event that one or more alternative
fabrication plants is qualified to fabricate the required fuel assembly type, the module implements an
algorithm that bins the alternative plants according to priority level and searches each bin successively.
At each priority level, each qualified plant’s production schedule is examined to determine capacity for
additional production. If a plant has sufficient additional production capacity to fulfill the order on or
before the required date, the order is reassigned.
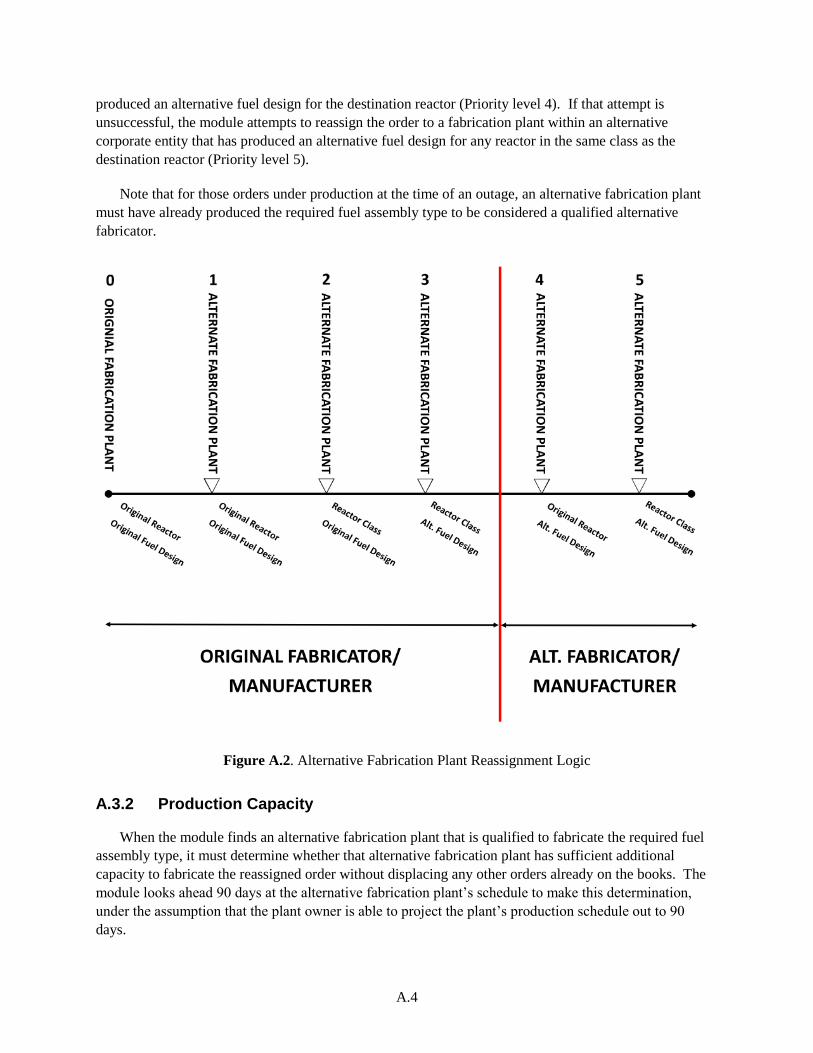
The module, illustrated in Figure A.2, gives first priority to the corporate owner of the outaged
fabrication plant (e.g., Westinghouse, AREVA). First, the module attempts to reassign the order to
another fabrication plant within the same corporate entity as the outaged fabricator that has fabricated the
required fuel assembly type for the destination reactor (Priority level 1). If there is no alternative
fabricator at that priority level capable of fulfilling the order on or before the required date, the module
attempts to reassign the order to another fabrication plant within the same corporate entity that has
fabricated the required fuel assembly type for any reactor in the same class as the destination reactor
(Priority level 2). If that attempt is unsuccessful, the module attempts to reassign the order to another
fabrication plant within the same corporate entity that has fabricated an alternative fuel assembly type for
any reactor in the same class as the destination reactor (Priority level 3).
If these possibilities are exhausted, the module turns to an alternative corporate entity. The module
attempts to reassign the order to a fabrication plant within an alternative corporate entity that has
A.4
produced an alternative fuel design for the destination reactor (Priority level 4). If that attempt is
unsuccessful, the module attempts to reassign the order to a fabrication plant within an alternative
corporate entity that has produced an alternative fuel design for any reactor in the same class as the
destination reactor (Priority level 5).
Note that for those orders under production at the time of an outage, an alternative fabrication plant
must have already produced the required fuel assembly type to be considered a qualified alternative
fabricator.
Figure A.2. Alternative Fabrication Plant Reassignment Logic
A.3.2 Production Capacity
When the module finds an alternative fabrication plant that is qualified to fabricate the required fuel
assembly type, it must determine whether that alternative fabrication plant has sufficient additional
capacity to fabricate the reassigned order without displacing any other orders already on the books. The
module looks ahead 90 days at the alternative fabrication plant’s schedule to make this determination,
under the assumption that the plant owner is able to project the plant’s production schedule out to 90
days.
A.5
In order to perform this evaluation, the module needs the maximum production capacity of the
alternative fabrication plant under consideration. PNNL developed a method for estimating this value for
each fabrication plant, which is shown in the following equations.
Let be a dummy variable, representing whether an order is in production at fabrication plant
at time . Then:
{
Where
= Fabrication plant;
= Fuel reload order in the set of all fuel reload orders belonging to fabrication plant ;
= Date;
= Production start date for order .
Let represent the maximum production capacity, in MTHM, at fabrication plant . Then:
(∑
)
Where
= Last date represented in the FuelTrac database;
= Total number of fuel reload orders belonging to fabrication plant ;
= Size, in MTHM, of order .
For each day represented in the historical fuel delivery data, the function evaluates the sum of all fuel
reload orders under concurrent production at fabrication plant and adds that sum to an array. The
largest sum in the array is assumed to be the maximum capacity for that fabrication plant.
Available production capacity is tracked in a master schedule. Depending on whether an order is
affected by an outage or not, the order will update the master schedule at one or three key points during
each iteration: (1) Between exiting the order pool and arriving at a fabrication plant queue, each order
entity is routed through a sub-module to add its quantity to the master schedule for those days on which
the order will be in production. (2) If an order is affected by an outage, it is routed through a sub-module
to remove the quantity of the order from the master schedule for those days on which production has not
already occurred. (3) Once reassignment of an order is complete, the fuel order entity again adds its
quantity to the master schedule for those days on which remaining production will occur.
A.3.3 Shipping Delays
Shipping represents an additional constraint on an alternative fabrication plant’s ability to fulfill an
order on or before the required date. To account for the additional time that would be required to locate
an alternative fabricator, a flat 7-day delay is imposed on all reassigned orders. Additionally, a delay
equal to the shipping time between the outaged and alternative fabrication plants is imposed to account
for shipment of materials. Even if an alternative fabrication plant is qualified to fabricate the required
fuel assembly type and has sufficient additional production capacity to fabricate the order without
A.6
displacing any other orders already on the books, an order still may not be reassigned to that plant if
shipping delays push the new delivery date beyond the required date.
A.4 Model Outputs
Once an order has been reassigned, the model calculates the number of days delayed against the
original delivery date and the requirement date. The simulation runs to completion after all orders have
been reassigned to an alternative fabrication plant or rescheduled for a later date at the outaged plant.
Each simulation was run for 300 iterations. A number of statistics were output at the conclusion of
each iteration. These statistics, which characterize the impact of the fabrication plant outage, include the
number of reload orders affected, the number of days of delay experienced for each order, and the specific
combination of the fabrication plant and fuel type that were ultimately used to fill the affected orders.
Thousands of iterations were run, providing the basis for the post-simulation statistical analysis.
PNNL-20861
Distribution
No. of No. of
Copies Copies
Distr.1
# Name
Organization
Address
City, State and ZIP Code
# Organization
Address
City, State and ZIP Code
Name
Name
Name
Name
Name (#)
# Name
Organization
Address
City, State and ZIP Code
# Foreign Distribution # Name
Organization
Address
Address line 2
COUNTRY
# Local Distribution
Pacific Northwest National Laboratory
Name Mailstop
Name Mailstop
Name Mailstop
Name Mailstop
Name (PDF)


![[IAEA_2009] Nuclear Fuel Cycle](https://img.pdfslide.us/doc/110x75/54f458884a7959a1318b45c3/iaea2009-nuclear-fuel-cycle.jpg)