Embed Size (px)
Citation preview

i
REDUCTION OF CHANGE OVER TIME APPLYING SMED UNDER LEAN MANUFACTURING: A CASE STUDY
AZIM MOHAMMAD
DEPARTMENT OF INDUSTRIAL AND PRODUCTION ENGINEERING
BANGLADESH UNIVERSITY OF ENGINEERING AND TECHNOLOGY
DHAKA-1000, BANGLADESH.
DECEMBER 2013
ii
REDUCTION OF CHANGE OVER TIME APPLYING SMED UNDER LEAN MANUFACTURING: A CASE STUDY
By
AZIM MOHAMMAD
This thesis submitted to the Department of Industrial and Production engineering, Bangladesh University of Engineering Technology, in partial fulfillment of the requirement for the degree of
Masters of Engineering in Advance Engineering Management.
DEPARTMENT OF INDUSTRIAL AND PRODUCTION ENGINEERING
BANGLADESH UNIVERSITY OF ENGINEERING TECHNOLOGY
DHAKA- 1000, BANGLADESH
DECEMBER, 2013
CERTIFICATE OF APPROVAL
iii
CERTIFICATE OF APPROVAL
The thesis titled “REDUCTION OF CHANGE OVER TIME APPLYING SMED UNDER
LEAN MANUFACTURING: A CASE STUDY” Submitted by Azim Mohammad, Roll. No.
0412082106(F), Session: April 2012 has been accepted as satisfactory in partial fulfillment of the
requirements for the degree of Masters of Engineering in Advance Engineering Management
on December 17, 2013.
BOARD OF EXAMINERS
Chairman Supervisor
Tahera Yesmin Assistant Professor, Department of Industrial and Production Engineering, BUET, BANGLADESH.
Member Dr. Abdullahil Azeem Professor Department of Industrial and Production Engineering, BUET, BANGLADESH.
Member
Dr. Ferdous Sarwar Assistant Professor. Department of Industrial and Production Engineering, BUET, BANGLADESH

iv
CANDIDATE’S DECLARATION
It is hereby declared that this thesis or any part of it has not been submitted elsewhere for the
award of any degree or diploma.
---------------------------- AZIM MOHAMMAD

v
DEDICATION
This thesis is dedicated to my elder brother Arif MD Babu whose tireless encouragement helps me to advance in future.

vi
ACKNOWLEDGEMENT
At the very beginning I would like to express my sincere gratitude to the Almighty whose blessings made me capable of accomplishing this thesis work.
I am greatly indebted to my supervisor Tahera Yesmin, Assistant Professor, Department of Industrial and Production Engineering, BUET for her constant guidance, cordial suggestion, help and care for the completion of the thesis work. Without her continuous attention and care it would never been possible.
I would like to express my gratitude to Dr. Abdullahil Azeem, Professor, Department of IPE, BUET and Dr. Ferdous Sarwar, Assistant Professor, Department of IPE, BUET for their constructive remarks and kind evaluation of this thesis work.
I am also thankful to my brother and classmate Muztoba Ahmad Khan for his help and wholehearted co-operation during thesis and academic work.
In addition, thanks are due to those who helped me directly and indirectly during the different stages of the thesis work.
Finally, I record with deep appreciation the patience, understanding and encouragement shown by my family and friends throughout the period of my study.
Azim Mohammad

vii
ABSTRACT
The basic idea behind lean manufacturing is to eliminate waste, which does not add value to the
end product. Any garments industry can maximize their profit margin by reducing all types of
wastes. Lean manufacturing is one of those activities that focus on cost reduction by eliminating
non-value added activities. This thesis work addresses the application of lean manufacturing
philosophy to the mass production sector with a focus on sewing section of the garments
industry. The core idea behind the thesis work was to introduce lean manufacturing concept in
RMG sector of Bangladesh. In this concern, Single Minute Exchange of Die tools and techniques
have been applied. The Single Minute Exchange of Die (SMED) is one of the important lean
tools to reduce waste and improve flexibility in manufacturing processes allowing lot size
reduction and manufacturing flow improvements. SMED reduces the non-productive time by
streamlining and standardizing the operations for exchange tools, using simple techniques and
easy applications. It provides a rapid and efficient way of converting a manufacturing process
from running the current product to running the next product. This rapid changeover is the key to
reduce production lot sizes and thereby improving flow. There has a great applicability of SMED
method in RMG sector. Several implementations have proven that the SMED method really
works in practice and reductions of changeover time. As RMG sector is a large industrial sector
in Bangladesh; change over time reduction can play a vital role for improving productivity as
well as economic development for the country. It is found that a significant amount of time per
style, per month can be minimized by applying this method. The implementation lean
manufacturing has enabled reduction in setup time, unnecessary task elimination, quality rework
reduction, material and information flow time reduction through company's internal resources
reorganizations without the need for significant investment.
viii
TABLE OF CONTENT
CONTENTS PAGE NO
Acknowledgement vi
Abstract vii
List of Tables xiii
List of Figure xiv
List of Abbreviation xv
CHAPTER ONE: INTRODUCTION
1.1. Introduction 1
1.2. Background of the Thesis 2
1.3. Objectives With Specific Aims and Possible Outcome 3
1.4. Outline of Methodology 3
CHAPTER TWO: LITERATURE REVIEW
2.1. Introduction 4
2.2. Historical Background of Single Minute of Exchange Die (SMED). 5
2.3. Introduction to Lean Manufacturing 6
CHAPTER: THEORITICA BACKGROUND
3.1. Introduction 8
3.2. Lean Manufacturing Definition 8
3.2.1. Five Basic Rules of Lean 9
3.2.2. Toyota Way Fourteen Principles 9

ix
3.2.3. Principles of Lean Manufacturing 11
3.3. Focus on Waste Identification 12
3.4. Lean Tools 17
3.4.1. Value Stream Mapping 17
3.4.2. Work Placeorganization-5S 19
3.4.3. KAIZEN 22
3.4.4. Total Productive Maintenance 24
3.4.5. 5-Why Method 26
3.4.6. Overall Equipment Effectiveness (OEE) 26
3.5. Supporting Lean Tools 29
3.5.1. Quality at the Source 29
3.5.2. Benchmarking 30
3.5.3. Takt Time 31
CHAPTER THREE: PROBLEM IDENTIFICATION & METHODOLOGY
4.1. Introduction 32
4.2. Problem Formulation 32
4.3. Methodology of SMED 33
4.3.1. Changeover Elements Classification 33
4.3.2. SMED Implementation 34
4.3.2.1. Step One – Identify Pilot Area 35
4.3.2.2. Step Two – Identify Elements 36
4.3.2.3. Step Three – Separate External Elements 37
4.3.2.4. Step Four – Convert Internal Elements to External 38
4.3.2.5. Step Five- Streamline Remaining Elements 38
4.3.3. Accelerate Progress – Focus On People First 39

x
CHAPTER FIVE: CASE STUDY (CURRENT STATE ANALYSIS)
5.1. Introduction 41
5.2. Organization Profile 41
5.3. Value Stream Mapping Current Stage 43
5.3.1. Product Family 43
5.3.2. Data Collection with the Help of VSM Log Sheet 45
5.3.3. Data Analysis for Current State 45
5.3.4. Information Flow 48
5.4. Changeover Data 49
5.4.1. Existing Sewing Line Machine Layout 50
5.5. Unnecessary Activities 51
5.6. Quality Rework 52
5.7. Summary of All Types of Waste Minutes 52
CHAPTER SIX: IMPLEMENTATION & RESULT ANALYSIS
6.1. Introduction 54
6.2. Setting up the Lean Family 54
6.3. Role and Responsibility of the Lean Family 55
6.4. Selection of a Pilot Line 57
6.5. Preparation for Changeover 57
6.5.1. Transforming Internal in to External Activities 57
6.5.1. Preparation for Changeover 56
6.5.2. Improvement Internal Activities Minimization 59
6.5.3. External Activities Improvement 60
6.6. Converted Task List 60
6.7. Changeover Style Machine& Operation List 61

xi
6.8. Improved Changeover Time 63
6.9. Unnecessary Task Elimination 63
6.10. Other Lean Tools Effect on VSM 64
6.11. Summary of Result 65
CHAPTER SEVEN: CONCLUSION & RECOMMENDATION
7.1. Conclusion 66
7.2. Recommendation 67
REFERENCES 70-72
APPENDICES 71-73

xii
LIST OF TABLES
TABLES PAGE
Table-3.1: Overproduction cause and impact on organization 13
Table-3.2: Inventory cause and impact on organization 13
Table-3.3: Excess Motion cause and impact on organization 14
Table-3.4: Waiting cause and impact on organization 15
Table- 3.5: Transportation cause and impact on organization 16
Table-3.6: Over processing cause and impact on organization 16
Table-3.7: Non-right first time cause and impact on organization 17
Table-3.8: 5 Why Sample Question 27
Table- 3.9: Losses in OEE 29
Table- 4.1: Elements Classification of SMED 35
Table: 5.1- Product Family Analysis 44
Table.5.2: VSM Current State Data 48
Table-5.3: Information Flow 49
Table-5.4: Changeover Data 50
Table-5.5. Existing Style Man Machine Chart 51
Table-5.6: Unnecessary Activities 52
Table-5.7: Quality Rework Analysis 53
Table-5.8: Summary of All Types of Waste Minutes 53
Table-6.1: Internal & External Elements 61
Table-6.2: New Style Man & Machine Chart 63
Table-6.3: Improved Changeover Time 64
Table-6.4: Unnecessary Activities after Elimination 65
Table- 6.6: Summary of Result 67

xiii
LIST OF FIGURE
FIGURE PAGE
Fig 3.1: Types of Lean Waste 12
Fig. 3.2: Overproduction 13
Fig.3.3: Inventory 14
Fig. 3.4: Excess Motion 14
Fig 3.5: Waiting 15
Fig. 3.6: Transportation 15
Fig. 3.7: Over Processing 16
Fig. 3.8: Not-right first time 17
Fig. 3.9: Lean Building Block 18
Fig.3.10: Typical Value Stream Map 20
Fig. 3.11: 5S Implementation Picture 23
Fig.3.12: OEE Time Frame 28
Fig. 3.13: Benchmarking Process 32
Fig. 4.1: Changeover Outline 36
Fig.4.2: SMED Improvement Area 41
Fig.5.1. Buyer Names 43
Fig. 5.2: Certification 44
Fig.5.3: Product Family 45
Fig.5.4: Current Stage Map for Cutting 46
Fig.5.5: Current Stage Map for Sewing 47
Fig.5.6: Current State Finishing & Car 47

xiv
Fig .5.4: Overall VSM Current State 48
Fig. 5.5: Summary Waste Minute 54
Fig.6.1: Level of Responsibility 55
Fig.6.2: Needle Clamping System 60
Fig.6.3: VSM Future State 66

xv
LIST OF ABBREVIATION
ABBREVIATION ELABORATION
SMED Single Minute Exchange of Die
OEE Overall Equipment Effectiveness
TPM Total Productive Maintenance
SMV Standard Minute Value
S/L Single Needle Machine
O/L Over Lock Machine
F/L Flat Lock Machine
WIP Work In Progress
RMG Ready Made Garments
1
CHAPTER ONE
INTRODUCTION
1.1. INTRODUCTION
The tremendous success of readymade garment exports from Bangladesh over the last two
decades has surpassed the most optimistic expectations. Today the apparel export sector is a
multi-billion-dollar manufacturing and export industry in the country. The overall impact of the
readymade garment exports is certainly one of the most significant social and economic
developments in contemporary Bangladesh. With over one and a half million women workers
employed in semi-skilled and skilled jobs producing clothing for exports, the development of the
apparel export industry has had far-reaching implications for the society and economy of
Bangladesh [1].
One of the major successes of RMG sector in Bangladesh is that they produce goods with low
labor cost. But to maintain this growth in positive direction it is necessary to ensure proper
utilization of every resource. In Today’s competitive world, the most important driver for
success is time; the company that delivers goods with a shorter lead time is the market winner.
Financial growth of any company also depends upon productivity improvement and waste
minimization. So, to gain profit from scarce time and to increase productivity as well as to
minimize waste it is necessary to adopt new manufacturing concepts and technology in every
sector of the garments industry and new business initiatives should be taken in this sector in
order to stay alive in the new competitive market place. Lean manufacturing concepts are widely
used among various countries; lean principle is also implemented among various apparel
industries all over the world. But in Bangladesh, every industry runs in a traditional way, RMG
sector also does not follow any innovative method of production. So the goal of this thesis work
is to introduce lean manufacturing concept in RMG sector of Bangladesh and also to identify
various types of problem related to waste and to picture the existing scenario of the sewing
section by using various types of lean tools. Waste and productivity are the two major issues in
RMG sector of Bangladesh. In this connection, this case study research has been conducted [2].

2
In fact, time demands will be the strategic focus for buyers and suppliers alike for at least the
next decade. Time is the yardstick by which we increasingly judge those we work with,
particularly organizations providing manufacturing services. For apparel manufacturers focusing
on the three key areas of Timeliness, Quality and Cost Effectiveness, it is only through
Continuous Improvement programs – of which Lean is the ultimate system which can survive
and thrive [3].
This thesis aims to reduce changeover time in garments industry by the application of SMED
under lean manufacturing philosophy.
1.2. BACKGROUND OF THE THESIS
Lean manufacturing process is an extensive way to reduce waste from any manufacturing
industry with the help of various types of tools. Single Minute Exchange of Die (SMED) is one
of them to improve flexibility in manufacturing processes as well as to reduce waste. SMED’s
main focus is to classify the works and convert internal works to external works. The ultimate
goal of SMED is to complete any change over activity within single digit minute (up to 9 min)
allowing lot size reduction and manufacturing flow improvements [4].
Today the world has become a global village; business competition crosses the national border.
Every business arena is facing global competition. Survival becomes increasingly difficult and it
becomes more and more critical to find new ways to grow or sustain business. Now producer’s
paramount importance is meeting the ever-shorter lead-time demands of customers and the
garment industry of Bangladesh is not any exception [5].
Readymade garments sector plays a pivotal role in the economy of Bangladesh. About 74% of
the country's foreign currencies are earned by the means of readymade garment exports [6].
Garment manufacturing involves a large amount of processes and lot of change over in various
steps [7]. In order to meet this shorter lead-time and global competition, manufacturing systems
have to adopt new production methods [8].
3
SMED can be quite valuable in optimizing product and process transition in garment
manufacturing industry [9].Its standard implementation procedure under lean manufacturing
techniques can bring a great improvement in productivity and efficiency in garment industry.
1.3. OBJECTIVES WITH SPECIFIC AIMS AND POSSIBLE OUTCOME
The objectives of the study are as follows: i. To develop a guideline to reduce change over time as well as to reduce lead time,
material flow, worker movement and thus to improve overall productivity applying lean
manufacturing technique specifically SMED.
ii. To implement the proposed guideline of reducing change over time to the company
studied.
iii. To compare the proposed guideline with the existing situation.
1.4.OUTLINE OF METHODOLOGY The methodology of the study will be as follows
i. A study will be conducted to find the material movement frequency and subsequent flow
of information of the knitwear garment industry.
ii. Information will be collected from a particular study area on production and changeover
activity.
iii. A standard SMED implementation guideline will be developed with the help of the
collected data.
iv. Proposed SMED guideline will be implemented in the company studied.
v. A comparison between the existing change over time and overall productivity with the
proposed guideline will be carried out.
In this chapter the background, significance, research objectives and the methodology of this
research has been described. Next chapter will discuss on the literature review portion of this
research work.
4
CHAPTER-2
LITERATURE REVIEW
2.1. INTRODUCTION
Lean manufacturing represents a journey that should never end since it involves the
identification and elimination of waste and inefficiencies. It is the continuous improvement of all
operations and processes involved in manufacturing. It seems to imply that there will always be
some waste and inefficiencies, and that better operations or processes will continue to emerge
due to better equipment, newer technological developments and more informed management.
The implementation of Lean production systems has saved many companies millions of dollars
over the last 20 years or so. [10]
Market globalization era enhances the competitive economic situations and demands quicker
supply of new products within short lead-time. Product innovation and production flexibility
become the prime driver in manufacturing industry. In striving to remain competitive, the
concepts of Single minute of exchange die (SMED) have been extremely employed to the
manufacturing system. [11]
Single Minute Exchange of Die (SMED) is one of the many lean production methods for
reducing changeover time in a manufacturing process. It provides a rapid and efficient way of
converting a manufacturing process from running the current product to running the next
product. This rapid changeover is the key to reducing production lot sizes and thereby improving
flow. The phrase "single minute" does not mean that all changeovers and startups should take
only one minute, but that they should take less than 10 minutes (in other words, "single digit
minute"). SMED is the term used to represent the Single Minute Exchange of Die or setup time
that can be counted in a single digit of minutes. SMED is often used interchangeably with
“quick changeover”. SMED and quick changeover are the practice of reducing the time it takes
to change a line or machine from running one product to the next. The need for SMED and quick
changeover programs is more popular now than ever due to increased demand for product
variability, reduced product life cycles and the need to significantly reduce inventories [12].

5
2.2. HISTORICAL BACKGROUND OF SINGLE MINUTE EXCHANGE OF DIE
(SMED).
Taiichi Ohno at Toyota developed SMED in 1950. Ohno’s idea was to develop a system that
could exchange dies in a more speedy way. By the late 1950`s Ohno was able to reduce the time
that was required to change dies from a day to three minutes. The basic idea of SMED is to
reduce the setup time on a machine. There are two types of setups: internal and external. Internal
setup activities are those that can be carried out only while the machine is stopped, while
external setup activities are those that can be done while the machine is running. The basic idea
is to make as many activities as possible from internal to external and also concluded that setup
reduction is a tool, which is universally applicable. There has been lot of work done in detail for
the SMED methodology in a textile processing industry and also suggest that the effective
implementation of SMED necessitates a number of fundamental requirements, these are: team
work, visual factory control, performance measurement, Kaizen and discussed about the role of
manufacturing environment in implementation of SMED. The relationship between changeover
and production leveling has also been studied and concluded that as the batch size decreases, the
cost of each part will increase, since the changeover time will be spread over fewer parts. This
leads to high manufacturing costs when changeover times are high and it also discussed the
detail changeover analysis and concluded that in making a part, every degree of freedom of the
machine must be specified and fixed. SMED is also used, as a tool to improve flexibility and the
greatest benefit from reduction in changeover time is the ability to produce parts in smaller
batches. The relation between SMED and equipment design is also correlated and it indicated
that SMED is suitable not only for manufacturing improvement but also for equipment
development. SMED tool has been successfully used in the pine factory and empirically the
result was reduction in setup time from 45 min to 15 min and underlines the importance of lean
in the application of Information Technology to manufacturing. New modified improvement
framework for lean implementation has also been proposed and lean implementation has been
divided it in to “waves” and put the SMED tool in second wave amongst overall four waves.
Shingo states “SMED can be applied in any factory to any machine”. Work regarding the
application of design changes to the changeover process and balancing of production lines using
the set up minimization [13].

6
2.3. INTRODUCTION TO LEAN MANUFACTURING
U.S manufacturing has always searched for efficiency strategies that help to reduce costs,
improve output, establish competitive position, and increase market share. Early process oriented
mass production manufacturing methods common before second world war shifted afterword
result-oriented, output-focused, production system that control most of today’s manufacturing
business [14].
During II world war, the economic condition of Japan was heavily destroyed. Due to this
there was scarcity of fund resulting in limiting access to corporate finance. In this situation,
neither Toyota was able to set up a mass production system like their American counterparts,
nor it was possible to layoff the employees to reduce their cost due to legislation. Anyhow
Toyota had to devise a new system for reducing costs to sustain in the market. So they
decided to produce a small batch of products, which would reduce inventories; it means they
would need less capital to produce the same product. But this is obstructed by the practical
difficulty of changing tools and production lines frequently. To cope with this problem they
started making multipurpose tooling systems in their machines and trained their employees in
changeover time reduction methods. At the same time, Toyota realized that investing in people
is more important than investing in bigger size machinery and continues employee training
throughout the organization. This motivates all employees and they are more open to the
improvement process and everyone started giving their input to the company.
In this way, short production runs started by Toyota became a benefit rather than a burden, as it
was able to respond much more rapidly to changes in demand by quickly switching production
from one model to another. Toyota didn’t depend on the economies of scale production like
American companies. It rather developed a culture, organization and operating system that
relentlessly pursued the elimination of waste, variability and inflexibility. To achieve this, it
focused its operating system on responding to demand and nothing else. This in turn means it has
to be flexible; when there are changes in demand, the operating system is a stable workforce
that is required to be much more skilled and much more flexible than those in most mass
production systems. Over time, all these elements were consolidated into a new approach to
operations that formed the basis of lean or Toyota Production System or Lean Production [15].
7
The lean manufacturing concept was popularized in American factories. One of the foremost
study by Massachusetts Institute of Technology on the movement from mass production toward
production as described in The machine That changed the world, (Womack, Jones & Roos,
1990), which discussed the significant performance gap between Western and Japanese
automotive industries. This book described the important elements accounting for superior
performance as lean production. The term “lean” was used because Japanese business methods
used less human effort, capital investment floor space materials, and time in all aspects of
operations. The resulting competition between U.S. and Japanese automakers over the last 25
years has led to the adoption of these principles within all U.S. manufacturing businesses [16].
This chapter gives an overall idea about historical background of single minute of exchange of
die and lean manufacturing. It also provides a clear overview about development of lean
manufacturing and integration to wide range or industry. Next chapter will discuss the theoretical
background that will help to understand lean tools and techniques.

8
CHAPTER THREE
THEORITICAL BACKGROUND
3.1. INTRODUCTION
Theoretical background chapter introduces the concrete weapons for this thesis. The term lean
manufacturing is easy to define but implementation is not so easy in real practice. As different
organization has different environment and implementation is not similar at different situation, it
takes some time to understand lean manufacturing. This chapter will clarify all the lean
manufacturing tools & their implementation strategy to provide a brief idea about lean
manufacturing. Most of the texts are obtained from different books and journals; some relevant
thesis works also help in this regard.
This chapter includes different types of lean tools and techniques such as value stream mapping,
5S, Kaizen, quick change over, as well as other relevant tools like mistake proofing (Poka yoke),
total productive maintenance, quality at source, 5-why method which can be applied in any
industry to eliminate excess, unnecessary things to improve the production flow, to reduce
change over time and to achieve better productivity.
3.2. LEAN MANUFACTURING DEFINITION
Lean manufacturing is a systematic approach to identifying and eliminating waste (non-value –
added activities) through continuous improvement by flowing the product at the pull of the
customer in pursuit of perfection [18]. Lean manufacturing process is a comprehensive way to
reduce waste of all types. It could be a waste of time or material; it is still waste [18].
It’s an improvement approach to improve flow and eliminate waste that was developed by
Toyota. Lean is basically about getting the right things to the right place, at the right time, in the
right quantities, while minimizing waste and being flexible and open to change. Its focus is on

9
improving lead times, quality and operating costs and requires employee involvement to be
successful. The lean principles are ways of thinking and acting for an entire organization, not a
tactic or a cost reduction program. Lean is a manufacturing philosophy that shortens the time
between the customer order and the product build shipment by eliminating source of waste.
3.2.1. Five Basic Rules of Lean
i. Specify value from the standpoint of the end customer by product family.
ii. Identify all the steps in the value stream for each product family, eliminating whenever
possible those steps that do not create value.
iii. Make the value-creating steps occur in tight sequence so the product will flow smoothly
toward the customer.
iv. As flow is introduced, let customers pull value from the next upstream activity.
v. As value is specified, value streams are identified, wasted steps are removed, and flow
and pull are introduced, begin the process again and continue it until a state of perfection
is reached in which perfect value is created with no waste.
3.2.2. Toyota Way Fourteen Principles
The 14 principles of Toyota Way are organized in four broad categories [19]
Section I: Long-Term Philosophy
Principle 1: Base your management decisions on a long-term philosophy, even at the expense of
short-term financial goals.
Section II: The Right Process Will Produce the Right Results
Principle 2: Create a continuous process flow to bring problems to the surface.
Principle 3: Uses “pull” systems to avoid overproduction.
Principle 4: Level out the workload (Heijunka). (Work like the tortoise, not the hare.)
10
Principle 5: Build a culture of stopping to fix problems, to get quality right the first time.
Principle 6: Standardized tasks and processes are the foundation for continuous improvement and
employee empowerment.
Principle 7: Use visual control so no problems are hidden.
Principle 8: Use only reliable, thoroughly tested technology that serves your people and
processes.
Section III: Add Value to the Organization by Developing Your People
Principle 9: Grow leaders who thoroughly understand the work, live the philosophy, and teach it
to others.
Principle 10: Develop exceptional people and teams who follow your company’s philosophy.
Principle 11: Respect your extended network of partners and suppliers by challenging them and
helping them improve.
Section IV: Continuously Solving Root Problems Drives Organizational Learning
Principle 12: Go and see for you to thoroughly understand the situation (Genchi genbutsu).
Principle 13: Make decisions slowly by consensus, thoroughly considering all options;
implement decisions rapidly (Nemawashi).
Principle 14: Become a learning organization through relentless reflection (Hansei) and
continuous improvement (kaizen).
It is quite possible to use a variety of TPS tools and still be following only a select few of the
Toyota Way principles. The result will be short-term jumps on performance measures that are
not sustainable. On the other hand, an organization that truly practices the full set of Toyota Way
principles will be following TPS and on its way to a sustainable competitive advantage.

11
3.2.3. Principles of Lean Manufacturing
Key principles behind lean manufacturing can be summarized as follows [20]
1. Identification of Value- In lean production, the value of a product is defined solely by
the customer. The product must meet the customer’s needs at both a specific time and
price. The thousands of mundane and sophisticated things that manufacturers do to
deliver a product are generally of little interest to customers. To view value from the eyes
of the customer requires most companies to undergo comprehensive analysis of all their
business processes. Identifying the value in lean production means to understand all the
activities required to produce a specific product, and then to optimize the whole process
from the view of the customer.
2. Recognition of waste- In this step is to recognize what does and does not create value
from the customer’s perspective. Any material, process of failure which is not required
for creating value from the customer’s perspective is waste and should be eliminated.
This viewpoint is critically important because it helps to distinguish between value and
waste.
3. Standard process- Lean requires an the implementation of very detailed production
guidelines, called standard work, which clearly state the content, sequence, timing and
outcome of all actions by workers .This eliminates variations in the way that workers
performs their tasks.
4. Continuous flow- Lean usually aims for the implementation of continuous production
flow free of bottleneck, interruption, detours, and backflows or waiting. When this is
successfully implemented, the production cycle time can be reduced by as much as 75%.
5. Continuous improvements- The transition to a lean environment is never ending
journey. A continuous improvement mentality is necessary to reach your company’s
goals. The term “continuous improvement” means incremental improvement of products,
processes, or services over time, with the goal of reducing waste to improve workplace
functionality customer service, or product performance. Lean is striving for perfection
and eliminating every day waste which is uncovered in process.

12
6. Perfection- The concept of perfection in lean production means that there are endless
opportunities for improving the utilization of all types of assets. The systematic
elimination of waste will reduce the costs of operating the extended enterprise and fulfills
customer’s desire for maximum value at the lowest price. While perfection may never be
achieved, its pursuit is a goal worth striving for because it helps maintain constant
vigilance against wasteful practice.
7. Customer focus- Customer is the key focus in any business organization. Lean
manufacturing develop a culture for ensuring customer demand with minimum resource
requirements and waste free environment.
3.3. FOCUS ON WASTE IDENTIFICATION
The aim of lean manufacturing is to elimination of waste in every area of production including
customer relations, product design, supplier networks and factory managements. Its goal is to
incorporate less human effort, less inventory, less time to product development and less
changeover time to bring new product from new product family.
Shigeo Shingo identified “Seven” forms of waste (Plus one – The eighth waste, underutilization
of people). “A waste is anything that the customer is not willing to pay for it. Basically eight
types waste is being considered in lean manufacturing” [21]. Typically the types of waste
considered in a lean manufacturing system, their cause and impacts on organization are included:
Fig 3.1: Types of Lean Waste

13
Overproduction: To produce sooner, faster or in greater quantities than the absolute customer
demand. Overproduction can occur with individual processes or across the entire value stream.
Table 3.1: Overproduction cause and impact on Organization
Caused by Impact on Organization
1. MRP push rather than kanban pull
2. Large batch sizes
3. Looks better to be busy!
4. Poor people utilizations
5. Lack of customer focus.
1. Costs of money.
2. Consumes resource ahead of plan
3. Creates inventory
4. Hides inventory/defect problems
5. Space utilization
Fig.3.2: Overproduction
Inventory: This refers to inventory that is not directly required to fulfill current customer orders.
Inventory includes raw materials, work-in-process and finished goods. All types of Inventory
require additional space and handling equipment.
Table 3.2: Inventory cause and impact on organization
Caused by: Impact on Organization:
1.Production schedule not level
2.Inaccurate forecasting
3.Excessive downtime/set up
4.Push instead of pull
1. Add maintenance cost.
2.Extra storage space required
3.Extra resource to manage
4.Hides shortages & defects

14
Fig 3.3: Inventory
Excess Motion: Motion is the movement of “Human or human body parts. This term refers to
the extra steps taken by employees and equipment to accommodate inefficient process layout,
defects, reprocessing, overproduction or excess inventory.
Table 3.3: Excess motion cause and impact on organization
Caused by: Impact on Organization:
1. No standard operating procedure
2. Poor housekeeping
3. Badly designed cell
4. Inadequate training
1. It interrupts production flow.
2. Increases production time
3. Can cause injury
Fig.3.4: Excess Motion
15
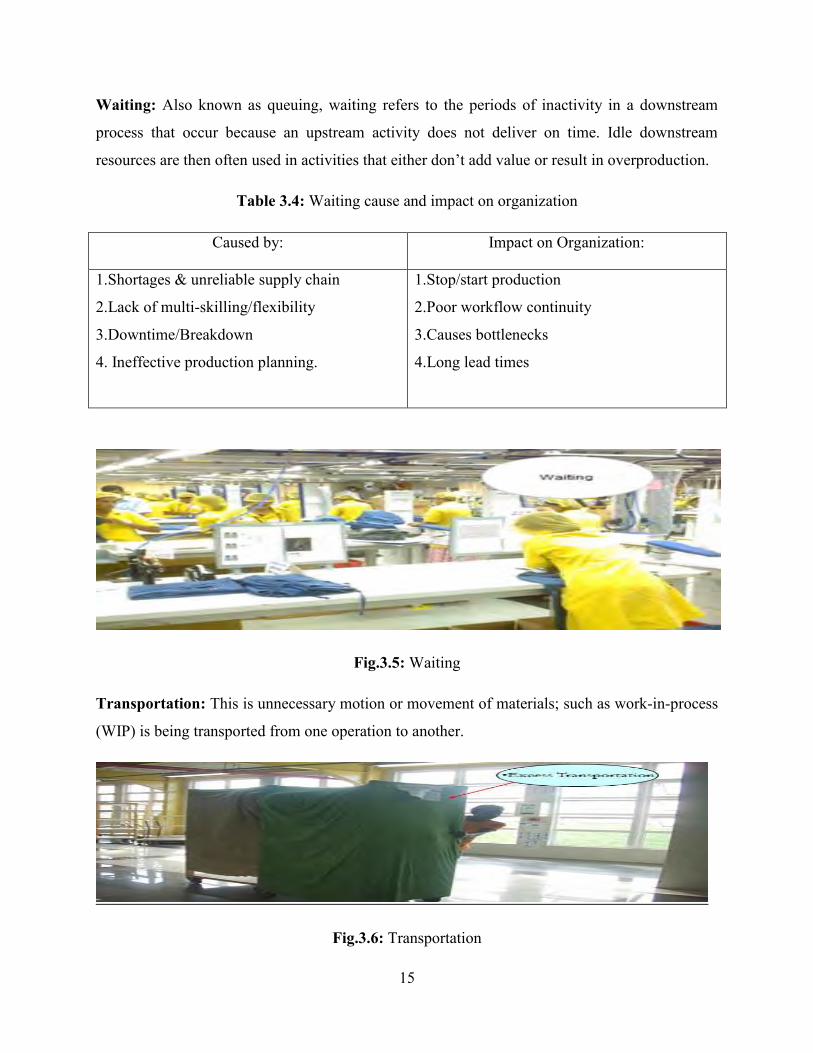
Waiting: Also known as queuing, waiting refers to the periods of inactivity in a downstream
process that occur because an upstream activity does not deliver on time. Idle downstream
resources are then often used in activities that either don’t add value or result in overproduction.
Table 3.4: Waiting cause and impact on organization
Caused by: Impact on Organization:
1.Shortages & unreliable supply chain
2.Lack of multi-skilling/flexibility
3.Downtime/Breakdown
4. Ineffective production planning.
1.Stop/start production
2.Poor workflow continuity
3.Causes bottlenecks
4.Long lead times
Fig.3.5: Waiting
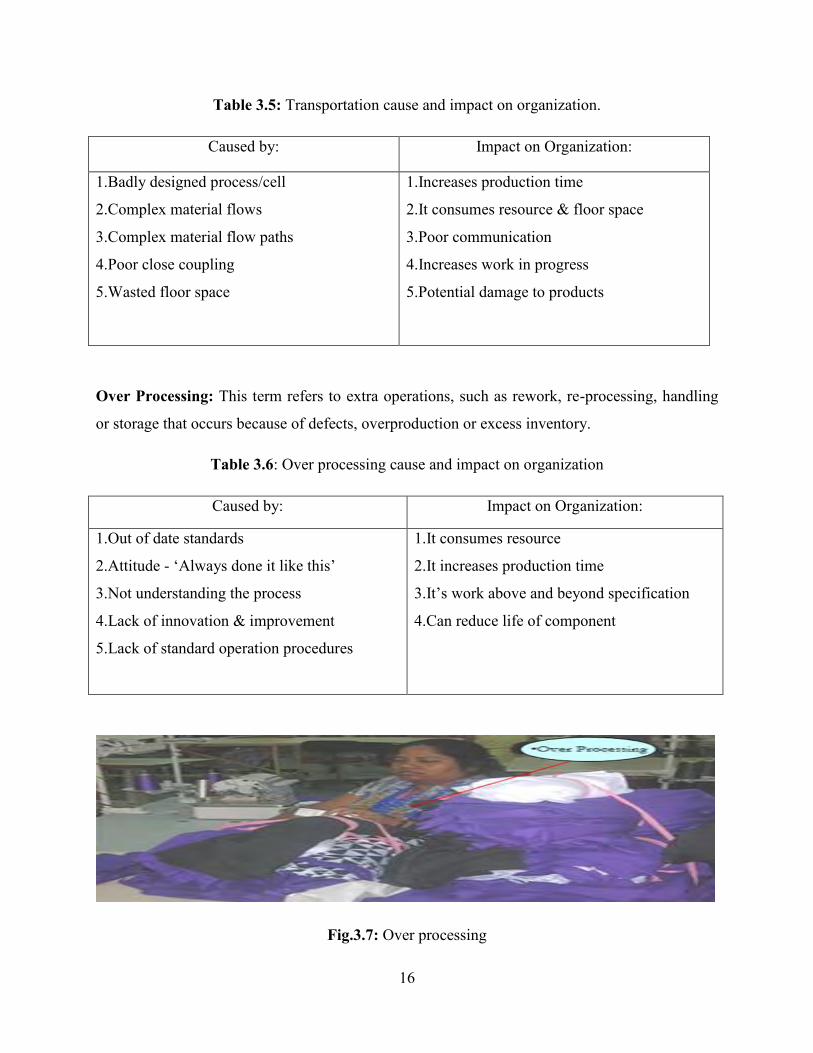
Transportation: This is unnecessary motion or movement of materials; such as work-in-process
(WIP) is being transported from one operation to another.
Fig.3.6: Transportation
16
Table 3.5: Transportation cause and impact on organization.
Caused by: Impact on Organization:
1.Badly designed process/cell
2.Complex material flows
3.Complex material flow paths
4.Poor close coupling
5.Wasted floor space
1.Increases production time
2.It consumes resource & floor space
3.Poor communication
4.Increases work in progress
5.Potential damage to products
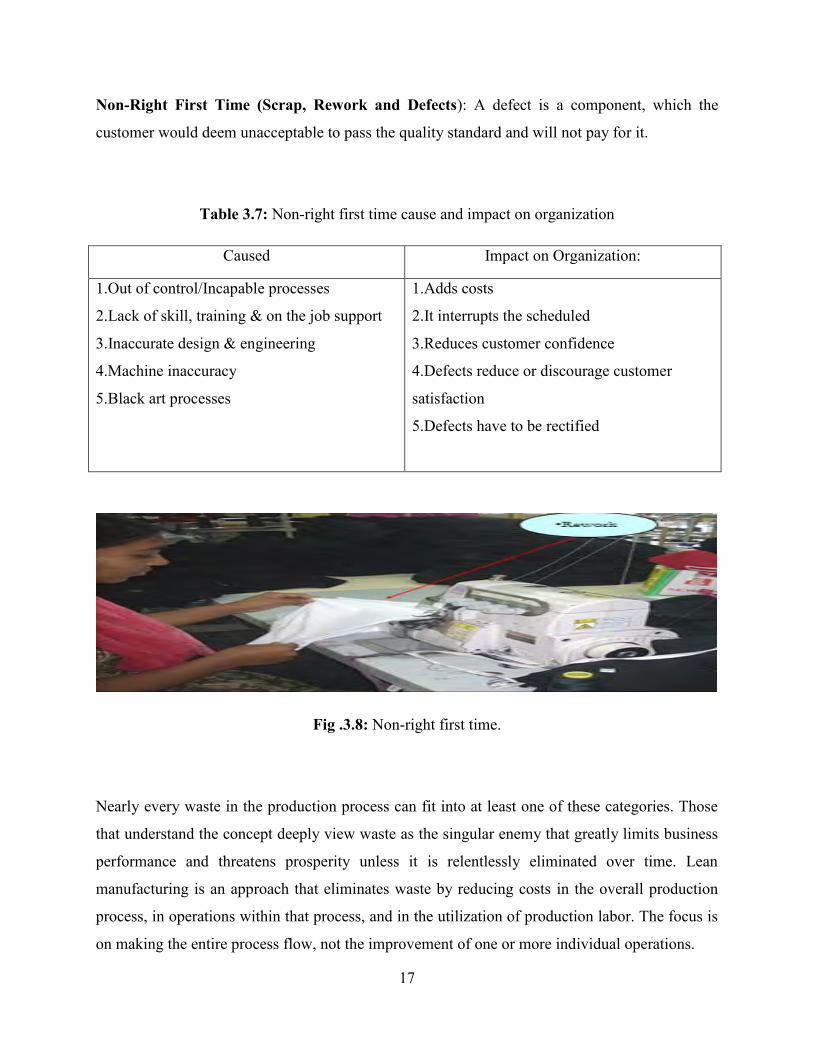
Over Processing: This term refers to extra operations, such as rework, re-processing, handling
or storage that occurs because of defects, overproduction or excess inventory.
Table 3.6: Over processing cause and impact on organization
Caused by: Impact on Organization:
1.Out of date standards
2.Attitude - ‘Always done it like this’
3.Not understanding the process
4.Lack of innovation & improvement
5.Lack of standard operation procedures
1.It consumes resource
2.It increases production time
3.It’s work above and beyond specification
4.Can reduce life of component
Fig.3.7: Over processing
17
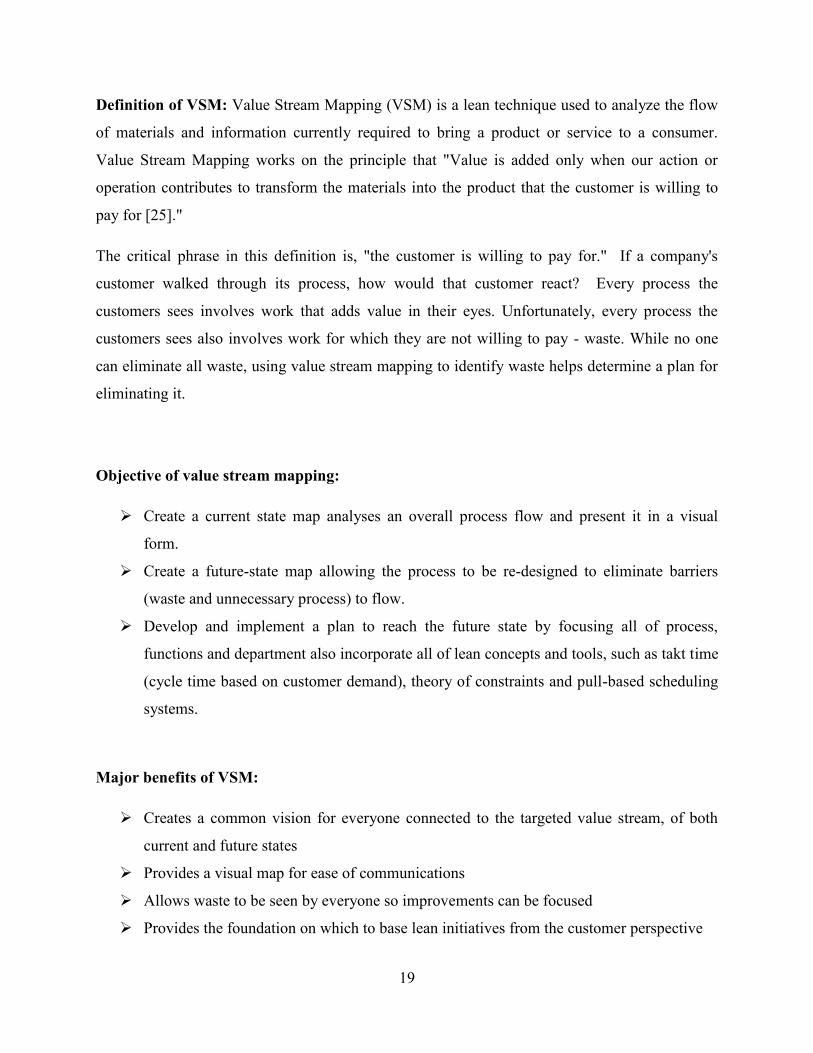
Non-Right First Time (Scrap, Rework and Defects): A defect is a component, which the
customer would deem unacceptable to pass the quality standard and will not pay for it.
Table 3.7: Non-right first time cause and impact on organization
Caused Impact on Organization:
1.Out of control/Incapable processes
2.Lack of skill, training & on the job support
3.Inaccurate design & engineering
4.Machine inaccuracy
5.Black art processes
1.Adds costs
2.It interrupts the scheduled
3.Reduces customer confidence
4.Defects reduce or discourage customer
satisfaction
5.Defects have to be rectified
Fig .3.8: Non-right first time.
Nearly every waste in the production process can fit into at least one of these categories. Those
that understand the concept deeply view waste as the singular enemy that greatly limits business
performance and threatens prosperity unless it is relentlessly eliminated over time. Lean
manufacturing is an approach that eliminates waste by reducing costs in the overall production
process, in operations within that process, and in the utilization of production labor. The focus is
on making the entire process flow, not the improvement of one or more individual operations.

18
3.4. LEAN TOOLS
Lean tools work to precisely define value in terms of specific products with identified
capabilities offered at set prices through a dialogue with their customers. The process involves
learning to adopt and employ a series of tools and techniques to achieve incremental
improvements in an organization.
Lean manufacturing systems are inclusive of all employees and involve a major change in the
embedded attitudes of the individuals that make up the organizations. It is a system, focused on
and drives by the customers, both internal and external [23].
Fig. 3.9: Lean Building Block
3.4.1. Value Stream Mapping
“Material and Information Flow Diagrams” were originally developed by Taiichi Ohno and the
Operations Management Consulting Division of Toyota to help suppliers learn total productive
system (TPS) – visual communication tool able to identify & eliminate waste.
Mike Rother and John Shook adapted Toyota’s techniques and refined this technique into what
we now call “Value Stream Mapping” [24].
19
Definition of VSM: Value Stream Mapping (VSM) is a lean technique used to analyze the flow
of materials and information currently required to bring a product or service to a consumer.
Value Stream Mapping works on the principle that "Value is added only when our action or
operation contributes to transform the materials into the product that the customer is willing to
pay for [25]."
The critical phrase in this definition is, "the customer is willing to pay for." If a company's
customer walked through its process, how would that customer react? Every process the
customers sees involves work that adds value in their eyes. Unfortunately, every process the
customers sees also involves work for which they are not willing to pay - waste. While no one
can eliminate all waste, using value stream mapping to identify waste helps determine a plan for
eliminating it.
Objective of value stream mapping:
Create a current state map analyses an overall process flow and present it in a visual
form.
Create a future-state map allowing the process to be re-designed to eliminate barriers
(waste and unnecessary process) to flow.
Develop and implement a plan to reach the future state by focusing all of process,
functions and department also incorporate all of lean concepts and tools, such as takt time
(cycle time based on customer demand), theory of constraints and pull-based scheduling
systems.
Major benefits of VSM:
Creates a common vision for everyone connected to the targeted value stream, of both
current and future states
Provides a visual map for ease of communications
Allows waste to be seen by everyone so improvements can be focused
Provides the foundation on which to base lean initiatives from the customer perspective

20
Steps of Value Stream mapping:
Current stage map
Future stage map
Implementation plan
Fig.3.10: Typical Value Stream Map
3.4.2. Work Placeorganization-5S
5S methodology is a structured lean program that is implemented in a shared workplace deciding
what should be kept, where it should be kept, and how it should be stored. 5S is a reference to
five Japanese words beginning with "S" that describe 5 primary undertakings for a standardized
cleanup program, to create a workplace suited for visual control and lean production. 5S is a set
of techniques providing a standard approach to housekeeping within Lean.
5S Implementation Methodology:
First pillar: sort
Sort means that we remove all items from the workplace that are not needed for current
production operations. Implementing this pillar creates a work environment in which space,
time, money energy, and other resources can be managed and used most effectively.
21
Example:
Unneeded of equipment, trims and others tools for current production to avoid obstacle to
production activities.
Quality defects result from unneeded in-process inventory and machines breakdown.
Large quantity of inventory requires more space and management
Second pillar: Set in Order
Set in order can be defined as arranging needed items so that they are easy to use and labeling
them so that they are easy to find and put away.
Example:
All trims must be uniquely placed away organized in an identified and organized
place. Rack, Drawers, etc.
Documents, Métal parts as trimes, etc.
Arrange needed items so that they are easy to use and label them so that anyone can find them
and put them away. The second pillar, Set in order can be implemented only when the first pillar
is in place. Similarly, if sorting is implemented without Setting in order, it is much less effective.
Sort and Set in order work best when they are implemented together. Standardization means
creating a consistent way that tasks and procedures are carried out. Set in order is the core of the
standardization. This is because the work place must be orderly before any type of
standardization can be implemented effectively.
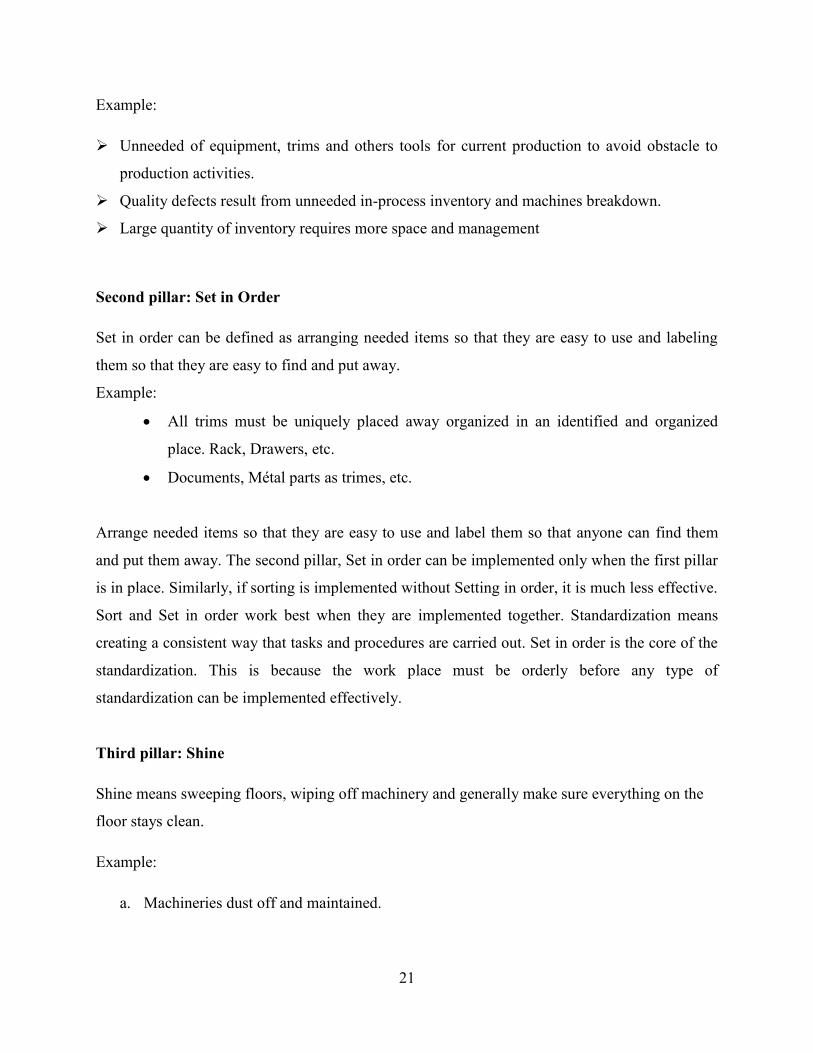
Third pillar: Shine
Shine means sweeping floors, wiping off machinery and generally make sure everything on the
floor stays clean.
Example:
a. Machineries dust off and maintained.
22
b. Floor are free of any object could create obstacles and danger to employees and the
product
It is the component that emphasizes the removal of dirt, grime and dust from the workplace. As
such shine means that we keep everything swept and clean. Having clean and bright environment
everyone can enjoy the working. When everything is kept in top condition, so that when
someone needs to use something, it is ready to be used.
Fourth pillar: Standardize.
The first three pillars are activities to organize the workplace. But standardize is the method to
maintain the first three pillars Sort, Set in order and Shine. Standardize pillar is to prevent
setbacks in the first three pillars, to make implementing them a daily habit, and to make sure that
all three pillars are maintained their fully implemented state.
Implementing 4th Pillar: Standardize
Assign 3S responsibilities: If people are not given clear 3S job assignments based on their
own workplaces, the Sort, Set in order and Shine activities will not have much meaning. 5S
team has to make the 5S checklist showing clearly who is responsible for each job, which
area, what to do, and when to do it.
Integrate 3S Duties into regular work duties: Maintenance of 3S must become a natural part
of everyone’s regular work duties. As we discussed earlier we can launch “5 minutes 5S”
program for every day. It will cover all three pillars (Sort, Set in order and Shine) rather than
just the third. After we have assigned three pillar jobs and have incorporated three pillar
maintenance into the everyday work routine, we need to evaluate how well the three pillars
are being maintained.5S Team has to make the Standardization-level check list to evaluate
the maintenance level.
Fifth pillar: Sustain
Sustain making a habit of properly maintaining correct procedures. The first four pillars can be
implemented without any difficulty if the workplace is where employees commit to sustain the

23
5S conditions. Without sustain the others four pillars will not last longer. Sustain is not a
technique and different than the other four pillar, result cannot be seen.
There are many tools and techniques a factory can use to help sustain commitment to 5S
implementation. Some of them are offered below and 5S team can also develop some tools for
the same purpose.
5S Slogans: Communicate the themes of the five pillar campaign in your factory. They can
be displayed on machines, stickers, flags, or posters.
5S Posters: 5S slogans descriptions of 5S activities can be posted throughout the workplace.
5S Photo: Story board “Picture is worth a thousand words.” Photo exhibits and Story board
showing the before and after of 5S implementation activities.
5S Maps: Can also be used to get employee involved in five-pillar improvement on an
ongoing basis. Those should be hung in a central location with suggestion cards attached so
anyone can suggest improvements.
5S Pocket manuals: Can be created that contains five pillar definitions and descriptions, and
is small enough to fit into the pocket of work clothes
.
Fig.3.11: 5S Implemented Picture

24
3.4.3. Kaizen
Kaizen is a Japanese word means, simply, continuous Improvement
1. Kai = To take part
2. Zen = To make good
Together these words mean to take something apart in order to make it better.
Kaizen is a basic scientific analysis in which you analyze (or take part) the elements of a process
or system to understand how it works. Lean production is founded on the idea of kaizen-the
small improvement has great impact on business result. It focuses on continuous improvement
throughout all aspects of life. When applied to the workplace, Kaizen activities continually
improve all functions of a business, from manufacturing to management and from the CEO to the
kaizen workers. By improving standardized activities and processes, kaizen aims to eliminate
waste [26].
The Basic Principle for Improvement
Throw out all of your fixed ideas about how to do thinks
Think of How the new method will work not how it won’t
Don’t accept excuses. Totally deny the status quo.
Don’t seek perfection. A 50 percent implementation rate is fine as long as it’s done on the
spot.
Correct mistakes the moment they’re found
Don’t spend a lot of money on improvement.
Problems give you a chance to use your brain.
Ask “why” at least five times until you find the ultimate cause.
Improvement knows no limit
Kaizen Event: Kaizen events are artificial groups set up to address single subject / area. They
are usually one time only affaires. Kaizen events or blitzes can be held periodically to make
focused changes in the workplace that affect the affect the whole team simultaneously and which
25
require production at that area possibly shut down while changes is made. A kaizen event must
be carefully prepared, well-coordinated, and thoroughly followed-up in order to be successful.
Kaizen Event typically is measurable and last one week. Sometimes events are planned for
shorter periods – a half day. One day up to 3 days. There events focus more narrowly and less
planning required.
Kaizen blitz is a tool of which lean manufacturers can use over and over again, but it should
never be used as the only vehicle for continuous improvement. The transition to a lean
environment does not occur overnight. A continuous improvement mentality is necessary to
reach your company’s goal. The term Continuous improvement means incremental improvement
of product process or services over time with the goal of reducing waste to improve workplace
functionally, customer service or product performance. Continuous improvement principle as
practiced by the most devoted manufacturers; result in astonishing improvements in performance
that competitors find nearly impossible to achieve.
3.4.4. Total Productive Maintenance (TPM):
Total productive maintenance (TPM) originated in Japan in 1971 as a method for improved
machine availability through better utilization of maintenance and production resources. TPM is
a maintenance process developed for improving productivity by making processes more reliable
and less wasteful. TPM is an extension of TQM (Total Quality Management). The objective of
TPM is to maintain the plant or equipment in good condition without interfering the daily
process. To achieve this objective, preventive and predictive maintenance is required. By
following the philosophy of TPM we can minimize the unexpected failure of the equipment [27].
The goal is the total elimination of all losses, including breakdowns, equipment setup and
adjustment losses, idling and minor stoppages, reduced speed, defects and rework, spills and
process upset conditions, and startup and yield losses. The ultimate goals of TPM are zero
equipment breakdowns and zero product defects, which lead to improved utilization of
production assets and plant capacity.

26
Organizations typically pursue the four techniques below to implement TPM. Kaizen events can
be used to focus organizational attention on implementing these techniques.
Efficient Equipment: The best way to increase equipment efficiency is to identify the losses,
among the six described above, that are hindering performance. To measure overall equipment
effectiveness, a TPM index, Overall Equipment Effectiveness (OEE) is used. OEE is calculated
by multiplying (each as a percentage), overall equipment availability, performance and product
quality rate. With these figures, the amount of time spent on each of the six big losses, and where
most attention needs to be focused, can be determined. It is estimated that most companies can
realize a 15-25 percent increase in equipment efficiency rates within three years of adopting
TPM.
Effective Maintenance: Thorough and routine maintenance is a critical aspect of TPM. First and
foremost, TPM trains equipment operators to play a key role in preventive maintenance by
carrying out "autonomous maintenance" on a daily basis. Typical daily activities include
precision checks, lubrication, parts replacement, simple repairs, and abnormality detection.
Workers are also encouraged to conduct corrective maintenance, designed to further keep
equipment from breaking down, and to facilitate inspection, repair and use. Corrective
maintenance includes recording the results of daily inspections, and regularly considering and
submitting maintenance improvement ideas.
Mistake-Proofing: Known as poka-yoke1 in lean manufacturing contexts, mistake-proofing is
the application of simple "fail-safing" mechanisms designed to make mistakes impossible or at
least easy to detect and correct. Poka-yoke devices fall into two major categories: prevention and
detection. A prevention device is one that makes it impossible for a machine or machine
operator to make a mistake. For example, many automobiles have "shift locks" that prevent a
driver from shifting into reverse unless their foot is on the brake. A detection device signals the
user when a mistake has been made, so that the user can quickly correct the problem. In
automobiles, a detection device might be a warning buzzer indicating that keys have been
inadvertently left in the ignition.

27
Safety Management: The fundamental principle behind TMP safety and environmental
management activities is addressing potentially dangerous conditions and activities before they
cause accidents, damage, and unanticipated costs. Like maintenance, safety activities under TPM
are to be carried out continuously and systematically. Focus areas include the development of
safety checklists (e.g., to detect leaks, unusual equipment vibration, or static electricity) the
standardization of operations (e.g., materials handling and transport, use of protective clothing,
etc.) and coordinating no repetitive maintenance tasks (e.g., especially those involving electrical
hazards, toxic substances, open flames, etc.). In many cases, equipment can be modified (see
mistake-proofing) to minimize the likelihood of equipment malfunction and upset conditions.
3.4.5. Why Method
The 5 whys is a simple problem-solving technique that helps to get to the root of a problem
quickly. It is made popular in the 1970s by the Toyota Production System, the 5 Whys strategy
involves looking at any problem and asking: "why?" and "what caused this problem?" [28]
Benefits of the 5 Whys include-
It helps you to quickly determine the root cause of a problem.
It's simple, and easy to learn and apply
Table 3.8: Sample 5 Why Method
Problem 1st Why 2nd Why 3rd Why 4th Why
Stain marks at
the garment
Why stains mark
at the garment?
Marking ink
cannot remove.
Machine makes
dirt marks.
Operator makes
dirt marks.
Why marking
ink used for the
garment?
Cannot identify
the place to
attach the
pocket?
Why cannot
identify?
Because proper
method is defined.
Why no proper
method defined?
Because Nobody
improves the
methods.
28
3.4.6. Overall Equipment Effectiveness (OEE)
OEE is simple, practical and powerful. It takes the most common sources of manufacturing
productivity losses and places them into three categories: availability, performance and quality.
In doing so, it distills complex production data into simple understandable metrics that provide a
gauge for measuring true manufacturing efficiency. It also forms the foundation for tools that
help to improve productivity.
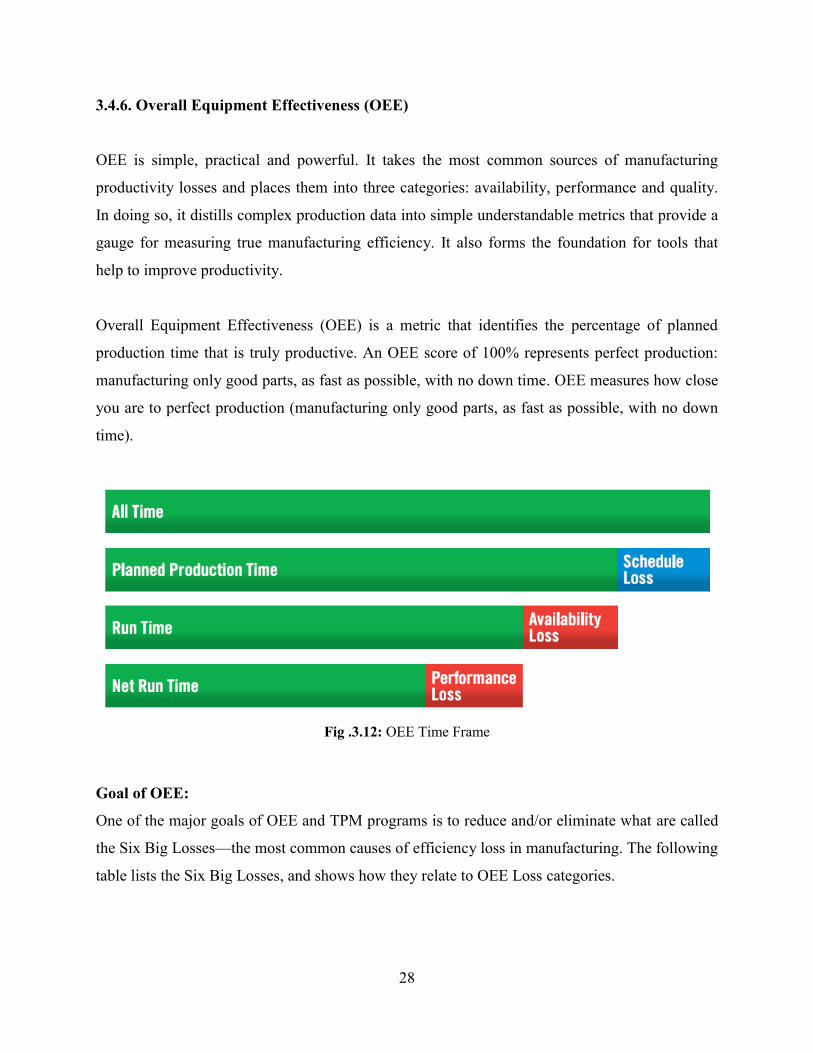
Overall Equipment Effectiveness (OEE) is a metric that identifies the percentage of planned
production time that is truly productive. An OEE score of 100% represents perfect production:
manufacturing only good parts, as fast as possible, with no down time. OEE measures how close
you are to perfect production (manufacturing only good parts, as fast as possible, with no down
time).
Fig .3.12: OEE Time Frame
Goal of OEE:
One of the major goals of OEE and TPM programs is to reduce and/or eliminate what are called
the Six Big Losses—the most common causes of efficiency loss in manufacturing. The following
table lists the Six Big Losses, and shows how they relate to OEE Loss categories.

29
Table 3.9: Losses in OEE
SIX BIG LOSS
CATEGORIE
S
OEE LOSE EVENT EXAMPLE NOTE
Breakdowns Down time
Loss
-Tooling Failure.
-Unplanned
Maintenance.
-Equipment Failure
There is flexibility on where to set
the threshold between a breakdown
and small stop.
Setup and
Adjustment
Down time
Loss
-Setup/Changeover.
-Mental shortages
-Operator shortages.
-Warm-up time
One way to address this lose is
through setup time reduction
programs (SMED)
Small Stop
Speed Lose -Obstructed Flow
- Component jams.
-Miss feeds
-Sensor blocked
- Cleaning/Checking
Typically only includes setups that
are under five minutes and that do
not require maintenances personal.
Reduce speed Speed Lose -Rough running.
-Under nameplate
capacity
-Equipment Wear
-Operator inefficiency
Anything only keeps the process
from running at its theoretical
maximum speed for a given
product.
Startup Rejects Quality Lose -Scrap
-Rework
-In Process damage
- Incorrect assembly
Rejects during warm-up startup or
other early production. May be due
to improper setup, warm-up
period.
Production
Rejects
Quality Lose Scrap
-Rework
-In Process damage
- Incorrect assembly
Rejects during steady state
production.
30
Benefits:
In the short term, OEE identifies the total opportunity for improvement sometimes referred to
as "uncovering the hidden factory" for a given piece of equipment Core process.
In the long term, OEE helps you drive improvement through a better understanding of losses. It
also provides an objective way to set improvement targets and track progress towards reaching
those targets.
3.5. SUPPORTING LEAN TOOLS
3.5.1. Quality at the Source
Quality at the source is a lean manufacturing principle which defines that quality output is not
only measured at the end of the production line but at every step of the productive process and
being the responsibility of each individual who contributes to the production or on time delivery
of a product or service. In a practical sense it would involve each operator checking his or her
own work before the part/component or product is sent to the next step in the process. This
practice when first implemented within the workforce will be a challenging change to company
culture but will highlight the relevance of the product's or service's conformance to customer
requirements and standards, thus also imparting the importance of quality standards and
customer satisfaction within the workforce [29].
Implementing quality at the source
In order to make the cultural shift within an operation's workforce to embrace quality at the
source the following items should be considered:
Employee understanding of who the customer is and their requirements
Internal quality audits -Employee and team awareness of quality standards and
benchmarks
Employee understanding of the customer's intended use of the product or service
Multi-skilled workforce which can provide support and help in different process steps

31
Required tools and technology to identify quality flaws and rectify them in an efficient
manner
Proper data collection and tracking of quality faults
Open communication of standards, performance and processes
The advantages of quality at the source are many, including: better informed employees, cultural
awareness of the importance of quality to the customer, reduction in rework expenses, reduction
in production waste, improvement in plant and process OEE , and most importantly he
empowerment of employees in achieving the desired quality standard required by customers.
3.5.2. Benchmarking
Benchmarking is the comparative evaluation of technologies, production processes and products
of an organization, compared to the leading European organizations in the same market. The
results of benchmarking include an understanding of the weaknesses of any corporation or
organization as well as the ability to measure accurately the limits of its improvement.
Benchmarking also paves the way for other methods of innovation development to be applied,
such as creativity, technology clinics, Business Process Reengineering (BPR), chain-of-
production management, e-commerce, etc.
Procedure of Benchmarking:
The overall procedure involves five steps:
Data Collection from the corporation / organization.
Entering the data into the Best Practice database and compiling the evaluation diagrams.
Composing the evaluation report based on results and diagrams from the database.
Discussing the evaluation's results with the corporation / organization and with experts, in
order to explore new solutions.
Stating proposals for improvement and applying innovation methods.

32
Fig. 3.13: Benchmarking Process.
3.5.3. Takt Time
Takt Time can be defined as the maximum time allowed producing a product in order to meet
demand. It is derived from the German word taktzeit that translates to clock cycle, beat or tempo.
There is a logic therefore to setting the pace of production flow to this Takt Time. Product flow
is expected to fall within a pace that is less than or equal to the Takt Time. In a lean
manufacturing environment, the pace time is set equal to the Takt Time. If you have a Takt Time
of two minutes that means every two minutes a complete product, assembly or machine is
produced off the line. Every two hours, two days or two weeks, whatever your sell rate is your
Takt Time. It is used to synchronize the pace of production to match the pace of sales by
determining the rate for producing a product and its components, based on sales rate.
Takt Time is calculated by taking available production time and dividing it by the customer
demand as shown below:
33
Where
T = Takt time, e.g. [work time between two consecutive units]
Ta = Net time available to work, e.g. [work time per period]
Td = Time demand (customer demand), e.g. [units required per period]
Net available time is the amount of time available for work to be done. This excludes break times and any expected stoppage time (for example scheduled maintenance, team briefings).
When the order volume increases or decreases, Takt Time must be adjusted so that production
and demand are synchronized. To avoid muda, the entire production sequence should run
precisely to Takt Time.
This chapter defines lean manufacturing; differentiate value & waste, lean tools and techniques
and supporting tools of lean manufacturing. The detail SMED implementation procedure is
described in next chapter.

34
CHAPTER FOUR
PROBLEM IDENTIFICATION & METHODOLOGY
4.1. INTRODUCTION
Single-Minute Exchange of Die (SMED) is one of the many lean production methods for
reducing waste in a manufacturing process that has a great impact of any manufacturing
industries such as garment manufacturing industry. In Bangladesh garment industry carries
maximum growth of whole economic development but most of them are lacking behind to a
great extent in concern of productivity, efficiency, customer satisfaction level etc. To cover up
some of these lacking, a standardized process of minimizing change over time to increase
productivity, efficiency, customer service level and profit via waste elimination must be
developed. Today’s garment sector is continuously reaching in highly competitive environment
of fashion and technology to fill the customer satisfaction where lean manufacturing tools have a
great excellence [29].
SMED has a lot of other effects, which come from systematically looking at operations; these
include stockless production, inventory freeing floor space, reduction of production time,
elimination of setup error and setup time and elimination of unusable stock.
4.2. PROBLEM FORMULATION
Garments manufacturing system is a technological process of making a complete part by
arranging several man and machine according to some sequential operations where are obliged
by some terms and conditions to maintain the customer satisfactory level and quality. When
manufacturing large-scale products, some of the internal and external elements and tool
exchanges take place where changeover time always plays a vital role for slow production. A
rapid changeover is widely acknowledged as an essential prerequisite to flexible and responsive
production. The SMED system is a method that make possible to perform equipment setup and
changeover operations within 10 minutes.

35
4.3. WORK STEPS IN IMPLEMENTING SMED
Working steps in implementing SMED will be as follows:
Changeover Elements Classification.
Step One – Identify Pilot Area
Step Two – Identify Elements
Step Three – Separate External Elements
Step Four – Convert Internal Elements To External
Step Five – Streamline Remaining Elements
4.3.1. Changeover Elements Classification
In SMED, changeover elements are divided in to two categories.
An external activity involves operations that can be done while the machine is running
and before the changeover process begins.
Internal Elements are those that must take place when the equipment is stopped. Aside
from that, there may also be non-essential operations.
Table 4.1: Elements Classification of SMED
External Elements Internal Element
Pre-Production Meeting.
Provision of trim card.
Getting cut panel from cutting section.
Getting threads & accessories from store.
Getting instruction about new style from
supervisors.
Provision of Layout and line balancing sheet.
Provision of production sheet.
Getting instruction for next job.
Getting material for the next job from stores.
Getting tools for the next job from tool stores.
Returning tools for the last job to tool stores.
Layout preparation
Trial production
Cleaning Machine surface
Cleaning work surface
Needle change
Stitch adjustment
Stitch measurement
Guide adjustment
Nose change
Looper adjustment
Tension adjustment
Thread change
Needle positioning

36
4.3.2. SMED Implementation This section provides a step-by-step roadmap for a simple and practical SMED implementation.
SMED projects have three conceptual stages:
Separate- Internal & External elements
Convert- Modify elements so they can be external, or remove them completely and
Streamline- Complete elements within standard time.
This process is typically repeated in multiple passes, where a goal for each pass is to cut the
changeover time in half.
Fig .4.1: Changeover outline.
Before Starting
Virtually every manufacturing company that performs changeovers can be benefitted from
SMED. That does not mean, however, that SMED should be the first priority. In the real world,
companies have finite resources, and those resources should be directed to where they will
generate the best return. Most companies, the first priority should be ensuring that there is a clear
understanding of where productive time is being lost, and that decisions on improvement
initiatives are made based on hard data. That means putting a system in place to collect and
analyze manufacturing performance data. Once a system for measuring manufacturing

37
performance is in place collect data for at least two weeks to gain a clear picture of where
productive time is being lost.
If Changeovers represent a significant percentage of lost productive time (e.g. at least 20%)
consider proceeding with a SMED program. Otherwise, consider first focusing on a Total
Productive Maintenance program.
4.3.2.1. Step One – Identify Pilot Area
In this step, the target area for the pilot SMED program is selected. The ideal equipment will
have the following characteristics:
The changeover is long enough to have significant room for improvement, but not too long as
to be overwhelming in scope (e.g. a one hour changeover presents a good balance).
There is large variation in changeover times (e.g. changeover times range from one to three
hours).
There are multiple opportunities to perform the changeover each week (so proposed
improvements can be quickly tested).
Employees familiar with the equipment (operators, maintenance personnel, quality assurance,
and supervisors) are engaged and motivated.
The equipment is a constraint/bottleneck – thus improvements will bring immediate benefits.
If constraint equipment is selected, minimize the potential risk by building temporary stock
and otherwise ensuring that unanticipated down time can be tolerated.
In order to create a wide base of support for the SMED project, include the full spectrum of
associated employees in the selection process, and work hard to create a consensus within the
team as to the target equipment choice. Once the target equipment has been selected, a baseline
time for the changeover should be recorded. Changeover time is measured as the time between
production of the last good part (at full speed) and production of the first good part (at full
speed). Be cognizant of the “Hawthorne Effect”; changeover times may temporarily improve as a
simple result of observing the process. When possible, use prior data to baseline the changeover
time.
38
4.3.2.2 Step Two – Identify Elements
In this step, the team works together to identify all of the elements of the changeover. The most
effective way of doing this is to videotape the entire changeover and then work from the
videotape to create an ordered list of elements, each of which includes:
Description- What work is performed in entire process.
Cost in Time - How long the element takes to complete.
Some useful tips for this step:
A typical changeover will result in 30 to 50 elements being documented.
A fast method of capturing elements is to create a series of post-it notes that are stuck to a
wall in the order in which they are performed during the changeover.
Be sure to capture both “human” elements (elements where the operator is doing
something) and “equipment” elements (elements where the equipment is doing
something). As discussed later, the human elements are usually easiest to optimize.
While videotaping the changeover have several observers taking notes. Sometimes the
observers will notice things that are missed on the videotape.
Only observe – let the changeover take its normal course.
The deliverable from this step should be a complete list of changeover elements, each with a
description and time “cost”.
4.3.2.3. Step Three – Separate External Elements
In this step, elements of the changeover process that can be performed with little or no change
while the equipment is running are identified and moved “external” to the changeover (i.e.
performed before or after the changeover). It is not unusual for changeover times to be cut nearly
in half with this step alone.
Examples of candidate elements for such treatment include:
1. Retrieval of parts, tools, materials, and/or instructions.
2. Inspection of parts, tools, and/or materials.

39
3. Cleaning tasks that can be performed while the process is running.
4. Quality checks for the last production run.
The deliverable from this step should be an updated list of changeover elements, split into three
parts: External Elements (Before Changeover), Internal Elements (During Changeover), and
External Elements (After Changeover).
4.3.2.4. Step Four – Convert Internal Elements to External
In this step, the current changeover process is carefully examined, with the goal of converting as
many internal elements to external as possible.
This list should be prioritized so the most promising candidates are acted on first.
Fundamentally, this comes down to performing a cost/benefit analysis for each candidate
element:
Cost as measured by the materials and labor needed to make the necessary changes.
Benefit as measured by the time that will be eliminated from the changeover.
Once the list has been prioritized work can begin on making the necessary changes.
Examples of techniques that can be used to convert internal elements to external are:
Prepare parts in advance (e.g. preheat dies in advance of the changeover)
Use duplicate jigs (e.g. perform alignment and other adjustments in advance of the
changeover)
Modularize equipment (e.g. replace a printer instead of adjusting the print head so the
printer can be configured for a new part number in advance of the changeover)
Modify equipment (e.g. add guarding to enable safe cleaning while the process is
running)
The deliverable from this step should be an updated list of changeover elements, with fewer
internal elements, and additional external elements (performed before or after the changeover).

40
4.3.2.5. Step Five – Streamline Remaining Elements
In this step, the remaining elements are reviewed with an eye towards streamlining and
simplifying so they can be completed in less time. First priority should be given to internal
elements to support the primary goal of shortening the changeover time. As in the previous step a
simple cost/benefit analysis should be used to prioritize action on elements.
Examples of techniques that can be used to streamline elements are:
1. Eliminate bolts (e.g. use quick release mechanisms or other types of functional clamps)
2. Eliminate adjustments (e.g. use standardized numerical settings; convert adjustments to
multiple fixed settings; use visible centerlines; use shims to standardize die size)
3. Eliminate motion (e.g. reorganize the work space)
4. Eliminate waiting (e.g. make first article inspection a high priority for QA)
5. Standardize hardware (e.g. so fewer tools are needed)
6. Create parallel operations (e.g. note that with multiple operators working on the same
equipment close attention must be paid to potential safety issues)
7. Mechanize (normally this is considered a last resort)
The deliverable from this step should be a set of updated work instructions for the changeover
(i.e. creating standardized work) and a significantly faster changeover time!
4.3.3. Accelerate Progress – Focus On People First
When implementing SMED it is helpful to recognize that there are two broad categories of
improvement:
1. Human (achieved through preparation and organization)
2. Technical (achieved through engineering)
Experience has taught that the human elements are typically much faster and less expensive to
improve then the technical elements. In other words, the quick wins are usually with the human
elements. Avoid the temptation, especially with technically proficient teams, to over-focus on
technical elements. Instead, focus first on the human elements [30]

41
The following chart illustrates this principle, showing example areas of opportunity for SMED projects.
Fig 4.2: SMED Improvement Area.
This chapter described problem identification and methodology of SMED implementation steps
in garments industry. If one organization wants to practice quick changeover methodology then
it will guide them on how to implement SMED. In the next chapter case study on a particular
garment factory will be described.
42
CHAPTER FIVE CASE STUDY (CURRENT STATE ANALYSIS)
5.1. INTRODUCTION
Lean assessment process is used as a getting started to identify the wastes that block corporate
performance and financial growth. The assessment should be both qualitative and quantitative
and should cover all eight types of wastes in lean transformation. This will make a clear idea
about information and material flow along the various processes of an organization and also will
provide a qualitative feedback which is essential to transform a traditional organization into lean
culture based one.
The study was carried in MASCO group a leading garment factory of Bangladesh to design a
proper SMED guideline for the sewing section of the respective company. However the study
includes data from the others sections like cutting, packing and cartooning and finishing sections
of the factory
5.2. ORGANIZATION PROFILE
Bangladesh is one of the largest ready-made garments exporters in the world where MASCO
group is playing a vital role .It started its journey as a ready-made garments exporter from June
2001. Now it’s a vertically set up knit composite factory with all in-house facilities of knitting,
sewing, placement printing, embroidery and laundry.
MASCO group is now a well-equipped company having modern machineries in all the
departments to ensure the best support to suite the taste of all customers.
Mission – Improvement in all time that brings sustainable development, where we prefer good
thinking, better practice and best output.
Vision – Cope up us with 21st century’s change along with neo-invention make a timetable
social business environment as well as help to remove the unemployment problem.
43
Strategies – MASCO believes that development is a never ending process. Therefore it takes
special care to improve all every steps and appreciates all innovation ideas for customers and
employees welfare.
Policies – MASCO fosters a belief in long term relationship ethics with the customers and
considers them as business partners. MASCO is a compliant company and strives hard to uphold
its commitments to consumers.
Decisions – We believe that “commitment is our first choice “and according this, improvement is
happening every day in everywhere at MASCO.
Actions –MASCO takes all its actions in SMART (specific, measurable, achievable, realistic and
time scale) way.
MASCO group total workforce consists of 10000 employees of whom 8500 are directly involved
in the manufacturing process over 75 production lines in eight production unit.
Masco group produce range of knitwear as styling depends on market requirements and orders
availability. Their core competency relies on knitted garments. They represent world renowned
buyer.
.
Fig 5.1: Buyer Names

44
ACCREDITATION
Fig 5.2: Certification
5.3. VALUE STREAM MAPPING - CURRENT STAGE
5.3.1. Product Family
Masco Group offer varied products and services like T-shirt, polo, cargo etc. It is relatively easy
to make product family by constructing a simple table, like below one. The goal is not only to
identify all product families, but also to identify what process steps each product utilizes. This
will be a living, breathing table, so a project team should be prepared to make further revisions
as it dives deeper into its analyses.
Table 5.1: Product family Analysis
Categorizing Product Family
Factory Masco Knitwear
Ltd.
Enter a cycle time per
unit inside the cells
under each
manufacturing stage
Product family is group of
different type of product sharing
same route (Manufacturing
stages) or machineries
Champion Mr Hamid
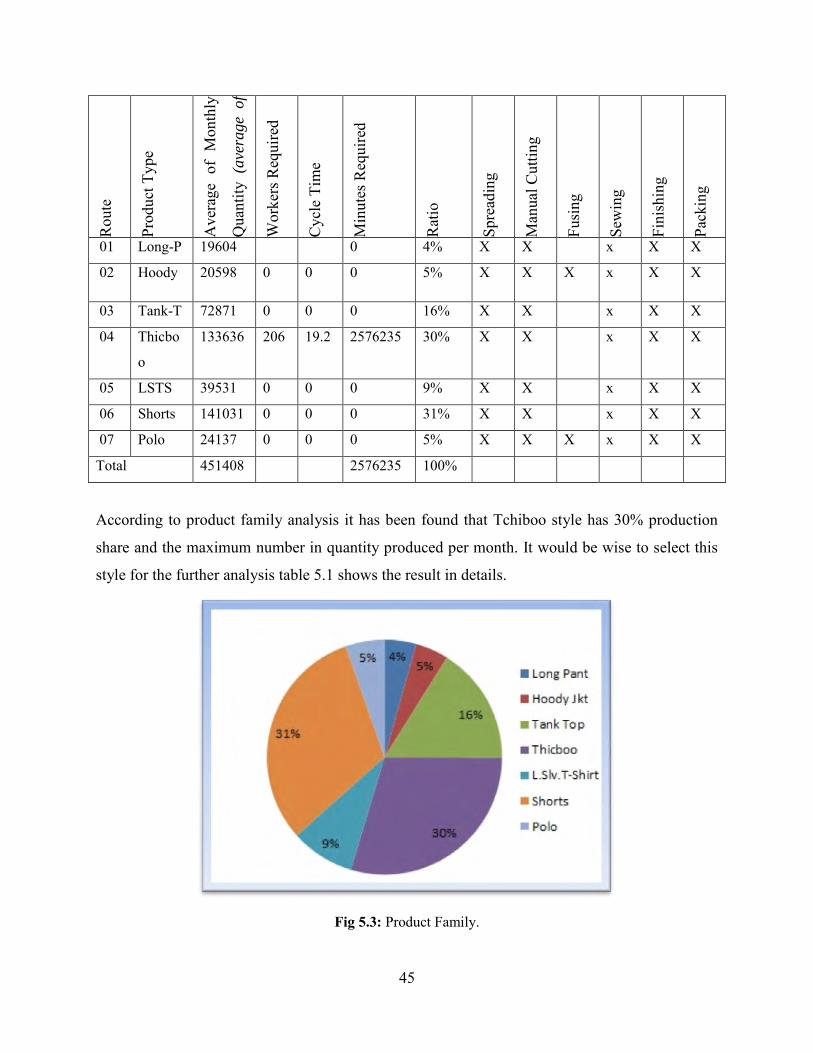
45
Rou
te
Prod
uct T
ype
Ave
rage
of
Mon
thly
Qua
ntity
(ave
rage
of
4 m
onth
s)
Wor
kers
Req
uire
d
Cyc
le T
ime
Min
utes
Req
uire
d
Rat
io
Spre
adin
g
Man
ual C
uttin
g
Fusi
ng
Sew
ing
Fini
shin
g
Pack
ing
01 Long-P 19604 0 4% X X x X X 02 Hoody 20598 0 0 0 5% X X X x X X
03 Tank-T 72871 0 0 0 16% X X x X X 04 Thicbo
o 133636 206 19.2 2576235 30% X X x X X
05 LSTS 39531 0 0 0 9% X X x X X 06 Shorts 141031 0 0 0 31% X X x X X 07 Polo 24137 0 0 0 5% X X X x X X Total 451408 2576235 100%
According to product family analysis it has been found that Tchiboo style has 30% production
share and the maximum number in quantity produced per month. It would be wise to select this
style for the further analysis table 5.1 shows the result in details.
Fig 5.3: Product Family.

46
5.3.2. Data Collection with the Help of VSM Log Sheet
After selecting target product for Value stream mapping SIPOC diagram (suppliers, inputs,
process, and output, customers) to document the process steps has been used this begins with the
customers and work forward. Once the walk-through is completed, there should be enough initial
data to understand the value stream, and to start creating a current-state value stream map with a
more detailed depiction of the value stream. Date have been collected from three sections;
cutting, sewing and finishing. Initially data of all the sections were analyzed and based on these a
current stage map was drawn. Data log sheet from all the three sections are provided in appendix.
5.3.3. Data Analysis for Current State:
Simple analytical technique is used for data sorting and analysis. Microsoft Excel program is
used for some calculations and pre-designed value stream map is used to build the scenario of the
value-added and non-value-added time at different sections.
Fig 5.4: Current stage map for cutting
In fig-5.4 shows the current stage of the cutting section where the total working time is 535
minute, total retention or waiting time is 207 minute , Total value added activities is 61% and
Non value added activities is 39%.
FactoryChampion
Department
SL.NO.
Activities Are
a
Wor
k St
atio
n
QTY
1Waiting- As the laying was not started.
Cutting On the laying table 1,476 5 4
2 Marker Setting-1 Lay Cutting 1 12 10 9 120 sft 7.500
3 Laying Cutting 1 1,464 120 9 120 sft 0.738
7Waiting-Due to absence of the cutter man
Cutting 1,476 32
8 Cutting Cutting 1 1,476 73 2 120 sft 0.099
9 Numbering Cutting 1 1,476 85 1 120 sft 0.058
10 Bundling Cutting 1 1,476 25 2 120 sft 0.034
11 Send the bundle into the reck Cutting 1 1,476 15 2 50 sft 0.020
12 Waiting- As the cut pieces are not sent to Cutting 1,476 170
Cyc
le ti
me
Total Processing Time 328.000
Cutting Section Data Collection Logsheet( Current)
Md. Abdul Halim
Total Retention Time
Spac
e (a
rea)
207.000
Masco Knitware Ldt
Cutting
Sim
ulta
neou
s ac
tivi
ties
Tim
e (M
inut
es)
for a
ll ac
tiviti
es
Nbr
e w
orke
rs
Dis
tanc
e (f
eet)
Equi
pmen
t (ty
pe a
nd q
ty)
Time (minutes)
non
Val
ue A
dded
Total LeadTime
Total Value added Time
Total non-value added Time
535.00061%39%0
100
200
300
400
500
600
1 2 3 4
TotalRetentionTime
TotalProcessing Time
0
0.1
0.2
0.3
0.4
0.5
0.6
0.7
1 2 3 4
61%
39%Total Valueadded Time
Total non-value addedTime

47
Fig 5.5: Current stage map for Sewing
Fig-5.5 shows sewing section has total working time 281.105 minutes, total retention or waiting
time 273.60 minutes, total processing time 7.505 minutes, total value added activities 3% and
Non value added activities 97% currently.
Fig-5.6 depicts finishing section having total working time 467.225 minutes, total retention or
waiting time 459 minutes and total processing time 8.225 minutes, total value added activities
2% and Non value added activities 98%.
In Cartooning section total working time is 85.130 minute, total retention or waiting time is 80
minute and total processing time is 5.13 minute. Total value added activities is 6% and Non
value added activities is 94%.
Fig 5.6: Current State Finishing & Car.
As any product needs to move through all these three sections, the total value-added and no-
value-added time in theses sections are calculated to identify their respective contribution to the
total process.
Total Processing Time 7.505Total Lead Time
Total Value Added Time281.105
3%Total Non Value Added Time 97%
Total Retention Time 273.600
0
100
200
300
1 2 3 4
Total RetentionTime
Total ProcessingTime
Total Lead Time 0
0.5
1
1 2 3 4
3%
97%
Total ValueAdded Time
Total Processing Time 8.225Total Retention Time 459.000
Total Retention Time 80.000Total Processing Time 5.130
Finishing
Cartoning
Total non value addedTime
Total Lead time Time
Total non value addedTime
85.1306%94%
467.225Total Value added Time 2%
98%
Total Lead time TimeTotal Value added Time
0
200
400
600
1 2 3 4
TotalRetentionTime
TotalProcessingTime 0
0.5
1
1 2 3 4
2%
98%
TotalValueaddedTime
0
50
100
1 2 3 4
TotalRetentionTimeTotalProcessingTime
0
0.5
1
1 2 3 4
6%
94%
Total Valueadded Time
Total nonvalueaddedTime

48
Table 5.2: VSM Current State Data
Masco Group G2
Product Name-Thicboo Order No:404T/2013
Buyer: Thicboo Line:404/Tichboo
Value Stream Mapping: Current State Finding
Categories Cutting Sewing Finishing Cartooning Total
Total
Retention
Time
207.000 273.600 459.000 80.000
1019
Total
Processing
Time
328.000 7.505 8.225 5.130
345.86
Total Lead-
time 535.000 281.105 467.225 85.130
1364.86
Total Value
added Time 61% 3% 2% 6%
25%
Total non-
value added
Time
39% 97% 98% 94%
75%
Fig 5.7: Overall VSM Current State
The overall scenario is depicted in Fig-5. 7. From the figure, it is found that the total non-value
added, and value added time percentages in cutting, sewing and finishing are respectively 75%
and 25%.
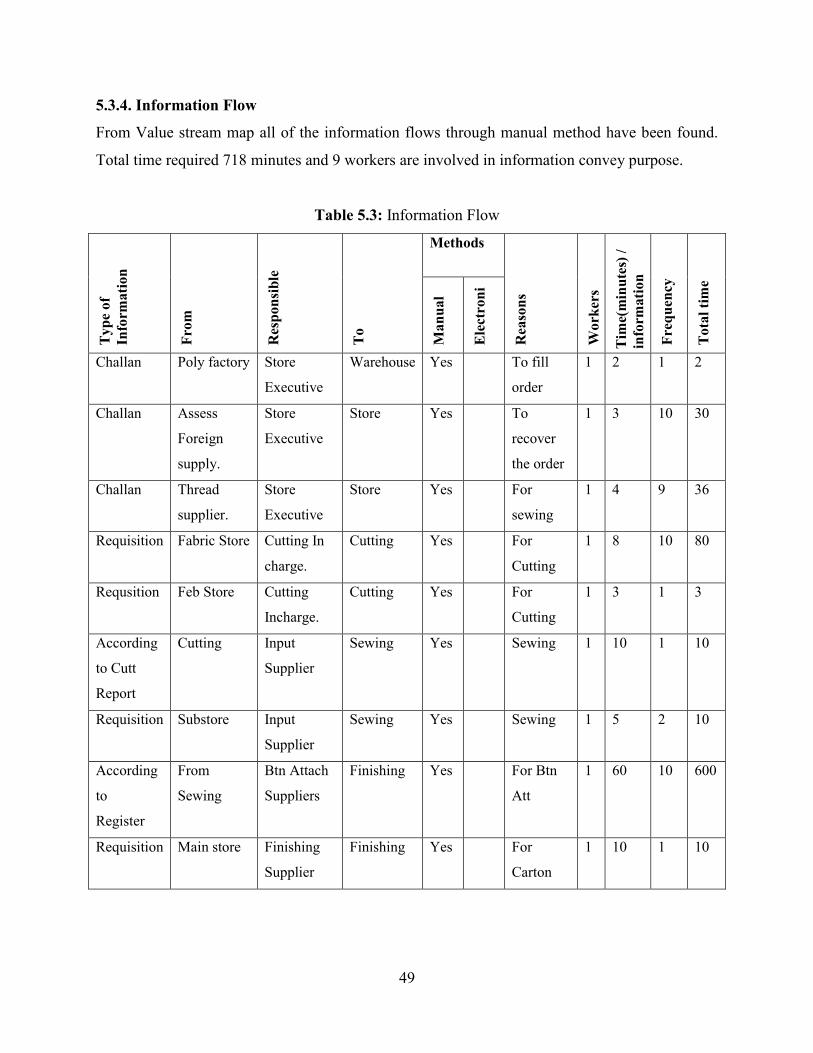
49
5.3.4. Information Flow
From Value stream map all of the information flows through manual method have been found.
Total time required 718 minutes and 9 workers are involved in information convey purpose.
Table 5.3: Information Flow
Typ
e of
In
form
atio
n
From
Res
pons
ible
To
Methods
Rea
sons
Wor
kers
Tim
e(m
inut
es) /
in
form
atio
n
Freq
uenc
y
Tot
al ti
me
Man
ual
Ele
ctro
ni
Challan Poly factory Store
Executive Warehouse Yes To fill
order 1 2 1 2
Challan Assess
Foreign
supply.
Store
Executive Store Yes To
recover
the order
1 3 10 30
Challan Thread
supplier. Store
Executive Store Yes For
sewing 1 4 9 36
Requisition Fabric Store Cutting In
charge. Cutting Yes For
Cutting 1 8 10 80
Requsition Feb Store Cutting
Incharge. Cutting Yes For
Cutting 1 3 1 3
According
to Cutt
Report
Cutting Input
Supplier Sewing Yes Sewing 1 10 1 10
Requisition Substore Input
Supplier Sewing Yes Sewing 1 5 2 10
According
to Register
From
Sewing Btn Attach
Suppliers Finishing Yes For Btn
Att 1 60 10 600
Requisition Main store Finishing
Supplier Finishing Yes For
Carton 1 10 1 10
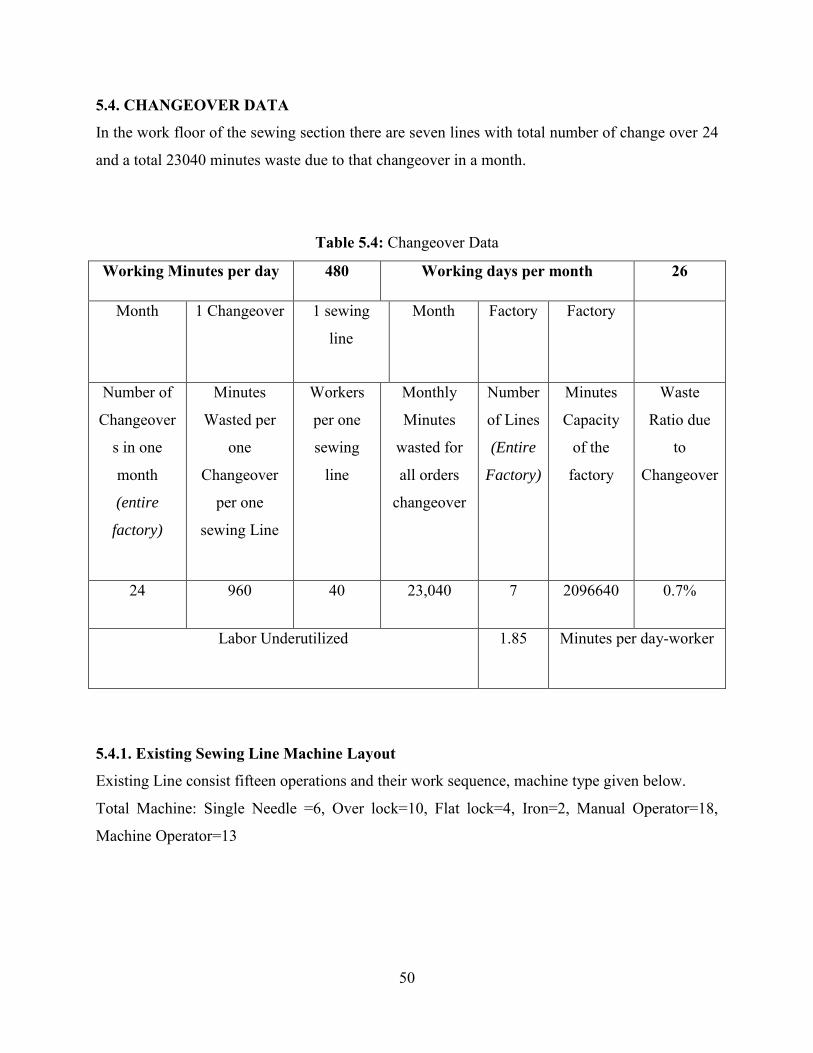
50
5.4. CHANGEOVER DATA
In the work floor of the sewing section there are seven lines with total number of change over 24
and a total 23040 minutes waste due to that changeover in a month.
Table 5.4: Changeover Data
Working Minutes per day 480 Working days per month 26
Month 1 Changeover 1 sewing
line
Month Factory Factory
Number of
Changeover
s in one
month
(entire
factory)
Minutes
Wasted per
one
Changeover
per one
sewing Line
Workers
per one
sewing
line
Monthly
Minutes
wasted for
all orders
changeover
Number
of Lines
(Entire
Factory)
Minutes
Capacity
of the
factory
Waste
Ratio due
to
Changeover
24 960 40 23,040 7 2096640 0.7%
Labor Underutilized 1.85 Minutes per day-worker
5.4.1. Existing Sewing Line Machine Layout
Existing Line consist fifteen operations and their work sequence, machine type given below.
Total Machine: Single Needle =6, Over lock=10, Flat lock=4, Iron=2, Manual Operator=18,
Machine Operator=13

51
Table 5.5: Existing Style Man Machine Chart
S/N Operation Name Machine Name M/C or Man
1 Match the Front & Back Part Manual 1
2 Shoulder Join O/L 2
3 Trimming Manual 1
4 Neck Join O/L 2
5 Trimming Manual 1
6 Neck Top Stitch S/N 3
7 Trimming Manual 1
8 Back Tape S/N 3
9 Trimming Manual 1
10 Sleeve Matching Manual 1
11 Sleeve Join O/L 2
12 Trimming Manual 1
13 Side Join O/L 2
14 Body Hem F/L 2
15 Sleeve Hem O/L 2
16 Trimming Manual 1
17 Sizing Manual 1
18 Heat Seal Transferring Iron 2
19 Thread Cut Manual 1
20 Final Quality Check Manual 2
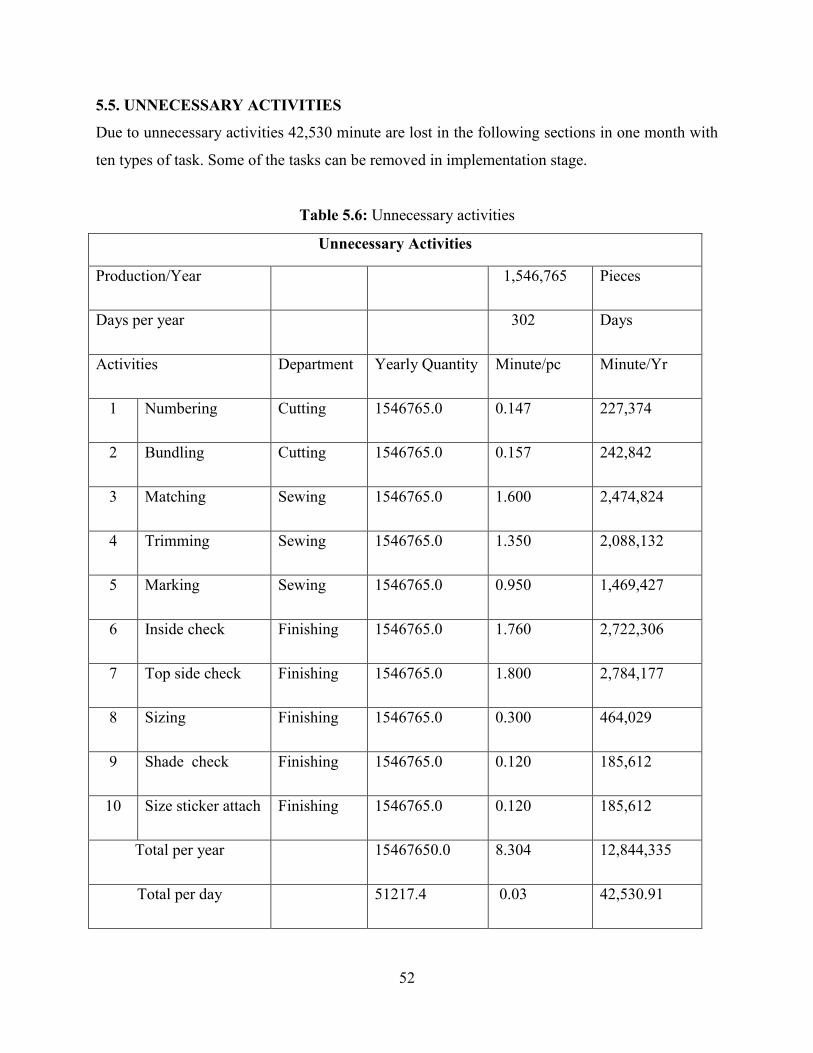
52
5.5. UNNECESSARY ACTIVITIES
Due to unnecessary activities 42,530 minute are lost in the following sections in one month with
ten types of task. Some of the tasks can be removed in implementation stage.
Table 5.6: Unnecessary activities
Unnecessary Activities
Production/Year 1,546,765 Pieces
Days per year 302 Days
Activities Department Yearly Quantity Minute/pc Minute/Yr
1 Numbering Cutting 1546765.0 0.147 227,374
2 Bundling Cutting 1546765.0 0.157 242,842
3 Matching Sewing 1546765.0 1.600 2,474,824
4 Trimming Sewing 1546765.0 1.350 2,088,132
5 Marking Sewing 1546765.0 0.950 1,469,427
6 Inside check Finishing 1546765.0 1.760 2,722,306
7 Top side check Finishing 1546765.0 1.800 2,784,177
8 Sizing Finishing 1546765.0 0.300 464,029
9 Shade check Finishing 1546765.0 0.120 185,612
10 Size sticker attach Finishing 1546765.0 0.120 185,612
Total per year 15467650.0 8.304 12,844,335
Total per day 51217.4 0.03 42,530.91
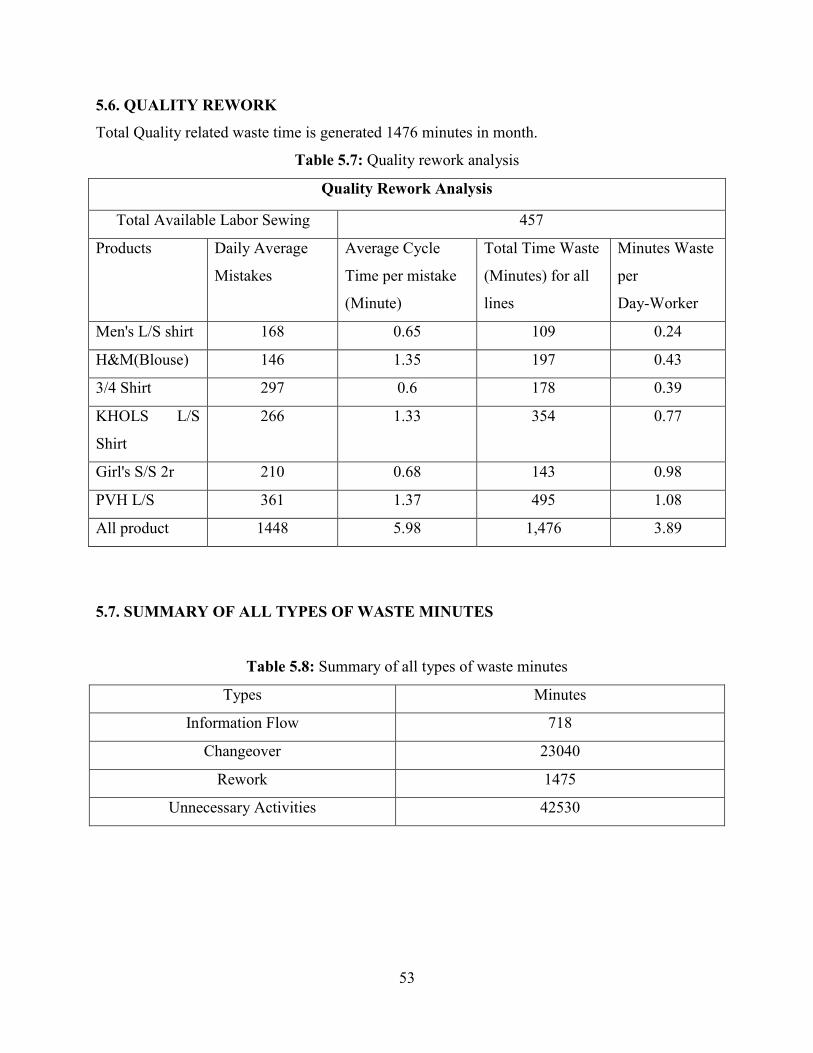
53
5.6. QUALITY REWORK
Total Quality related waste time is generated 1476 minutes in month.
Table 5.7: Quality rework analysis
Quality Rework Analysis
Total Available Labor Sewing 457
Products Daily Average
Mistakes
Average Cycle
Time per mistake
(Minute)
Total Time Waste
(Minutes) for all
lines
Minutes Waste
per
Day-Worker
Men's L/S shirt 168 0.65 109 0.24
H&M(Blouse) 146 1.35 197 0.43
3/4 Shirt 297 0.6 178 0.39
KHOLS L/S
Shirt
266 1.33 354 0.77
Girl's S/S 2r 210 0.68 143 0.98
PVH L/S 361 1.37 495 1.08
All product 1448 5.98 1,476 3.89
5.7. SUMMARY OF ALL TYPES OF WASTE MINUTES
Table 5.8: Summary of all types of waste minutes
Types Minutes
Information Flow 718
Changeover 23040
Rework 1475
Unnecessary Activities 42530

54
Fig 5.8: Summary of waste min
After analyzing all of the data, it can be concluded that unnecessary activities occupy most of the
waste time. Changeover is second largest waste time producing work in the studied floors.
Information flow and rework related time also has a little contribution in waste time. The next
chapter will describe the pilot run project and further improvement.
718
23040
1475
42530
INFORMATION FLOW
CHANGEOVER
REWORK
UNNECESSARY ACTIVITIES

55
CHAPTER SIX IMPLEMENTATION & RESULT ANALYSIS
6.1. INTRODUCTION
Lean manufacturing is a culture of organization wide effort for better performance and business
growth. It can be happened with a dedicative team work and commitment to continuous
improvement. In this chapter with the help of existing data, a lean family has established by
developing a lean steering committee & lean team.
6.2. SETTING UP THE LEAN FAMILY
The moving forward plan is organized, planned, monitored and implemented by the following:
Steering committee
Champion
Core Implementation Team
So the Lean family must be created and training related to the lean principles and tools approach
must be provided to all the lean family.
Steering Committee Champion
Core Implementation
Team
Fig 6.1: Level of responsibility

56
6.3. ROLE AND RESPONSIBILITY OF THE LEAN FAMILY
Steering committee role is to monitor and assure project progress in addition to provide support
to the champion and the core implementation team to remove any obstacles, blocks, resistance,
and to provide guidance and assistance. The steering committee consists of all head departments
and two workers representative (president of the employees’ council). Steering committee should
select the champion. Steering committee is led by the General Manager.
Roles of Steering Committee Members
Make strategic decisions related to project implementation.
Participate in decision making
Develop supportive systems for better run of the project.
Coordinate and communicate with supportive departments and personnel.
Assure commitment and support from relevant departments is in place.
Provide assistance to remove conflicts, resistance and roadblocks.
Provide technical guidance and assistance for the project implementation.
Identify training need and provide training assistance and dissemination of knowledge
required.
Prepare and follow up project plan, provide guidance and assistance in implementation.
Identify deviation from the plan and take corrective actions as required.
Disseminate project achievements and failures to relevant authorities and take corrective
actions.
Champion: Is someone with the authority and the responsibility to allocate the organization’s
resources. In small organization it may be the general manager, the factory manager or the
production manager. In large organization it may be the chief engineer or the Industrial
Engineering in charge.
The champion should possess the following attributes:
A sense of Project ownership
Authority to make change happen across functions and departments
Authority to select the implementation core team
57
Authority to commit resources
Core Implementation Team: Factories lack supportive conditions for improvement activities.
An employee suggestion system must be established. So factories need to build more team
enthusiasm. At step one team members must understand how team activities serve their own
desires for personal improvement and self-actualization.
In addition to the champion, it is important to assemble a core implementation team for
managing and realizing the improvements. The core implementation team follows the directions
of the champion. The team will create plans, communicate to all levels within the organization,
make sure people are trained, and implement the value stream process. It is critical for team
members to work together, because every aspect of the value stream mapping requires a high
degree of collaboration – especially designing the concept or the tool that will lead to the future
state.
Formulating the team:
The team should consist of three to seven members from the same workplace.
The leader guides discussions and consensus.
The team determines roles for each member in implementing improvements.
The core team should follow basic teaming guidelines:
Identify team members’ role such as: Leader, timekeeper, facilitator, trainer, etc.
Establish team norms
Respectfully the work calendar
The team leader should reinforce the commitment to lean principles and tools by explaining the
difference between any existing system and the lean approach. The team leader performs several
key functions, at meetings and in between:
Supports team members through the process
Schedules frequent, short meetings during work hours. Stand-up meetings keep things
brief and focused.
Prepares the agenda

58
Communicates with the champion and the general manager
Brings people with additional expertise into the team process on a regular basis
Addresses nonparticipation early and privately.
Core Team members can be: Garment technician, Quality staff, Industrial engineers, staffs from
cutting, stores and etc.
6.4. SELECTION OF A PILOT LINE
A pilot line selected named 404/Thicboo for lean manufacturing. At first 40 worked, two line
supervisors, one production manager select for lean transformation team.
Work steps:
Arrange two hour lone seven training session for all team member.
All team member Familiarized with lean tools & techniques.
Select ten sewing operator for intensive machine practice about coming garments style.
Make sure the entire member about waste and value.
Train up how to and which element should be converted external to internal elements.
Search all kind of unnecessary activities and how to eliminate those from process.
6.5. PREPARATION FOR CHANGEOVER
6.5.1. Transforming Internal in to External Activities
Pre-Production Meeting: Before starting test cutting & sewing Pre-Production Meeting will
held to make sure everyone is aware of all about the style and execute the style respecting all
quality points and to minimize communication gaps and to get a know-how of the order starting
from cutting section to finishing section. The meeting will attended by Quality Assurance
Manager, Cutting & sewing-In-Charge and respective line Mechanic.
During the meeting following points have discussed as per the agenda mentioned the following.
Introduction of the style - Assistant General Manager / Factory Manager
59
Fabric & Accessories status – Store-In-Charge
Pattern, Cut marks etc. – Pattern In Charge
Quality points – QA Manager
Special Operations – Technical Manager
Line Layout, Allocation of workers, Target setting, Line balancing – IE Dept.
Ironing, Folding & Packing – Finishing-In-Charge
Meeting minutes are recorded & circulated to all concerns
Trial Production: Trial production is done for the purpose of checking mainly product quality
& some of product special specification such as size measurement, sewing quality, and stitch
tension etc. During trial production instruction is given that what’s wrong and what’s right.
Production managers, Quality manager, Floor in charge are responsible for trial production.
In Redesign process all of the product specification, quality specification and others necessary
specification provided to the responsible persons Quality controller, floor in charge, line Chief,
and supervisors at least 2 or 3 days ago before final production.
Layout preparation: In previous system the production peoples are responsible for layout
preparation. In their layout there were some of problems for consuming more time. That was:
No process sequence.
Product not smooth flow.
Products are not totally forward flow.
Straight layout
Product transportation waste was high
Consume more space
Manpower & Machine allocation was not limited way
Process layouts are frequently changed.
Redesign system Layout preparation is done according to PMTS analysis which was totally
helpful for SMV calculation, Man & Machine allocation, Target setting & Efficiency calculation
& also preventive for these problems of process sequence, space, product transportation, man &
machine allocation, layout change.
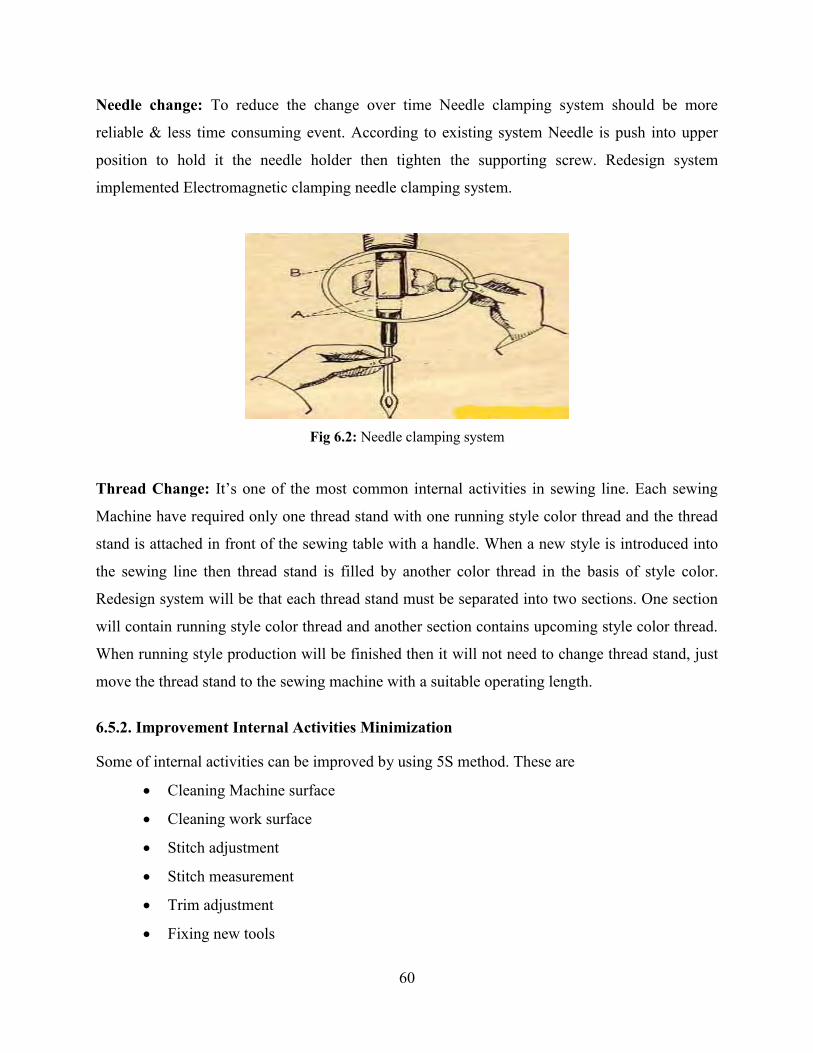
60
Needle change: To reduce the change over time Needle clamping system should be more
reliable & less time consuming event. According to existing system Needle is push into upper
position to hold it the needle holder then tighten the supporting screw. Redesign system
implemented Electromagnetic clamping needle clamping system.
Fig 6.2: Needle clamping system
Thread Change: It’s one of the most common internal activities in sewing line. Each sewing
Machine have required only one thread stand with one running style color thread and the thread
stand is attached in front of the sewing table with a handle. When a new style is introduced into
the sewing line then thread stand is filled by another color thread in the basis of style color.
Redesign system will be that each thread stand must be separated into two sections. One section
will contain running style color thread and another section contains upcoming style color thread.
When running style production will be finished then it will not need to change thread stand, just
move the thread stand to the sewing machine with a suitable operating length.
6.5.2. Improvement Internal Activities Minimization
Some of internal activities can be improved by using 5S method. These are
Cleaning Machine surface
Cleaning work surface
Stitch adjustment
Stitch measurement
Trim adjustment
Fixing new tools

61
Guide adjustment
Nose change
6.5.3. External Activities Improvement
All of the external activities (mention above) are possible to improvement by 5S
implementation.
Placing visual markings for easier and faster identification
Using check list to prevent unpredictable events in resources preparation (5S)
“At hand” tool organization (5S)
Work place organization that decreases tool search time (5S)
Use OEE & TPM in every process.
Develop standard time for all tasks.
6.6. CONVERTED TASK LIST
Table 6.1: Internal & External Elements
Internal Elements External Elements
Cleaning work surface
Stitch adjustment
Stitch measurement
Guide adjustment
Nose change
Looper adjustment
Tension adjustment
Thread change
Needle positioning
Trim adjustment
Fixing new tools
Pre-Production Meeting.
Layout preparation Trial production Cleaning Machine surface
Cleaning Machine surface Needle change
Needle change
Provision of trim card.
Getting cut panel from cutting section.
Getting threads & accessories from
store.
Getting instruction about new style
from supervisors.
Provision of Layout and line balancing

62
sheet.
Provision of production sheet.
Getting instruction for next job.
Getting material for the next job from
stores.
Getting tools for the next job from tool
stores.
Returning tools for the last job to tool
stores.
After Converting Internal elements to external elements and introducing standard time
assignment for each element changeover time become 960 to 63 minutes. It’s around 93%
improvement in changeover time reduction.
6.7. CHANGEOVER STYLE MACHINE& OPERATION LIST
To implement SMED we compare old and new style machine number and type. Based on this
analysis some of the machine replaced from old line to studied line and rest of the machine
install from machine room. In Previous chapter we found that Single Needle =6, Over lock=10,
Flat lock=4, Iron=2, Manual Operator =14, Machine Operator =20 but new line required Single
Needle =9, Over lock=12, Flat lock=4. Our primary task starts with first operation which is
similar machine, so there is no need to change this machine from line. Just change the thread,
time, and clean-up to start operation. Than look forward to next machine and compare with old
to new. If two machine are not similar than replace by required machine which is already
prepared for operation. One by one we have to set up full line. We have eliminated most of the
manual operation. New style operation sequence gives below.

63
Table 6.2: New Style Man & Machine Chart
Sl.
No
Operation M/C M/C Op. Manual
1 Back &Front Part Match M 1
2 Shoulder Join with Tap O/L 1
3 Neck Rib Tack P/M 1
4 Neck Rib Join O/L 2
5 Main & Size Label Attach P/M 2
6 Neck Top Stitch F/L 2
7 Sleeve Match M 1
8 Sleeve Join O/L 2
9 Care & Name Label Make P/M 1
10 Side Seam O/L 3
11 Cuff Make P/M 2
12 Cuff Fold M 1
13 Cuff Attach O/L 2
14 Bottom Rib Make P/M 1
15 Bottom Rib Attach O/L 2 1
16 Bottom Rib Top Stitch F/L 2
17 Hanger Tap Attach P/M 2
Total Machine/Manual operator 25 3

64
6.8. IMPROVED CHANGEOVER TIME
Table 6.3: Improved changeover time
Working Minutes per day 480 Working days per
month
26
Month 1 Changeover 1 sewing
line
Month Factory Factory
Number of
Changeovers
in one
month
(entire
factory)
Minutes
Wasted per
one
Changeover
per one
sewing Line
Workers
per one
sewing
line
(including
sewing
operators
and
helpers)
Monthly
Minutes
wasted for
all orders
changeover
Number
of Lines
(Entire
Factory)
Minutes Capacity of
the factory
24 63 40 1512 7 3,494,400
Labor Underutilized 0.21 Minutes per day-
worker
Previous Waste time was 42,530, after implementing SMED it’s become 1512 minute. It is 96%
improvement in change over time reduction.
6.9. UNNECESSARY TASK ELIMINATION
Introducing small size bundle method and auto thread cutter machine we eliminate Matching,
Trimming and marking process. All of those processes save 20487 min a day to entire factory.
It’s around 40% improvements.

65
Table 6.4: Unnecessary activities after elimination
Unnecessary Activities After Elimination
Production/Year 1,546,765 Pieces
Days per year 302 Days
Activities Department Yearly Quantity Minute/pc Minute per
year
1 Numbering Cutting 1546765.0 0.147
227,374
2 Bundling Cutting 1546765.0 0.157
242,842
3 Inside check Finishing 1546765.0 1.760
2,722,306
4 Top side check Finishing 1546765.0 1.800
2,784,177
5 Sizing Finishing
6 Shade check Finishing 1546765.0 0.120
185,612
7 Size sticker
attach
Finishing 1546765.0 0.120
185,612
Total per year 9280590.0 4.104 6,347,924
Total per day 30730.4 0.01 417.61
6.10. OTHER LEAN TOOLS EFFECT ON VSM
After applying 5S in the store, cutting, sewing, finishing section, the organization can organize
the workplace. It is found that the hand tape, sticker, gum, poly, stapler and some hand tools are
not placed in a particular location. This causes a problem to the uses to find them at right time.
Significant amount of time is wasted just for this. By applying 5s tool, non-value added time can
be reduced notably.
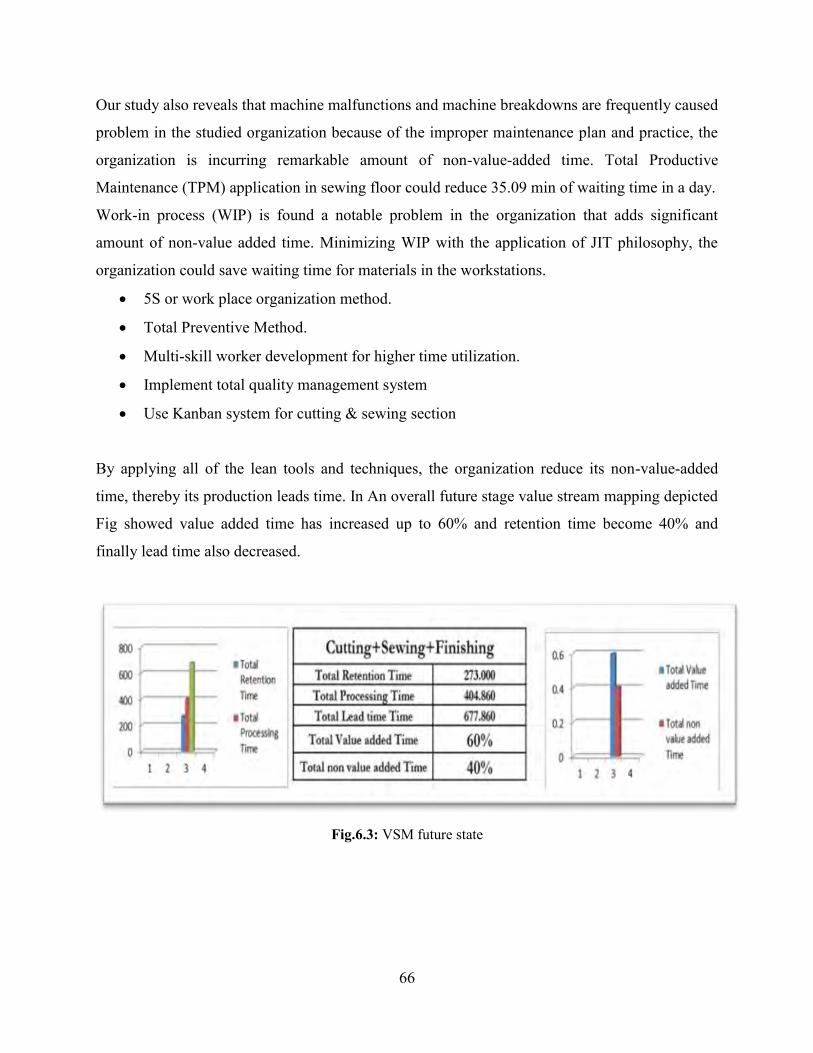
66
Our study also reveals that machine malfunctions and machine breakdowns are frequently caused
problem in the studied organization because of the improper maintenance plan and practice, the
organization is incurring remarkable amount of non-value-added time. Total Productive
Maintenance (TPM) application in sewing floor could reduce 35.09 min of waiting time in a day.
Work-in process (WIP) is found a notable problem in the organization that adds significant
amount of non-value added time. Minimizing WIP with the application of JIT philosophy, the
organization could save waiting time for materials in the workstations.
5S or work place organization method.
Total Preventive Method.
Multi-skill worker development for higher time utilization.
Implement total quality management system
Use Kanban system for cutting & sewing section
By applying all of the lean tools and techniques, the organization reduce its non-value-added
time, thereby its production leads time. In An overall future stage value stream mapping depicted
Fig showed value added time has increased up to 60% and retention time become 40% and
finally lead time also decreased.
Fig.6.3: VSM future state
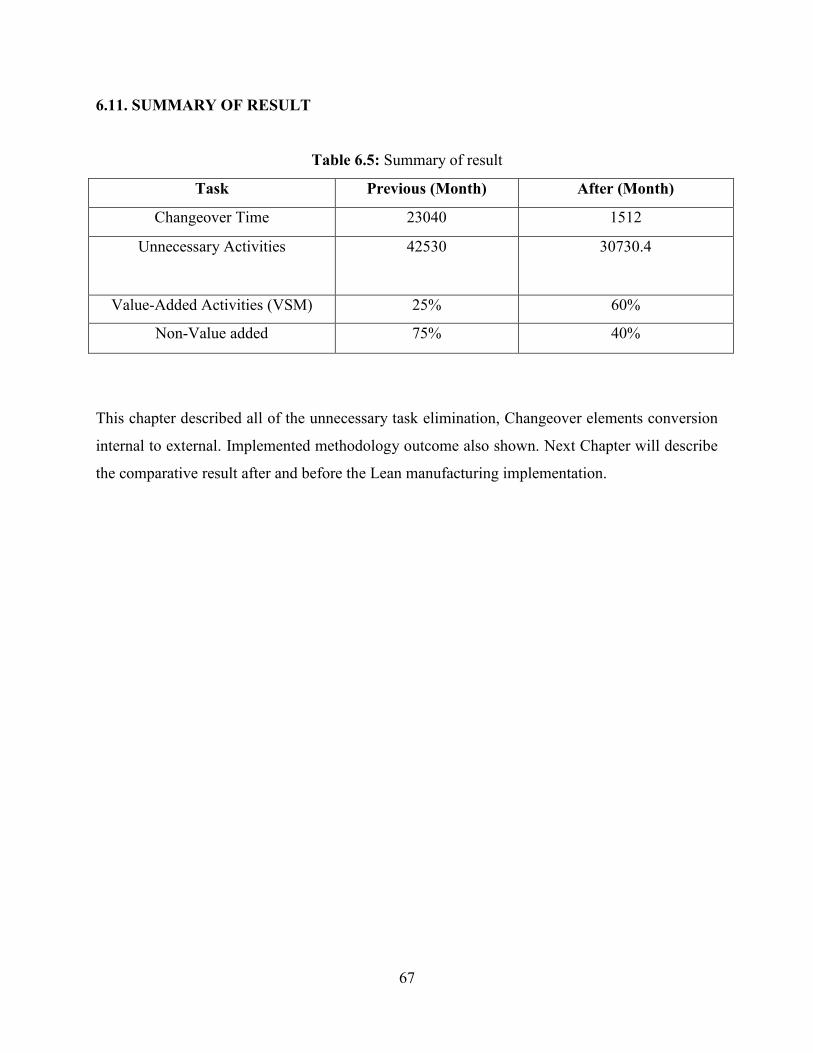
67
6.11. SUMMARY OF RESULT
Table 6.5: Summary of result
Task Previous (Month) After (Month)
Changeover Time 23040 1512
Unnecessary Activities 42530 30730.4
Value-Added Activities (VSM) 25% 60%
Non-Value added 75% 40%
This chapter described all of the unnecessary task elimination, Changeover elements conversion
internal to external. Implemented methodology outcome also shown. Next Chapter will describe
the comparative result after and before the Lean manufacturing implementation.

68
CHAPTER SEVEN
CONCLUSION & RECOMMENDATION
7.1. CONCLUSIONS
This research has extracted an overall scenario of the cutting, sewing and finishing section of the
selected garments company in the context of productivity, quality, waste as well as effectiveness,
efficiency.
The improvement of any manufacturing organization depends on various issues such as waste
minimization, productivity improvement, quality management as well as labor efficiency,
resource utilization etc. This research analysis has extracted based on the basis of different lean
tools: value stream mapping analysis, Changeover time analysis and 5S analysis. Before this
analysis various types of wastes were identified and the reasons behind all these wastes have
been analyzed. The analysis shows that in most of the time human resource is responsible for the
creation of waste.
Firstly, Single Minute Exchange of Die Method becomes blessing in changeover method. After
implementing SMED waste reduce 42,530 to 1512 minutes in month. It is 96% of time reduction
in changeover process.
Secondly, Value stream mapping has provided a clear picture about material & information flow
time. Initially value stream mapping depicted the value added time percentages in cutting,
sewing and finishing totally respectively 75% and 25%. In implementation stage value added
time has increased up to 60% and retention time become 40% and finally lead time also
decreased.
Thirdly, Elimination of some process like matching parts, trimming and marking process which
was treated as unnecessary activities and introducing down size bundle system. Result of this
change saved 20487 min a day to entire factory. It’s around 40% improvements in unnecessary
task elimination.

69
7.2. RECOMMENDATION
1. This research work is done in a knit composite industry; so further study can
be done in woven and other types of apparel industry
2. This research work is concentrated only the sewing section of the selected
garments industry, so further study can be done in other section of the selected
industry such as knitting, dying, cutting, finishing and packing section.
3. This research work analysis is mainly divided into three dimensions which are
changeover time analysis, value stream mapping 5S & OEE analysis but
further study can be performed by using other lean tools such as Value stream
mapping, kanban system.
4. The changeover time analysis is done only in sewing section to show the
impact of changeover time on productivity, lead time, WIP stock, defect but
further study can be performed in other section by using SMED method to
reduce changeover time.
5. Various types of wastes are identified according to lean theory but in future
this waste can be represented in terms of money, which can help the
organization to know about the loss of money and lead them to think about
how to overcome this loss.
70
REFERENCES
[1] Khondker Nasreen (2002). “Garments Industry in Bangladesh, South Asia Multidisciplinary Advisory Team (SAAT)”, International Labour Organization, New Delhi, India [2] Glock, R. E., Kunz, G. I, (2005). Apparel Manufacturing: Sewn Product Analysis. USA: Pearson Education Inc. [3] Bheda, R., Narag, A.S. and Singla, M.L. (2003). Apparel Manufacturing: A Strategy for Productivity Improvement. Journal of Fashion Marketing and Management, Vol 7(1), pp. 12-22. [4] Yash, D. and Nagendra, S. (2012). The Journey of Lean Manufacturing: Literature Review. International Journal of Lean Thinking, Vol 35(2), pp. 125-134. [5] M. Cakmakci, (2009). Process Improvement: Performance Analysis of the Setup Time Reduction-SMED in the Automobile Industry. The International Journal of Advanced
Manufacturing Technology,Vol 41(1-2), pp. 168-179. [6] S. Patel, P. Shaw, B.G. Dale, (2001). Set-up Time Reduction and Mistake Proofing Methods: A Study of Application in a Small Company, Bus Process Man J, Vol 7(1), pp. 65–75. [7] Simon Caulkin, (2002). Lean Thinking and Methods: "Waste Not, Want Not, Pearson Education Inc. pp.30-35. [8] Bicheno John, (200). The Lean Toolbox: Picsie Books, Buckingham, England, PP-21-24. [9] Bisen, V. and Srivastava, S. (2009). Production and Operation Management. Lucknow, India Global Media, pp. 175. [10] Burton, Terence T., and Boeder, Steven M. (2003). Lean Extended Enterprise : Moving Beyond the Four Walls to Value Stream Excellence. Boca Raton, FL, USA: J. Ross Publishing Inc. pp. 122. [11] Drew, J., Blair, M. and Stefan, R. (2004). Journey to Lean: Making Operational Change Stick. Gordonsville, VA, USA: Palgrave Macmillan. pp. 5-25. [12] Feld, M.W., (2000). Lean Manufacturing: Tools, Techniques, and how to use them. Boca Raton, London: The St. Lucie Press.

71
[13] Gao L., Norton M. J. T., Zhang Z. and Kin-man To C. Potential Niche Markets for Luxury Fashion Goods in China. Journal of Fashion Marketing and Management Vol. 13 No. 4, 2009, pp. 514-526. [14] Gersten, F. (ed), and Riis, Jens O. (ed)., (2002). Continuous Improvement and Innovation. Bradford, GBR: Emerald Group Publishing Ltd. pp. 41. [15] Heizer, J., and Render, B. (2000), Principles of Operations Management 4th Edition. Pearson College Div. ISBN-10: 0130271470. pp. 336-420. [16] Kumar, S. A. (2008). Production and Operations Management. Daryaganj, Delhi, India: New Age International, pp. 217-220. [17] Larson, A. (2003). Demystifying S i x Sigma: A Company-Wide A p p r o a c h to Continuous Improvement. Saranac Lake, NY, USA: AMACOM Books. pp. 46. [18] Liker, J. (2003). Toyota Way. Blacklick, OH, USA: McGraw-Hill Professional Publishing, pp. 28-33. [19] Lucy Daly, M.B. and Towers, N. Lean or Agile: A Solution for Supply Chain Management in the Textile and Clothing Industry. International Journal of Operations & Production Management Vol. 24 No. 2, 2004, pp. 151-170. [20] Magee, D. (2007). How Toyota Became # 1 Leadership Lessons from the World’s Greatest Car Company. New York, USA: Penguin Group. pp. 67. [21] Mid-America Manufacturing Technology Center, ‘Lean Manufacturing Utilizes Multiple Tools to Help Companies Improve Performance Objectives, ‘The Manufacturer’s Edge. (Winter 2000), pp 1-2 [22] Nash, A. M., Poling, S. R., and Ward, S. (2006). Using Lean for Faster Six Sigma Results a Synchronized Approach. New York, USA: Productivity Press. pp. 17. [23] Shahram, T. and Cristian, M. The Impact of Lean Operations on the Chinese. pp-22. [24] Manufacturing Performance. Journal of Manufacturing Technology Management Vol. 22 No. 2, 2011, pp. 223-240. [25] Sharma, A. (2009). Operations Research. Mumbai, India: Global Media. p. 179. Shivanand, H.K., (2006). Flexible Manufacturing System. Daryaganj, Delhi, India: New Age International. pp. 4-50.

72
[26] Wilson, L. (2009). How to Implement Lean Manufacturing. New York: McGraw-Hill Professional Publishing. pp. 29- 214. [27] Womack, J.P., Jones, D.T. and Ross, D. (1990). The Machine That Changed the World. Canada: Macmillan Publishing Company. [28] Ferdousi, F. and Ahmed, A. (2009). An Investigation of Manufacturing Performance Improvement through Lean Production: A Study on Bangladeshi Garment Firms. International Journal of Business Management, Vol 4(9), pp. 106-116. [29] Rother, M. and Harris, R., (2008). Creating Continuous Flow an Action Guide for Managers, Engineers and Production Associates. One Cambridge Center, Cambridge USA: Lean Enterprise Institute. pp. 13-1. [30] Rother, M. and Shook, J. (1998). Learning to See: value stream mapping to create value and eliminate muda. MA USA: Lean Enterprise Institute. [31] Roy, R. N. (2005). Modern Approach to Operations Management. Daryaganj, Delhi, India: New Age International. pp. 170-174. [32] Shahidul, M. I. and Syed Shazali, S. T. Dynamics of manufacturing Productivity: Lesson Learnt from Labor Intensive Industries. Journal of Manufacturing Technology Management Vol. 22 No. 5, 2011, pp. 664-678.
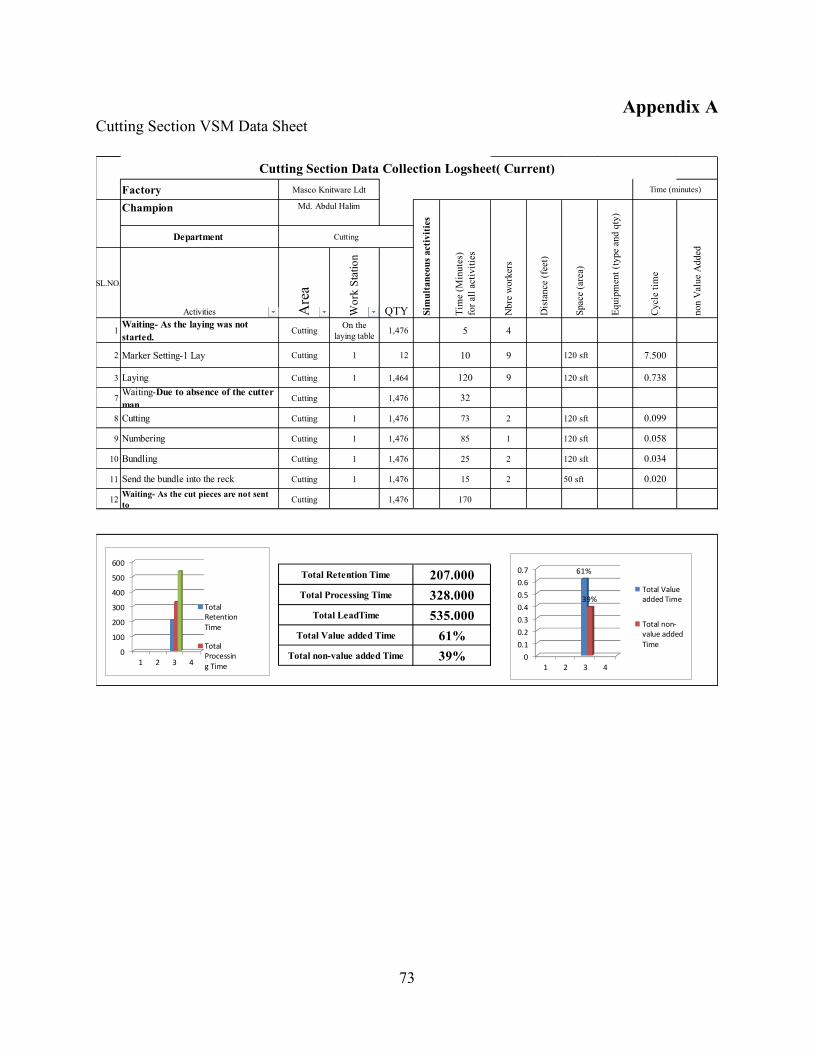
73
Appendix A Cutting Section VSM Data Sheet
FactoryChampion
Department
SL.NO.
Activities Are
a
Wor
k St
atio
n
QTY
1Waiting- As the laying was not started.
Cutting On the laying table 1,476 5 4
2 Marker Setting-1 Lay Cutting 1 12 10 9 120 sft 7.500
3 Laying Cutting 1 1,464 120 9 120 sft 0.738
7Waiting-Due to absence of the cutter man
Cutting 1,476 32
8 Cutting Cutting 1 1,476 73 2 120 sft 0.099
9 Numbering Cutting 1 1,476 85 1 120 sft 0.058
10 Bundling Cutting 1 1,476 25 2 120 sft 0.034
11 Send the bundle into the reck Cutting 1 1,476 15 2 50 sft 0.020
12 Waiting- As the cut pieces are not sent to Cutting 1,476 170
Total Processing Time 328.000
Md. Abdul Halim
Total Retention TimeSp
ace
(are
a)207.000
Masco Knitware Ldt
Cutting
Cutting Section Data Collection Logsheet( Current)
Cycl
e tim
e
Sim
ulta
neou
s act
iviti
es
Tim
e (M
inut
es)
for a
ll ac
tiviti
es
Nbr
e w
orke
rs
Dis
tanc
e (f
eet)
Equi
pmen
t (ty
pe a
nd q
ty)
Time (minutes)
non
Val
ue A
dded
Total LeadTime
Total Value added Time
Total non-value added Time
535.00061%39%0
100
200
300
400
500
600
1 2 3 4
TotalRetentionTime
TotalProcessing Time
0
0.1
0.2
0.3
0.4
0.5
0.6
0.7
1 2 3 4
61%
39%Total Valueadded Time
Total non-value addedTime
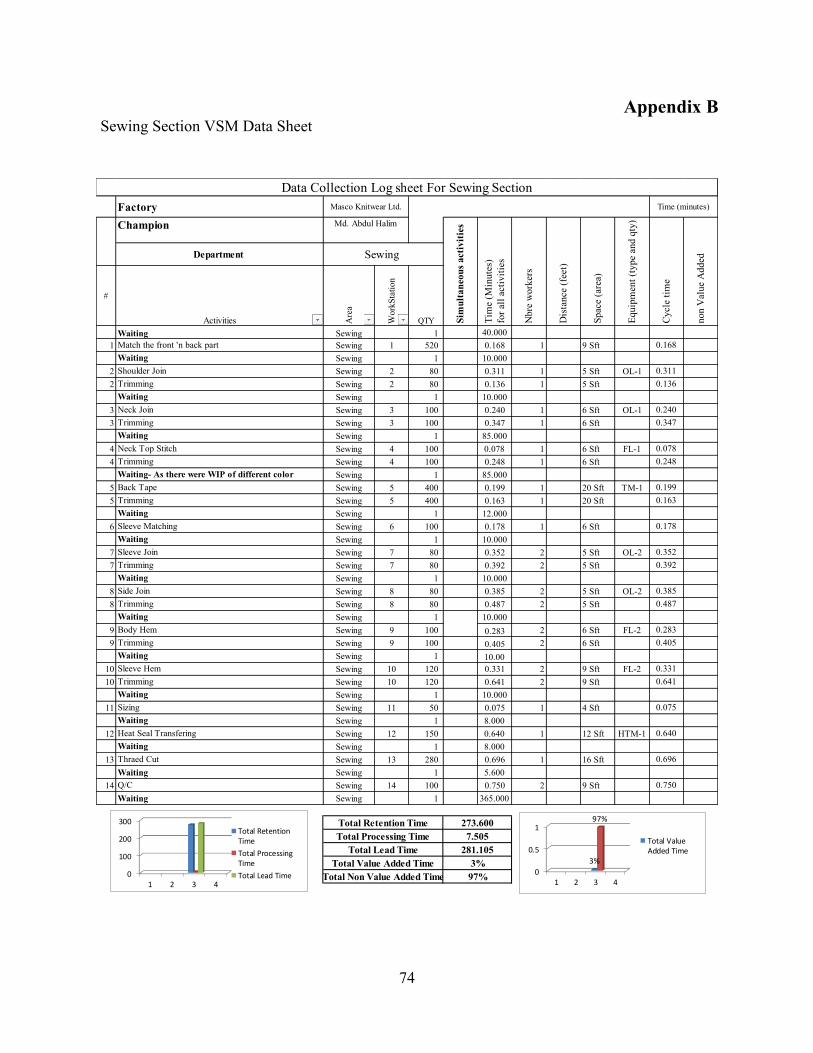
74
Appendix B Sewing Section VSM Data Sheet
FactoryChampion
Department
#
Activities Are
a
Wor
kSta
tion
QTYWaiting Sewing 1 40.000
1 Match the front 'n back part Sewing 1 520 0.168 1 9 Sft 0.168Waiting Sewing 1 10.000
2 Shoulder Join Sewing 2 80 0.311 1 5 Sft OL-1 0.3112 Trimming Sewing 2 80 0.136 1 5 Sft 0.136
Waiting Sewing 1 10.0003 Neck Join Sewing 3 100 0.240 1 6 Sft OL-1 0.2403 Trimming Sewing 3 100 0.347 1 6 Sft 0.347
Waiting Sewing 1 85.0004 Neck Top Stitch Sewing 4 100 0.078 1 6 Sft FL-1 0.0784 Trimming Sewing 4 100 0.248 1 6 Sft 0.248
Waiting- As there were WIP of different color behind the next process.
Sewing 1 85.0005 Back Tape Sewing 5 400 0.199 1 20 Sft TM-1 0.1995 Trimming Sewing 5 400 0.163 1 20 Sft 0.163
Waiting Sewing 1 12.0006 Sleeve Matching Sewing 6 100 0.178 1 6 Sft 0.178
Waiting Sewing 1 10.0007 Sleeve Join Sewing 7 80 0.352 2 5 Sft OL-2 0.3527 Trimming Sewing 7 80 0.392 2 5 Sft 0.392
Waiting Sewing 1 10.0008 Side Join Sewing 8 80 0.385 2 5 Sft OL-2 0.3858 Trimming Sewing 8 80 0.487 2 5 Sft 0.487
Waiting Sewing 1 10.0009 Body Hem Sewing 9 100 0.283 2 6 Sft FL-2 0.2839 Trimming Sewing 9 100 0.405 2 6 Sft 0.405
Waiting Sewing 1 10.0010 Sleeve Hem Sewing 10 120 0.331 2 9 Sft FL-2 0.33110 Trimming Sewing 10 120 0.641 2 9 Sft 0.641
Waiting Sewing 1 10.00011 Sizing Sewing 11 50 0.075 1 4 Sft 0.075
Waiting Sewing 1 8.00012 Heat Seal Transfering Sewing 12 150 0.640 1 12 Sft HTM-1 0.640
Waiting Sewing 1 8.00013 Thraed Cut Sewing 13 280 0.696 1 16 Sft 0.696
Waiting Sewing 1 5.60014 Q/C Sewing 14 100 0.750 2 9 Sft 0.750
Waiting Sewing 1 365.000
Data Collection Log sheet For Sewing Section
Cycl
e tim
e
Time (minutes)
non
Val
ue A
dded
Nbr
e w
orke
rs
Dis
tanc
e (f
eet)
Spac
e (a
rea)
Equi
pmen
t (ty
pe a
nd q
ty)
Total Retention Time 273.600
Sewing
Masco Knitwear Ltd.
Md. Abdul Halim
Total Processing Time 7.505
Sim
ulta
neou
s act
iviti
es
Tim
e (M
inut
es)
for a
ll ac
tiviti
es
Total Lead TimeTotal Value Added Time
281.1053%
Total Non Value Added Time 97%0
100
200
300
1 2 3 4
Total RetentionTime
Total ProcessingTime
Total Lead Time 0
0.5
1
1 2 3 4
3%
97%
Total ValueAdded Time

75
Appendix C Finishing & Cartooning VSM Data
When there is "Waiting" You need to write the reason in the activities column
FactoryChampion
Department
Activities Area
Wor
kStat
ion
QTYWaiting Finishing 1 5.000Inside check Finishing 1 50Hem Finishing 1 55 0.121 3 0.121Waiting Finishing 1 11.00Side Seam Finishing 1 65 0.146 3 0.146Waiting Finishing 1 13.00Sleeve Finishing 1 70 0.196 3 0.196Waiting Finishing 1 12.00Neck Finishing 1 65 0.16 3 0.155Waiting Finishing 1 53.000Thread Sucking Finishing 2 250 0.120 3 50 0.120Waiting Finishing 1 15.000Arrange To send to the Pressing Finishing 2 300 0.300 3 30 0.300Waiting- There were huge WIP behind the Pressing Area Finishing 1 93.000Pressing Finishing 3 400 0.650 13 120 0.650Waiting Finishing 1 18.000Outside check Finishing 4 160 0.750 12 40 0.750Waiting Finishing 1 13.000Get up & Measurement Finishing 5 150 1.333 8 36 1.333Waiting-There were WIP at the operation Finishing 1 53.000Lot Pass Finishing 6 500 0.160 2 20 0.160Waiting Finishing 1 50.000Hang Tag Attach Finishing 7 160 0.250 4 40 0.250Waiting Finishing 1 8.000Needle Detecting Finishing 8 50 0.100 1 15 0.100Waiting Finishing 1 11.000Folding Finishing 9 200 2.250 10 36 2.250Waiting Finishing 1 38.000Size Sticker Attach Finishing 9 180 0.222 4 20 0.222Waiting Finishing 1 10.000Sticker & Hang Tag Check Finishing 9 150 0.133 2 20 0.133Waiting Finishing 1 14.000Shade Check Finishing 10 200 0.200 2 20 0.200Waiting Finishing 1 14.000Sizing Finishing 10 100 0.200 2 20 0.200Waiting Finishing 1 15.000Assortment Finishing 10 150 0.267 2 30 0.267Waiting Finishing 1 18.000Poly Finishing 10 300 0.672 8 50 0.672
Waiting- There were huge WIP into the Packing area for Finishing 1 80.000Cartoning Packing 11 700 5.130 10 50 2.565Waiting Packing 9.000
Sim
ulta
neou
s act
iviti
es
Tim
e (M
inut
es)
for a
ll ac
tiviti
es
Nbre
wor
kers
Dista
nce (
feet)
Spac
e (ar
ea)
Equi
pmen
t (ty
pe an
d qty
)
Cycle
tim
e
Time (minutes)
non V
alue A
dded
Total Processing Time 8.225
Finishing
Masco Knitwear Ltd
Md. Abdul Halim
Total Retention Time 459.000
Total Retention Time 80.000Total Processing Time 5.130
Finishing
Cartoning
Total non value addedTime
Total Lead time Time
Total non value addedTime
85.1306%
94%
467.225Total Value added Time 2%
98%
Total Lead time TimeTotal Value added Time
0
200
400
600
1 2 3 4
TotalRetentionTime
TotalProcessingTime 0
0.5
1
1 2 3 4
2%
98%
TotalValueaddedTime
0
50
100
1 2 3 4
TotalRetentionTimeTotalProcessingTime
0
0.5
1
1 2 3 4
6%
94%
Total Valueadded Time
Total nonvalueaddedTime