Embed Size (px)
Citation preview

Iranian J Publ Health, Vol. 43, No.6, June 2014, pp. 722-735 Original Article
722 Available at: http://ijph.tums.ac.ir
Reducing Visit-To-Visit Variability in Systolic Blood Pressure for Improving the Progression of Carotid Atherosclerosis and
Endothelial Dysfunction in Patients with Hypertension Management
Hongbin SONG 1,2, *Zhendong LIU 1, Yingxin ZHAO 1, Lin YE 3, Fanghong LU 1, Hua
ZHANG 1, Yutao DIAO 1, Jianchao XU 1,2
1. Cardio-Cerebrovascular Control and Research Center, Institute of Basic Medicine,Shandong Academy of Medical Sciences,
Shandong, China 2. School of Medicine and Life Sciences, University of Jinan-Shandong Academy of Medical Sciences, Shandong, China
3. Dept. of Cardiology, Shandong Provencial Hospital, Shandong, China
*Corresponding Author: Email: [email protected]
(Received 04 Nov 2013; accepted 28 Mar 2014)
Introduction It is well known that hypertension has become a major public health problem which needs to be urgently addressed in the world. Commonly, aver-age blood pressure (BP) level is widely recom-mended by clinical guidelines to be a key compo-
nent in the management of CVD (1-2). However, recent evidences have shown that the protective effect of antihypertension depends on not only reductions in average BP levels but also visit-to-visit variability (VVV) in BP (3-7). VVV in systolic
Abstract Background: Visit-to-visit variability (VVV) in blood pressure (BP) creates challenges to hypertension control and was independent associated with increased all-cause mortality in hypertensive patients. The major goal of the present study was to investigate the association of VVV in systolic (S)BP with progression of carotid atherosclerosis and en-dothelial dysfunction in on-treated hypertensive patients. Methods: Overall, 356 hypertensive patients were enrolled and completed the trial. Clinic BP was measured at base-line and at 3 monthly thereafter. Carotid artery ultrasound and endothelial function were evaluated at baseline and annually follow-up visit. VVV in BP was assessed by standard deviation (SD) and coefficient of variation (CV) of serial follow-up BP measurements. The patients were divided into low, middle, and high group by tertile of SD in SBP. Results: Decrease percentage of maximum intima-media thickness (IMT) and stiffness index β and increase percent-age of brachial flow-mediated dilation (FMD) and nitric oxide (NO) in lower groups were significant greater than in higher groups (P < 0.05). Change percentage of stiffness index β and endothelin-1 positively, and change percentage of FMD and NO negatively correlated with SD, CV, maximum, and delta of SBP (P < 0.05). SD and CV of SBP were risk factors for change percentage of IMT, stiffness index β, FMD, NO, and endothelin-1 independently of other influential factors, such as age, and mean SBP. Conclusion: Excessive VVV in SBP maybe increase carotid atherosclerosis and impair endothelial function in on-treated hypertensive patients. Reducing VVV in SBP is benefit for patients with hypertension management. Keywords: Blood pressure variability, Atherosclerosis, Endothelial dysfunction, Antihypertension

Song et al.: Reducing Visit-To-Visit Variability …
Available at: http://ijph.tums.ac.ir 723
(S) BP has a strong predictor for cardiovascular events, stoke, and renal dysfunction in patients with on-treated hypertension and in patients with a previous transient ischemic attack, independent of mean BP (3). Moreover, it is also associated with increased all-cause mortality independently of age, sex, and average SBP levels (6). Therefore, VVV in BP may be another critical goal besides average BP lowering in management of hyperten-sive patients. VVV in SBP has been verified to be consistent within individuals over time and can be well re-producible (8). It was correlated with 24-h ABP variability in the Anglo-Scandinavian Cardiac Out-comes Trial Blood Pressure Lowering Arm (AS-COT-BPLA) study (3). ABP variability is inde-pendently related to arterial stiffness (9), endothe-lial function (10). From these standpoints, we hy-pothesized that VVV in BP might be also associ-ated with atherosclerosis and endothelial function. However, to the best of our knowledge, the asso-ciation of VVV in BP with the progression of ath-erosclerosis and endothelial dysfunction is also obscured. To elucidate the hypothesis maybe sig-nificantly reduce the cardiovascular morbidity and mortality. It will be benefit for the majority of hy-pertensive patients and reduce the health burden of family and society. Accordingly, at least in some extent, management of VVV in BP will pro-mote the settlement of issues related to public health. In the present study, our major goal was to inves-tigate the relationship of between VVV in SBP and the progression of carotid atherosclerosis and stiffness and endothelial dysfunction in on-treated essential hypertensive patients.
Materials and Methods Study Design and Patients This study was conducted as part of the Chinese Hypertension Intervention Efficacy (CHIEF) study. The design and methods of CHIEF have been reported previously (11-12). From May 2008 and October 2012, we initially recruited 372 hy-pertensive patients from clinics in rural area of
Shandong, China. The mean age was 54.04 ± 7.10 years (range 50-79 years) and there were 191 males and 181 females. Hypertension was diagnosed when the clinic BP was ≥ 140/90mm Hg on at least three occasions, or when there was a previ-ous diagnosis of hypertension with current antihy-pertensive medication use. After potentially eligi-ble patients were washed-out from any previous antihypertensive treatment over a period of 2 weeks, they were randomized to either of the two regiments once daily: amlodipine plus hydrochlo-rothiazide and amlodipine plus telmisartan. In or-der to achieve a BP goal (less than 140/90 mm Hg), the daily doses were titrated from 12.5 mg to 25 mg for hydrochlorothiazide and from 40 mg to 80 mg for telmisartan after 2 weeks. If clinic BP was still uncontrolled after 2 additional weeks, the dosage of amlodipine was increased to 5 mg daily. If clinic BP goal still did not reached, other anti-hypertensive agents including ACE inhibitor, α- or β-adrenoceptor blockers could be added at 2 months at the discretion of the investigator’s opinion. All patients were monitored closely dur-ing the washout period, and an agreement was made that if any potential problem occurred, the antihypertensive treatment would be re-instated, and the patient was removed from the study. Pa-tients were excluded if they were with any of the following conditions: secondary hypertension; ma-jor cardiovascular event; diabetes mellitus, ad-vanced renal dysfunction; advanced hepatic or renal diseases; malignant tumor; gout; pregnancy; difficulty providing informed consent, or any oth-er clinical conditions unsuitable for this trial. Clinical data were collected by investigators or trained research nurses. Parameters were consid-ered in this study as follows: age, gender, smoking, height, weight, antihypertensive agent, lipid lower-ing agent, clinic BP, heart rate, maximum carotid IMT, carotid stiffness index β, brachial flow-medi-ated dilation (FMD), serum concentration of NO, and plasma concentration of ET-1, and clinical laboratory measurements. Clinic BP was measured at baseline and at 3 monthly thereafter follow-up visits. The other parameters were assessed at base-line and annual follow-up visit. Current smoking

Iranian J Publ Health, Vol. 43, No.6, June 2014, pp. 722-735
724 Available at: http://ijph.tums.ac.ir
was defined as smoking within the past year. Body mass index (BMI) = weight (kg)/height2 (m2). Written informed consent was obtained from each patient. This study confirmed to good clini-cal practice guidelines and was conducted in com-pliance with the “Declaration of Helsinki”. The Research Ethics Committee of the Shandong Academy of Medical Sciences approved this study. Clinic BP Measurements and Definition of BP Variability Clinic BP was measured by trained research nurs-es using a fully automatic digital BP monitor (HEM-7071, OMRON). At each clinic visit, three consecutive measurements were obtained in sit-ting position with a 2-min interval after at least 5 min quiet rest and reported on the clinical re-search forms. The average of the three readings was adopted as the representative clinic BP value for the visit. Increasing evidences revealed that standard deviation (SD) or coefficient of variation (CV) of serial visit-to-visit BP measurements is a strong predictor of stroke, left ventricular diastolic dysfunction, cognitive dysfunction, and renal dys-function independent of the mean value of SBP (3-7). Therefore, SD and CV were calculated and use to assess the VVV in BP in the present study. Maximum, minimum, and delta BP were also cal-culated as other parameter of the VVV in BP. CV % = SD/mean BP value × 100 (%). The delta BP = maximum BP - minimum BP. Because 99.6% of BP measurements of all the vis-its (not including dropouts) for key analysis were obtained during the follow-up, above described BP parameters were calculated base on the non-missing values, and multiple imputation method was not organized in our study.
Measurement of Carotid Intima-Media Thick-ness and Arterial Stiffness Index β Carotid artery intima-media thickness (IMT), evaluated noninvasively using high-resolution ul-trasound, is widely used as a marker of early ca-rotid atherosclerosis (13). The common carotid arterial ultrasound was performed by one person experienced with ultrasonography using high-resolution ultrasound (Vivid i, GE Medical Sys-
tems Ultrasound Israel Ltd.) with a handheld 7.5-MHz transducer (7.5-SPC mechanic sector trans-ducer; GE Medical Systems Ultrasound Israel Ltd.) as previously reported (14). Briefly, a region 1 cm proximal to the origin of the bulb of both right and left common carotid arteries was identified using B-mode ultrasound. Digital movies were recorded for 10 seconds while the patient was holding breath. IMT was measured at three differ-ent angles (anterior, lateral, and media) in both common carotid arteries from the lumen-initima interface to the collagen-containing upper layer of the adventitia. Three images of each B-mode, ob-tained, were recorded, digitized, and archived for subsequent analysis. The maximum of the meas-urements was used in the final data analysis to give maximum IMT values. Lumen diameter (D) was measured between the luminal-intimal interface of the near wall and the far wall. Minimum (end-diastolic) and maximum (peak systolic) lumen diameters were obtained from carotid ultrasonography performed. Arterial stiffness index β, mainly used to examine the elas-tic properties of the carotid artery (15), was calcu-lated according to the following equation: stiffness index β = ln(Ps/Pd)/([Ds-Dd]/Dd), where Ps is SBP, Pd is diastolic BP (DBP), and Ds and Dd are carotid systolic and diastolic diameters, respec-tively. Brachial Flow-Mediated Dilation Measure-ment FMD of the brachial artery is a widely accepted clinical tool for indicating peripheral endothelial functions and subclinical atherosclerosis (16-17). Measurement was performed in all patients from 08:00 to 09:30 in a quiet and temperature-con-trolled room (20-25 °C). Smoking, caffeine, alco-hol, vasoactive medications (including nitrates, ACI inhibitors, angiotensin antagonists, and cal-cium antagonists), anti-histamine, and anti-inflam-matory medications were discontinued for 24 h, and overnight fast was also demanded before this measurements. The method of FMD measure-ment was used as previous studies described (18-20). After at least 10 min of lying in the supine position, left brachial artery diameter was meas-
Song et al.: Reducing Visit-To-Visit Variability …
Available at: http://ijph.tums.ac.ir 725
ured by high-resolution ultrasound (Vivid i, GE Medical Systems Ultrasound Israel Ltd.) with a handheld 7.5-MHz transducer (7.5-SPC mechanic sector transducer; GE Medical Systems Ultra-sound Israel Ltd.) at rest and in response to in-creased flow. Increased flow was induced by infla-tion of a pneumatic tourniquet placed around the forearm to a pressure of 200 mm Hg for 5 min, followed by a release. Arterial diameter was meas-ured at end-diastole at a fixed distance from an anatomic marker at baseline and 0.5, 0.75, 1, 1.25, 1.5, 2, 3, 4, 5 min after cuff release. The vessel di-ameter in scans after reactive hyperemia was ex-pressed as the percentage relative to baseline scan. The maximum diameter at 4 or 5 min was used to derive FMD. FMD was computed with the for-mula: (maximum diameter – baseline diame-ter)/baseline diameter×100%. All the FMD meas-urements were performed by one experienced reader.
Blood Sample Collection After an overnight fasting, venous blood samples of each patient were collected in the morning. Se-rum and plasma were separated and stored at -
80℃ immediately for further analysis. Each blood sample was tested in duplicate. The mean value of two measurements was used for analysis. Nitric Oxide Measurement NO is an essential endogenous vasodilator, and contributes to modify the mechanical properties of the arterial wall and regulates vessel blood flow (21) NO concentration in serum was measured by the quantification of nitrite (a stable metabolite of NO) using Griess assay (22). In brief, 100 μl of serum were transferred to a flat-bottom 96-well microtiter plate and mixed with 50 μl of 2% sul-fanilamide in 5% HCl solution and 50 μl of 0.1% N-(1-Naphtyl) ethylendiamine in water sequen-tially. To reduce nitrate to nitrite, 100 μl vanadium chloride III 0.8% was added to each sample and
incubate at 37℃ for one hour. The nitrite concen-tration was determined by measuring optical den-sity using an ELISA-reader (Poweam Medical Sys-tems Co., Ltd.) in 540 nm. All samples were
measured in duplicate to reduce the possibility of laboratory errors and the mean was used to ana-lyze. All reagents were purchased from Sigma (St. Louis, MO, USA). Endothelin-1 Measurement Endothelin-1 (ET-1) is a potent vasoconstrictor and plays a fundamental physiological role in the pathogenesis of atherosclerosis (23). Plasma con-centrations of ET-1 were measured by enzyme-linked immunosorbent assay (ELISA) kits follow-ing the manufacturer’s instructions (Bender MedSystems, Vienna, Austria). The minimum de-tectable concentration was less than 1.0 pg/ml. Intra-assay and inter-assay coefficients of variation for ELISA was less than 5%. All samples were measured in duplicate. Clinical Laboratory Measurements Total cholesterol, triglycerides, high-density lipo-protein cholesterol, low-density lipoprotein cho-lesterol, and fasting plasma glucose were measured by routine enzymatic laboratory methods using a Hitachi 7600 automated biochemical analyzer. Statistical Analyses Statistical analysis was performed using the SPSS for Windows software package, version 17.0 (SPSS Inc., Chicago, IL, USA). Continuous data were expressed as means ± SDs or median with inter-quartile range (IQR, the range between the 25th and 75th percentile) depending on the nor-mality of data. Categorical data were expressed as numbers (percentages). Because the sample size in the present study was small, for increasing the power of analysis, the tertile was selected to cate-gorize SD for further analyses. According to the tertile of mean SD of SBP, patients were divided into three groups, namely, low SD of SBP group (low group), middle SD of SBP group (middle group), and high SD of SBP group (high group). Comparisons of maximum IMT, stiffness index β, brachial FMD, NO, and ET-1 between baseline and end of trial were evaluated by paired-samples t test. Comparisons of demographic, baseline clini-cal characteristics, and change percentages of maximum IMT, stiffness index β, FMD, NO, and

Iranian J Publ Health, Vol. 43, No.6, June 2014, pp. 722-735
726 Available at: http://ijph.tums.ac.ir
ET-1 among three groups were assessed by one way analysis of variance (ANOVA) or Kruskal-Wallis test. If a significant difference was found, Bonferroni procedure with type I error was used to adjust the P value for multiple comparisons. Change percentages were calculated as follows: (value of measures at end of treatment period – value of measures at baseline) / value of measures at baseline × 100 %. The chi-squared test was used to compare categorical variables among three groups. Correlations between any two continuous variables were determined using Pearson correla-tion coefficients, whereas categorical variables were assessed using Spearman correlation in all patients. Subsequently, stepwise multiple regres-sion analysis was performed to select and estimate the independent effects of visit-to-visit BP varia-tions on the change percentages of maximum IMT, stiffness index β, FMD, NO, and ET-1. Each model included following factors were con-sidered simultaneously as independent variables: age, gender, BMI, current smoking status, baseline SBP, baseline DBP, variables of visit-to-visit vari-ability of BP, heart rate, baseline and change per-centages of blood lipid profile, baseline and change percentage fasting plasma glucose, antihy-pertensive agent, statin. Mean visit-to-visit BP was
also adjusted in each model. Values of P < 0.05 were considered statistically significant.
Results Characteristics of the Patients Of 372 patients, 6 died, 4 withdrew, and 6 failed to complete the study during the follow-up period, and they were excluded from the present study. Finally, 356 patients were finished 48th month fol-low-up visit and met the criteria and were assigned to low group (n = 118), middle group (n = 120), and high group (n = 118), respectively, base on tertile of SD of SBP for further analysis. Mean of SD of SBP was 17.36 (SD: 10.24) mm Hg. The first tertile was less than 11.31 mm Hg, the second was from 11.32 to 18.47 mm Hg, and the third was over 18.47 mm Hg. Figure 1 shows the pro-cess for the recruitment of study patients. For overall, the mean age was 54.04 (SD: 7.10) years, and 47.75 % were female. The demographic, base-line clinical characteristics and treatment variables are summarized in Table 1. There were no differ-ences in these variables among three groups (all P > 0.05).
Fig. 1: The process of participants’ recruitment

Song et al.: Reducing Visit-To-Visit Variability …
Available at: http://ijph.tums.ac.ir 727
Univariate Correlations of Visit-to-Visit Varia-bility in Systolic Blood Pressure with Change Percentages of Carotid Maximum Intima-Media Thickness, Arterial Stiffness Index β, Brachial Flow-Mediated Dilation, Nitric Oxide, and Endothelin-1 in Overall We evaluated the correlations of VVV in SBP with change percentages of maximum IMT, stiff-ness index β, FMD, NO, and ET-1 in overall (Ta-ble 2). Change percentages of maximum IMT and ET-1 were positively correlated with SD, CV, maximum, delta, and mean of SBP (P < 0.05). Change percentage of stiffness index β was posi-tively correlated with SD, CV, maximum, and del-ta, and negatively correlated with minimum SBP (P < 0.05). Change percentages of FMD and NO were negatively correlated with SD, CV, maxi-mum, delta, and mean of SBP (P < 0.05). Univariate Correlations of Visit-to-Visit Varia-bility in Diastolic Blood Pressure with Change Percentages of Carotid Maximum Intima-Media Thickness, Arterial Stiffness Index β, Brachial Flow-Mediated Dilation, Nitric Oxide, and Endothelin-1 in Overall We also assessed the correlations of VVV in DBP with change percentages of maximum IMT, stiff-ness index β, FMD, NO, and ET-1 in overall. Ta-ble 3 reveals the correlation coefficients. Change percentage of maximum IMT was positively cor-related with mean and delta DBP (P < 0.05). Change percentages of stiffness index β and ET-1 positively correlated with SD and CV of DBP and delta DBP (P < 0.05). Change percentages of FMD and NO were negatively correlated with SD and CV of DBP, and delta and maximum DBP (P < 0.05). Multiple regression analysis To investigate the potential independently factors associated with change percentages of maximum IMT, stiffness index β, FMD, NO, and ET-1, the multivariate analysis with stepwise was performed (Table 4). In the models, change percentages of maximum IMT, stiffness index β, FMD, NO, and ET-1 were dependent variables, respectively. In-dependent variables were variables that that signif-
icantly correlated with change percentage of max-imum IMT, stiffness index β, FMD, NO, or ET-1 as determined by Pearson’s or Spearman’s correla-tion analysis or were considered as potential con-founding factors as described in Statistical anal-yses section. Mean BP was also adjusted in each model. For change percentage of maximum IMT, there were statistical results for SD and CV of SBP. For change percentage of stiffness index β, there were significant results for SD and CV of SBP, and change percentage of LDL-c. For change percentage of FMD, there were significant results for SD and CV of SBP, change percentage of TG, and baseline LDL-c. For change percent-age of NO, there were significant results for SD and CV of SBP, and delta SBP. For change per-centage of ET-1, there were significant results for SD and CV of SBP, change percentage of TG, and statin treatment. However, most importantly, SD and CV of SBP were always statistically associ-ated with change percentage of maximum IMT, stiffness index β, FMD, NO, and ET-1. Changes of carotid maximum intima-media thickness and arterial stiffness index β in over-all and three groups Figure 2 reveals the change percentages of maxi-mum IMT (Fig. 2A) and stiffness index β (Fig. 2B) during the on-treatment period in overall and three groups. Compared to baseline, maximum IMT elevated in overall [mean difference -0.014, 95% confidence interval (CI) -0.020 to -0.008, P < 0.05] and high group (mean difference -0.042, 95% CI -0.050 to -0.033, P < 0.05), decreased in low group (mean difference 0.008, 95% CI 0.000 to 0.016, P < 0.05), and was no significant change in middle group. Change percentage of maximum IMT [Median (IQR)] was -0.70 (-2.26, 0.72) % in low group, 0.69 (-1.09, 2.37) % in middle group, and 2.98 (1.39, 4.70) % in high group. There were signifi-cant differences between any two groups (F = 39.833, P < 0.05). Compared with baseline, stiffness index β was significantly decreased in overall and three groups. Median (IQR) change percentage of stiffness in-dex β was -11.68 (-14.25, -8.06) %, -8.00 (-10.71, -

Iranian J Publ Health, Vol. 43, No.6, June 2014, pp. 722-735
728 Available at: http://ijph.tums.ac.ir
4.00) %, and -3.00 (-6.00, -0.07) % in from low group to high group, respectively. The decreased percentage of stiffness index β in lower groups was statistically greater than in higher group (F = 47.135, P < 0.05).
Fig. 2: Change percentages of carotid IMT (A) and stiffness index β (B) during the on-treatment period in overall and three groups. Change percentages of ca-rotid IMT and stiffness index β were determined base on the tertile of mean SD of SBP. Results are medians (horizontal bars in boxes) and 25th and 75th percentiles (lower and upper error bars, respectively). IMT, intima-media thickness. *P < 0.05 compared to baseline, †P < 0.05 compared to low group, ‡P < 0.05 compared to middle group
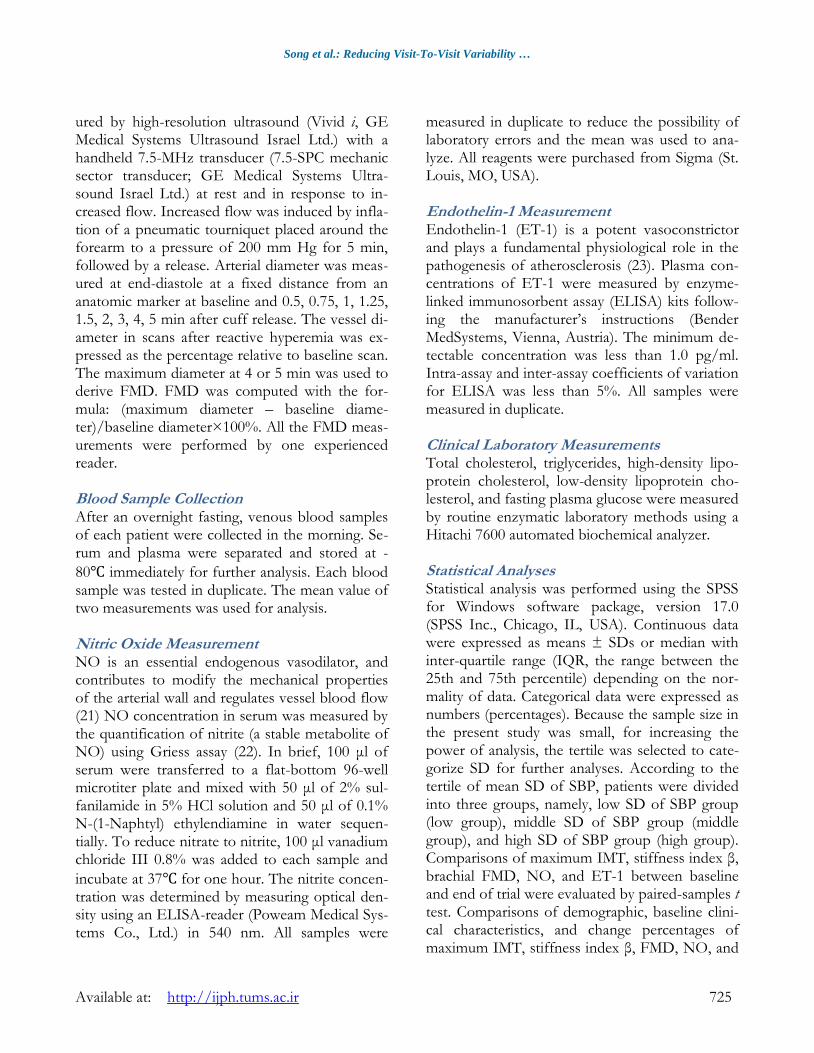
Changes of brachial flow-mediated dilation, nitric oxide, and endothelin-1 in overall and three groups Figure 3 demonstrates the change percentages of brachial FMD (Fig. 3A), NO (Fig. 3B), and ET-1 (Fig. 3C) during the on-treatment period in overall and three groups. Compared to baseline, FMD and NO were statis-tically increased, and ET-1 was statistically de-creased in overall and three groups. Median (IQR) change percentage of FMD was 8.50 (6.57, 9.51) %, 6.30 (4.80, 8.32) %, and 2.47 (0.56, 4.63) %, NO was 25.54 (21.73, 30.45) %, 20.88
(16.25, 25.48) %, 12.92 (7.45, 19.69) %, and ET-1 was -8.59 (-11.00, -5.95) %, -7.00 (-10.18, -4.00) %, -2.00 (-5.00, 0.40) % in from low group to high group, respectively. The increased percentages of FMD (F = 58.612, P < 0.05) and NO (F = 45.648, P < 0.05) in lower groups were statistically greater than in higher groups. For the decreased percent-age of ET-1, it was markedly lower in high group than in low (mean difference -1.554, 95% CI -3.344 to 0.237, P < 0.05) and middle group (mean difference -4.509, 95% CI -6.299 to -2.718, P < 0.05); there was no difference between low group and middle group (P > 0.05).
Fig. 3: Change percentages of brachial FMD (A), NO (B), and ET-1 (C) during the on-treatment period in overall and three groups. Change percentages of FMD, NO, and ET-1 were determined base on the tertile of mean SD of SBP. Results are medians (horizontal bars in boxes) and 25th and 75th percentiles (lower and upper error bars, respectively). FMD, flow-mediated dilation; NO, nitric oxide; ET-1, endothelin-1. *P < 0.05 compared to baseline, †P < 0.05 compared to low group, ‡P < 0.05 compared to middle group

Song et al.: Reducing Visit-To-Visit Variability …
Available at: http://ijph.tums.ac.ir 729
Table 1: Baseline demographic and clinical characteristics in overall and in three groups base on tertile of visit-to-visit variability of systolic blood pressure
Characteristics Overall(n = 356) Tertile of SD of SBP χ2 value F val-ue
P value
Low group(n = 118) Middle group (n = 120)
High group (n = 118)
Gender, female(%)* 170 (47.75) 55 (46.61) 64 (53.33) 51 (43.22) 2.531 0.282
Age (year)‡ 54.04 ± 7.10 53.50 ± 6.85 53.91 ± 7.11 54.71 ± 7.40 0.421 0.657
BMI (kg/m2)† 25.59 (23.93, 28.04) 25.90 (23.81, 27.72) 25.59 (24.05, 28.19) 25.45 (23.93, 28.04) 0.978
Smoker, n(%)* 50 (14.04) 17 (14.41) 13 (10.83) 20 (16.95) 1.862 0.394
SBP (mm Hg)† 156.50 (149.00, 167.25)
155.75 (149.00, 164.25)
157.00 (149.50, 169.00) 156.50 (148.25, 170.00) 0.114 0.877
DBP (mm Hg)† 92.50 (86.50, 96.00) 91.25 (85.38, 95.50) 93.00 (86.75, 96.75) 93.50 (85.00, 96.00) 0.141 0.843
Heart rate (beats/min) ‡ 75.21 ± 10.38 74.80 ± 9.71 76.26 ± 8.36 74.54 ± 12.73 0.451 0.637
TCHO (mmol/L) 5.54 ± 1.02 5.63 ± 1.03 5.69 ± 0.87 5.28 ± 1.11 2.664 0.073
TG (mmol/L)† 1.60 (1.15, 2.10) 1.60 (1.20, 2.28) 1.50 (1.20, 2.05) 1.60 (0.93, 2.10) 0.863 0.589
HDL-c (mmol/L)† 1.30 (1.10, 1.50) 1.30 (1.03, 1.50) 1.30 (1.20, 1.55) 1.20 (1.10, 1.40) 1.697 0.165
LDL-c (mmol/L)‡ 3.11 ± 0.81 3.31 ± 0.74 3.09 ± 0.92 2.95 ± 0.73 2.915 0.057
FPG (mmol/L)† 5.90 (5.40, 6.50) 5.75 (5.40, 6.48) 5.80 (5.40, 6.15) 6.10 (5.53, 7.25) 1.378 0.150
Hydrochlorothiazide n (%)* 178 (50.00) 57 (48.31) 60 (50.00) 61 (51.69) 0.271 0.873
CCBs n (%)* 348 (97.75) 116 (98.31) 118 (98.33) 114 (96.61) 1.049 0.592
ARBs n (%)* 175 (49.16) 61 (51.69) 57 (47.50) 57 (48.31) 0.470 0.790
Statinn (%)* 128(35.96) 40 (33.90) 48 (40.00) 40 (33.90) 1.286 0.526
Maximum IMT (mm)‡ 1.46 ± 0.31 1.45 ± 0.30 1.47 ± 0.31 1.45 ± 0.32 0.093 0.911
Stiffness index β (%) ‡ 3.50 ± 0.32 3.50 ± 0.30 3.48 ± 0.33 3.51 ± 0.33 0.182 0.834
FMD (%) ‡ 8.25 ±2.64 8.51±2.49 8.10±2.69 8.14±2.77 0.419 0.658
NO (μmol/L)‡ 59.06 ± 7.99 58.28 ± 8.87 60.00 ± 7.71 58.88 ± 7.36 0.668 0.514
ET-1 (pg/ml)‡ 40.93 ± 6.32 40.07 ± 6.50 40.91 ± 6.36 41.81 ± 6.09 1.055 0.350
Results are mean ± standard deviation or medians (25th, 75th percentiles)./ Abbreviation: BMI, body mass index; SBP, systolic blood pressure; DBP, diastolic blood pressure; TCHO, total cholesterol; TG, triglycerides; HDL-c, high-density lipoprotein cholesterol; LDL-c, low-density lipoprotein cholesterol; FPG, fasting plasma glucose; ; CCB, calcium channel blocker; ARB, angiotensin receptor blocker; IMT, intima-media thickness; FMD, flow-mediated dilation; NO, nitric oxide; ET-1, endothelin-1./ *Chi-square test; † Kruskal-Wallis tests; ‡ one way analysis of variance.

Iranian J Publ Health, Vol. 43, No.6, June 2014, pp. 722-735
730 Available at: http://ijph.tums.ac.ir
Table 2: Pearson correlation coefficients of variability in systolic blood pressure with change percentages of carotid artery measures and endothelial function measures
SD of SBP (mm Hg) CV of SBP (%) Max SBP (mm Hg)
Min SBP (mm Hg)
Delta SBP (mm Hg)
Variables Correlation coefficient
P value Correlation coefficient
P value Correlation coefficient
P value Correlation coefficient
P val-ue
Correlation coefficient
P value
Change percentage of maximum IMT(%) 0.647 0.000 0.647 0.000 0.421 0.000 -0.011 0.917 0.473 0.000 Change percentage of stiffness index β (%) 0.640 0.000 0.637 0.000 0.431 0.000 -0.234 0.028 0.607 0.000 Change percentage of FMD (%) -0.683 0.000 -0.683 0.000 -0.473 0.000 0.044 0.683 -0.502 0.000 Change percentage of NO (%) -0.715 0.000 -0.704 0.000 -0.529 0.000 0.188 0.079 -0.662 0.000 Change percentage of ET-1 (%) 0.554 0.000 0.540 0.000 0.432 0.000 -0.040 0.714 0.434 0.000
Abbreviation: SBP, systolic blood pressure; SD, standard deviation; CV, coefficient of variation; max, maximum; min, minimum; IMT, intima-media thickness; FMD, flow-mediated dilation; NO, nitric oxide; ET-1, endothelin-1. Table 3: Pearson correlation coefficients of variability in diastolic blood pressure with change percentages of carotid artery measures and endothelial function measures
SD of DBP (mm Hg) CV of DBP (%) Max DBP (mm Hg)
Min DBP (mm Hg)
Delta DBP (mm Hg)
Variables Correlation coefficient
P value Correlation coefficient
P value Correlation coefficient
P value Correlation coefficient
P value Correlation coefficient
P value
Change percentage of maximum IMT (%) 0.125 0.105 0.135 0.080 0.075 0.336 -0.111 0.151 0.171 0.026
Change percentage of stiffness index β (%) 0.176 0.022 0.181 0.019 0.048 0.538 -0.133 0.084 0.163 0.034
Change percentage of FMD (%) -0.245 0.001 -0.247 0.001 -0.178 0.021 0.045 0.563 -0.219 0.004
Change percentage of NO (%) -0.183 0.017 -0.185 0.016 -0.156 0.043 0.068 0.381 -0.217 0.005
Change percentage of ET-1 (%) 0.179 0.020 0.185 0.016 0.169 0.028 -0.053 0.493 0.217 0.005
Abbreviation: DBP, diastolic blood pressure; SD, standard deviation; CV, coefficient of variation; max, maximum; min, minimum; IMT, intima-me-dia thickness; FMD, flow-mediated dilation; NO, nitric oxide; ET-1, endothelin-1.

Song et al.: Reducing Visit-To-Visit Variability …
Available at: http://ijph.tums.ac.ir 731
Table 4: Stepwise linear regression of the coefficient of factors independently associated with change percentages of carotid artery measures and en-dothelial function measures over the on-treatment period *
Trait Change percentage of maximum IMT (%)
Change percentage e of stiffness index β(%)
Change percentageof FMD (%)
Change percentage of NO (%)
Change percentage of ET-1 (%)
B (95% CI) P value B (95% CI) P value B (95% CI) P value B (95% CI) P value B (95% CI) P value
SD of SBP 0.665 (0.545, 0.785)
< 0.001 1.388 (1.139, 1.638)
< 0.001
-0.905 (-1.053, -0.756)
< 0.001
-2.314 (-2.660, -1.986)
< 0.001
0.993 (0.761, 1.224)
< 0.001
CV of SBP 0.874 (0.716, 1.031)
< 0.001 1.815 (1.486, 2.144)
< 0.001
-1.176 (-1.375, -0.978)
< 0.001
-1.479 (-2.900, -0.058)
0.041 1.285 (0.961, 1.556)
< 0.001
Change percentage of LDL-c
-- -- 0.080 (0.010, 0.151)
0.025 -- -- -- -- -- --
Delta SBP -- -- -- -- -- -- -0.320 (-0.604, -0.058)
0.027 -- --
Change percentage of TG
-- -- -- -- 0.101 (0.020, 0.182)
0.015 -- -- -0.126 (-0.249, -0.003)
0.044
Baseline LDL-c -- -- -- -- 0.489 (0.021, 0.975)
0.041 -- -- -- --
Statin -- -- -- -- -- -- -- -- -1.761 (-2.957, -0.564)
0.004
Abbreviation: B, unstandardized regression coefficient; IMT, intima-media thickness; FMD, flow-mediated dilation; NO, nitric oxide; ET-1, endo-thelin-1; SBP, systolic blood pressure; SD, standard deviation; CV, coefficient of variation; TG, triglycerides; LDL-c, low-density lipoprotein choles-terol. *Factors included as potentially independent variables were age, gender, BMI, current smoking status, baseline SBP, baseline DBP, variables of visit-to-visit variability of BP, heart rate, baseline and change percentages of blood lipid profile, baseline and change percentage fasting plasma glucose, antihypertensive treatment agent, statin. Mean visit-to-visit BP was also adjusted in each model.

Iranian J Publ Health, Vol. 43, No.6, June 2014, pp. 722-735
732 Available at: http://ijph.tums.ac.ir
Discussion In this study, we evaluated relationships between VVV in BP and the progression of atherosclerosis and endothelial dysfunction in on-treated essential hypertensive patients. The major findings were those, 1) decreased percentages of carotid maxi-mum IMT, stiffness index β, and ET-1, and in-creased percentages of brachial FMD and NO in lower groups base on the tertile of SD of SBP were significant greater than in higher groups, 2) change percentages of maximum IMT, stiffness index β, FMD, NO, and ET-1 were significantly correlated with measures of VVV in BP, especially VVV in SBP, 3) SD and CV of SBP were risk fac-tors for IMT, stiffness index β, FMD, NO, and ET-1 independently of other influential factors, such as mean SBP and DBP, baseline SBP and DBP. SD and CV of Serial SBP Measurement Either SD or CV of SBP is on behalf of the devia-tion of SBP from the mean, and is recognized to be static over time (24). Levitan et al. (25) re-ported that there was a strong correlation between SD of SBP and CV of SBP (r = 0.99) and they convey the similar information. In this respect, patients were only categorized by tertile of SD of SBP, although CV of SBP was used to other anal-ysis such as univariate correlations and multiple regression analysis. Visit-to-Visit Variability of BP and Target Or-gan Damage The primary goals of antihypertensive treatment are to protect against the development and pro-gression of subclinical organ damage, and to di-rectly prevent cardiovascular events (26). Studies have shown the BP variability, independently of mean BP, associated with increased risk of early atherosclerosis (27), target organ damage (28), and cardiovascular events (29). However, VVV in SBP is usually dismissed as an obstacle to a limitation of measuring BP in the office setting and the relia-ble estimation of usual BP (30).
Studies (6,31) reported that VVV in BP to be a powerful predictor of all-cause mortality in pa-tients with type 2 diabetes. Subjects in the middle and highest tertiles of VVV in SBP had greater risk of all-cause mortality than subjects in the low-est tertile of VVV in SBP (6). In the high risk el-derly, excessive VVV in BP was a significant indi-cator for carotid artery atherosclerosis and stiff-ness independently of mean BP (32). In an animal study (33), using sinoaortic-denervation (SAD) rats, high BP variability was revealed to be one of an important cause of impaired endothelial func-tion. BP variability closely correlated with FMD and the vascular smooth muscle response to NO independent of age, body mass index and mean BP levels in African Americans (10). In our study, consistent with the above researches, progression of IMT, stiffness index β, ET-1, FMD, and NO correlated with measures of VVV in BP, especially SD and CV of SBP. After controlled for potential confounders including age, visit-to-visit mean SBP and DBP, baseline SBP and DBP, and antihypertensive therapy, SD and CV of SBP were always risk factors for progression of carotid IMT, stiffness index β, FMD, NO, and ET-1 inde-pendently. However, results of European Lacidipine Study on Atherosclerosis (ELSA) (34) using post-hoc analysis shown that mean on-treatment clinic or 24-h SBP, not CV or SD of SBP was associated with carotid IMT evolution. In a study of healthy individuals followed-up over a 12-year period, VVV in SBP did not contribute to risk stratifica-tion beyond mean SBP (35). This maybe due to some reasons such as predominantly disease-free participants, short duration of trial, and less cardi-ovascular outcomes (5, 36).
Limitation and Further Direction There were also several limitations to our study. Firstly, as the present study was part of the CHIEF study, our sample size was small. This may induce some bias in the study. Secondly, the study patients were only recruited in Chinese population; therefore, it is uncertain whether our

Song et al.: Reducing Visit-To-Visit Variability …
Available at: http://ijph.tums.ac.ir 733
findings are generalized in other ethnic groups. Thirdly, fluctuations of BP can be influenced by several factors such as autonomic nervous system, lifestyle, as well as atherosclerosis (26, 37). The function of autonomic nervous system and life-style were not included in the study. Fourthly, medication possession ratio of patients was not included in the present study, although it was greater than 97.50%. Finally, eight patients exclu-sion from the analyses might have introduced a bias in this study. Therefore, more, large and fur-ther prospective trials are necessarily needed.
Conclusion
Our study documents that excessive VVV in SBP maybe increase carotid atherosclerosis, impair en-dothelial function, and reduce the benefit of anti-hypertensive treatment in on-treated essential hy-pertensive patients. Reducing visit-to-visit BP fluctuation might be regarded as a potentially es-sential therapeutic target in patients with hyper-tension management.
Ethical considerations Ethical issues (Including plagiarism, Informed Consent, misconduct, data fabrication and/or fal-sification, double publication and/or submission, redundancy, etc.) have been completely observed by the authors.
Acknowledgments This work was supported by the Ministry of Sci-ences and Technology of the People’s Republic of China (No. 2006BAI01A03), Shandong Science and Technology Development Program, China (No. 2012GGB14094), and Natural Science Foundation of Shandong Province, China (NOs. ZR2011HQ053, ZR2011HL053, and ZR2012HL46).
We would like to express our gratitude to Suzhou Dawnrays Pharmaceutical (Holdings) Limited for providing the trial drugs. And we would like to thank the doctors participating in this study. The
authors declare that there is no conflict of inter-ests.
References
1. Mancia G, Fagard R, Narkiewicz K, Redon J et al. (2013). 2013 ESH/ESC Guidelines for the management of arterial hypertension: The Task Force for themanagement of arterial hy-pertension of the European Society of Hyper-tension (ESH) and of the European Society of Cardiology (ESC). Eur Heart J, 34:2159-219.
2. Chobanian AV, Bakris GL, Black HR et al. (2003). The Seventh Report of the Joint National Committee on Prevention, Detection, Evalua-tion, and Treatment of High Blood Pressure: the JNC 7 report. JAMA, 289:2560-2572.
3. Rothwell PM, Howard SC, Dolan E, O’Brien e, Dobson JE, Dahlöf B, Sever PS, Poulter NR (2010). Prognostic significance of visit-to-visit variability, maximum systolic blood pressure, and episodic hypertension. Lancet, 375:895-905.
4. Muntner P, Levitan EB (2013). Visit-to-visit vari-ability of blood pressure: current knowledge and future research directions. Blood Press Monit, 18:232-238.
5. Rossignol P, Kessler M, Zannad F (2013). Visit-to-visit blood pressure variability and risk for progression of cardiovascular and renal dis-eased. Curr Opin Nephrol Hypertens, 22:59-64.
6. Muntner P, Shimbo D, Tonelli M, Reynolds K, Arnett DK, Oparil S (2011). The relationship between visit-to-visit variability in systolic blood pressure and all-cause mortality in the general population: findings from NHANES III, 1988 to 1994. Hypertension, 57:160-166.
7. Kawai T, Ohishi M, Kamide K, Onishi M, Takeya Y, Tatara Y, Oguro R, Yamamoto K, Sugimoto K, Rakugi H (2012). The impact of visit-to-visit variability in blood pressure on re-nal function. Hypertens Res, 35:239-243.
8. Muntner Paul, Joyce C, Levitan EB, Holt E, Shimbo D, Webber LS, Oparil S, Re R, Krou-sel-Wood M (2011). Reproducibilty of visit-to-visit variability of blood pressure measured as part of routine clinical care. J Hypertens, 29:2332-2338.
9. García-García Á, García-Ortiz L, Recio-Rodríguez JI, Patino-Alonso MC, Agudo-Conde C, Rodriguez-Sanchez E, Gómez-Mar-

Iranian J Publ Health, Vol. 43, No.6, June 2014, pp. 722-735
734 Available at: http://ijph.tums.ac.ir
cos MA (2013). Relationship of 24-h blood pressure variability with vascular structure and function in hypertensive patients. Blood Press Monit, 18:101-106.
10. Diaz KM, Veerabhadrappa P, Kashem MA, Feairheller DL, Sturgeon KM, Williamson ST, Crabbe DL, Brown MD (2012). Relationship of visit-to-visit and ambulatory blood pressure variability to vascular function in African Americans. Hyperten Res, 35:55-61.
11. Wang W, Ma L, Zhang Y, Deng Q, Liu M, Liu L (2011). The combination of amlodipine and angiotensin receptor blocker or diuretics in high-risk hypertensive patients: rationale, de-sign and baseline characteristics. J Hum Hyper-tens, 25:271-277.
12. Lu F, Zhao Y, Liu Z, Sun H, Zhao Y, Sun S, Wang S (2012). A 48-week study of amlodi-pine plus amiloride/hydrochlorothiazide vs. amlodipine plus telmisartan in the treatment of hypertension. Int J Clin Pract, 66:792-799.
13. O’Leary DH, Polak JF, Kronmal RA, Manolio TA, Burke GL, Wolfson SK Jr (1999). Carot-id-artery intima and media thickness as a risk factor for myocardial infarction and stroke in older adults. Cardiovascular Health Study Col-laborative Research Group. N Engl J Med, 340:14-22.
14. Liu Z, Lu F, Pan H, Zhao Y, Wang S, Sun S, Li J, Hu X, Wang L (2012). Correlation of periph-eral Th17 cells and Th17-associated cytokines to the severity of carotid artery plaque and its clinical implication. Atherosclerosis, 221:232-241.
15. Hirai T, Sasayama S, Kawasaki T, Yagi S (1989). Stiffness of systemic arteries in patients with myocardial infarction. A noninvasive method to predict severity of coronary atherosclerosis. Circulation, 80:78-86.
16. Cho SH, Jeong MH, Park IH, Choi JS, Yoon HJ, Kim KH, Homg YJ, Park HW, Kim JH, Ahn Y, Cho JG, Kang JC (2009). Endothelial dys-function, increased carotid artery intima-media thickness and pulse wave velocity, and in-creased level of inflammatory markers are as-sociated with variant angina. J Cardiol, 54:183-191.
17. Juonala M, Viikari JS, Laitinen T, Marniemi J, He-lenius H, RÖnnemaa T, Raitakari OT (2004). Interrelations between brachial endothelial function and carotid intima-Media thickness in young adults. Circulation, 110:2918-2923.
18. Thijssen DH, Black MA, Pyke KE, Padilla J, Atinson G, Harris RA, Parker B, Widlansky ME, Tschakovaky ME, Green DJ (2011). As-sessment of flow-mediated dilation in humans: a methodological and physiological guideline. Am J Physiol Heart Circ Physiol, 300:H2-H12.
19. Flammer AJ, Anderson T, Celermajer DS, Cre-ager MA, Deanfield J, Ganz P, Hamburg NM, Lüscher TF, Shechter M, Taddei S, Vita JA, Lerman A (2012). The assessment of endothe-lial function: from research into clinical prac-tice. Circulation, 126:753-767.
20. Vanmolkot FH, Van Bortel LM, de Hoon JN (2007). Altered arterial function in migraine of recent onset. Neurology, 68:1563-1570.
21. Lu X, Kassab GS (2004). Nitric oxide is signifi-cantly reduced in ex vivo porcine arteries dur-ing reverse flow because of increased superox-ide production. J Physiol, 561:575-582.
22. Green LC, Wagner DA, Glogowski J, Skipper PL, Wishnok JS, Tannenbaum SR (1982). Analysis of nitrate, nitrite and [15N] nitrate in biological fluids. Analyt Biochem, 126:131-138.
23. Noshad H, Argani H, Nezami N, Ghojazadeh M, Zomorrodi A, Bohlouli A, Bonyadi MR, Fakhruou A, Ghorbanihaghjo A, Gharedaghi A, Javadzadegan H, Sadreddini S (2009). Arte-rial atherosclerosis in patients with chronic kidney disease and its relationship with serum and tissue endothelin-1 [corrected]. Iran J Kid-ney Dis, 3:203-209.
24. Shimbo D, Newman JD, Aragaki AK, LaMonte MJ, Bavry AA, Allison M, Manson JE, Was-sertheil-Smoller S (2012). Association between annual visit-to-visit blood pressure variability and stroke in postmenopausal women: data from the Women’s Health Initiative. Hyperten-sion, 60:625-630.
25. Levitan EB, Kaciroti N, Oparil S, Julius S, Munt-ner P (2013). Relationships between metrics of visit-to-visit variability of blood pressure. J Hum Hypertens, 27:589-593.
26. Parati G, Ochoa JE, Lombardi C, Bilo G (2013). Assessment and management of blood-pressure variability. Nat Rev Cardiol, 10:143-155.
27. Sander D, Kukla C, Klingelhöfer J, Winbeck K, Conrad B (2000). Relationship between circa-dian blood pressure patterns and progression of early carotid atherosclerosis A 3-year follow-up study. Circulation, 102:1536-1541.
28. Sega R, Corrao G, Bombelli M, Beltrame L, Fac-

Song et al.: Reducing Visit-To-Visit Variability …
Available at: http://ijph.tums.ac.ir 735
chetti R, Grassi G, Ferrario M, Mancia G (2002). Blood pressure variability and organ damage in a general population results from the PAMELA study (Pressioni Arteriose Mon-itorate E Loro Associazioni). Hypertension, 39:710-714.
29. Kikuya M, Hozawa A, Ohokubo T, Tsuji I, Michimata M, Matsubara M, Ota M, Nagai K, Araki T, Satoh H, Ito S, Hisamichi S, Imai Y (2000). Prognostic significance of blood pres-sure and heart rate variabilities the Ohasama study. Hypertension, 36:901-906.
30. Clarke R, Shipley M, Lewington S, Youngman L, Collins R, Marmot M, Peto R (1999). Underes-timation of risk associations due to regression dilution in long-term follow-up of prospective studies. Am J Epidemiol, 150:341-353.
31. Hsieh YT, Tu ST, Cho TJ, Chang SJ, Chen JF, Hsieh MC (2012). Visit-to-visit variability in blood pressure strongly predicts all-cause mor-tality in patients with type 2 diabetes: a 5.5-year prospective analysis. Eur J Clin Invest, 42:245-253.
32. Nagai M, Hoshide S, Ishikawa J, Shimada K, Ka-rio K (2011). Visit-to-visit blood pressure vari-ations: new independent determinants for ca-
rotid artery measures in the elderly at high risk of cardiovascular disease. J Am Soc Hypertens, 5:184-192.
33. Norman Jr RA, Coleman TG, Dent AC (1981). Continuous monitoring of arterial pressure in-dicated sinoaortic denervated rats are not hy-pertensive. Hypertension, 3:119-125.
34. Mancia G, Facchetti R, Parati G, Zanchetti A (2012). Visit-to-visit blood pressure variability, carotid atherosclerosis, and cardiovascular events in the European Lacidipine Study on Atherosclerosis. Circulation, 126:569-578.
35. Schutte R, Thijs L, Liu YP, Asayama K, Jin Y, Odili A, Gu YM, Kuznetsova T, Jacobs L, Staessen JA (2012). Within-subject blood pres-sure level-not variability-predicts fatal and non-fatal outcomes in a general population. Hyper-tension, 60:1138-1147.
36. Krakoff LR (2012). Fluctuation: does blood pres-sure variability matter? Circulation, 126:525-527.
37. Liu Z, Wei F, Zhao Y, Lu F, Zhang H, Diao Y, Song H, Qi Z (2013). Day-by-day variability of self-measured blood pressure at home associ-ated with cold pressor test norepinephrine, and heart rate variability in normotensive to mod-erate hypertensive. Int J Cardiol, 168:4574-4576.