Embed Size (px)
Citation preview
Reducing risk and cost through an
optimised inspection approach
February 2017
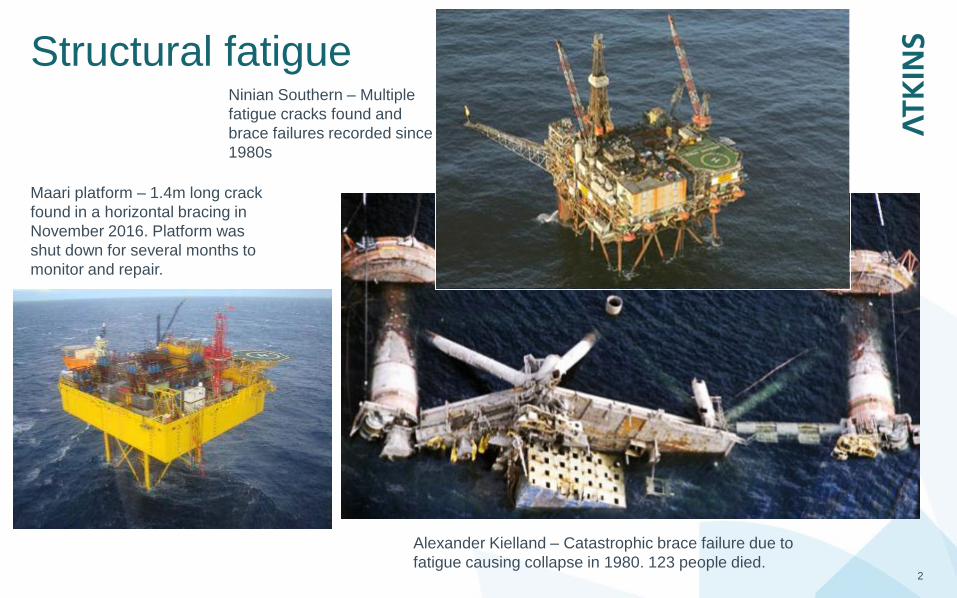
Structural fatigue
2
Alexander Kielland – Catastrophic brace failure due to
fatigue causing collapse in 1980. 123 people died.
Maari platform – 1.4m long crack
found in a horizontal bracing in
November 2016. Platform was
shut down for several months to
monitor and repair.
Ninian Southern – Multiple
fatigue cracks found and
brace failures recorded since
1980s
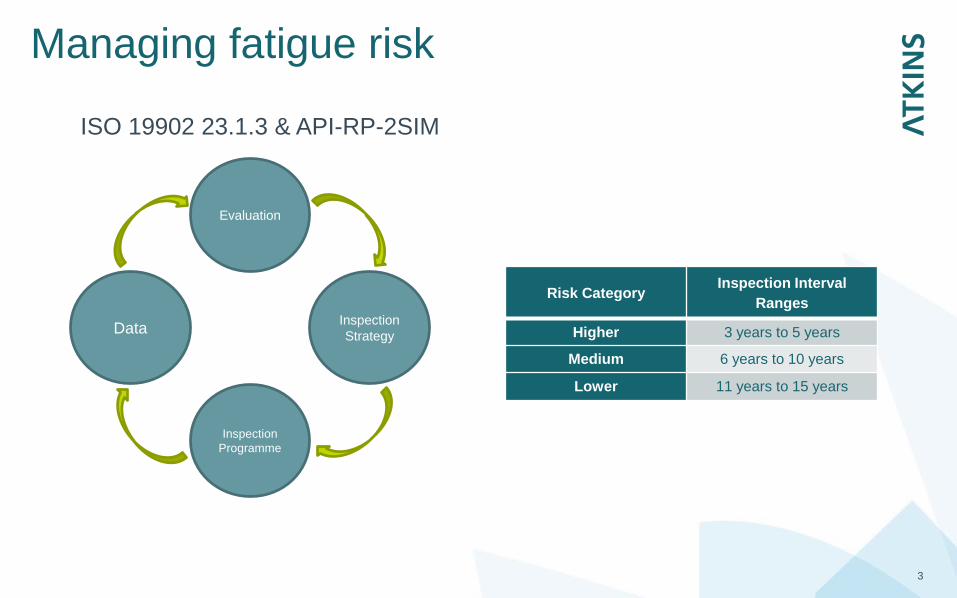
Managing fatigue risk
3
ISO 19902 23.1.3 & API-RP-2SIM
Risk CategoryInspection Interval
Ranges
Higher 3 years to 5 years
Medium 6 years to 10 years
Lower 11 years to 15 years
Data
Evaluation
Inspection
Programme
Inspection
Strategy
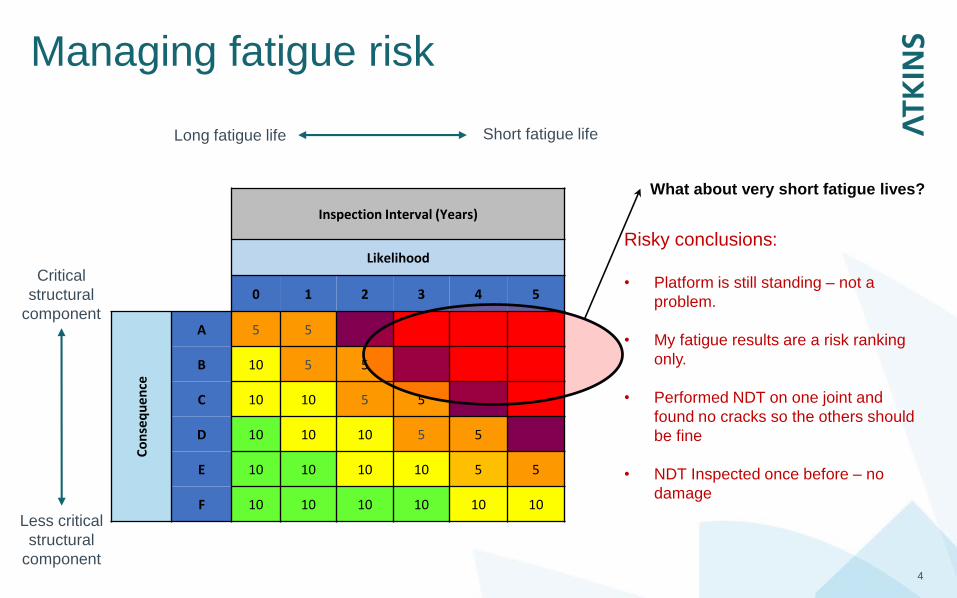
Managing fatigue risk
4
Inspection Interval (Years)
Likelihood
0 1 2 3 4 5
Co
nse
qu
ence
A 5 5
B 10 5 5
C 10 10 5 5
D 10 10 10 5 5
E 10 10 10 10 5 5
F 10 10 10 10 10 10
Long fatigue life Short fatigue life
Critical
structural
component
Less critical
structural
component
Risky conclusions:
• Platform is still standing – not a
problem.
• My fatigue results are a risk ranking
only.
• Performed NDT on one joint and
found no cracks so the others should
be fine
• NDT Inspected once before – no
damage
What about very short fatigue lives?
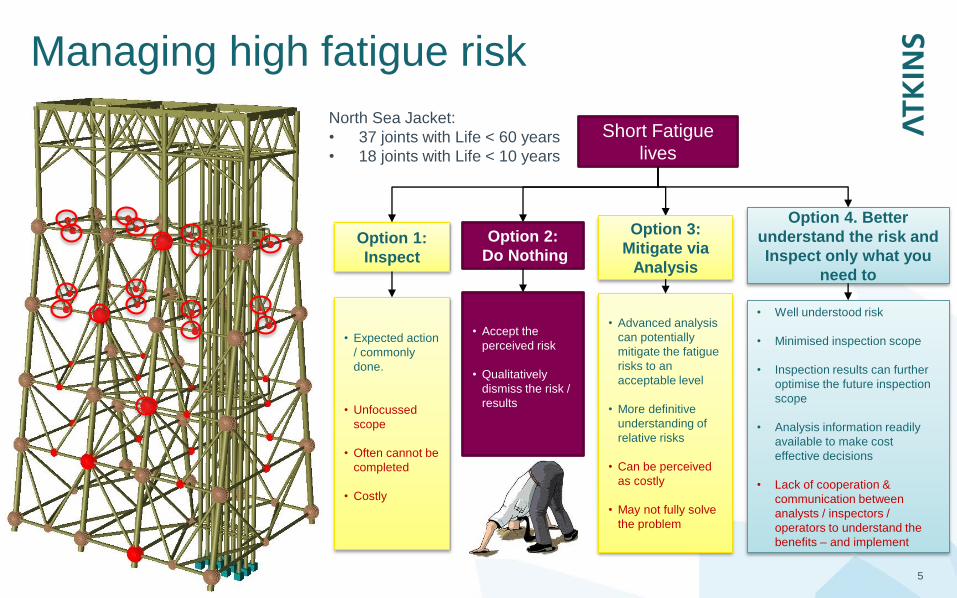
Managing high fatigue risk
5
North Sea Jacket:
• 37 joints with Life < 60 years
• 18 joints with Life < 10 years
Option 2:
Do Nothing
• Accept the
perceived risk
• Qualitatively
dismiss the risk /
results
Option 3:
Mitigate via
Analysis
• Advanced analysis
can potentially
mitigate the fatigue
risks to an
acceptable level
• More definitive
understanding of
relative risks
• Can be perceived
as costly
• May not fully solve
the problem
Short Fatigue
lives
Option 1:
Inspect
• Expected action
/ commonly
done.
• Unfocussed
scope
• Often cannot be
completed
• Costly
Option 4. Better
understand the risk and
Inspect only what you
need to
• Well understood risk
• Minimised inspection scope
• Inspection results can further
optimise the future inspection
scope
• Analysis information readily
available to make cost
effective decisions
• Lack of cooperation &
communication between
analysts / inspectors /
operators to understand the
benefits – and implement
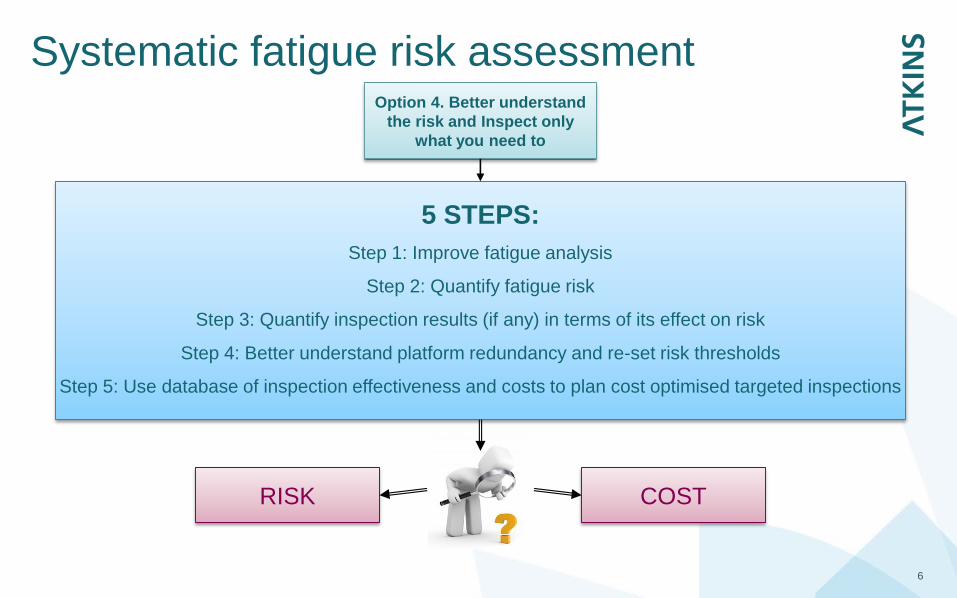
Systematic fatigue risk assessment
6
5 STEPS:
Step 1: Improve fatigue analysis
Step 2: Quantify fatigue risk
Step 3: Quantify inspection results (if any) in terms of its effect on risk
Step 4: Better understand platform redundancy and re-set risk thresholds
Step 5: Use database of inspection effectiveness and costs to plan cost optimised targeted inspections
Option 4. Better understand
the risk and Inspect only
what you need to
COSTRISK
7
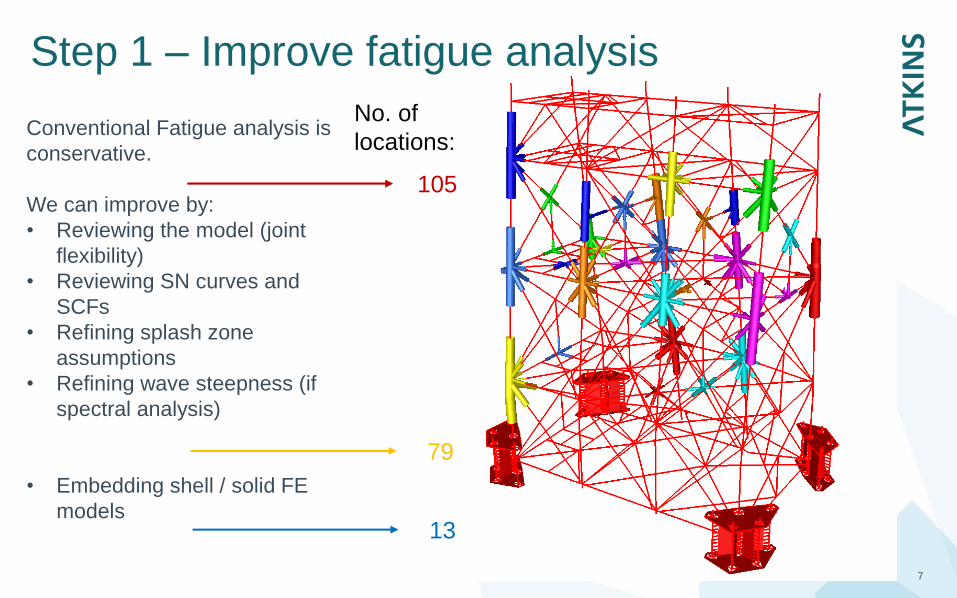
Conventional Fatigue analysis is
conservative.
We can improve by:
• Reviewing the model (joint
flexibility)
• Reviewing SN curves and
SCFs
• Refining splash zone
assumptions
• Refining wave steepness (if
spectral analysis)
• Embedding shell / solid FE
models
Step 1 – Improve fatigue analysis
No. of
locations:
105
79
13
1E-8
1E-7
1E-6
1E-5
1E-4
1E-3
1E-2
1E-1
1E+0
0 2 4 6 8 10 12 14 16 18 20
An
nu
al F
ailu
re R
ate
Time (Yrs)
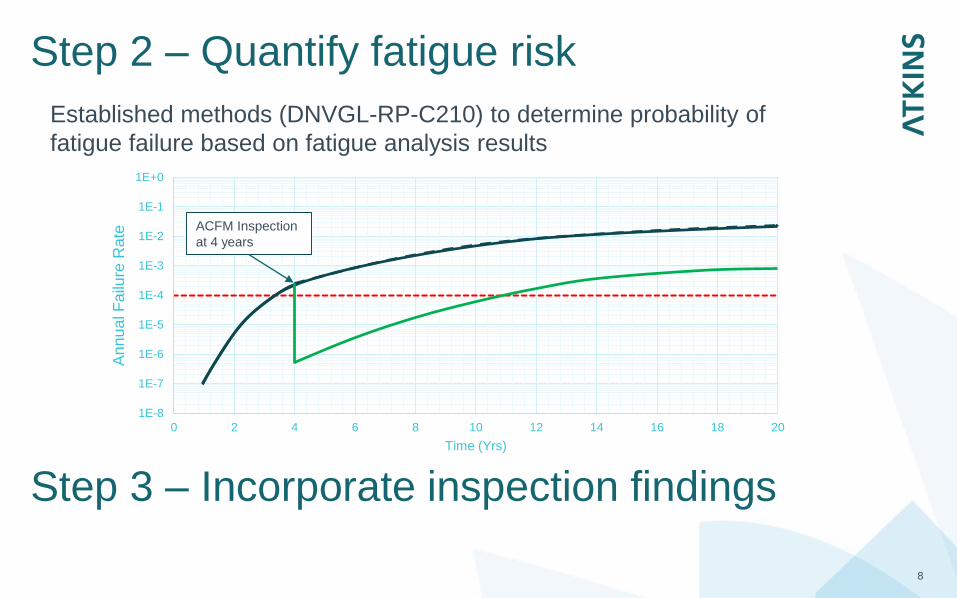
Step 2 – Quantify fatigue risk
8
Step 3 – Incorporate inspection findings
Established methods (DNVGL-RP-C210) to determine probability of
fatigue failure based on fatigue analysis results
ACFM Inspection
at 4 years
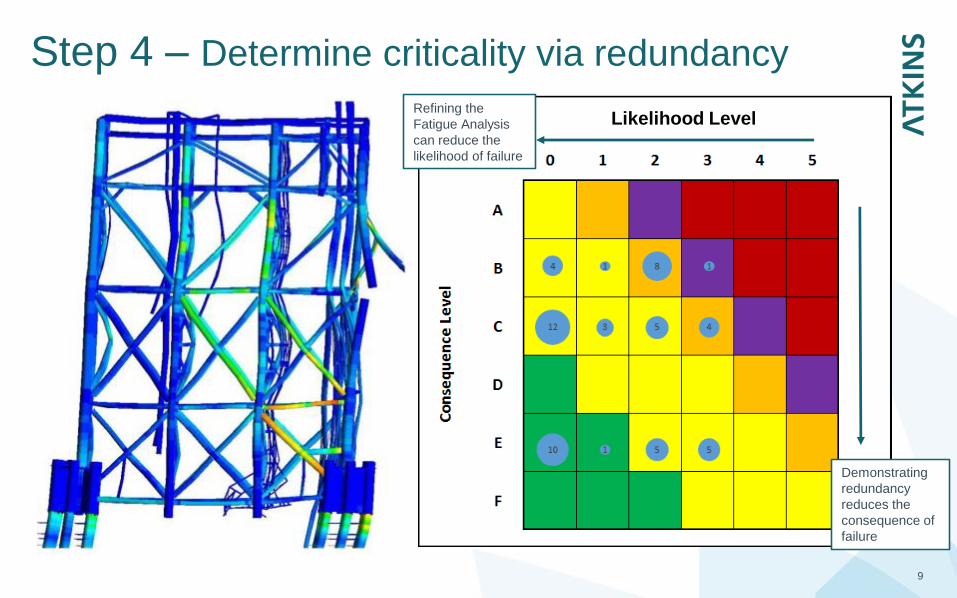
Step 4 – Determine criticality via redundancy
9
Refining the
Fatigue Analysis
can reduce the
likelihood of failure
Demonstrating
redundancy
reduces the
consequence of
failure
Likelihood Level
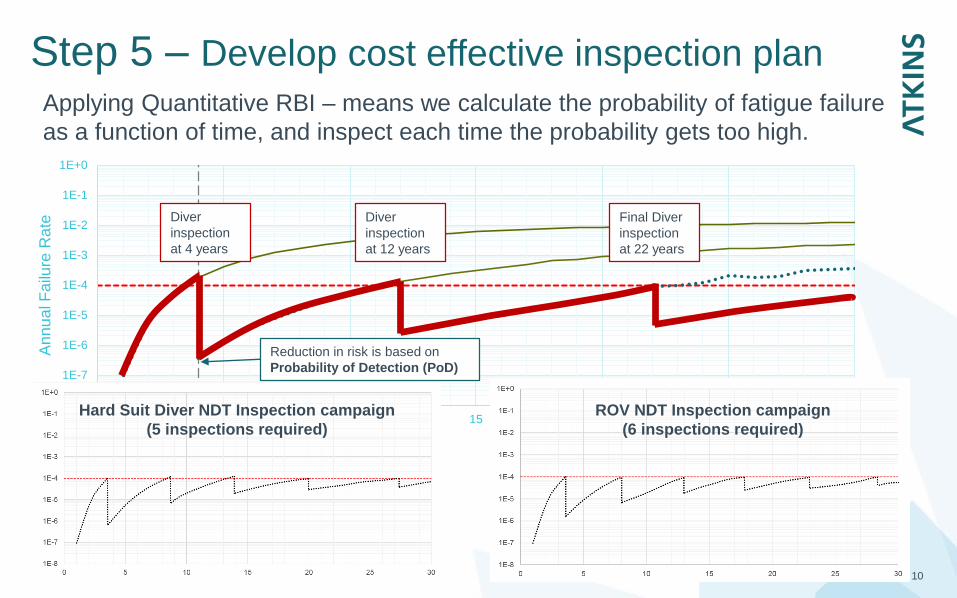
Step 5 – Develop cost effective inspection plan
10
Applying Quantitative RBI – means we calculate the probability of fatigue failure
as a function of time, and inspect each time the probability gets too high.
1E-8
1E-7
1E-6
1E-5
1E-4
1E-3
1E-2
1E-1
1E+0
0 5 10 15 20 25 30
An
nu
al F
ailu
re R
ate
Time (Yrs)
Diver
inspection
at 4 years
Diver
inspection
at 12 years
Final Diver
inspection
at 22 years
Reduction in risk is based on
Probability of Detection (PoD)
Hard Suit Diver NDT Inspection campaign
(5 inspections required)
ROV NDT Inspection campaign
(6 inspections required)
11
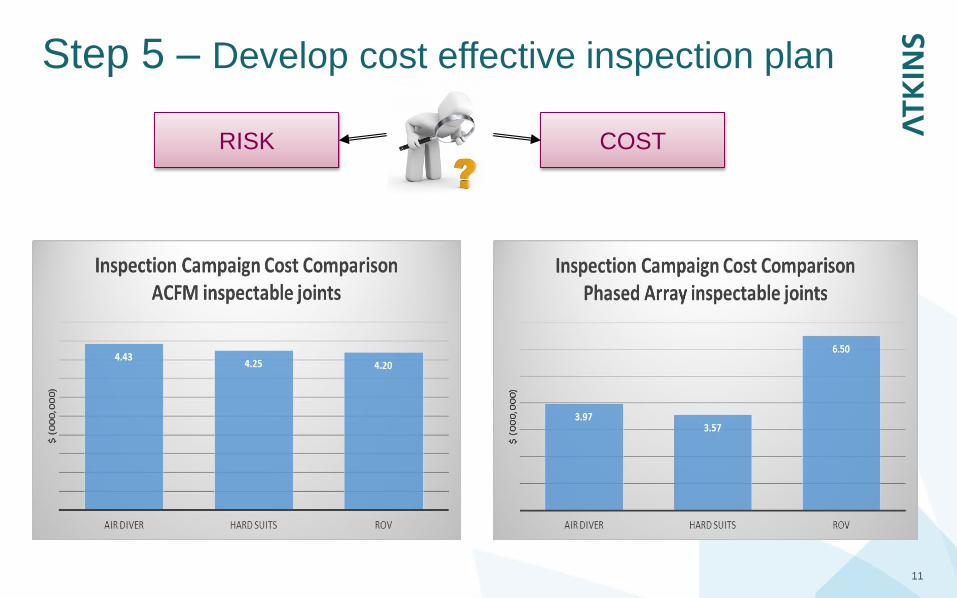
Step 5 – Develop cost effective inspection plan
COSTRISK
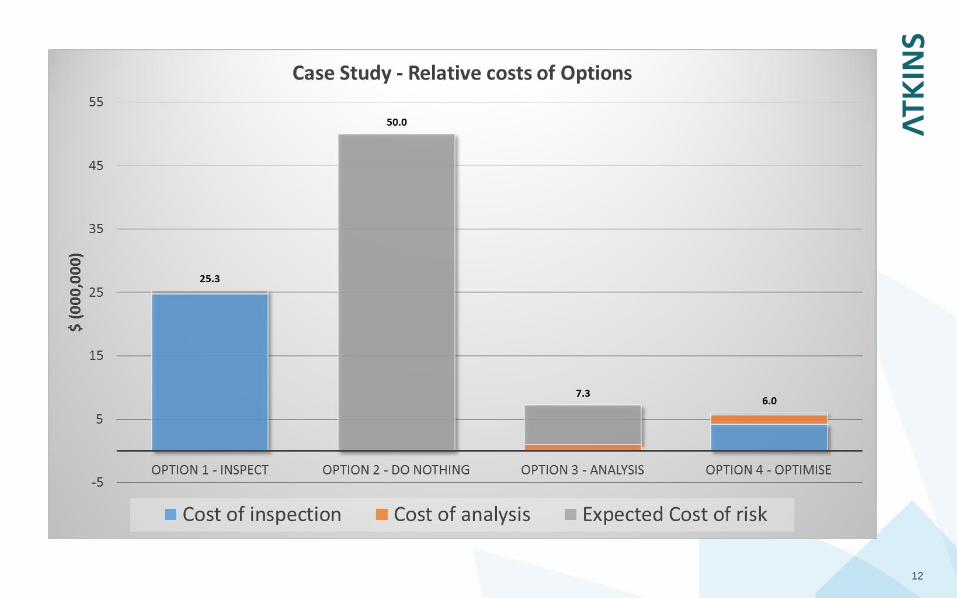
12
Thank youIf you’d like to find out more visit:www.atkinsglobal.com
or contact:
13 Atkins except where stated otherwise
[email protected] [email protected]
[email protected] [email protected]
Acknowledgements: