Embed Size (px)
Citation preview

Full Terms & Conditions of access and use can be found athttp://www.tandfonline.com/action/journalInformation?journalCode=uree20
Journal of Research on Educational Effectiveness
ISSN: 1934-5747 (Print) 1934-5739 (Online) Journal homepage: http://www.tandfonline.com/loi/uree20
Reducing Inequality in Academic Success forIncoming College Students: A Randomized Trial ofGrowth Mindset and Belonging Interventions
Michael Broda, John Yun, Barbara Schneider, David S. Yeager, Gregory M.Walton & Matthew Diemer
To cite this article: Michael Broda, John Yun, Barbara Schneider, David S. Yeager, Gregory M.Walton & Matthew Diemer (2018) Reducing Inequality in Academic Success for Incoming CollegeStudents: A Randomized Trial of Growth Mindset and Belonging Interventions, Journal of Researchon Educational Effectiveness, 11:3, 317-338, DOI: 10.1080/19345747.2018.1429037
To link to this article: https://doi.org/10.1080/19345747.2018.1429037
Accepted author version posted online: 17Jan 2018.Published online: 09 Apr 2018.
Submit your article to this journal
Article views: 778
View Crossmark data
Citing articles: 1 View citing articles

INTERVENTION, EVALUATION, AND POLICY STUDIES
Reducing Inequality in Academic Success for IncomingCollege Students: A Randomized Trial of Growth Mindsetand Belonging Interventions
Michael Broda a, John Yunb, Barbara Schneiderb, David S. Yeagerc, Gregory M. Waltond,and Matthew Diemere
ABSTRACTLight-touch social psychological interventions have gained considerableattention for their potential to improve academic outcomes forunderrepresented and/or disadvantaged students in postsecondaryeducation. While findings fromprevious interventions have demonstratedpositive effects for racial and ethnic minority and first-generation studentsin small samples, few interventions have been implemented at a largerscale with more heterogeneous student populations. To address thisresearch gap, 7,686 students, representing more than 90% of incomingfirst-year students at a large Midwestern public university, were randomlyassigned to an online growth mindset intervention, social belongingintervention, or a comparison group. Results suggest that after the fallsemester, the growth mindset intervention significantly improved gradepoint averages for Latino/a students by about .40 points. This represents a72% reduction in the GPA gap between White and Latino/a students.Further, this effect was replicated for both spring semester GPA andcumulative GPA. These findings indicate that light-touch interventionsmay be a minimally invasive approach to improving academic outcomesfor underrepresented students. Our findings also highlight the complexityof implementing customized belonging interventions in heterogeneouscontexts.
KEYWORDSlight-touch interventiongrowth mindsetsocial belongingpostsecondary education
Introduction
In 2014, nearly 18 million undergraduate students were enrolled in two- or four-year institu-tions (Ginder, Kelly-Reid, & Mann, 2015). This number represents an increase of approxi-mately 35% since 2000 (Snyder & Dillow, 2015). As enrollment rates have dramaticallyincreased, the percentage of students receiving their bachelor’s degree within a six-yearperiod has also modestly increased, from 52% of students in the 1996 starting cohort, to56.5% of students in the 2006 starting cohort (Snyder & Dillow, 2015). However, this rate ofdegree completion continues to vary widely across student subgroups. The challenge of
CONTACT Michael Broda [email protected] School of Education, Virginia Commonwealth University, 1015 W.Main St., Richmond, VA 23284-2020, USA.aVirginia Commonwealth University, Richmond, Virginia, USAbMichigan State University, East Lansing, Michigan, USAcUniversity of Texas at Austin, Austin, TexasdStanford University, Stanford, California, USAeUniversity of Michigan, Ann Arbor, Michigan, USA© 2018 Taylor & Francis Group, LLC
JOURNAL OF RESEARCH ON EDUCATIONAL EFFECTIVENESS2018, VOL. 11, NO. 3, 317–338https://doi.org/10.1080/19345747.2018.1429037
completing a four-year degree appears to be most acute for low-income, racial minority, andfirst-generation students, who have lower rates of persistence and completion in four-yearcolleges than their higher income, White, and continuing-generation counterparts (Bailey &Dynarski, 2011; Bowen, Chingos, & McPherson, 2009; Ifill et al., 2016).
Faced with these challenges, policymakers in higher education have begun to look for ways toreduce inequality between the rates at which advantaged and disadvantaged students persist incollege and complete advanced degrees (Executive Office of the President, 2014). The possiblesolutions are numerous and diffuse; however, social-psychological interventions have recentlygained attention as a “light-touch” approach for increasing motivation for persistence (Yeager &Walton, 2011). These interventions target college students’ uncertainty about belonging (i.e.,beliefs about encountering commonplace adversities while trying to “fit in” in a new community)or growth mindsets (i.e., the belief that ability can be grown by exerting effort, seeking help fromothers, and revising strategies in the face of challenge; Yeager & Dweck, 2012) to help studentsovercome barriers to success. Such interventions may reduce responsiveness to negative events,build confidence to handle daily stressors, and/or lead students to adopt a mindset that viewsintelligence as malleable and open to growth, as opposed to fixed and immutable (Wilson, 2006;Wilson, Damiani, & Shelton, 2002; Yeager &Walton, 2011).
Given that light-touch interventions are relatively brief and efficient to implement andhave shown positive effects for disadvantaged students in several secondary and postsecond-ary contexts (Yeager et al., 2016), it is important to know how they perform when carriedout in a new context by a new research team. If these interventions could improve academicoutcomes for a disadvantaged student subgroup, at little to no cost, they would be tremen-dously beneficial to both students and universities, especially given the high cost of recruit-ing, retaining, and remediating students who fall behind. However, rigorous trials andreplications are necessary to examine whether the effects seen in earlier work remain robustwhen implemented in new settings by new researchers.
One such initiative is the Spartan Persistence Program (SPP), a social-psychological interven-tion designed to enhance student efficacy and sense of belonging based closely on prior studiesshown to have positive effects for subgroups of disadvantaged students (Yeager et al., 2016). Toassess the effectiveness of this intervention, a block randomized controlled trial was implementedin summer 2014 with the incoming student population at Michigan State University (MSU). Thefollowing study examines the effect of this intervention on the academic outcomes of underrep-resented student subgroups in the first-year class during their first two semesters.
Light-Touch Psychological Interventions
Over the past several years, psychologists have conducted a series of light-touch social-psycho-logical interventions in universities to enhance student performance and completion (Yeageret al., 2016). These interventions are specifically designed to benefit disadvantaged students,such as first-generation college students or members of racial/ethnic minority groups that areoften underrepresented relative to White, continuing-generation students in four-year collegesand universities. Disadvantaged students often face unique challenges related to postsecondarysuccess, such as implicit signals that they may be viewed as less able or not talented enough tosucceed (Olson & Dweck, 2008). If students enter college aware of these signals, this may leadthem to interpret everyday challenges in ways that might confirm their worries. The goal ofthese interventions is to change these signals from being interpreted as evidence of subgroup-
318 M. BRODA ET AL.
specific inadequacy to a manifestation of broader challenges faced by incoming students in gen-eral, thereby reducing students’ uncertainty about their own ability and sense of belonging.
One of these types of interventions is the “growth mindset” intervention, which aims to shiftthe way in which students attribute academic success or failure from stable factors (typicallyone’s fixed intelligence) to more unstable factors (e.g. effort or social conditions). In otherwords, they aim to convince students that rather than being fixed and finite, intelligence is mal-leable, and one can become smarter and more successful in school by working harder (Yeager& Walton, 2011). For example, Blackwell, Trzesniewski, and Dweck (2007) administered agrowth mindset intervention with a sample of 91 low-income, racial/ethnic minority studentsin an urban middle school. The treatment consisted of a series of eight weekly sessions in whichstudents learned about the function of the brain and how the brain could become stronger bytaking on challenges. The intervention resulted in positive effects of about .30 grade points forstudents in the treatment condition compared to students in a control condition.
This type of intervention has also been replicated in postsecondary contexts. For example,Aronson, Fried, and Good (2002) developed an intervention based on a “pen pal” session inwhich college students wrote letters to middle school students explaining and endorsing theconcept of malleable intelligence. In a sample of 79 students at a selective university, theyfound that the intervention increased grade-point averages in the following academic termby .23 points. They also found that the intervention increased African American students’engagement and identification with the school.
A second class of light-touch intervention blends work on attribution and implicit theories ofintelligence (Wilson & Linville, 1982, 1985) with that of stereotype threat (Steele & Aronson,1995). These interventions, referred to here as belonging uncertainty interventions, aim to helpdisadvantaged students reframe worries they may have about fitting in as normal, rather thanas reinforcement of societal and institutional signals that they do not belong or are unable tosucceed. For example, Walton and Cohen (2007, 2011) implemented a social belonging inter-vention with 92 first-year students at a selective college. The intervention was delivered througha one-hour laboratory session, which included reviewing the results of a survey that suggestedthat many students feel like they do not belong at first, but these worries fade over time. Stu-dents also wrote essays and gave speeches for the purpose of explaining to future students thatworries about fitting in change as time goes on. Results found that the intervention significantlyimproved the GPAs of African American students by .24 points relative to African Americanstudents in the control condition. This effect persisted from sophomore to senior year, and rep-resented a 52% reduction in the GPA gap between African American and White students.
The success of light-touch interventions in small samples and laboratory settings hasnecessitated further application of these methods in larger, more diverse contexts and set-tings. Paunesku et al., (2015) used online modules to administer growth mindset and sense-of-purpose interventions in a sample of 1,594 students in thirteen high schools, and foundthat students who were designated at risk (those with a GPA less than 2, or who had failed atleast one course) and received the growth mindset intervention, the sense-of-purpose inter-vention, or a double dose of the two earned GPAs about .13 points higher than at-risk stu-dents in the control condition. This design and approach was important for several reasons.First, it applied growth mindset interventions on a relatively large scale using online mod-ules, as opposed to more time-consuming and intensive in-person applications of the treat-ment. This study served as a test of more large-scale use of this type of social-psychologicalintervention across schools or districts. Second, the intervention was applied to a
REDUCING INEQUALITY IN ACADEMIC SUCCESS 319
heterogeneous sample of high school students, so this intervention provided evidence as tothe efficacy of growth mindset interventions when delivered in more heterogeneous samples.
Recently, both growth mindset and belonging uncertainty interventions have been imple-mented at large scale as a more general treatment for incoming first-year college students.For example, Yeager et al. (2016), Study 2 used online modules to administer growth mind-set and social belonging interventions with a sample of 7,335 incoming students at a large,flagship state university. This study found that both the growth mindset and social belonginginterventions significantly impacted academic outcomes for disadvantaged students. In thiscase, disadvantaged students were classified as racial minority or first-generation students.Low graduation rates of previous cohorts of these students led the authors to conclude thatthese groups of students are known to be disadvantaged relative to their majority peers interms of completing college. Specifically, 73% of disadvantaged students who received eitherintervention completed their first year as full-time enrolled students, compared to 69% ofdisadvantaged students in a control condition. This difference represented a 40% reductionin the inequality between full-time enrollment rates between disadvantaged and advantagedstudents. This study demonstrated the efficacy of large-scale application of growth mindsetand social belonging interventions in a postsecondary setting.
Yeager et al. (2016), Study 3 also conducted a similar intervention with 1,592 incoming first-year students at a selective private university. Here, students were randomly assigned to receiveone of three lay-theory interventions designed to impact social belonging, cultural fit, or percep-tion of critical feedback. Interventions were administered online as a part of the university’s pre-matriculation orientation process. Results indicated that disadvantaged students who receivedany of the lay theory interventions ended the year with cumulative GPAs about .09 points higherthan disadvantaged students in a control group. In this context, based on historical studentenrollment and persistence data and relevant psychological theory, all African American, Latino,Native, Pacific Islander, and first-generation European American students were classified as dis-advantaged. Consistent with theory and prior results, no significant effects were found for advan-taged students, in this case continuing-generation European American students and all Asianstudents. This impact translated into a 31% adjustment in the raw achievement gap betweenadvantaged and disadvantaged students, and a 47% reduction after adjusting for covariates.
The initial success of these recent interventions has emphasized the need for additionalapplications of light-touch social-psychological interventions in more varied and diverse edu-cational contexts. As Paunesku et al. (2015) suggest, social-psychological interventions needto be scalable if they are to impact students beyond those in tightly controlled research set-tings. However, this raises the issue of customization. Often, social-psychological interven-tions have been customized for each intervention site, and their effectiveness may dependupon how well the intervention fits the context of the site (Yeager & Walton, 2011). This isespecially true for belonging interventions. Although mindset interventions may be effectivewhen using largely standardized materials (Paunesku et al., 2015), social belonging interven-tions (e.g. Yeager et al., 2016) likely need to be customized to appropriately address thesocial challenges faced by a particular group in a particular context. Balancing the need forcustomization with the need for scalability is a challenge that will require researchers todesign light-touch social-psychological interventions that both broadly anticipate the needsof disadvantaged students and are modifiable to local contexts. The SPP furthers these ambi-tions, with the broader aim of repeating the study for multiple cohorts and following thepersistence of the effects over time. As a large, public land-grant university, with significant
320 M. BRODA ET AL.
racial, ethnic, and socioeconomic diversity, Michigan State is an important context in whichto study the efficacy of light-touch interventions. This study describes the findings from thefirst cohort of the SPP.
Research Questions
In this study we examine the following research questions:1. Did participation in either an online growth mindset or social belonging intervention
cause incoming undergraduate students at MSU from underrepresented racial/ethnicgroups to earn higher GPAs, attempt more course credits, or complete more coursecredits compared to their peers in the control group after completing their first twosemesters?
2. For students in underrepresented groups, was the impact of these interventions mod-erated by any background characteristics, including high school GPA, ACT score, Pelleligibility, first-generation status, and pre-intervention levels of growth mindset andbelonging uncertainty?
Method
Over the last five years, motivated by a desire to increase retention and graduation rates, MichiganState University has undertaken a series of systematic reforms to increase students’ engagementwith the university and improve their sense of belonging as part of the campus community. Previ-ous intervention work (e.g., Yeager & Walton, 2011) caught the attention of university adminis-trators, who then convened a committee of expert faculty to design a similar set of interventionsspecific to MSU students. A pilot study of about 1,000 incoming students was conducted in Janu-ary 2014; this facilitated the development of randomization procedures as well as refinement andimprovement of the two treatment conditions and the comparison condition.
Procedures and Sample
Prior to fall enrollment, incoming first-year students at MSU are required to attend a two-day summer orientation program. The summer orientation includes information aboutcourse enrollment, academic programs, social and cultural resources, and other key featuresof campus life. Several weeks prior to their orientation session, students were sent a linkfrom a university officer to an online survey on Qualtrics requesting their participation. Stu-dents were permitted to complete the survey any time before their scheduled orientation ses-sion; those who did not complete the survey before orientation were given time to do so afterarriving. After providing several pieces of demographic information, students were random-ized (blocking on race/ethnicity using the standard Qualtrics randomizer) into one of threeconditions: (a) a mindset condition, (b) a belonging condition, and (c) a control condition.
Eligible participants for this study were identified by their participation in MSU’s Aca-demic Orientation Program in Summer 2014, which is required for all incoming studentswith “Freshman” academic status. In total, 8,331 students were scheduled to participate insummer orientation and were therefore eligible for participation in the study; of those 8,331students, 7,686 responded to the invitation to participate for a response rate of 92%. Aftercompleting the online intervention materials, all participants were asked a series of post-
REDUCING INEQUALITY IN ACADEMIC SUCCESS 321
intervention questions that were used to both confirm the validity of the interventions andgauge students’ engagement with them. All other academic outcomes used here were mea-sured and collected by the University Registrar at the end of the fall semester.
Since the intervention took place at one site, randomization occurred at the individual level,within separate blocks according to the students’ racial/ethnic group. The blocks, which corre-spond to the university’s internal schema for reporting race and ethnicity, were as follows:White, Latino/a,1 African American, Asian, and Multiracial. International students wereblocked separately but also received both interventions. Given that the interventions weredesigned to impact underrepresented student groups, we focus our reporting primarily onresults for Latino/a and African American students, with results for White students includedas a comparison. An analysis of MSU’s graduation statistics over the past decade indicate thatboth Latino/a students and African American students were both consistently underrepre-sented in the initial composition of each incoming student class relative to their distribution inthe state of Michigan K–12 student population, and also significantly less likely to persist andcomplete an undergraduate degree within six years relative to their White and Asian peers.International students were excluded from this analysis, resulting in a final analytic sample of6,529 students (Mindset nD 2,135; Belonging nD 2,172; Control nD 2,222).2
Growth Mindset Intervention Condition
Students in the mindset intervention group read a short scientific article on “Building the Brain”that introduced the concept of brain plasticity, or the idea that the brain, similar to othermuscles, can grow when given repeated practice in the face of challenges (Yeager & Dweck,2012). The purpose behind this article is to expose students to the idea that their intelligence isnot fixed, and that extra effort and focus on their part can translate to significant growth in intel-ligence over time. It also argues that instead of just a “knowing” part of the brain there is a “knowhow” part of the brain that also can improve with time (Yeager & Dweck, 2012). After readingthe brief article, students are asked several reflective questions in which they are encouraged toidentify moments in their own lives when they may have (or have not) adopted a growth mind-set. Students are encouraged to write open-length responses to each reflective question, includingwriting a piece of advice for a future first-year student based on lessons learned from the article.Responses varied widely, but a typical response read like this:
In high school the muscles in your brain were geared for less “weight.” Basically meaning youwere really well developed mentally for that type of learning environment. In college you aregoing to have to lift a lot more weight. You are going to be required to ask a lot of questions andlearn a lot of lessons on your own. This is okay, but this can cause a lot of frustration. Justremember to never give in and reach out. In college you are going to be challenged to knowhow to use the information and learn the skills. The best things to remember are: Be brave andreach out, don’t give up, and don’t get discouraged!
After completing the preliminary demographic portion of the Qualtrics survey, studentstypically spent between twenty and twenty-five minutes on the mindset intervention activities.
1The official institutional designation for Latino/a students is “Hispanic (all races).” We use Latino/a throughout this paper inan effort to use a more inclusive group identifier.
2Although not the primary focus of this paper, which examines the impact of these interventions on underrepresented stu-dents, for reference, we also present results for the main effect of each intervention in the full sample, which includes stu-dents from all racial/ethnic groups.
322 M. BRODA ET AL.
Social Belonging Intervention Condition
Distinct from the mindset treatment, where a fixed set of information was being presented tostudents for their reflection, students in the belonging treatment group were given a series ofstories ostensibly taken from the responses of upperclassmen on a recent survey investigat-ing the challenges of starting out in college. These stories dealt with a series of issues aroundleaving home, including finding friends, homesickness, fitting in socially, and trying to findone’s identity as a member of a new community. The stories were carefully developed froma series of focus groups with a diverse set of MSU juniors and seniors, in which facilitatorsdiscussed how current students overcame challenges to feeling like they belonged at MSU,what belonging at MSU means, etc. Quotes from these focus groups served as source mate-rial for the stories presented to new students during summer orientation. Each story the stu-dent reads is attributed to an upperclassman at MSU given a pseudonym. Further, the firststory the student reads is matched with the reader’s identified gender and race/ethnicity. Inother words, if the student is female and African American, the first story presented is fromthe perspective of an African American female. Later stories in the series were from otherracial/ethnic and gender pairings. After reading the stories, students were then asked toreflect on their meaning for their own lives in a series of short reflective responses. Studentresponses again varied significantly, but several typical responses include:
Student #1:
At first I wasn’t excited to attend college because I like having a group of friends and family thatI already know at home. As college started approaching I got more comfortable with the ideabecause I realized that everyone is in the same boat as me. Now, I am excited and ready to meetnew people and to be a Spartan.
Student #2:
I am worried that it will not be easy for me to make friends. I’m worried that it be hard to beaccepted in such a big environment. I worry that I will get to college and realize that I am not cutout for the classes and I will have a hard time adjusting and finding people who I can relate to. How-ever, coming from a big high school, I’m confident that I will eventually find friends, I just worrythat when I get there, people will already know each other. I would like to be able to join clubs andbe an active part of Michigan State University. I’m excited to be a part of something that I can trulysay I am proud to be a part of. I’m excited to experiences all the things that MSU has to offer and Ican’t wait to get past the bumpy first part of the transition to school, and begin my life at MSU!
Students typically spent between fifteen and twenty minutes completing the belongingtreatment activities.
Control Condition
The control condition took the form of a placebo and was the same control used in previoussimilar research (Walton & Cohen, 2011), with small modifications to fit the context atMSU. It was designed to give students the impression that the institution was providinghelp, but in contrast to the social belonging condition, which focused on students’ feelings ofuncertainty about fitting in the social environment, the control condition focused on changesin the physical environment. For example, stories were included that talked about the
REDUCING INEQUALITY IN ACADEMIC SUCCESS 323
weather in East Lansing, adjusting to a new class schedule, finding your way at such a largecampus, and finding places to eat. The control condition was designed to be relatively inani-mate, in contrast to the more personal stories of the social belonging treatment condition.As with the belonging intervention, students in the comparison condition were given a seriesof stories to read and then asked to reflect on what they mean for them as they begin theircollege experience. Students typically spent between ten and fifteen minutes on the controlcondition materials. It is important to note that given the slight difference in orientationbetween the mindset and belonging conditions, the control is a better match with the belong-ing treatment and can be thought of as a control group for belonging and a comparisongroup for mindset.
Data Sources
For the analyses presented below, we used data from four sources: (a) pre-interventiononline surveys, (b) post-intervention online surveys, (c) the university registrar, and (d) theuniversity office of institutional research. For our investigation, we used several studentbackground measures collected by the university, including high school GPA, ACT/SATscores, Pell grant eligibility, and first-generation status. The university registrar was the pri-mary source for all outcome measures used in the study.
Outcome Variables
This study uses five primary outcome measures, all of which are strongly associated with astudent’s persistence to a second year of college and eventual completion of a BA. All out-comes were obtained via the Office of the Registrar at the completion of the fall 2014 semes-ter and the spring 2015 semester. The first outcome, grade point average (GPA), is calculatedin the conventional format, by multiplying the numerical course grade (ranging from 0–4, inincrements of 0.50) by the number of credits for a given course, totaling the grade points,and then dividing by the number of credits taken for the semester. The second outcome,course credits attempted, is the number of total credits a student attempted in each semester.Recognizing that the definition and measurement of attempted credits may vary by institu-tion, we adhered to MSU’s definition of credits attempted, which is measured as the numberof credits the student took by the end of the semester, after drops and withdrawals. Coursecredits completed is the total number of credits for which a student received a passing grade(in this case 1.0, or a “D”). Full-time enrollment is defined as attempting 12 or more creditsduring the fall semester. Finally, cumulative GPA is calculated as a credit-weighted averageof fall and spring semester GPAs.
Covariates
Several instruments were used on the pre-intervention survey to gauge both the balanceof the randomization between treatment and control groups, as well as controls in theintent-to-treat regression estimates for both interventions. These scales include the pro-spective belonging uncertainty scale used in Yeager et al. (2016), Study 2, originallyadapted from Walton and Cohen (2011). For this measure, students responded to four
324 M. BRODA ET AL.
questions, each on a scale from 1 (Not at all true) to 5 (Completely true). The separateitems were as follows:
1. Sometimes I worry that I will not belong in college.2. I am anxious that I will not fit in at college.3. I feel confident that I will belong in college. (reverse-coded)4. When I face difficulties in high school, I wonder if I will really fit in when I get to
college.Student item scores demonstrated sufficient reliability (Cronbach’s a D .82), and were
combined into a composite measure that represented the arithmetic mean of all fourresponses.3
A second instrument on the pre-intervention survey was used to measure students’ initiallevels of growth mindset. Here we used the three-question scale developed by Hong, Chiu,Dweck, Lin, and Wan (1999). For this measure, students responded to three questions, eachon a scale from 1 (Strongly disagree) to 6 (Strongly agree). The separate items were as follows:
1. You have a certain amount of intelligence, and you really can’t do much to change it.(reverse-coded)
2. Your intelligence is something about you that you can’t change very much. (reverse-coded)
3. You can learn new things, but you can’t really change your basic intelligence. (reverse-coded)
As with the belonging uncertainty scale, student item scores on the pre-interventiongrowth mindset scale demonstrated sufficient reliability (Cronbach’s aD .81) and were com-bined into a composite measure that represented the arithmetic mean of all three responses.
Several additional variables were included as controls in the regression estimates ofthe treatment effect. These included ACT score, high school GPA, Pell grant eligibility,and first-generation status. For the small proportion of students (less than 15%) whoonly reported SAT scores, these were converted to ACT scores using the standard con-cordance published by the college board (2009). Reported high school GPAs above 4.0were capped at 4 to account for weighted and unweighted GPAs. Pell eligibility wasoperationalized as a binary measure, equal to one if the student was classified as Pelleligible, and zero if otherwise. First-generation status was also operationalized as abinary measure, equal to one if the student reported being first in their family to attendcollege, and zero if otherwise. All additional control variables were provided by MSU’sinstitutional research office.
Tests for Equivalence of Experimental Groups
To assess whether the randomization procedures resulted in a sufficient balance in baselinemeasures between the three experimental groups, sample means were compared for eachtreatment group relative to the control condition using independent samples t tests for con-tinuous measures and two-sample proportion tests for binary measures. Results are
3This approach was used after confirming the unidimensionality of the data using principal components analysis (PCA).Results from the PCA confirmed that the four items in the scale loaded onto one primary factor, and that the scale scores(weights) for each item were roughly equivalent. The same process was used for the calculation of the pre-measure forgrowth mindset.
REDUCING INEQUALITY IN ACADEMIC SUCCESS 325
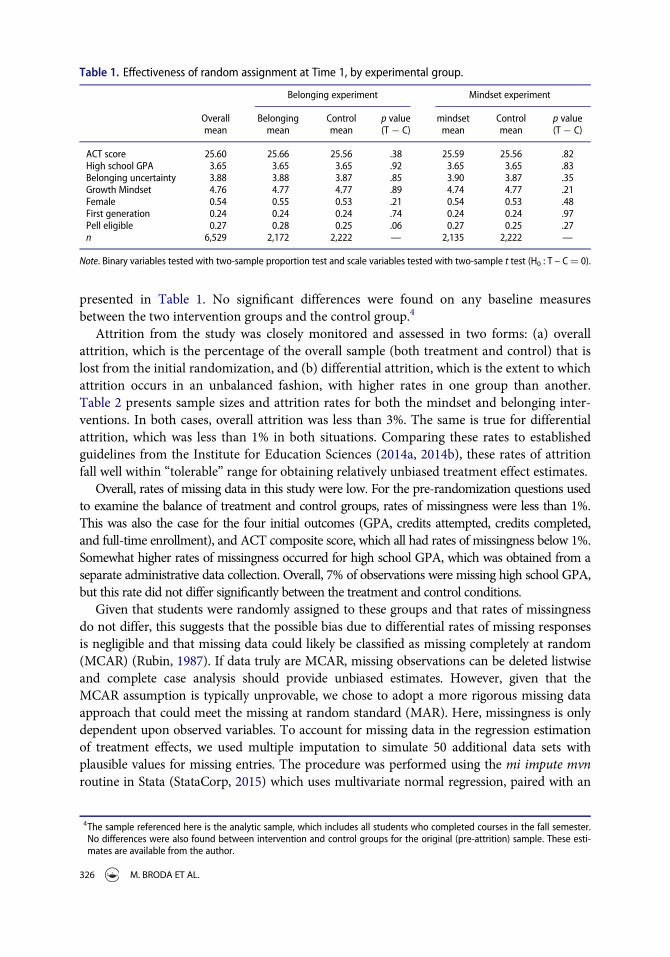
presented in Table 1. No significant differences were found on any baseline measuresbetween the two intervention groups and the control group.4
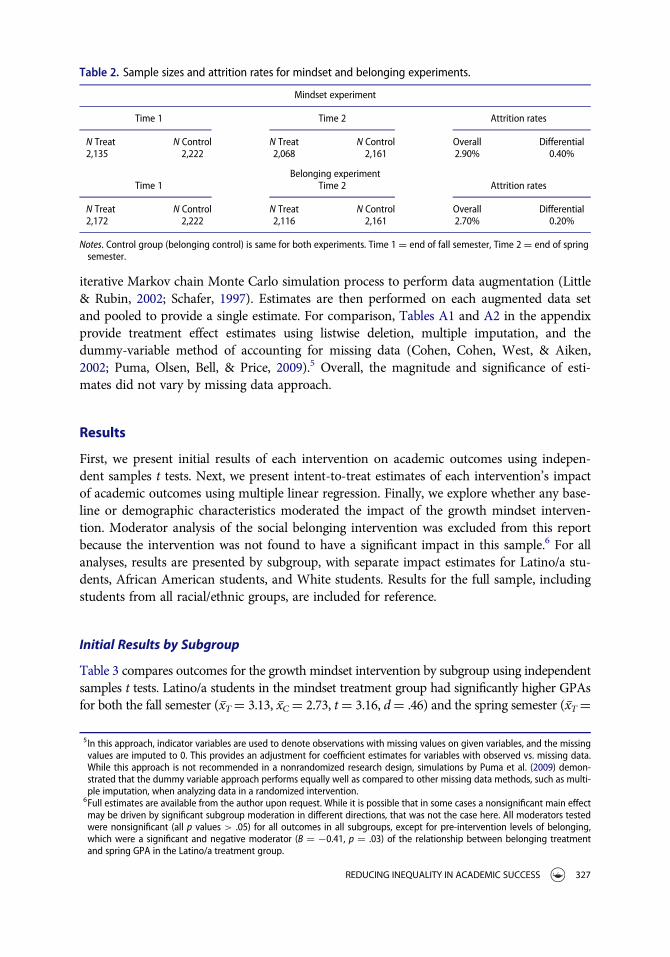
Attrition from the study was closely monitored and assessed in two forms: (a) overallattrition, which is the percentage of the overall sample (both treatment and control) that islost from the initial randomization, and (b) differential attrition, which is the extent to whichattrition occurs in an unbalanced fashion, with higher rates in one group than another.Table 2 presents sample sizes and attrition rates for both the mindset and belonging inter-ventions. In both cases, overall attrition was less than 3%. The same is true for differentialattrition, which was less than 1% in both situations. Comparing these rates to establishedguidelines from the Institute for Education Sciences (2014a, 2014b), these rates of attritionfall well within “tolerable” range for obtaining relatively unbiased treatment effect estimates.
Overall, rates of missing data in this study were low. For the pre-randomization questions usedto examine the balance of treatment and control groups, rates of missingness were less than 1%.This was also the case for the four initial outcomes (GPA, credits attempted, credits completed,and full-time enrollment), and ACT composite score, which all had rates of missingness below 1%.Somewhat higher rates of missingness occurred for high school GPA, which was obtained from aseparate administrative data collection. Overall, 7% of observations were missing high school GPA,but this rate did not differ significantly between the treatment and control conditions.
Given that students were randomly assigned to these groups and that rates of missingnessdo not differ, this suggests that the possible bias due to differential rates of missing responsesis negligible and that missing data could likely be classified as missing completely at random(MCAR) (Rubin, 1987). If data truly are MCAR, missing observations can be deleted listwiseand complete case analysis should provide unbiased estimates. However, given that theMCAR assumption is typically unprovable, we chose to adopt a more rigorous missing dataapproach that could meet the missing at random standard (MAR). Here, missingness is onlydependent upon observed variables. To account for missing data in the regression estimationof treatment effects, we used multiple imputation to simulate 50 additional data sets withplausible values for missing entries. The procedure was performed using the mi impute mvnroutine in Stata (StataCorp, 2015) which uses multivariate normal regression, paired with an
Table 1. Effectiveness of random assignment at Time 1, by experimental group.
Belonging experiment Mindset experiment
Overallmean
Belongingmean
Controlmean
p value(T ¡ C)
mindsetmean
Controlmean
p value(T ¡ C)
ACT score 25.60 25.66 25.56 .38 25.59 25.56 .82High school GPA 3.65 3.65 3.65 .92 3.65 3.65 .83Belonging uncertainty 3.88 3.88 3.87 .85 3.90 3.87 .35Growth Mindset 4.76 4.77 4.77 .89 4.74 4.77 .21Female 0.54 0.55 0.53 .21 0.54 0.53 .48First generation 0.24 0.24 0.24 .74 0.24 0.24 .97Pell eligible 0.27 0.28 0.25 .06 0.27 0.25 .27n 6,529 2,172 2,222 — 2,135 2,222 —
Note. Binary variables tested with two-sample proportion test and scale variables tested with two-sample t test (H0 : T – CD 0).
4The sample referenced here is the analytic sample, which includes all students who completed courses in the fall semester.No differences were also found between intervention and control groups for the original (pre-attrition) sample. These esti-mates are available from the author.
326 M. BRODA ET AL.
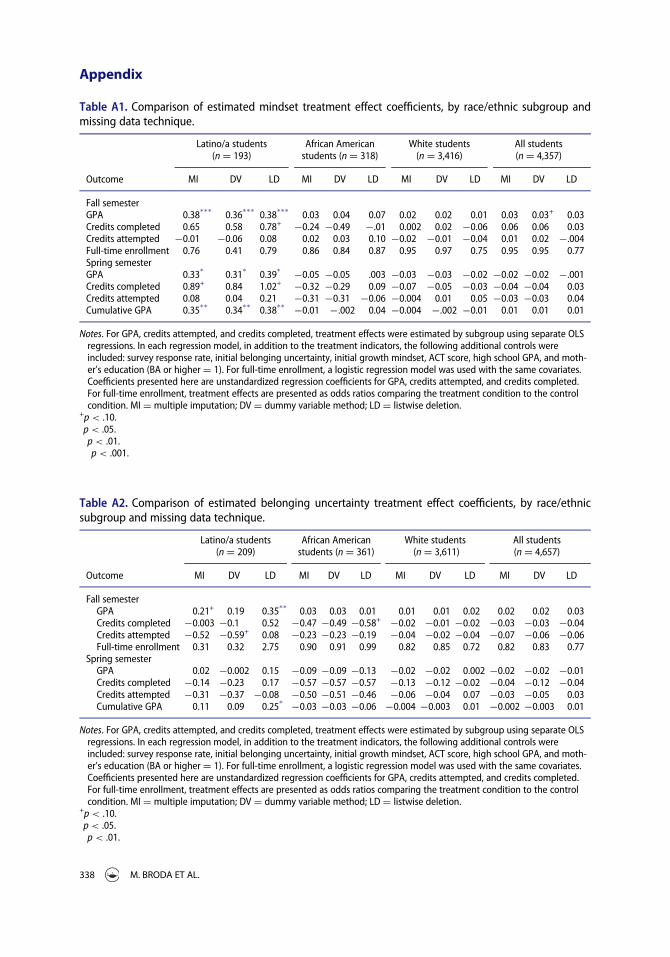
iterative Markov chain Monte Carlo simulation process to perform data augmentation (Little& Rubin, 2002; Schafer, 1997). Estimates are then performed on each augmented data setand pooled to provide a single estimate. For comparison, Tables A1 and A2 in the appendixprovide treatment effect estimates using listwise deletion, multiple imputation, and thedummy-variable method of accounting for missing data (Cohen, Cohen, West, & Aiken,2002; Puma, Olsen, Bell, & Price, 2009).5 Overall, the magnitude and significance of esti-mates did not vary by missing data approach.
Results
First, we present initial results of each intervention on academic outcomes using indepen-dent samples t tests. Next, we present intent-to-treat estimates of each intervention’s impactof academic outcomes using multiple linear regression. Finally, we explore whether any base-line or demographic characteristics moderated the impact of the growth mindset interven-tion. Moderator analysis of the social belonging intervention was excluded from this reportbecause the intervention was not found to have a significant impact in this sample.6 For allanalyses, results are presented by subgroup, with separate impact estimates for Latino/a stu-dents, African American students, and White students. Results for the full sample, includingstudents from all racial/ethnic groups, are included for reference.
Initial Results by Subgroup
Table 3 compares outcomes for the growth mindset intervention by subgroup using independentsamples t tests. Latino/a students in the mindset treatment group had significantly higher GPAsfor both the fall semester (x̅T D 3.13, x̅C D 2.73, tD 3.16, dD .46) and the spring semester (x̅T D
Table 2. Sample sizes and attrition rates for mindset and belonging experiments.
Mindset experiment
Time 1 Time 2 Attrition rates
N Treat N Control N Treat N Control Overall Differential2,135 2,222 2,068 2,161 2.90% 0.40%
Belonging experimentTime 1 Time 2 Attrition rates
N Treat N Control N Treat N Control Overall Differential2,172 2,222 2,116 2,161 2.70% 0.20%
Notes. Control group (belonging control) is same for both experiments. Time 1 D end of fall semester, Time 2 D end of springsemester.
5In this approach, indicator variables are used to denote observations with missing values on given variables, and the missingvalues are imputed to 0. This provides an adjustment for coefficient estimates for variables with observed vs. missing data.While this approach is not recommended in a nonrandomized research design, simulations by Puma et al. (2009) demon-strated that the dummy variable approach performs equally well as compared to other missing data methods, such as multi-ple imputation, when analyzing data in a randomized intervention.
6Full estimates are available from the author upon request. While it is possible that in some cases a nonsignificant main effectmay be driven by significant subgroup moderation in different directions, that was not the case here. All moderators testedwere nonsignificant (all p values > .05) for all outcomes in all subgroups, except for pre-intervention levels of belonging,which were a significant and negative moderator (B D ¡0.41, p D .03) of the relationship between belonging treatmentand spring GPA in the Latino/a treatment group.
REDUCING INEQUALITY IN ACADEMIC SUCCESS 327
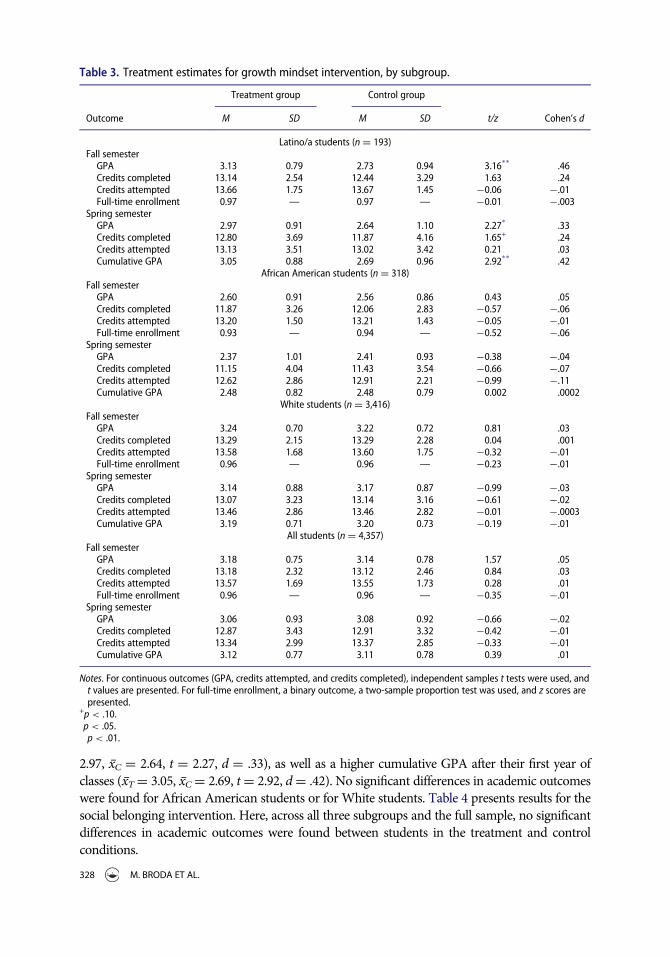
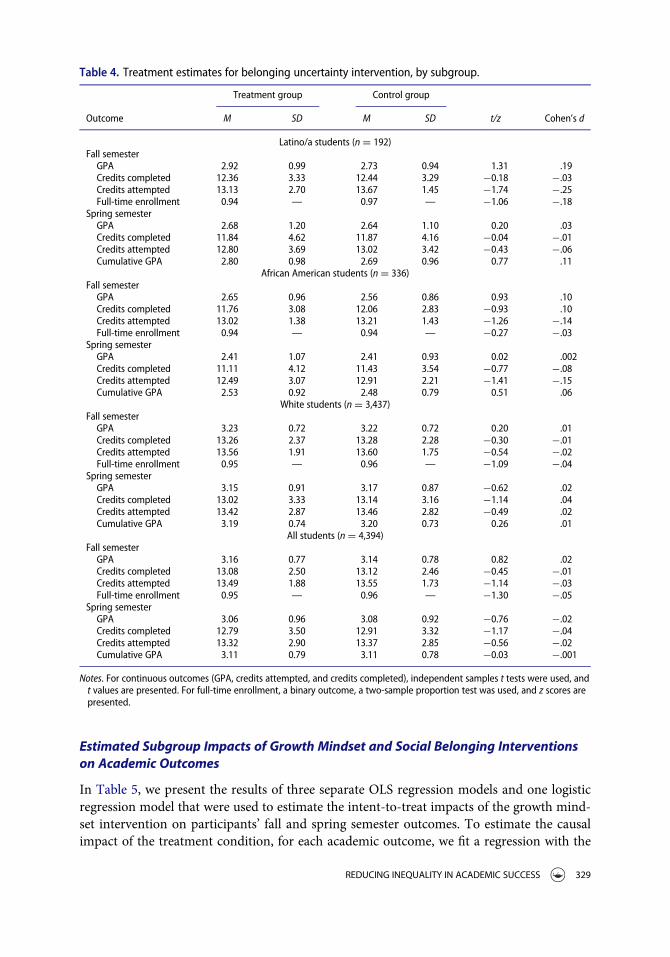
2.97, x̅C D 2.64, t D 2.27, d D .33), as well as a higher cumulative GPA after their first year ofclasses (x̅TD 3.05, x̅CD 2.69, tD 2.92, dD .42). No significant differences in academic outcomeswere found for African American students or for White students. Table 4 presents results for thesocial belonging intervention. Here, across all three subgroups and the full sample, no significantdifferences in academic outcomes were found between students in the treatment and controlconditions.
Table 3. Treatment estimates for growth mindset intervention, by subgroup.
Treatment group Control group
Outcome M SD M SD t/z Cohen’s d
Latino/a students (n D 193)Fall semesterGPA 3.13 0.79 2.73 0.94 3.16** .46Credits completed 13.14 2.54 12.44 3.29 1.63 .24Credits attempted 13.66 1.75 13.67 1.45 ¡0.06 ¡.01Full-time enrollment 0.97 — 0.97 — ¡0.01 ¡.003
Spring semesterGPA 2.97 0.91 2.64 1.10 2.27* .33Credits completed 12.80 3.69 11.87 4.16 1.65+ .24Credits attempted 13.13 3.51 13.02 3.42 0.21 .03Cumulative GPA 3.05 0.88 2.69 0.96 2.92** .42
African American students (n D 318)Fall semesterGPA 2.60 0.91 2.56 0.86 0.43 .05Credits completed 11.87 3.26 12.06 2.83 ¡0.57 ¡.06Credits attempted 13.20 1.50 13.21 1.43 ¡0.05 ¡.01Full-time enrollment 0.93 — 0.94 — ¡0.52 ¡.06
Spring semesterGPA 2.37 1.01 2.41 0.93 ¡0.38 ¡.04Credits completed 11.15 4.04 11.43 3.54 ¡0.66 ¡.07Credits attempted 12.62 2.86 12.91 2.21 ¡0.99 ¡.11Cumulative GPA 2.48 0.82 2.48 0.79 0.002 .0002
White students (n D 3,416)Fall semesterGPA 3.24 0.70 3.22 0.72 0.81 .03Credits completed 13.29 2.15 13.29 2.28 0.04 .001Credits attempted 13.58 1.68 13.60 1.75 ¡0.32 ¡.01Full-time enrollment 0.96 — 0.96 — ¡0.23 ¡.01
Spring semesterGPA 3.14 0.88 3.17 0.87 ¡0.99 ¡.03Credits completed 13.07 3.23 13.14 3.16 ¡0.61 ¡.02Credits attempted 13.46 2.86 13.46 2.82 ¡0.01 ¡.0003Cumulative GPA 3.19 0.71 3.20 0.73 ¡0.19 ¡.01
All students (n D 4,357)Fall semesterGPA 3.18 0.75 3.14 0.78 1.57 .05Credits completed 13.18 2.32 13.12 2.46 0.84 .03Credits attempted 13.57 1.69 13.55 1.73 0.28 .01Full-time enrollment 0.96 — 0.96 — ¡0.35 ¡.01
Spring semesterGPA 3.06 0.93 3.08 0.92 ¡0.66 ¡.02Credits completed 12.87 3.43 12.91 3.32 ¡0.42 ¡.01Credits attempted 13.34 2.99 13.37 2.85 ¡0.33 ¡.01Cumulative GPA 3.12 0.77 3.11 0.78 0.39 .01
Notes. For continuous outcomes (GPA, credits attempted, and credits completed), independent samples t tests were used, andt values are presented. For full-time enrollment, a binary outcome, a two-sample proportion test was used, and z scores arepresented.
+p < .10.�p < .05.��p < .01.
328 M. BRODA ET AL.
Estimated Subgroup Impacts of Growth Mindset and Social Belonging Interventionson Academic Outcomes
In Table 5, we present the results of three separate OLS regression models and one logisticregression model that were used to estimate the intent-to-treat impacts of the growth mind-set intervention on participants’ fall and spring semester outcomes. To estimate the causalimpact of the treatment condition, for each academic outcome, we fit a regression with the
Table 4. Treatment estimates for belonging uncertainty intervention, by subgroup.
Treatment group Control group
Outcome M SD M SD t/z Cohen’s d
Latino/a students (n D 192)Fall semesterGPA 2.92 0.99 2.73 0.94 1.31 .19Credits completed 12.36 3.33 12.44 3.29 ¡0.18 ¡.03Credits attempted 13.13 2.70 13.67 1.45 ¡1.74 ¡.25Full-time enrollment 0.94 — 0.97 — ¡1.06 ¡.18
Spring semesterGPA 2.68 1.20 2.64 1.10 0.20 .03Credits completed 11.84 4.62 11.87 4.16 ¡0.04 ¡.01Credits attempted 12.80 3.69 13.02 3.42 ¡0.43 ¡.06Cumulative GPA 2.80 0.98 2.69 0.96 0.77 .11
African American students (n D 336)Fall semesterGPA 2.65 0.96 2.56 0.86 0.93 .10Credits completed 11.76 3.08 12.06 2.83 ¡0.93 .10Credits attempted 13.02 1.38 13.21 1.43 ¡1.26 ¡.14Full-time enrollment 0.94 — 0.94 — ¡0.27 ¡.03
Spring semesterGPA 2.41 1.07 2.41 0.93 0.02 .002Credits completed 11.11 4.12 11.43 3.54 ¡0.77 ¡.08Credits attempted 12.49 3.07 12.91 2.21 ¡1.41 ¡.15Cumulative GPA 2.53 0.92 2.48 0.79 0.51 .06
White students (n D 3,437)Fall semesterGPA 3.23 0.72 3.22 0.72 0.20 .01Credits completed 13.26 2.37 13.28 2.28 ¡0.30 ¡.01Credits attempted 13.56 1.91 13.60 1.75 ¡0.54 ¡.02Full-time enrollment 0.95 — 0.96 — ¡1.09 ¡.04
Spring semesterGPA 3.15 0.91 3.17 0.87 ¡0.62 .02Credits completed 13.02 3.33 13.14 3.16 ¡1.14 .04Credits attempted 13.42 2.87 13.46 2.82 ¡0.49 .02Cumulative GPA 3.19 0.74 3.20 0.73 0.26 .01
All students (n D 4,394)Fall semesterGPA 3.16 0.77 3.14 0.78 0.82 .02Credits completed 13.08 2.50 13.12 2.46 ¡0.45 ¡.01Credits attempted 13.49 1.88 13.55 1.73 ¡1.14 ¡.03Full-time enrollment 0.95 — 0.96 — ¡1.30 ¡.05
Spring semesterGPA 3.06 0.96 3.08 0.92 ¡0.76 ¡.02Credits completed 12.79 3.50 12.91 3.32 ¡1.17 ¡.04Credits attempted 13.32 2.90 13.37 2.85 ¡0.56 ¡.02Cumulative GPA 3.11 0.79 3.11 0.78 ¡0.03 ¡.001
Notes. For continuous outcomes (GPA, credits attempted, and credits completed), independent samples t tests were used, andt values are presented. For full-time enrollment, a binary outcome, a two-sample proportion test was used, and z scores arepresented.
REDUCING INEQUALITY IN ACADEMIC SUCCESS 329
outcome as the dependent variable and an indicator for the treatment group as a predictor.All models also control for a series of baseline covariates, including initial belonging uncer-tainty, initial growth mindset, ACT score, high school GPA, first-generation status, and Pellgrant eligibility. As with the previous t test analysis, regression models were estimated bysubgroup, with relevant estimates presented for Latino/a students, African American stu-dents, and White students. Estimates for the full sample are also provided for reference.
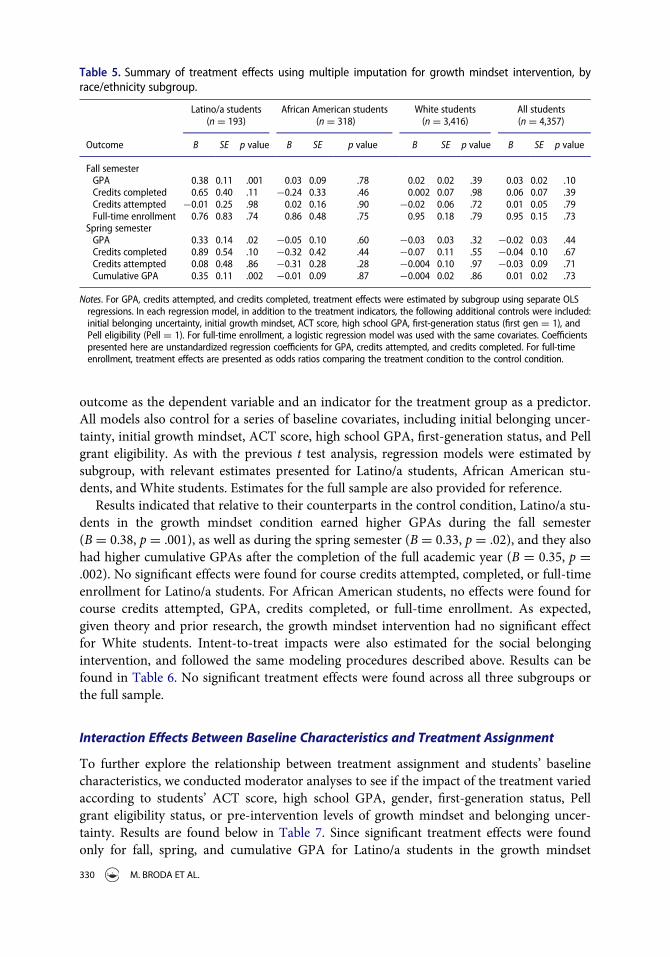
Results indicated that relative to their counterparts in the control condition, Latino/a stu-dents in the growth mindset condition earned higher GPAs during the fall semester(B D 0.38, p D .001), as well as during the spring semester (B D 0.33, p D .02), and they alsohad higher cumulative GPAs after the completion of the full academic year (B D 0.35, p D.002). No significant effects were found for course credits attempted, completed, or full-timeenrollment for Latino/a students. For African American students, no effects were found forcourse credits attempted, GPA, credits completed, or full-time enrollment. As expected,given theory and prior research, the growth mindset intervention had no significant effectfor White students. Intent-to-treat impacts were also estimated for the social belongingintervention, and followed the same modeling procedures described above. Results can befound in Table 6. No significant treatment effects were found across all three subgroups orthe full sample.
Interaction Effects Between Baseline Characteristics and Treatment Assignment
To further explore the relationship between treatment assignment and students’ baselinecharacteristics, we conducted moderator analyses to see if the impact of the treatment variedaccording to students’ ACT score, high school GPA, gender, first-generation status, Pellgrant eligibility status, or pre-intervention levels of growth mindset and belonging uncer-tainty. Results are found below in Table 7. Since significant treatment effects were foundonly for fall, spring, and cumulative GPA for Latino/a students in the growth mindset
Table 5. Summary of treatment effects using multiple imputation for growth mindset intervention, byrace/ethnicity subgroup.
Latino/a students(n D 193)
African American students(n D 318)
White students(n D 3,416)
All students(n D 4,357)
Outcome B SE p value B SE p value B SE p value B SE p value
Fall semesterGPA 0.38 0.11 .001 0.03 0.09 .78 0.02 0.02 .39 0.03 0.02 .10Credits completed 0.65 0.40 .11 ¡0.24 0.33 .46 0.002 0.07 .98 0.06 0.07 .39Credits attempted ¡0.01 0.25 .98 0.02 0.16 .90 ¡0.02 0.06 .72 0.01 0.05 .79Full-time enrollment 0.76 0.83 .74 0.86 0.48 .75 0.95 0.18 .79 0.95 0.15 .73
Spring semesterGPA 0.33 0.14 .02 ¡0.05 0.10 .60 ¡0.03 0.03 .32 ¡0.02 0.03 .44Credits completed 0.89 0.54 .10 ¡0.32 0.42 .44 ¡0.07 0.11 .55 ¡0.04 0.10 .67Credits attempted 0.08 0.48 .86 ¡0.31 0.28 .28 ¡0.004 0.10 .97 ¡0.03 0.09 .71Cumulative GPA 0.35 0.11 .002 ¡0.01 0.09 .87 ¡0.004 0.02 .86 0.01 0.02 .73
Notes. For GPA, credits attempted, and credits completed, treatment effects were estimated by subgroup using separate OLSregressions. In each regression model, in addition to the treatment indicators, the following additional controls were included:initial belonging uncertainty, initial growth mindset, ACT score, high school GPA, first-generation status (first gen D 1), andPell eligibility (Pell D 1). For full-time enrollment, a logistic regression model was used with the same covariates. Coefficientspresented here are unstandardized regression coefficients for GPA, credits attempted, and credits completed. For full-timeenrollment, treatment effects are presented as odds ratios comparing the treatment condition to the control condition.
330 M. BRODA ET AL.
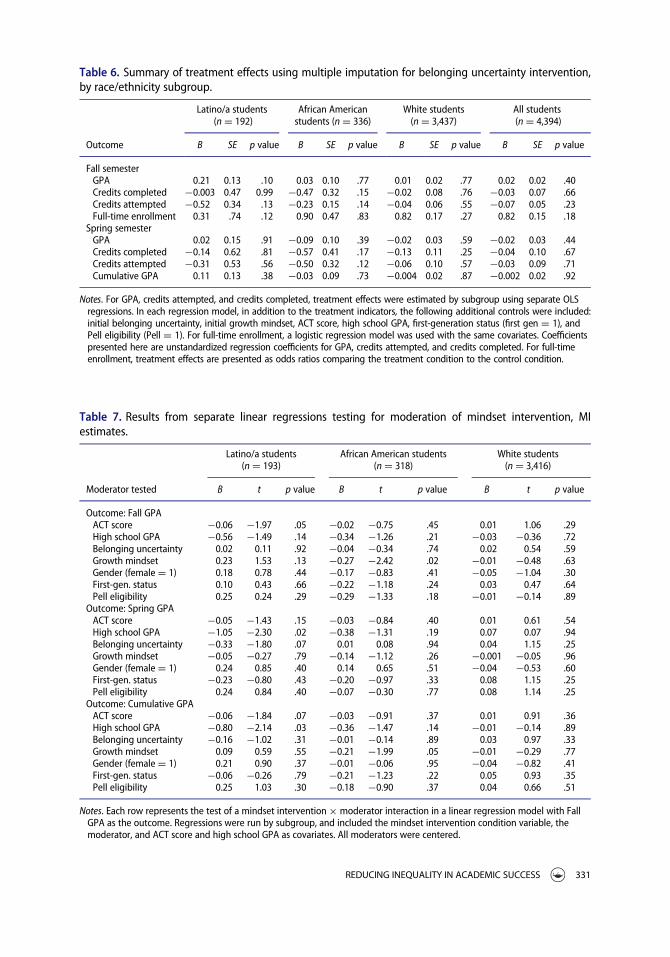
Table 6. Summary of treatment effects using multiple imputation for belonging uncertainty intervention,by race/ethnicity subgroup.
Latino/a students(n D 192)
African Americanstudents (n D 336)
White students(n D 3,437)
All students(n D 4,394)
Outcome B SE p value B SE p value B SE p value B SE p value
Fall semesterGPA 0.21 0.13 .10 0.03 0.10 .77 0.01 0.02 .77 0.02 0.02 .40Credits completed ¡0.003 0.47 0.99 ¡0.47 0.32 .15 ¡0.02 0.08 .76 ¡0.03 0.07 .66Credits attempted ¡0.52 0.34 .13 ¡0.23 0.15 .14 ¡0.04 0.06 .55 ¡0.07 0.05 .23Full-time enrollment 0.31 .74 .12 0.90 0.47 .83 0.82 0.17 .27 0.82 0.15 .18
Spring semesterGPA 0.02 0.15 .91 ¡0.09 0.10 .39 ¡0.02 0.03 .59 ¡0.02 0.03 .44Credits completed ¡0.14 0.62 .81 ¡0.57 0.41 .17 ¡0.13 0.11 .25 ¡0.04 0.10 .67Credits attempted ¡0.31 0.53 .56 ¡0.50 0.32 .12 ¡0.06 0.10 .57 ¡0.03 0.09 .71Cumulative GPA 0.11 0.13 .38 ¡0.03 0.09 .73 ¡0.004 0.02 .87 ¡0.002 0.02 .92
Notes. For GPA, credits attempted, and credits completed, treatment effects were estimated by subgroup using separate OLSregressions. In each regression model, in addition to the treatment indicators, the following additional controls were included:initial belonging uncertainty, initial growth mindset, ACT score, high school GPA, first-generation status (first gen D 1), andPell eligibility (Pell D 1). For full-time enrollment, a logistic regression model was used with the same covariates. Coefficientspresented here are unstandardized regression coefficients for GPA, credits attempted, and credits completed. For full-timeenrollment, treatment effects are presented as odds ratios comparing the treatment condition to the control condition.
Table 7. Results from separate linear regressions testing for moderation of mindset intervention, MIestimates.
Latino/a students(n D 193)
African American students(n D 318)
White students(n D 3,416)
Moderator tested B t p value B t p value B t p value
Outcome: Fall GPAACT score ¡0.06 ¡1.97 .05 ¡0.02 ¡0.75 .45 0.01 1.06 .29High school GPA ¡0.56 ¡1.49 .14 ¡0.34 ¡1.26 .21 ¡0.03 ¡0.36 .72Belonging uncertainty 0.02 0.11 .92 ¡0.04 ¡0.34 .74 0.02 0.54 .59Growth mindset 0.23 1.53 .13 ¡0.27 ¡2.42 .02 ¡0.01 ¡0.48 .63Gender (femaleD 1) 0.18 0.78 .44 ¡0.17 ¡0.83 .41 ¡0.05 ¡1.04 .30First-gen. status 0.10 0.43 .66 ¡0.22 ¡1.18 .24 0.03 0.47 .64Pell eligibility 0.25 0.24 .29 ¡0.29 ¡1.33 .18 ¡0.01 ¡0.14 .89
Outcome: Spring GPAACT score ¡0.05 ¡1.43 .15 ¡0.03 ¡0.84 .40 0.01 0.61 .54High school GPA ¡1.05 ¡2.30 .02 ¡0.38 ¡1.31 .19 0.07 0.07 .94Belonging uncertainty ¡0.33 ¡1.80 .07 0.01 0.08 .94 0.04 1.15 .25Growth mindset ¡0.05 ¡0.27 .79 ¡0.14 ¡1.12 .26 ¡0.001 ¡0.05 .96Gender (femaleD 1) 0.24 0.85 .40 0.14 0.65 .51 ¡0.04 ¡0.53 .60First-gen. status ¡0.23 ¡0.80 .43 ¡0.20 ¡0.97 .33 0.08 1.15 .25Pell eligibility 0.24 0.84 .40 ¡0.07 ¡0.30 .77 0.08 1.14 .25
Outcome: Cumulative GPAACT score ¡0.06 ¡1.84 .07 ¡0.03 ¡0.91 .37 0.01 0.91 .36High school GPA ¡0.80 ¡2.14 .03 ¡0.36 ¡1.47 .14 ¡0.01 ¡0.14 .89Belonging uncertainty ¡0.16 ¡1.02 .31 ¡0.01 ¡0.14 .89 0.03 0.97 .33Growth mindset 0.09 0.59 .55 ¡0.21 ¡1.99 .05 ¡0.01 ¡0.29 .77Gender (femaleD 1) 0.21 0.90 .37 ¡0.01 ¡0.06 .95 ¡0.04 ¡0.82 .41First-gen. status ¡0.06 ¡0.26 .79 ¡0.21 ¡1.23 .22 0.05 0.93 .35Pell eligibility 0.25 1.03 .30 ¡0.18 ¡0.90 .37 0.04 0.66 .51
Notes. Each row represents the test of a mindset intervention£ moderator interaction in a linear regression model with FallGPA as the outcome. Regressions were run by subgroup, and included the mindset intervention condition variable, themoderator, and ACT score and high school GPA as covariates. All moderators were centered.
REDUCING INEQUALITY IN ACADEMIC SUCCESS 331
condition, only these estimates are presented, along with those of African American studentsand White students in the growth mindset condition for comparison.
For Latino/a students, high school GPA was a negative and significant moderator of therelationship between treatment assignment and spring semester GPA (B D ¡1.05, p D .02)as well as between treatment assignment and cumulative GPA (B D ¡0.80, p D .03), whichsuggests that the growth mindset intervention may be less effective for students with higherhigh school GPAs. Also for Latino/a students, ACT score was a negative and significantmoderator of the relationship between treatment assignment and fall semester GPA(B D ¡0.06, p D .05), which suggests that the mindset intervention may be less effective forstudents with higher ACT scores. For African American students, initial levels of growthmindset interacted with the treatment assignment when predicting fall semester GPA(B D ¡0.27, p D .02) as well as cumulative GPA (B D ¡0.21, p D .05), which suggests thatthe growth mindset treatment may be less beneficial for students with higher baseline growthmindset beliefs. No moderators were significant in the White student sample.
Sensitivity Analysis
To assess the sensitivity of the treatment effect on GPA found for Latino/a students in themindset treatment group, we performed several additional analyses. Applying Frank, Mar-oulis, Duong, and Kelcey (2013) replacement of cases approach to quantifying robustness,we find that to invalidate the effect of the mindset intervention, 43% of the cases (or 83Latino/a students) in the mindset treatment group would have to be replaced with cases forwhich the mindset treatment has zero effect. Further, we assessed the potential that an omit-ted variable might impact the results, and find that an omitted variable would have to be cor-related at 0.347 with GPA and at 0.347 with the treatment indicator (conditioning onobserved covariates) to invalidate an inference. Correspondingly the impact of an omittedvariable (as defined in Frank, 2000) must be (0.320 £ 0.320) D 0.12 to invalidate an infer-ence. This impact is more than ten times larger than the impact of the largest observedcovariate, the pre-measure of growth mindset.7 Given that the randomization achieved bal-ance between treatment and control groups on all observed covariates, the possibility ofidentifying an omitted variable of that strength that correlates highly with the treatmentassignment is unlikely.
Discussion
The purpose of the present study was to test whether participation in either an online growthmindset or social belonging intervention led disadvantaged incoming first-year students toearn higher GPAs, attempt more course credits, or complete more courses over their first twosemesters of college than their peers in the control group. Further, the study tested whether theimpact of these interventions varied according to students’ background characteristics. Wefound that Latino/a students who received the growth mindset intervention had significantlyhigher first-semester GPAs than did their peers in the control group. This difference was about0.40 grade points in a raw comparison of growth mindset and control groups, and about .38
7The impact of the growth mindset pre-measure was 0.009 according to Frank’s (2000) approach to quantifying variableimpact.
332 M. BRODA ET AL.
points after adjusting for covariates. This represents a large and significant difference, both interms of effect size (Cohen’s d D .46), and in terms of practical significance. Latino/a studentsin the control group finished the fall semester with an average GPA of 2.73, whereas Latino/astudents in the growth mindset intervention finished with an average GPA of 3.13. GivenMSU’s grading scale, this means moving from an average grade of CC/B¡ to an average gradeof B. This could likely have real positive implications for students’ progress through theirdegree program and eventual degree completion, as well as postgraduate plans such as admis-sion into graduate school. Further, given the GPA of White students in the control group(3.20), the effects seen here from the growth mindset intervention are equivalent to a 72%reduction in the GPA gap between Latino/a and White students.
Further, the GPA effect observed for Latino/a students in the mindset group persistedinto the spring semester, where Latino/a participants in the mindset group earned GPAsthat were .33 points higher than participants in the control group (Cohen’s d D .33). Thesame trend was observed in cumulative GPA, where Latino/a participants in the mindsetgroup ended the year with cumulative GPAs that were .36 points higher than participants inthe control group (Cohen’s d D .42). These findings were robust both to the type of missingdata approach used, as well as to the inclusion of academic and demographic covariates inmultiple regression models.
Findings from this study support the notion that growth mindset interventions canimprove academic outcomes for disadvantaged students (Paunesku et al., 2015; Yeager et al.,2016), specifically improving students’ GPAs. Interestingly, not all groups of disadvantagedstudents in this study seemed to benefit equally, as African American students in the mindsetintervention did not report higher GPAs. Further, this study did not find an effect for themindset intervention on full-time enrollment, which was a key finding by Yeager et al.(2016), Study 2, who found a 4% increase in full-time enrollment for disadvantaged studentswho received a growth mindset treatment relative to their peers in the control condition.
The question remains as to why the growth mindset interventions may have had differentialeffects for Latino/a students even when compared to other disadvantaged groups, such as Afri-can American students. One possibility is that Latino/a students’ levels of academic preparationled them to be particularly sensitive to the growth mindset treatment. Compared as a block,Latino/a students in this sample had significantly higher high school GPAs and ACT scoresthan African American students.8 This suggests that the mindset intervention may be morebeneficial for students with somewhat higher levels of academic preparation (or a combinationof higher academic preparation and lower levels of growth mindset; see below). Additionally,results from the moderator analysis found that the growth mindset intervention was dispropor-tionately beneficial to Latino/a students with lower ACT scores (for the fall GPA outcome) orlower high school GPAs (for the spring and cumulative GPA outcomes). This was not the casefor African American or White students, which suggests additional differences in the wayLatino/a students’ initial academic preparation may have interacted with the mindset interven-tion. In all cases, Pell eligibility was not found to be a significant moderator, which suggeststhat this was not a characteristic that led to effect heterogeneity.
A second possibility may be related to students’ pretreatment levels of growth mindset.Latino/a students overall were found to have significantly lower levels of pre-intervention
8For high school GPA, x̅Latino/a D 3.55, x̅African American D 3.34, t D 7.17, d D .57. For ACT scores, x̅Latino/a D 23.90,x̅African American D 20.98, t D 11.28, d D .86.
REDUCING INEQUALITY IN ACADEMIC SUCCESS 333
growth mindset compared to African American students.9 Further, results from the modera-tor analysis found that initial levels of growth mindset were a significant and negative mod-erator of the growth mindset treatment effect for African American students for both falland cumulative GPA. In other words, African American students with higher initial levels ofgrowth mindset saw less impact from the growth mindset intervention. This moderationwas not present in the Latino/a subgroup—the treatment effect was not moderated by initialgrowth mindset. If Latino/a students across the distribution of prior growth mindset had rel-atively homogenous treatment impacts, while African American students experienced het-erogeneous impacts, with lower effects for students with higher levels of growth mindset,this could possibly explain why the intervention might have had differential effects for onedisadvantaged group relative to the other.
Evidence of heterogeneous effects by race/ethnicity in similar light-tough social-psycho-logical interventions is quite limited. Typically, studies have included comparisons of advan-taged and disadvantaged students in larger blocks (e.g., comparing White and Asiancontinuing-generation students to all African American, Latino/a, and White first-genera-tion students), which is useful (and congruent with the psychological theory underpinningthese interventions), but does not explore possible heterogeneity by race/ethnicity. In thisstudy, separate randomization was conducted by blocking by race/ethnicity in an effort tobuild larger samples of underrepresented students over time. This facilitated comparisons byrace/ethnic block, which also revealed these differences in effect. Further research in thisarea could benefit from more intentional exploration of these differences by race/ethnicgroup and the possible explanations thereof. However, we suggest that these differences mayalso be driven by systematic differences in levels of pre-intervention growth mindset andacademic preparation between African American and Latino/a students.
Further, in contrast to previous findings with incoming first-year students at a flagship stateuniversity (Yeager et al., 2016, Study 2), our social belonging intervention did not yield signifi-cant results on any outcome measure. Both Study 2 and Study 3 in Yeager et al. (2016)) reportedsignificant impacts from a social belonging intervention. Study 2, conducted at a flagship stateuniversity, reported a treatment impact on full-time enrollment of 13% from the social belong-ing treatment. Study 3, conducted at a selective private university, reported a treatment effect of.06 points in cumulative first-year GPA. This may suggest institutional differences between thesites where these studies were conducted, or it may also be a result of the customization neededto calibrate the social belonging intervention toMichigan State University.
Given the specificity of the social belonging intervention to the physical and social con-text in which it is applied, it is possible that the design of the intervention may be moresensitive to “misfit,” which may reduce the impact of the intervention overall. It is alsopossible that the implementation of the intervention within the larger context of a two-dayorientation program may have changed the nature of the control condition, providing par-ticipants with an experience that may address similar uncertainties to those addressed bythe treatment, and thereby reducing the expected treatment effect. This raises importantquestions about what it might mean to properly calibrate an intervention such as this to aparticular context and may require additional modification and innovation, including ashift in the timing of the intervention to after the initial orientation period.
9x̅Latino/a D 4.89, x̅African American D 5.19, t D ¡4.83, d D ¡.36.
334 M. BRODA ET AL.
Limitations
Several limitations of the current study merit further attention. One important limitation ofthis study is the relatively narrow window of time between administration of the interven-tion and measurement of fall and spring semester academic outcomes. This study demon-strates the impact of interventions after one academic year; additional waves of datacollection will be needed to examine whether the positive impacts seen here for Latino/a stu-dents persist for more distal outcomes such as college completion. In addition, Latino/a stu-dents, which were the only subgroup that demonstrated positive impacts from the mindsetintervention, comprise only 5% of the larger student sample. This may limit the generaliz-ability of the findings to a wider population of Latino/a undergraduates in other regional orinstitutional contexts.
Further, for purposes of estimating treatment effects on academic outcomes, this studydoes not differentiate between different types of course credit attempted and completed.Prior research, such as Yeager et al. (2016), Study 2, examined the impact of similar inter-ventions on full-time enrollment, but restricted their analysis to students’ enrollment in coreacademic courses, as opposed to elective courses (e.g., physical education). This decision wasjustified by an extensive analysis of factors of student success that found full-time enrollmentin core classes to be the strongest predictor of eventual college completion. In this study,given the constraints of our available data, all course credits were included, not just thoseattempted or completed in core academic classes.
Conclusion
Taken in context with the results of other studies implementing social-psychological inter-ventions (e.g., Paunesku et al., 2015; Yeager et al., 2016), the results of our study suggest thatlight-touch interventions can improve disadvantaged students’ college GPA, though they arefar from the only worthwhile intervention. However, given the low cost and relatively simpleimplementation of light-touch interventions, they could be more readily applied to a widerpopulation of disadvantaged students. Although promising, they also offer unique imple-mentation challenges. As Yeager and Walton (2011) suggest, these interventions aren’tmagic, and require careful customization to institutional context. More research is neededinto the mechanisms that underlie light-touch interventions and how they might be system-atically modified and customized to meet a range of different strategic purposes. In sum,light-touch interventions may not be a universal solution to the inequities many studentsface today, but they can be one of an array of targeted tools and interventions that can beused to promote equity in postsecondary education.
ARTICLE HISTORY
Received 9 March 2017Revised 20 December 2017Accepted 5 January 2018
ORCID
Michael Broda http://orcid.org/0000-0002-0019-5528
REDUCING INEQUALITY IN ACADEMIC SUCCESS 335
References
Aronson, J., Fried, C. B., & Good, C. (2002). Reducing the effects of stereotype threat on AfricanAmerican college students by shaping theories of intelligence. Journal of Experimental Social Psy-chology, 38(2), 113–125. doi:10.1006/jesp.2001.1491
Bailey, M. J., & Dynarski, S. M. (2011). Inequality in postsecondary attainment. In G. Duncan & R.Murnane (Eds.), Whither opportunity: Rising inequality, schools, and children’s life chances (pp.117–132). New York, NY: Russell Sage Foundation.
Blackwell, L. S., Trzesniewski, K. H., & Dweck, C. S. (2007). Implicit theories of intelligence predictachievement across an adolescent transition: A longitudinal study and an intervention. Child Devel-opment, 78(1), 246–263. doi:10.1111/j.1467-8624.2007.00995.x
Bowen, W. G., Chingos, M. M., & McPherson, M. S. (2009). Crossing the finish line: Completing collegeat America’s Public Universities. Princeton, NJ: Princeton University Press.
Cohen, J., Cohen, P., West, S. G., & Aiken, L. S. (2002). Applied multiple regression/correlation analysisfor the behavioral sciences. New York, NY: Routledge.
Executive Office of the President. (2014). Increasing college opportunity for low-income students: Prom-ising models and a call to action. Retrieved from https://obamawhitehouse.archives.gov/sites/default/files/docs/increasing_college_opportunity_for_lowincome_students_report.pdf
Frank, K. A. (2000). Impact of a confounding variable on a regression coefficient. Sociological Methods& Research, 29(2), 147–194.
Frank, K. A., Maroulis, S. J., Duong, M. Q., & Kelcey, B. M. (2013). What would it take to change aninference? Using Rubin’s causal model to interpret the robustness of causal inferences. EducationalEvaluation and Policy Analysis, 35(4), 437–460. doi:10.3102/0162373713493129
Ginder, S. A., Kelly-Reid, J. E., & Mann, F. B. (2015). Enrollment and employees in postsecondary insti-tutions, Fall 2014; and financial statistics and academic libraries, fiscal year 2014: First look (provi-sional data) (NCES 2016-005). Washington, DC: National Center for Education Statistics.
Hong, Y. Y., Chiu, C. Y., Dweck, C. S., Lin, D. M. S., & Wan, W. (1999). Implicit theories, attributions,and coping: A meaning system approach. Journal of Personality and Social Psychology, 77(3), 588–599. doi:10.1037//0022-3514.77.3.588
Ifill, N., Radford, A. W., Wu, J., Cataldi, E. F., Wilson, D., & Hill, J. (2016). Persistence and attainmentof 2011–12 first-time postsecondary students after 3 years (BPS:12/14) (NCES 2016–401). Washing-ton, DC: National Center for Education Statistics.
Institute of Education Sciences. (2014a). Assessing attrition bias. Washington, DC: Author.Institute of Education Sciences. (2014b). What Works Clearinghouse (WWC) procedures and stand-
ards handbook. Washington, DC: Author.Little, R. J. A., & Rubin, D. B. (2002). Statistical analysis with missing data. New York, NY: Wiley.Olson, K. R., & Dweck, C. S. (2008). A blueprint for social cognitive development. Perspectives on Psy-
chological Science, 3(3), 193–202. doi:10.1111/j.1745-6924.2008.00074.xPaunesku, D., Walton, G. M., Romero, C., Smith, E. N., Yeager, D. S., & Dweck, C. S. (2015). Mindset
interventions are a scalable treatment for academic underachievement. Psychological Science 26(6),784–793. doi:10.1177/0956797615571017
Puma, M. J., Olsen, R. B., Bell, S. H., & Price, C. (2009). What to do when data are missing in grouprandomized controlled trials (NCEE 2009-0049). Washington, DC: National Center for EducationEvaluation and Regional Assistance, Institute of Education Sciences, U.S. Department of Education.
Rubin, D. (1987).Multiple imputation for nonresponse in surveys. New York, NY: Wiley.Schafer, J. L. (1997). Analysis of incomplete multivariate data. Boca Raton, FL: Chapman & Hall/CRC.Snyder, T. D., & Dillow, S. A. (2015). Digest of education statistics 2013 (NCES 2015-011). Washing-
ton, DC: National Center for Education Statistics, Institute of Education Sciences, U.S. Departmentof Education.
StataCorp. (2015). Stata Statistical Software: Release 14. College Station, TX: StataCorp LP.Steele, C. M., & Aronson, J. (1995). Stereotype threat and the intellectual test performance of African
Americans. Journal of Personality and Social Psychology, 69(5), 797–811. doi:10.1037//0022-3514.69.5.797
336 M. BRODA ET AL.
The College Board. (2009). Research notes: ACT and SAT concordance tables. Retrieved December 15,2016, from https://research.collegeboard.org/sites/default/files/publications/2012/7/researchnote-2009-40-act-sat-concordance-tables.pdf
Walton, G. M., & Cohen, G. L. (2007). A question of belonging: Race, social fit, and achievement. Jour-nal of Personality and Social Psychology, 92(1), 82–96. doi:10.1037/0022-3514.92.1.82
Walton, G. M., & Cohen, G. L. (2011). A brief social-belonging intervention improves academic andhealth outcomes among minority students. Science, 331(6023), 1447–1451. doi:10.1126/science.1198364
Wilson, T. D. (2006). The power of social psychological interventions. Science, 313(5791), 1251–1252.doi:10.1126/science.1133017
Wilson, T. D., Damiani, M., & Shelton, N. (2002). Improving the academic performance of college stu-dents with brief attributional interventions. In J. Aronson (Ed.), Improving academic achievement:Impact of psychological factors on education (pp. 88–108). San Diego, CA: Academic Press.
Wilson, T. D., & Linville, P. W. (1982). Improving the academic performance of college freshmen:Attribution therapy revisited. Journal of Personality and Social Psychology, 42(2), 367–376.doi:10.1037//0022-3514.42.2.367
Wilson, T. D., & Linville, P. W. (1985). Improving the performance of college freshmen with attribu-tional techniques. Journal of Personality and Social Psychology, 49(1), 287–293. doi:10.1037//0022-3514.49.1.287
Yeager, D. S., & Dweck, C. S. (2012). Mindsets that promote resilience: When students believe thatpersonal characteristics can be developed. Educational Psychologist, 47(4), 302–314. doi:10.1080/00461520.2012.722805
Yeager, D. S., & Walton, G. M. (2011). Social-psychological interventions in education: They’re notmagic. Review of Educational Research, 81(2), 267–301. doi:10.3102/0034654311405999
Yeager, D. S., Walton, G. M., Brady, S. T., Akcinar, E. N., Paunesku, D., Keane, L., … Gomez, E. M.(2016). Teaching a lay theory before college narrows achievement gaps at scale. Proceedings of theNational Academy of Sciences, 113(24), E3341–E3348. doi:10.1073/pnas.1524360113
REDUCING INEQUALITY IN ACADEMIC SUCCESS 337
Appendix
Table A1. Comparison of estimated mindset treatment effect coefficients, by race/ethnic subgroup andmissing data technique.
Latino/a students(n D 193)
African Americanstudents (n D 318)
White students(n D 3,416)
All students(n D 4,357)
Outcome MI DV LD MI DV LD MI DV LD MI DV LD
Fall semesterGPA 0.38*** 0.36*** 0.38*** 0.03 0.04 0.07 0.02 0.02 0.01 0.03 0.03+ 0.03Credits completed 0.65 0.58 0.78+ ¡0.24 ¡0.49 ¡.01 0.002 0.02 ¡0.06 0.06 0.06 0.03Credits attempted ¡0.01 ¡0.06 0.08 0.02 0.03 0.10 ¡0.02 ¡0.01 ¡0.04 0.01 0.02 ¡.004Full-time enrollment 0.76 0.41 0.79 0.86 0.84 0.87 0.95 0.97 0.75 0.95 0.95 0.77Spring semesterGPA 0.33* 0.31* 0.39* ¡0.05 ¡0.05 .003 ¡0.03 ¡0.03 ¡0.02 ¡0.02 ¡0.02 ¡.001Credits completed 0.89+ 0.84 1.02+ ¡0.32 ¡0.29 0.09 ¡0.07 ¡0.05 ¡0.03 ¡0.04 ¡0.04 0.03Credits attempted 0.08 0.04 0.21 ¡0.31 ¡0.31 ¡0.06 ¡0.004 0.01 0.05 ¡0.03 ¡0.03 0.04Cumulative GPA 0.35** 0.34** 0.38** ¡0.01 ¡.002 0.04 ¡0.004 ¡.002 ¡0.01 0.01 0.01 0.01
Notes. For GPA, credits attempted, and credits completed, treatment effects were estimated by subgroup using separate OLSregressions. In each regression model, in addition to the treatment indicators, the following additional controls wereincluded: survey response rate, initial belonging uncertainty, initial growth mindset, ACT score, high school GPA, and moth-er’s education (BA or higherD 1). For full-time enrollment, a logistic regression model was used with the same covariates.Coefficients presented here are unstandardized regression coefficients for GPA, credits attempted, and credits completed.For full-time enrollment, treatment effects are presented as odds ratios comparing the treatment condition to the controlcondition. MI D multiple imputation; DV D dummy variable method; LDD listwise deletion.
+p < .10.�p < .05.��p < .01.���p < .001.
Table A2. Comparison of estimated belonging uncertainty treatment effect coefficients, by race/ethnicsubgroup and missing data technique.
Latino/a students(n D 209)
African Americanstudents (n D 361)
White students(n D 3,611)
All students(n D 4,657)
Outcome MI DV LD MI DV LD MI DV LD MI DV LD
Fall semesterGPA 0.21+ 0.19 0.35** 0.03 0.03 0.01 0.01 0.01 0.02 0.02 0.02 0.03Credits completed ¡0.003 ¡0.1 0.52 ¡0.47 ¡0.49 ¡0.58+ ¡0.02 ¡0.01 ¡0.02 ¡0.03 ¡0.03 ¡0.04Credits attempted ¡0.52 ¡0.59+ 0.08 ¡0.23 ¡0.23 ¡0.19 ¡0.04 ¡0.02 ¡0.04 ¡0.07 ¡0.06 ¡0.06Full-time enrollment 0.31 0.32 2.75 0.90 0.91 0.99 0.82 0.85 0.72 0.82 0.83 0.77
Spring semesterGPA 0.02 ¡0.002 0.15 ¡0.09 ¡0.09 ¡0.13 ¡0.02 ¡0.02 0.002 ¡0.02 ¡0.02 ¡0.01Credits completed ¡0.14 ¡0.23 0.17 ¡0.57 ¡0.57 ¡0.57 ¡0.13 ¡0.12 ¡0.02 ¡0.04 ¡0.12 ¡0.04Credits attempted ¡0.31 ¡0.37 ¡0.08 ¡0.50 ¡0.51 ¡0.46 ¡0.06 ¡0.04 0.07 ¡0.03 ¡0.05 0.03Cumulative GPA 0.11 0.09 0.25* ¡0.03 ¡0.03 ¡0.06 ¡0.004 ¡0.003 0.01 ¡0.002 ¡0.003 0.01
Notes. For GPA, credits attempted, and credits completed, treatment effects were estimated by subgroup using separate OLSregressions. In each regression model, in addition to the treatment indicators, the following additional controls wereincluded: survey response rate, initial belonging uncertainty, initial growth mindset, ACT score, high school GPA, and moth-er’s education (BA or higherD 1). For full-time enrollment, a logistic regression model was used with the same covariates.Coefficients presented here are unstandardized regression coefficients for GPA, credits attempted, and credits completed.For full-time enrollment, treatment effects are presented as odds ratios comparing the treatment condition to the controlcondition. MI D multiple imputation; DV D dummy variable method; LDD listwise deletion.
+p < .10.�p < .05.��p < .01.
338 M. BRODA ET AL.