Embed Size (px)
Citation preview
POLICY PAPER 32 / FACT SHEET 44
June 2017
The eradication of poverty and
the provision of equitable and
inclusive quality education for
all are two intricately linked
Sustainable Development
Goals (SDGs). As this year’s
High Level Political Forum
focuses on prosperity and
poverty reduction, this paper,
jointly released by the UNESCO
Institute for Statistics (UIS)
and the Global Education
Monitoring (GEM) Report,
shows why education is so
central to the achievement of
the SDGs and presents the
latest estimates on out-of-
school children, adolescents
and youth to demonstrate how
much is at stake. The out-of-
school rate has not budged
since 2008 at the primary
level, since 2012 at the lower
secondary level and since 2013
at the upper secondary level.
The consequences are grave: if
all adults completed secondary
school, the global poverty rate
would be more than halved.
Reducing global poverty through universal primary and secondary education
Out-of-school children, adolescents and youth: global status and trends
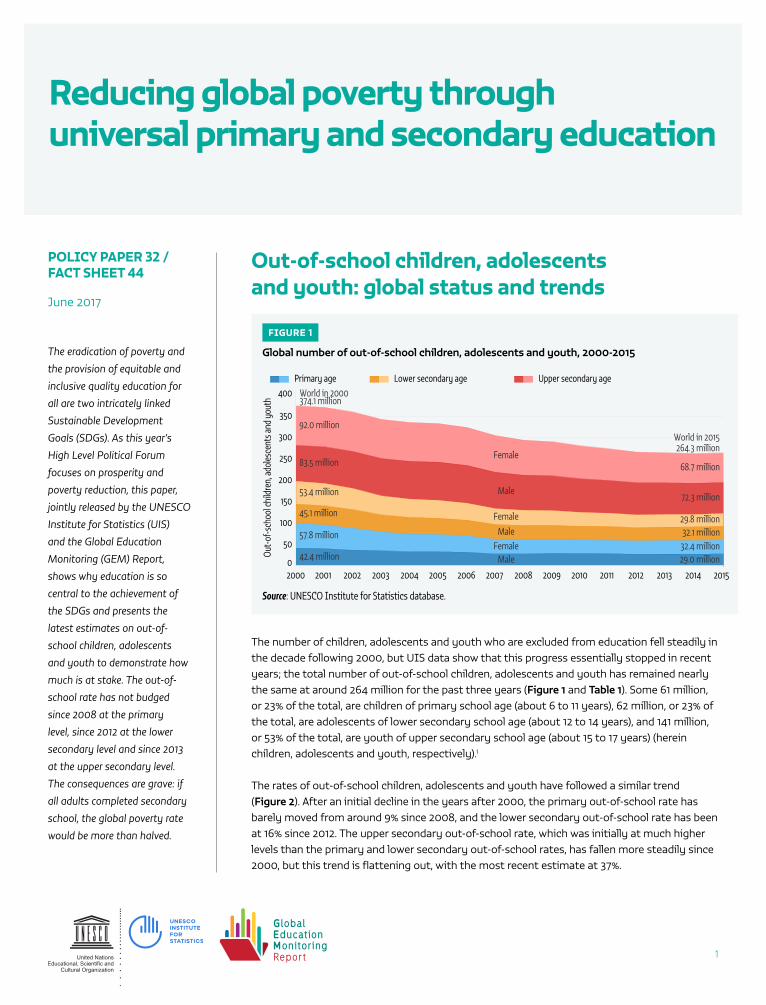
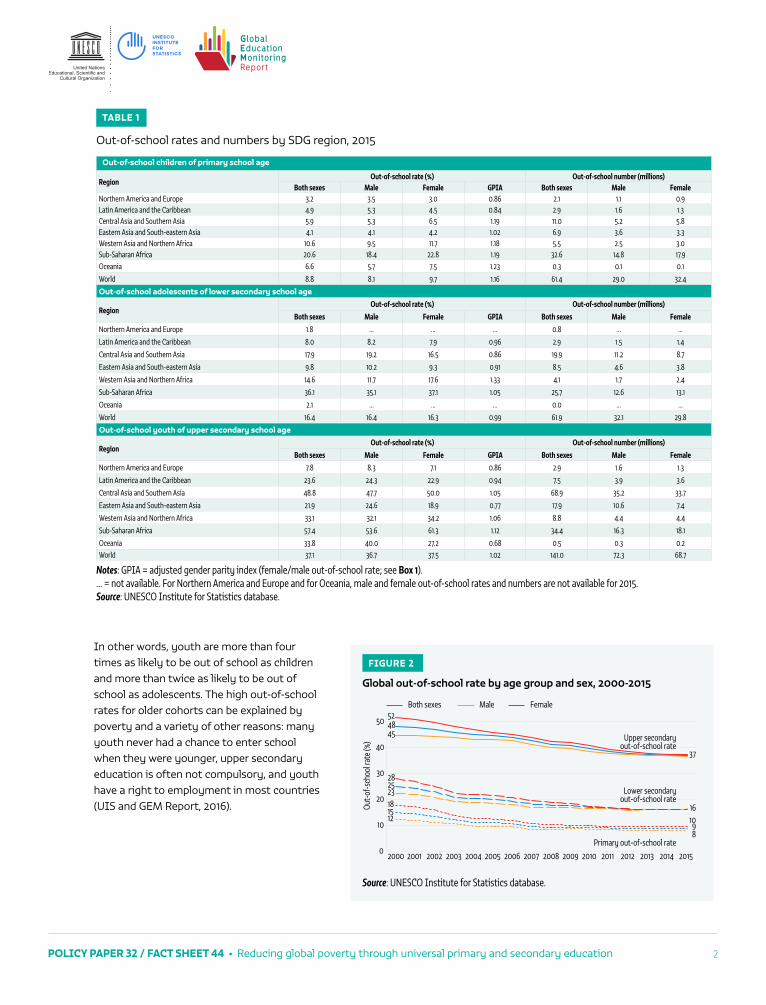
The number of children, adolescents and youth who are excluded from education fell steadily in the decade following 2000, but UIS data show that this progress essentially stopped in recent years; the total number of out-of-school children, adolescents and youth has remained nearly the same at around 264 million for the past three years (Figure 1 and Table 1). Some 61 million, or 23% of the total, are children of primary school age (about 6 to 11 years), 62 million, or 23% of the total, are adolescents of lower secondary school age (about 12 to 14 years), and 141 million, or 53% of the total, are youth of upper secondary school age (about 15 to 17 years) (herein children, adolescents and youth, respectively).i
The rates of out-of-school children, adolescents and youth have followed a similar trend (Figure 2). After an initial decline in the years after 2000, the primary out-of-school rate has barely moved from around 9% since 2008, and the lower secondary out-of-school rate has been at 16% since 2012. The upper secondary out-of-school rate, which was initially at much higher levels than the primary and lower secondary out-of-school rates, has fallen more steadily since 2000, but this trend is flattening out, with the most recent estimate at 37%.
1
FIGURE 1
Global number of out-of-school children, adolescents and youth, 2000-2015
MaleFemale
Male
Female
Male
Female
42.4 million
57.8 million
45.1 million
53.4 million
83.5 million
92.0 million
World in 2000 374.1 million
29.0 million 32.4 million 32.1 million
29.8 million
72.3 million
68.7 million
World in 2015 264.3 million
0
50
100
150
200
250
300
350
Out-o
f-sch
ool c
hild
ren,
adol
esce
nts a
nd y
outh
2000 2001 2002 2003 2004 2005 2006 2007 2008 2009 2010 2011 2012 2013 2014 2015
Primary age Lower secondary age Upper secondary age400
Source: UNESCO Institute for Statistics database.
POLICY PAPER 32 / FACT SHEET 44 • Reducing global poverty through universal primary and secondary education 2
In other words, youth are more than four times as likely to be out of school as children and more than twice as likely to be out of school as adolescents. The high out-of-school rates for older cohorts can be explained by poverty and a variety of other reasons: many youth never had a chance to enter school when they were younger, upper secondary education is often not compulsory, and youth have a right to employment in most countries (UIS and GEM Report, 2016).
TABLE 1
Out-of-school rates and numbers by SDG region, 2015
Out-of-school children of primary school age
RegionOut-of-school rate (%) Out-of-school number (millions)
Both sexes Male Female GPIA Both sexes Male FemaleNorthern America and Europe 3.2 3.5 3.0 0.86 2.1 1.1 0.9Latin America and the Caribbean 4.9 5.3 4.5 0.84 2.9 1.6 1.3Central Asia and Southern Asia 5.9 5.3 6.5 1.19 11.0 5.2 5.8Eastern Asia and South-eastern Asia 4.1 4.1 4.2 1.02 6.9 3.6 3.3Western Asia and Northern Africa 10.6 9.5 11.7 1.18 5.5 2.5 3.0Sub-Saharan Africa 20.6 18.4 22.8 1.19 32.6 14.8 17.9Oceania 6.6 5.7 7.5 1.23 0.3 0.1 0.1
World 8.8 8.1 9.7 1.16 61.4 29.0 32.4
Out-of-school adolescents of lower secondary school age
RegionOut-of-school rate (%) Out-of-school number (millions)
Both sexes Male Female GPIA Both sexes Male FemaleNorthern America and Europe 1.8 … … … 0.8 … …
Latin America and the Caribbean 8.0 8.2 7.9 0.96 2.9 1.5 1.4
Central Asia and Southern Asia 17.9 19.2 16.5 0.86 19.9 11.2 8.7
Eastern Asia and South-eastern Asia 9.8 10.2 9.3 0.91 8.5 4.6 3.8
Western Asia and Northern Africa 14.6 11.7 17.6 1.33 4.1 1.7 2.4
Sub-Saharan Africa 36.1 35.1 37.1 1.05 25.7 12.6 13.1
Oceania 2.1 … … … 0.0 … …
World 16.4 16.4 16.3 0.99 61.9 32.1 29.8
Out-of-school youth of upper secondary school age
RegionOut-of-school rate (%) Out-of-school number (millions)
Both sexes Male Female GPIA Both sexes Male FemaleNorthern America and Europe 7.8 8.3 7.1 0.86 2.9 1.6 1.3
Latin America and the Caribbean 23.6 24.3 22.9 0.94 7.5 3.9 3.6
Central Asia and Southern Asia 48.8 47.7 50.0 1.05 68.9 35.2 33.7
Eastern Asia and South-eastern Asia 21.9 24.6 18.9 0.77 17.9 10.6 7.4
Western Asia and Northern Africa 33.1 32.1 34.2 1.06 8.8 4.4 4.4
Sub-Saharan Africa 57.4 53.6 61.3 1.12 34.4 16.3 18.1
Oceania 33.8 40.0 27.2 0.68 0.5 0.3 0.2World 37.1 36.7 37.5 1.02 141.0 72.3 68.7
Notes: GPIA = adjusted gender parity index (female/male out-of-school rate; see Box 1). … = not available. For Northern America and Europe and for Oceania, male and female out-of-school rates and numbers are not available for 2015.Source: UNESCO Institute for Statistics database.
FIGURE 2
Global out-of-school rate by age group and sex, 2000-2015
1512
18
2523
28
4845
52
98
1016
37
Upper secondaryout-of-school rate
Lower secondaryout-of-school rate
Primary out-of-school rate0
10
20
30
40
50
Out-o
f-sch
ool r
ate (
%)
2000 2001 2002 2003 2004 2005 2006 2007 2008 2009 2010 2011 2012 2013 2014 2015
Both sexes Male Female
Source: UNESCO Institute for Statistics database.
POLICY PAPER 32 / FACT SHEET 44 • Reducing global poverty through universal primary and secondary education 3
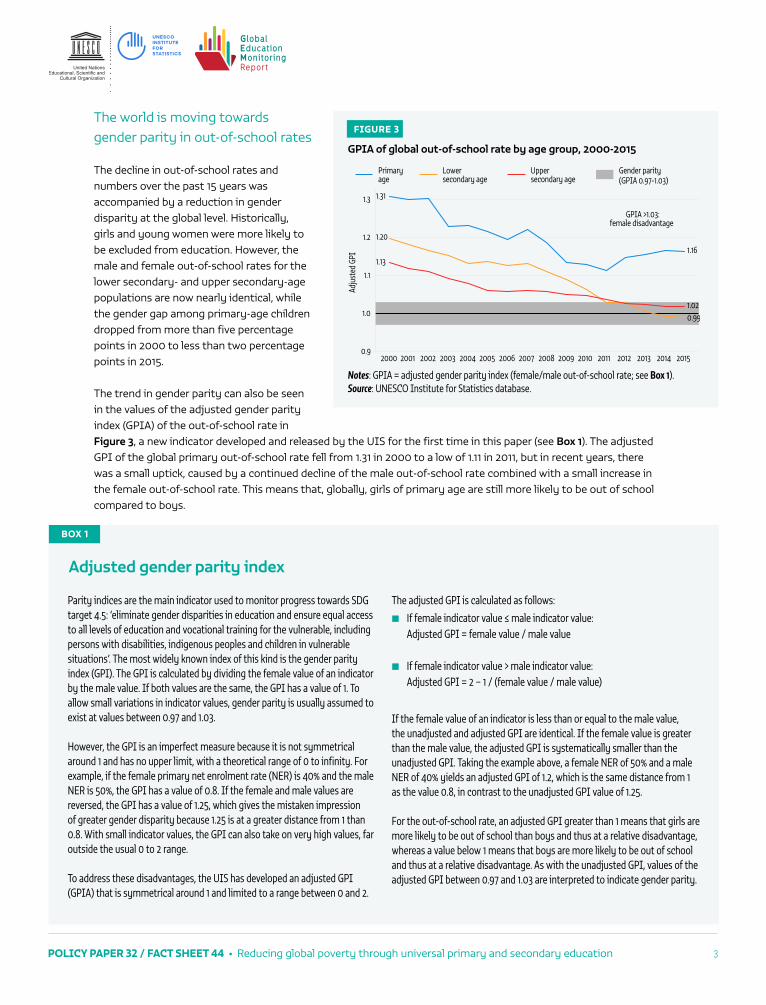
The world is moving towards gender parity in out-of-school rates
The decline in out-of-school rates and numbers over the past 15 years was accompanied by a reduction in gender disparity at the global level. Historically, girls and young women were more likely to be excluded from education. However, the male and female out-of-school rates for the lower secondary- and upper secondary-age populations are now nearly identical, while the gender gap among primary-age children dropped from more than five percentage points in 2000 to less than two percentage points in 2015.
The trend in gender parity can also be seen in the values of the adjusted gender parity index (GPIA) of the out-of-school rate in Figure 3, a new indicator developed and released by the UIS for the first time in this paper (see Box 1). The adjusted GPI of the global primary out-of-school rate fell from 1.31 in 2000 to a low of 1.11 in 2011, but in recent years, there was a small uptick, caused by a continued decline of the male out-of-school rate combined with a small increase in the female out-of-school rate. This means that, globally, girls of primary age are still more likely to be out of school compared to boys.
FIGURE 3
GPIA of global out-of-school rate by age group, 2000-2015
1.31
1.20
1.131.16
0.991.02
GPIA >1.03:female disadvantage
0.9
1.0
1.1
1.2
1.3
Adju
sted
GPI
2000 2001 2002 2003 2004 2005 2006 2007 2008 2009 2010 2011 2012 2013 2014 2015
Primaryage
Lowersecondary age
Uppersecondary age
Gender parity(GPIA 0.97-1.03)
Notes: GPIA = adjusted gender parity index (female/male out-of-school rate; see Box 1). Source: UNESCO Institute for Statistics database.
Adjusted gender parity index
BOX 1
Parity indices are the main indicator used to monitor progress towards SDG target 4.5: ‘eliminate gender disparities in education and ensure equal access to all levels of education and vocational training for the vulnerable, including persons with disabilities, indigenous peoples and children in vulnerable situations’. The most widely known index of this kind is the gender parity index (GPI). The GPI is calculated by dividing the female value of an indicator by the male value. If both values are the same, the GPI has a value of 1. To allow small variations in indicator values, gender parity is usually assumed to exist at values between 0.97 and 1.03.
However, the GPI is an imperfect measure because it is not symmetrical around 1 and has no upper limit, with a theoretical range of 0 to infinity. For example, if the female primary net enrolment rate (NER) is 40% and the male NER is 50%, the GPI has a value of 0.8. If the female and male values are reversed, the GPI has a value of 1.25, which gives the mistaken impression of greater gender disparity because 1.25 is at a greater distance from 1 than 0.8. With small indicator values, the GPI can also take on very high values, far outside the usual 0 to 2 range.
To address these disadvantages, the UIS has developed an adjusted GPI (GPIA) that is symmetrical around 1 and limited to a range between 0 and 2.
The adjusted GPI is calculated as follows:
■ If female indicator value ≤ male indicator value: Adjusted GPI = female value / male value
■ If female indicator value > male indicator value: Adjusted GPI = 2 − 1 / (female value / male value)
If the female value of an indicator is less than or equal to the male value, the unadjusted and adjusted GPI are identical. If the female value is greater than the male value, the adjusted GPI is systematically smaller than the unadjusted GPI. Taking the example above, a female NER of 50% and a male NER of 40% yields an adjusted GPI of 1.2, which is the same distance from 1 as the value 0.8, in contrast to the unadjusted GPI value of 1.25.
For the out-of-school rate, an adjusted GPI greater than 1 means that girls are more likely to be out of school than boys and thus at a relative disadvantage, whereas a value below 1 means that boys are more likely to be out of school and thus at a relative disadvantage. As with the unadjusted GPI, values of the adjusted GPI between 0.97 and 1.03 are interpreted to indicate gender parity.
POLICY PAPER 32 / FACT SHEET 44 • Reducing global poverty through universal primary and secondary education 4
In contrast, the most recent values of the adjusted GPI for the lower secondary and upper secondary out-of-school rates are in the gender parity range between 0.97 and 1.03, meaning that males and females in these age groups have the same probability of being out of school.
It is important to note that global averages mask disparities at the regional and country levels, which are discussed below. In many countries, girls of all ages face considerable barriers to education.
Regional and national out-of-school figuresThe global out-of-school figures hide large regional differences. The section that follows presents data for the regions used to monitor the SDGs (see Box 2).
Sub-Saharan Africa has the highest out-of-school rates
As in previous years, sub-Saharan Africa remains the region with the highest out-of-school rates for all age groups (see Table 1 and Figure 5). Of the 61 million out-of-school children, 33 million, or more than half, live in sub-Saharan Africa. Central Asia and Southern Asia has the second highest number of out-of-school children with 11 million. Sub-Saharan Africa also has the highest rate of exclusion, with 21% of children denied the right to education, followed by Western Asia and Northern Africa (11%) and Oceania (7%).
The global lower secondary out-of-school rate (16%) is nearly twice as high as the primary out-of-school rate, but because it is calculated for a smaller age cohort, the global number of out-of-school adolescents (62 million) is only slightly higher than the number of out-of-school children.
Three regions are home to nine out of ten out-of-school adolescents: sub-Saharan Africa (26 million), Central Asia and Southern Asia (20 million) and Eastern and South-eastern Asia (8.5 million). Sub-Saharan Africa is also the region with the highest rate of out-of-school adolescents (36%), followed by Central and Southern Asia (18%), and Western Asia and Northern Africa (15%).
In all regions, out-of-school rates and numbers are far higher among youth of upper secondary age than among younger cohorts. In total, 141 million youth were not in school in 2015, 18 million more than the combined number of
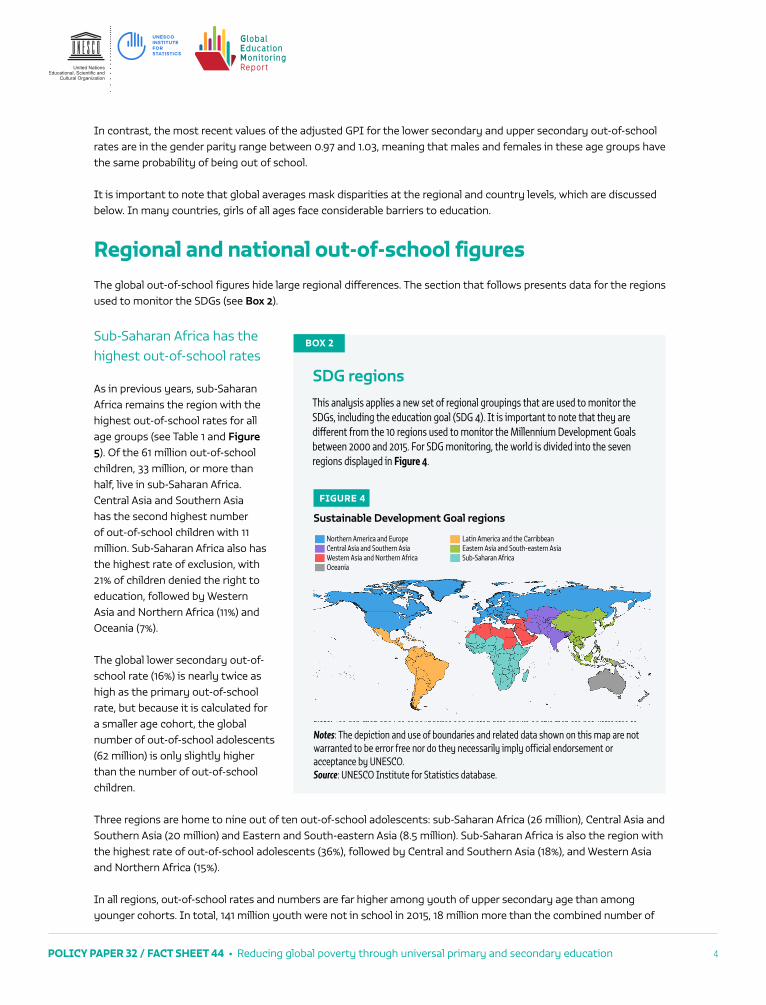
SDG regions
BOX 2
This analysis applies a new set of regional groupings that are used to monitor the SDGs, including the education goal (SDG 4). It is important to note that they are different from the 10 regions used to monitor the Millennium Development Goals between 2000 and 2015. For SDG monitoring, the world is divided into the seven regions displayed in Figure 4.
FIGURE 4
Sustainable Development Goal regionsSustainable Development Goal regions
Northern America and EuropeCentral Asia and Southern AsiaWestern Asia and Northern AfricaOceania
Latin America and the CarribbeanEastern Asia and South-eastern AsiaSub-Saharan Africa
Notes: The depiction and use of boundaries and related data shown on this map are not warranted to be error free nor do they necessarily imply official endorsement or acceptance by UNESCO.Source: UNESCO Institute for Statistics database.
POLICY PAPER 32 / FACT SHEET 44 • Reducing global poverty through universal primary and secondary education 5
out-of-school children and adolescents. The largest proportion, 69 million, live in Central Asia and Southern Asia, a further 34 million in sub-Saharan Africa, and 18 million in Eastern Asia and South-eastern Asia. More than half of all youth are out of school in sub-Saharan Africa (57%), and nearly half of all youth in Central Asia and Southern Asia (49%).
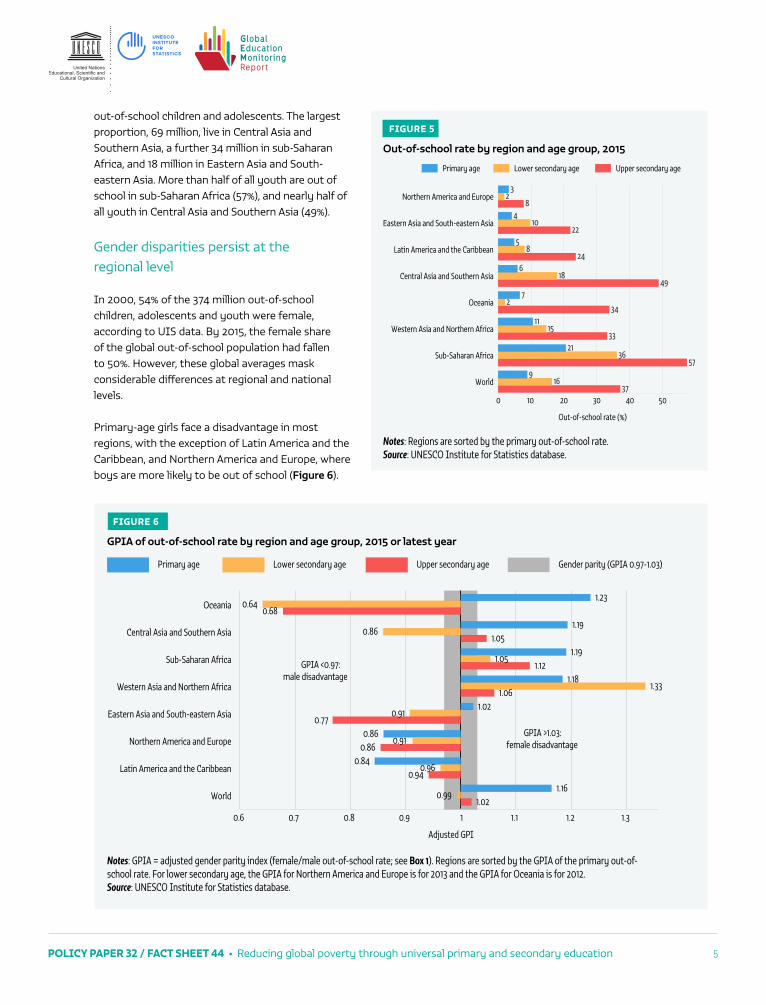
Gender disparities persist at the regional level
In 2000, 54% of the 374 million out-of-school children, adolescents and youth were female, according to UIS data. By 2015, the female share of the global out-of-school population had fallen to 50%. However, these global averages mask considerable differences at regional and national levels.
Primary-age girls face a disadvantage in most regions, with the exception of Latin America and the Caribbean, and Northern America and Europe, where boys are more likely to be out of school (Figure 6).
FIGURE 5
Out-of-school rate by region and age group, 2015
3716
957
3621
3315
1134
27
4918
624
85
2210
48
23
0 10 20 30 40 50
Out-of-school rate (%)
World
Sub-Saharan Africa
Western Asia and Northern Africa
Oceania
Central Asia and Southern Asia
Latin America and the Caribbean
Eastern Asia and South-eastern Asia
Northern America and Europe
Primary age Lower secondary age Upper secondary age
Notes: Regions are sorted by the primary out-of-school rate.Source: UNESCO Institute for Statistics database.
FIGURE 6
GPIA of out-of-school rate by region and age group, 2015 or latest year
1.16
1.02
1.18
1.19
1.19
1.23
0.84
0.86
1.33
1.05
0.99
0.96
0.91
0.91
0.86
0.64
1.02
1.06
1.12
1.05
0.94
0.86
0.77
0.68
GPIA <0.97:male disadvantage
GPIA >1.03:female disadvantage
World
Latin America and the Caribbean
Northern America and Europe
Eastern Asia and South-eastern Asia
Western Asia and Northern Africa
Sub-Saharan Africa
Central Asia and Southern Asia
Oceania
0.6 0.7 0.8 0.9 1 1.1 1.2 1.3
Adjusted GPI
Primary age Lower secondary age Upper secondary age Gender parity (GPIA 0.97-1.03)
Notes: GPIA = adjusted gender parity index (female/male out-of-school rate; see Box 1). Regions are sorted by the GPIA of the primary out-of-school rate. For lower secondary age, the GPIA for Northern America and Europe is for 2013 and the GPIA for Oceania is for 2012.Source: UNESCO Institute for Statistics database.
POLICY PAPER 32 / FACT SHEET 44 • Reducing global poverty through universal primary and secondary education 6
The widest gender disparities at primary age are observed in Oceania, with an adjusted GPI of 1.23. Gender parity among children has only been achieved in one region: Eastern Asia and South-eastern Asia.
For lower secondary out-of-school rates, the widest gender disparities are observed in Oceania and in Western Asia and Northern Africa. In the former region, male adolescents are more likely to be out of school, with an adjusted GPI of 0.64; whereas, in the latter region, females are disadvantaged, with an adjusted GPI of 1.33. No region has achieved gender parity, but Latin America and the Caribbean (adjusted GPI 0.96) and sub-Saharan Africa (adjusted GPI 1.05) are close to parity for this age group.
Among youth, large disparities in favour of females are observed in Oceania (adjusted GPI 0.68), and Eastern Asia and South-eastern Asia (adjusted GPI 0.77). Central Asia and Southern Asia (adjusted GPI 1.05), Western and Asia and Northern Africa (1.06), and Latin America and the Caribbean (adjusted GPI 0.94) are close to gender parity.
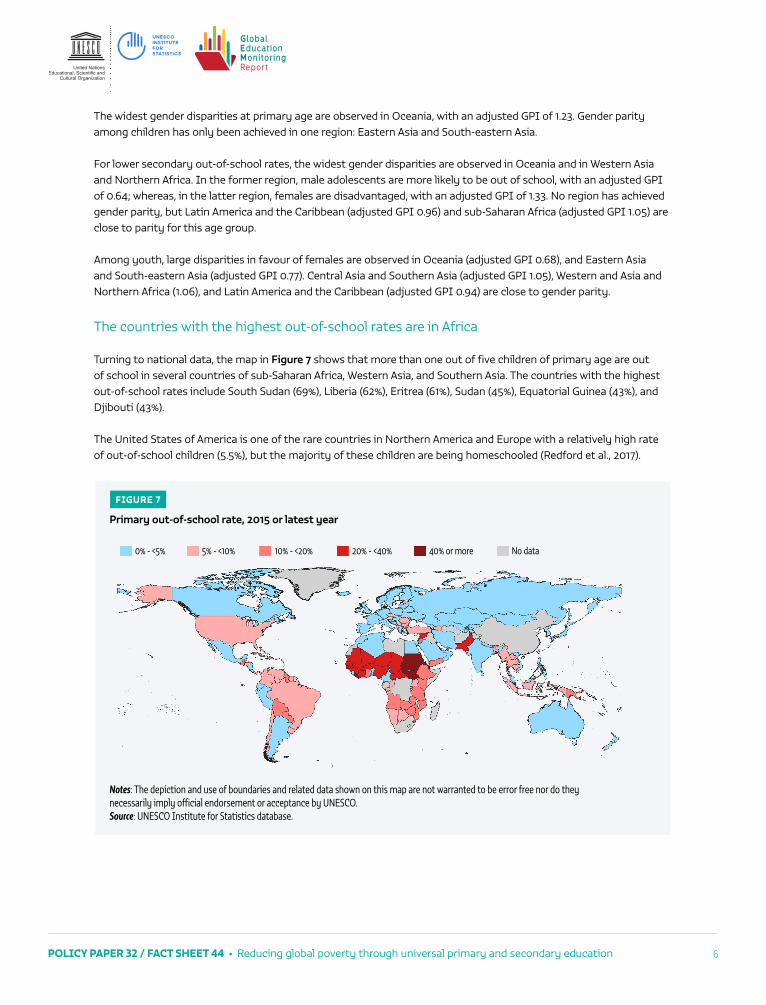
The countries with the highest out-of-school rates are in Africa
Turning to national data, the map in Figure 7 shows that more than one out of five children of primary age are out of school in several countries of sub-Saharan Africa, Western Asia, and Southern Asia. The countries with the highest out-of-school rates include South Sudan (69%), Liberia (62%), Eritrea (61%), Sudan (45%), Equatorial Guinea (43%), and Djibouti (43%).
The United States of America is one of the rare countries in Northern America and Europe with a relatively high rate of out-of-school children (5.5%), but the majority of these children are being homeschooled (Redford et al., 2017).
FIGURE 7
Primary out-of-school rate, 2015 or latest year
0% - <5% 5% - <10% 10% - <20% 20% - <40% 40% or more No data
Notes: The depiction and use of boundaries and related data shown on this map are not warranted to be error free nor do they necessarily imply official endorsement or acceptance by UNESCO.Source: UNESCO Institute for Statistics database.
POLICY PAPER 32 / FACT SHEET 44 • Reducing global poverty through universal primary and secondary education 7
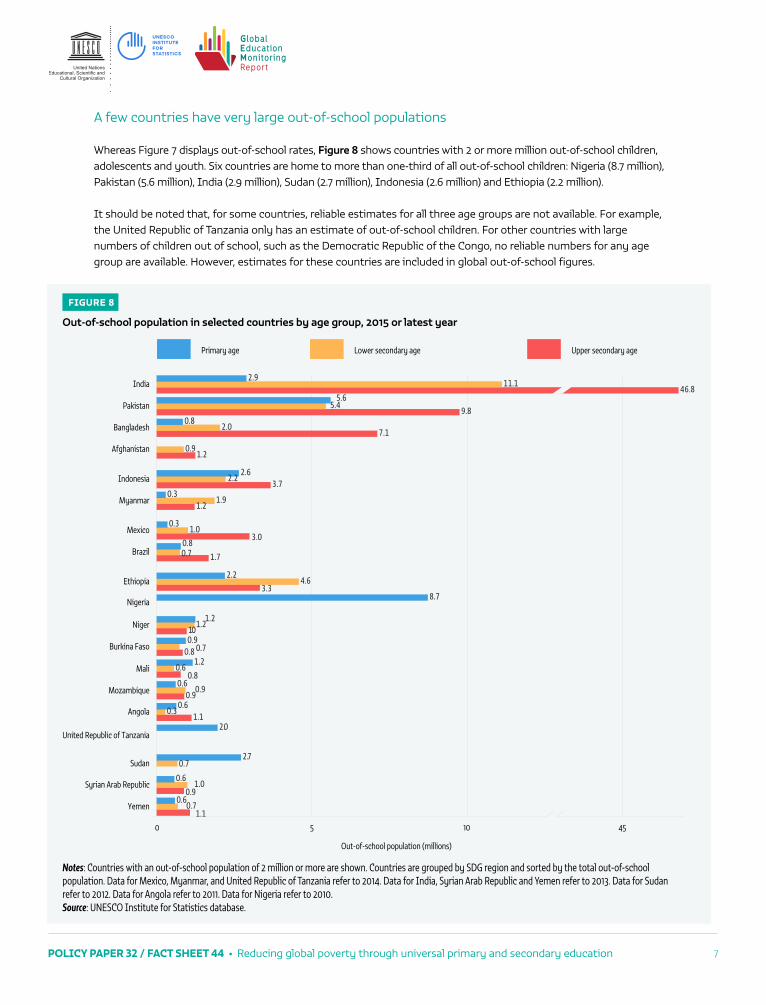
A few countries have very large out-of-school populations
Whereas Figure 7 displays out-of-school rates, Figure 8 shows countries with 2 or more million out-of-school children, adolescents and youth. Six countries are home to more than one-third of all out-of-school children: Nigeria (8.7 million), Pakistan (5.6 million), India (2.9 million), Sudan (2.7 million), Indonesia (2.6 million) and Ethiopia (2.2 million).
It should be noted that, for some countries, reliable estimates for all three age groups are not available. For example, the United Republic of Tanzania only has an estimate of out-of-school children. For other countries with large numbers of children out of school, such as the Democratic Republic of the Congo, no reliable numbers for any age group are available. However, estimates for these countries are included in global out-of-school figures.
FIGURE 8
Out-of-school population in selected countries by age group, 2015 or latest year
1.10.7
0.60.9
1.00.6
0.72.7
2.01.1
0.30.6
0.90.9
0.60.8
0.61.2
0.8 0.70.91.0
1.21.2
8.73.3
4.62.2
1.70.70.8
3.01.0
0.3
1.21.9
0.33.7
2.22.6
1.20.9
7.12.0
0.89.8
5.45.6
46.811.1
2.9
0 5 10 45
Out-of-school population (millions)
Yemen
Syrian Arab Republic
Sudan
United Republic of Tanzania
Angola
Mozambique
Mali
Burkina Faso
Niger
Nigeria
Ethiopia
Brazil
Mexico
Myanmar
Indonesia
Afghanistan
Bangladesh
Pakistan
India
Primary age Lower secondary age Upper secondary age
Notes: Countries with an out-of-school population of 2 million or more are shown. Countries are grouped by SDG region and sorted by the total out-of-school population. Data for Mexico, Myanmar, and United Republic of Tanzania refer to 2014. Data for India, Syrian Arab Republic and Yemen refer to 2013. Data for Sudan refer to 2012. Data for Angola refer to 2011. Data for Nigeria refer to 2010.Source: UNESCO Institute for Statistics database.
POLICY PAPER 32 / FACT SHEET 44 • Reducing global poverty through universal primary and secondary education 8
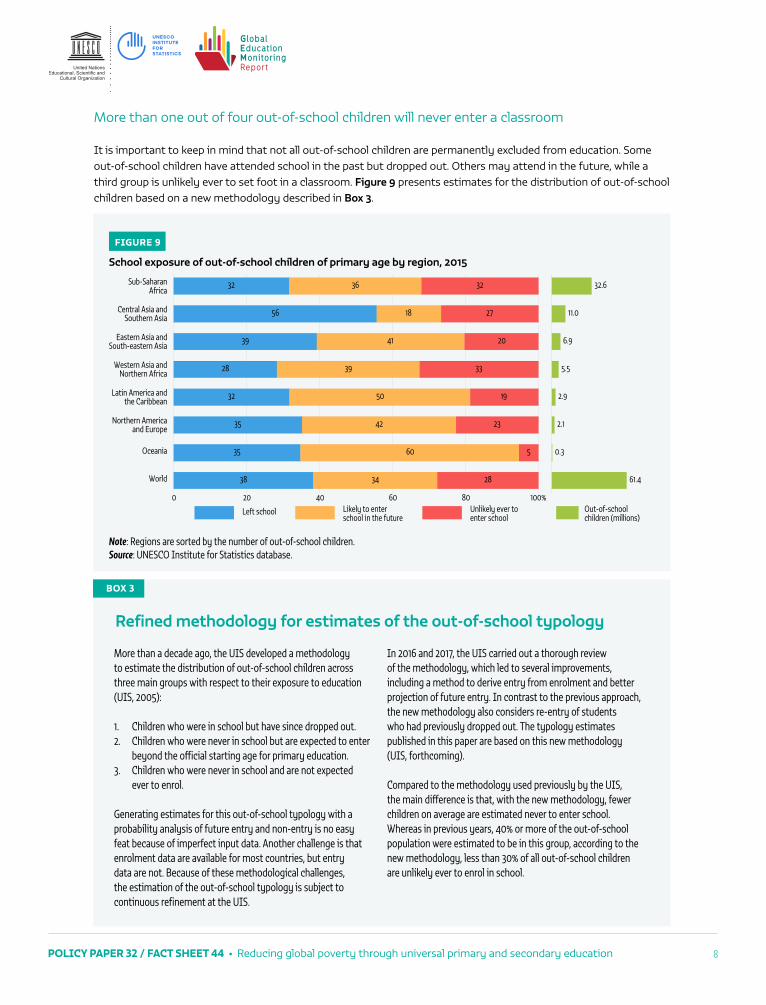
More than one out of four out-of-school children will never enter a classroom
It is important to keep in mind that not all out-of-school children are permanently excluded from education. Some out-of-school children have attended school in the past but dropped out. Others may attend in the future, while a third group is unlikely ever to set foot in a classroom. Figure 9 presents estimates for the distribution of out-of-school children based on a new methodology described in Box 3.
FIGURE 9
School exposure of out-of-school children of primary age by region, 2015
38 34 28
35 60 5
35 42 23
32 50 19
28 39 33
39 41 20
56 18 27
32 36 32
0 20 40 60 80 100%
World
Oceania
Northern Americaand Europe
Latin America andthe Caribbean
Western Asia andNorthern Africa
Eastern Asia andSouth-eastern Asia
Central Asia andSouthern Asia
Sub-SaharanAfrica
Left school Likely to enterschool in the future
Unlikely ever toenter school
61.4
0.3
2.1
2.9
5.5
6.9
11.0
32.6
0
Out-of-schoolchildren (millions)
Note: Regions are sorted by the number of out-of-school children.Source: UNESCO Institute for Statistics database.
Refined methodology for estimates of the out-of-school typology
BOX 3
More than a decade ago, the UIS developed a methodology to estimate the distribution of out-of-school children across three main groups with respect to their exposure to education (UIS, 2005):
1. Children who were in school but have since dropped out.2. Children who were never in school but are expected to enter
beyond the official starting age for primary education.3. Children who were never in school and are not expected
ever to enrol.
Generating estimates for this out-of-school typology with a probability analysis of future entry and non-entry is no easy feat because of imperfect input data. Another challenge is that enrolment data are available for most countries, but entry data are not. Because of these methodological challenges, the estimation of the out-of-school typology is subject to continuous refinement at the UIS.
In 2016 and 2017, the UIS carried out a thorough review of the methodology, which led to several improvements, including a method to derive entry from enrolment and better projection of future entry. In contrast to the previous approach, the new methodology also considers re-entry of students who had previously dropped out. The typology estimates published in this paper are based on this new methodology (UIS, forthcoming).
Compared to the methodology used previously by the UIS, the main difference is that, with the new methodology, fewer children on average are estimated never to enter school. Whereas in previous years, 40% or more of the out-of-school population were estimated to be in this group, according to the new methodology, less than 30% of all out-of-school children are unlikely ever to enrol in school.
POLICY PAPER 32 / FACT SHEET 44 • Reducing global poverty through universal primary and secondary education 9
Globally, 28%, or 17 million, of all out-of-school children have never attended school and will probably never start, if current trends continue. About 38% of all out-of-school children attended school in the past but did not continue their education, and 34% are likely to enter school late and will be over-age for their grade, according to UIS estimates.
In sub-Saharan Africa and in Western Asia and Northern Africa, one out of three out-of-school children will probably never receive any formal education. This is also the case for more than one out of four out-of-school children in Central Asia and Southern Asia. In Oceania and in Latin America and the Caribbean, most out-of-school children will start school late. Central Asia and Southern Asia has the highest proportion of early school leavers among children out of school. Across this region, more than one in every two out-of-school children started primary school but did not make it to the last grade.
The classification of out-of-school children by past and possible future school attendance yields important insights for policy-makers. To be effective, policies must be tailored to address the different situations facing out-of-school children. If the majority of out-of-school children in a country attended but left school, interventions should focus on reducing the dropout rate. For children who are likely to attend in the future, the goal is to ensure earlier entry into the education system. The most challenging group of out-of-school children are those who are unlikely ever to attend school, often because of a perpetuating cycle of lack of education and poverty. The final section of this paper offers some suggestions for improving the situation of children, adolescents and youth who are excluded from education because of poverty and other factors.
Poverty and educationMany studies have shown a strong association between poverty and education regarding both school attendance and learning outcomes. These links can be observed at the country level and at the level of individuals.
Out-of-school rates are highest in poor countries
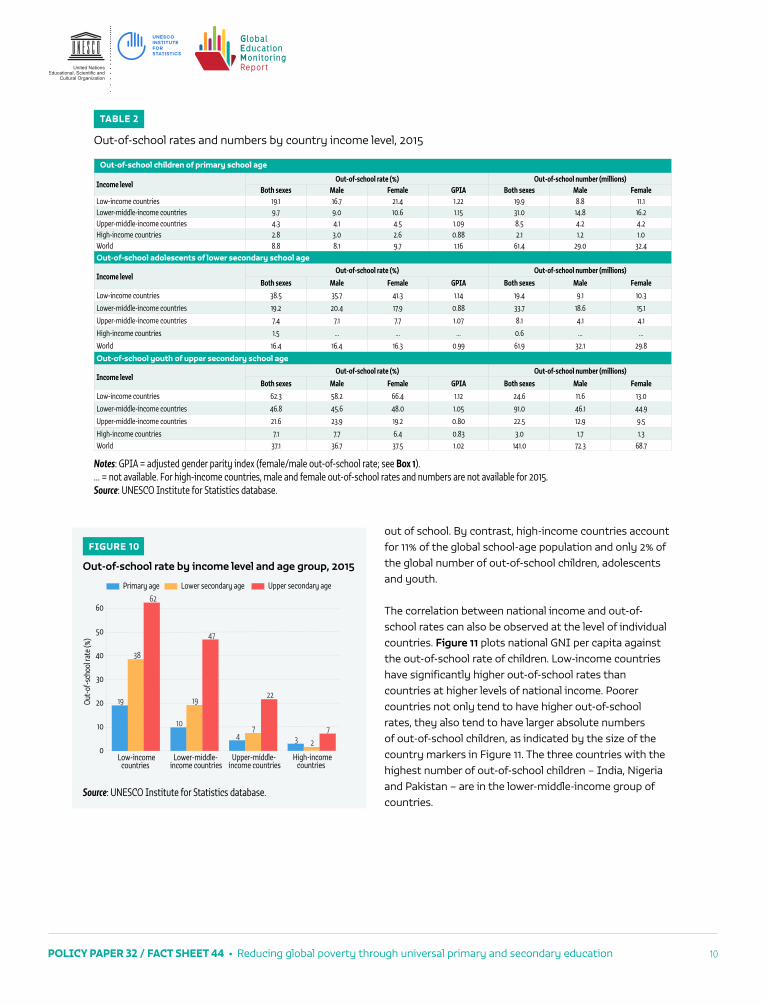
The World Bank assigns countries to four groups according to their gross national income (GNI) per capita (World Bank, 2017). In low-income countries, out-of-school rates are systematically higher than in lower-middle-income, upper-middle-income and high-income countries (see Table 2 and Figure 10). For example, the primary out-of-school rate is 19% in low-income countries and 3% in high-income countries. The lower secondary out-of-school rate is 38% and 2%, respectively, and the upper secondary out-of-school rate is 62% and 7%, respectively. As a group, low-income countries combined have higher out-of-school rates than all individual SDG regions, except for sub-Saharan Africa, which has a marginally higher primary out-of-school rate.
Poverty levels also have a direct impact on gender disparities in education. A comparison of male and female out-of-school rates shows that, in low-income countries, females are more likely to be out of school than males (see Table 2). This is especially true for youth, where female out-of-school rates are higher in low-income and lower-middle-income countries, while male out-of-school rates are higher in upper-middle-income and high-income countries.
Low-income countries are home to a disproportionately large share of the global out-of-school population
Lower-middle-income countries (including Bangladesh, India, Indonesia, Nigeria and Pakistan) and upper-middle-income countries (including Brazil and China) are home to the majority of the school-age population.
Low-income countries (including Afghanistan, Burkina Faso, Ethiopia, Mali, Mozambique, Niger and the United Republic of Tanzania) account for a disproportionately large share of the global number of out-of-school children, adolescents and youth. They are home to 13% of the world’s school-age population but 24% of the global population
POLICY PAPER 32 / FACT SHEET 44 • Reducing global poverty through universal primary and secondary education 10
out of school. By contrast, high-income countries account for 11% of the global school-age population and only 2% of the global number of out-of-school children, adolescents and youth.
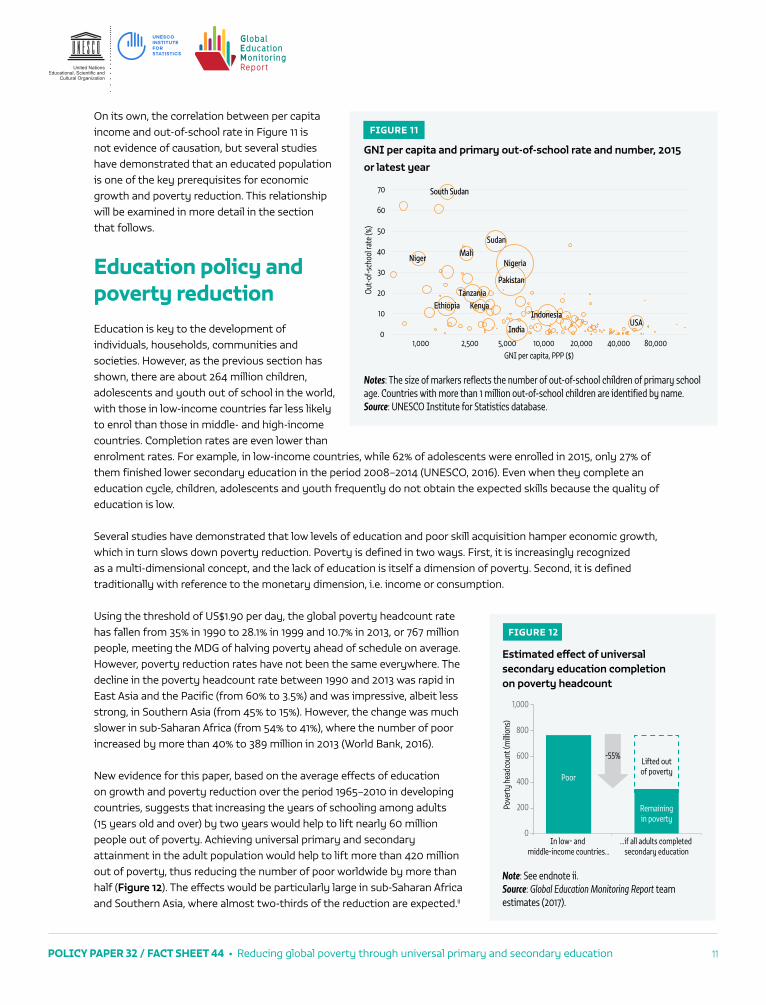
The correlation between national income and out-of-school rates can also be observed at the level of individual countries. Figure 11 plots national GNI per capita against the out-of-school rate of children. Low-income countries have significantly higher out-of-school rates than countries at higher levels of national income. Poorer countries not only tend to have higher out-of-school rates, they also tend to have larger absolute numbers of out-of-school children, as indicated by the size of the country markers in Figure 11. The three countries with the highest number of out-of-school children – India, Nigeria and Pakistan – are in the lower-middle-income group of countries.
TABLE 2
Out-of-school rates and numbers by country income level, 2015
Out-of-school children of primary school age
Income levelOut-of-school rate (%) Out-of-school number (millions)
Both sexes Male Female GPIA Both sexes Male FemaleLow-income countries 19.1 16.7 21.4 1.22 19.9 8.8 11.1Lower-middle-income countries 9.7 9.0 10.6 1.15 31.0 14.8 16.2Upper-middle-income countries 4.3 4.1 4.5 1.09 8.5 4.2 4.2High-income countries 2.8 3.0 2.6 0.88 2.1 1.2 1.0World 8.8 8.1 9.7 1.16 61.4 29.0 32.4Out-of-school adolescents of lower secondary school age
Income levelOut-of-school rate (%) Out-of-school number (millions)
Both sexes Male Female GPIA Both sexes Male FemaleLow-income countries 38.5 35.7 41.3 1.14 19.4 9.1 10.3
Lower-middle-income countries 19.2 20.4 17.9 0.88 33.7 18.6 15.1
Upper-middle-income countries 7.4 7.1 7.7 1.07 8.1 4.1 4.1
High-income countries 1.5 … … … 0.6 … …
World 16.4 16.4 16.3 0.99 61.9 32.1 29.8
Out-of-school youth of upper secondary school age
Income levelOut-of-school rate (%) Out-of-school number (millions)
Both sexes Male Female GPIA Both sexes Male FemaleLow-income countries 62.3 58.2 66.4 1.12 24.6 11.6 13.0
Lower-middle-income countries 46.8 45.6 48.0 1.05 91.0 46.1 44.9
Upper-middle-income countries 21.6 23.9 19.2 0.80 22.5 12.9 9.5
High-income countries 7.1 7.7 6.4 0.83 3.0 1.7 1.3World 37.1 36.7 37.5 1.02 141.0 72.3 68.7
Notes: GPIA = adjusted gender parity index (female/male out-of-school rate; see Box 1). … = not available. For high-income countries, male and female out-of-school rates and numbers are not available for 2015.Source: UNESCO Institute for Statistics database.
FIGURE 10
Out-of-school rate by income level and age group, 2015
19
38
62
10
19
47
47
22
3 2
7
0
10
20
30
40
50
60
Out-o
f-sch
ool r
ate (
%)
Low-incomecountries
Lower-middle-income countries
Upper-middle-income countries
High-incomecountries
Primary age Lower secondary age Upper secondary age
Source: UNESCO Institute for Statistics database.
POLICY PAPER 32 / FACT SHEET 44 • Reducing global poverty through universal primary and secondary education 11
On its own, the correlation between per capita income and out-of-school rate in Figure 11 is not evidence of causation, but several studies have demonstrated that an educated population is one of the key prerequisites for economic growth and poverty reduction. This relationship will be examined in more detail in the section that follows.
Education policy and poverty reductionEducation is key to the development of individuals, households, communities and societies. However, as the previous section has shown, there are about 264 million children, adolescents and youth out of school in the world, with those in low-income countries far less likely to enrol than those in middle- and high-income countries. Completion rates are even lower than enrolment rates. For example, in low-income countries, while 62% of adolescents were enrolled in 2015, only 27% of them finished lower secondary education in the period 2008–2014 (UNESCO, 2016). Even when they complete an education cycle, children, adolescents and youth frequently do not obtain the expected skills because the quality of education is low.
Several studies have demonstrated that low levels of education and poor skill acquisition hamper economic growth, which in turn slows down poverty reduction. Poverty is defined in two ways. First, it is increasingly recognized as a multi-dimensional concept, and the lack of education is itself a dimension of poverty. Second, it is defined traditionally with reference to the monetary dimension, i.e. income or consumption.
Using the threshold of US$1.90 per day, the global poverty headcount rate has fallen from 35% in 1990 to 28.1% in 1999 and 10.7% in 2013, or 767 million people, meeting the MDG of halving poverty ahead of schedule on average. However, poverty reduction rates have not been the same everywhere. The decline in the poverty headcount rate between 1990 and 2013 was rapid in East Asia and the Pacific (from 60% to 3.5%) and was impressive, albeit less strong, in Southern Asia (from 45% to 15%). However, the change was much slower in sub-Saharan Africa (from 54% to 41%), where the number of poor increased by more than 40% to 389 million in 2013 (World Bank, 2016).
New evidence for this paper, based on the average effects of education on growth and poverty reduction over the period 1965–2010 in developing countries, suggests that increasing the years of schooling among adults (15 years old and over) by two years would help to lift nearly 60 million people out of poverty. Achieving universal primary and secondary attainment in the adult population would help to lift more than 420 million out of poverty, thus reducing the number of poor worldwide by more than half (Figure 12). The effects would be particularly large in sub-Saharan Africa and Southern Asia, where almost two-thirds of the reduction are expected.ii
FIGURE 11
GNI per capita and primary out-of-school rate and number, 2015
or latest year
Ethiopia
India
IndonesiaKenya
MaliNiger Nigeria
Pakistan
South Sudan
Sudan
Tanzania
USA0
10
20
30
40
50
60
70
Out-o
f-sch
ool r
ate (
%)
1,000 2,500 5,000 10,000 20,000 40,000 80,000GNI per capita, PPP ($)
Notes: The size of markers reflects the number of out-of-school children of primary school age. Countries with more than 1 million out-of-school children are identified by name.Source: UNESCO Institute for Statistics database.
FIGURE 12
Estimated effect of universal secondary education completion on poverty headcount
0
200
400
600
800
1,000
Pove
rty h
eadc
ount
(milli
ons)
In low- and middle-income countries...
Poor
Lifted outof poverty
Remainingin poverty
...if all adults completed secondary education
-55%
Note: See endnote ii.Source: Global Education Monitoring Report team estimates (2017).
POLICY PAPER 32 / FACT SHEET 44 • Reducing global poverty through universal primary and secondary education 12
A range of education development paths can be effective in different ways in increasing growth and reducing poverty. The rest of this paper looks at education, poverty, inequality and growth interactions and the channels through which education can affect them.
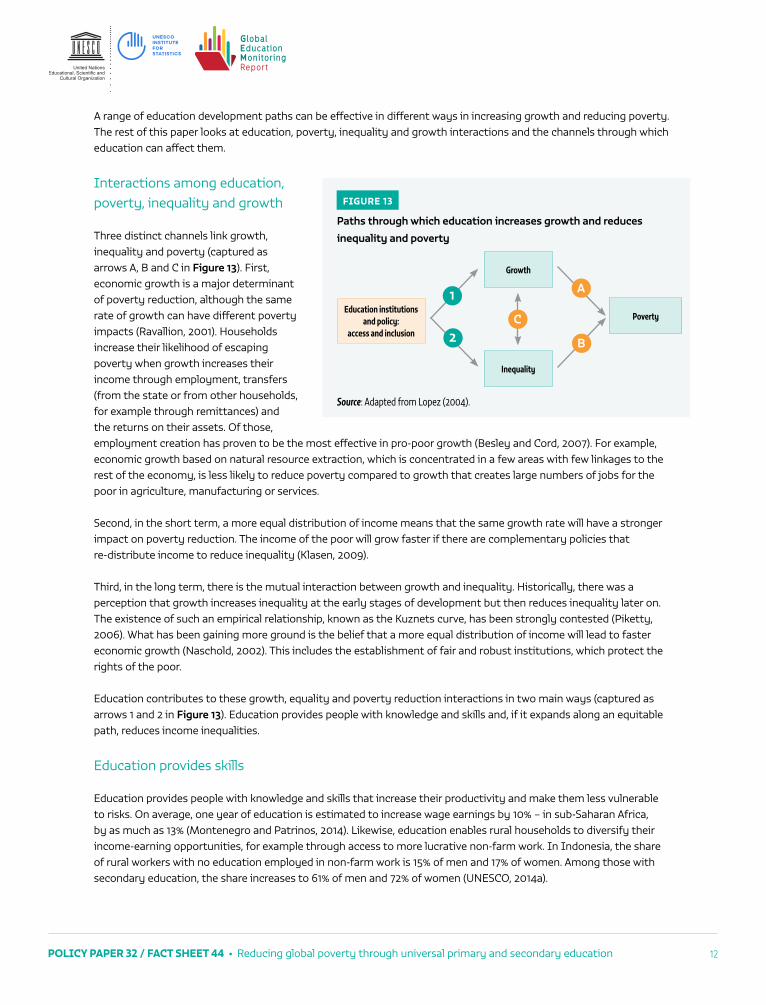
Interactions among education, poverty, inequality and growth
Three distinct channels link growth, inequality and poverty (captured as arrows A, B and C in Figure 13). First, economic growth is a major determinant of poverty reduction, although the same rate of growth can have different poverty impacts (Ravallion, 2001). Households increase their likelihood of escaping poverty when growth increases their income through employment, transfers (from the state or from other households, for example through remittances) and the returns on their assets. Of those, employment creation has proven to be the most effective in pro-poor growth (Besley and Cord, 2007). For example, economic growth based on natural resource extraction, which is concentrated in a few areas with few linkages to the rest of the economy, is less likely to reduce poverty compared to growth that creates large numbers of jobs for the poor in agriculture, manufacturing or services.
Second, in the short term, a more equal distribution of income means that the same growth rate will have a stronger impact on poverty reduction. The income of the poor will grow faster if there are complementary policies that re-distribute income to reduce inequality (Klasen, 2009).
Third, in the long term, there is the mutual interaction between growth and inequality. Historically, there was a perception that growth increases inequality at the early stages of development but then reduces inequality later on. The existence of such an empirical relationship, known as the Kuznets curve, has been strongly contested (Piketty, 2006). What has been gaining more ground is the belief that a more equal distribution of income will lead to faster economic growth (Naschold, 2002). This includes the establishment of fair and robust institutions, which protect the rights of the poor.
Education contributes to these growth, equality and poverty reduction interactions in two main ways (captured as arrows 1 and 2 in Figure 13). Education provides people with knowledge and skills and, if it expands along an equitable path, reduces income inequalities.
Education provides skills
Education provides people with knowledge and skills that increase their productivity and make them less vulnerable to risks. On average, one year of education is estimated to increase wage earnings by 10% – in sub-Saharan Africa, by as much as 13% (Montenegro and Patrinos, 2014). Likewise, education enables rural households to diversify their income-earning opportunities, for example through access to more lucrative non-farm work. In Indonesia, the share of rural workers with no education employed in non-farm work is 15% of men and 17% of women. Among those with secondary education, the share increases to 61% of men and 72% of women (UNESCO, 2014a).
FIGURE 13
Paths through which education increases growth and reduces
inequality and poverty
Education institutions and policy:
access and inclusion
Growth
Inequality
Poverty
1
2
A
B
C
Source: Adapted from Lopez (2004).
POLICY PAPER 32 / FACT SHEET 44 • Reducing global poverty through universal primary and secondary education 13
Education increases resilience, as it prepares individuals to cope with risks for themselves and their family members throughout the life cycle. For example, in early childhood, pneumonia is the largest cause of death, accounting for almost a million deaths, or 16% of the total, in 2015 (WHO, 2017). Pneumonia is identified as a disease of poverty, but maternal education can mitigate its effects, reducing factors that put children most at risk of dying from pneumonia, such as failure to carry out measles vaccination in the first 12 months, malnutrition and low birth weight (Rudan et al., 2008). A review of 32 studies in poorer countries showed that maternal education contributed to the choice of improved fuels and stoves over those that burn solid fuel, giving off harmful smoke and fine particles in poorly ventilated homes (Lewis and Pattanayak, 2012). In Bangladesh, women with some education were 37% more likely to select an improved cooking stove (Miller and Mobarak, 2013).
The poor are vulnerable to several shocks in adulthood too. The number of deaths from extreme climate events and other natural catastrophes, including storms, floods, droughts, earthquakes and landslides, is expected to rise (Lutz et al., 2014). If universal secondary education is achieved by 2030, by 2040–2050, there will be 10,000 to 20,000 fewer disaster-related deaths per decade at constant disaster frequency, and 30,000 to 50,000 fewer deaths in a scenario of increased disaster frequency. Increased secondary education in Asia would have an especially strong impact on the predicted global pattern, as the continent is home to some of the largest populations, many of whom reside in coastal areas where most disasters occur (UNESCO, 2016).
Poor women are particularly vulnerable to gender biases. Education empowers women and gives them more opportunities to make choices. It can boost their confidence and perception of freedom. It can also alter the perceptions of men influencing gender stereotypes. In Pakistan, only 30% of women with no education believe they can have a say in the number of children they have, compared to 63% of women with lower secondary education. In Sierra Leone, an additional year of schooling reduced women’s tolerance of domestic violence from 36% to 26%. A literacy programme in Uttarakhand, India increased the share of women who felt able to leave the house without permission (from 58% to 75%) and participate in village council meetings (from 19% to 41%) (UNESCO, 2014a).
Education and literacy protect working men and women from exploitation in the labour market, for example by increasing their opportunities to obtain secure contracts. In urban El Salvador, only 7% of working women and men with less than primary education had an employment contract, leaving them very vulnerable. By contrast, 49% of those with secondary education had signed a contract (UNESCO, 2014a).
Equitable education expansion can reduce income inequalities
Under certain conditions, the equitable expansion of education helps to reduce inequality, as a review of 64 studies has shown (Abdullah et al., 2015). In particular, ensuring that most people have completed secondary schooling is an essential condition of reducing inequality within countries.
In Brazil, France and Malaysia, income inequality, as captured by the Gini coefficient, fell by about seven percentage points over two decades, as the share of the population with secondary education grew. In Malaysia, the share of adults with secondary education increased from 20% in 1980 to 48% in 2000, while the Gini coefficient fell from 0.51 to 0.44. Ensuring completion of secondary education is necessary for reducing income inequality within countries, but it is not sufficient. Between 1990 and 2010, income inequality increased in high- and middle-income countries, notably in China and India, where demand for skills outpaced supply, benefitting those with the highest levels of education relatively more (UNESCO, 2014b).
POLICY PAPER 32 / FACT SHEET 44 • Reducing global poverty through universal primary and secondary education 14
Effect of education policies on growth, inequality and povertyDifferent policy levers targeting access and inclusion as dimensions of education quality have distinct effects on the effectiveness of the channels linking education with growth, inequality and poverty. The extent to which education policies reach and integrate poor people is key for leveraging poverty reduction through economic growth.
Improved access is fundamental to improved out-of-school rates
It is mainly the poor who miss out on schooling. Estimates from the World Inequality Database on Education suggest that, in lower-middle-income countries, children from the poorest 20% are eight times as likely to be out of school as children from the richest 20% (UNESCO, 2017b). As the first part of this paper showed, children, adolescents and youth in low-income countries are nine times as likely to be out of school as those in high-income countries.
The direct costs of education to families are crucial in this respect and need to be eliminated. In South Africa, fees were abolished in the poorest 40% of schools. An evaluation found that this increased enrolment in grades 8 to 10 by more than three percentage points in the poorest 20% of schools, despite the fact that the fees amounted to only about 1.5% of household income (Borkum, 2012).
In Andhra Pradesh, India, an evaluation of the Midday Meals Scheme, the largest school feeding programme in the world, showed that it had compensated for the effects of severe drought on height and weight loss, helping boys to catch up (Singh et al., 2013). In fact, exposure to midday meals in primary school also increased learning achievement in mathematics and reading by 9% and 18%, respectively (Chakraborty and Jayaraman, 2016).
In Burkina Faso, a programme targeting provinces with the lowest enrolment rates combined school construction with other interventions, including mentoring, daily school meals and take-home food rations. Female attendance increased by 20 percentage points, with reduced distance to school reportedly one of the most important factors (Kazianga et al., 2013).
Reducing the indirect cost of education to families is also critical, including through cash transfers to families, scholarships and incentives to students. A meta-analysis of 42 impact evaluation studies for 19 conditional cash transfer programmes in 15 countries showed that attendance increased by 2.5% in primary schools and by 8% in secondary schools. These programmes have a stronger impact when they are combined with grants, infrastructure or other resources for schools, as in the Oportunidades programme in Mexico. Likewise, effects were also stronger when payments were less frequent and the attached conditions were more stringent, as in the Bono de Desarrollo Humano programme in Ecuador (Saavedra and Garcia, 2013).
Complementary health interventions are also necessary to ensure children do not lose school time due to illness. The national school-based deworming programme in Kenya, which began in 2008, not only increased school attendance at the time of its implementation but, 10 years after the treatment, women are still 25% more likely to have attended secondary school, halving the gender gap (Baird et al., 2016). The programme has since expanded, reaching more than 6 million children in 2015. In India, a national deworming programme announced in February 2015 treated 90 million children in 11 states by October 2015.
POLICY PAPER 32 / FACT SHEET 44 • Reducing global poverty through universal primary and secondary education 15
Policy can address inclusion barriers to staying in school
Not only are poor children, adolescents and youth disadvantaged because of poor nutrition or few home resources to complement their education, they also often suffer from discrimination and stigmatization in schools and classrooms. Teacher education needs to prepare trainees to be attentive and responsive to the needs of students from diverse – and especially marginalized – backgrounds so that they can instruct them using a wide array of pedagogical strategies. Training in diagnostic and formative assessment tools is crucial for teachers to identify weak learners and provide them with targeted support.
After Viet Nam recognized a need for appropriate human resources to support inclusive education, it developed a core national teacher education curriculum and guiding framework (Inclusive Education in Action, 2010). Courses cover the preparation of individual education plans for all learners, designing and adapting activities for children with different learning needs, and assessing learning outcomes of children with special needs or disabilities (Nguyet and Ha, 2010).
Teachers also need training to understand and recognize how their own attitudes, perceptions and expectations affect their interactions with male and female pupils, especially those from disadvantaged backgrounds, who are more vulnerable to discrimination at school and at home. In Turkey, a one-term initial teacher education course on gender equity, addressing gender socialization, selection of teaching materials and the school environment, improved female teachers’ gender attitudes and awareness (Erden, 2009).
In addition to teachers, the curriculum is also at the heart of teaching and learning challenges, either hindering or facilitating improved learning outcomes. To improve learning for all children, inclusive curricula, and corresponding assessment strategies, can reduce disparities in school achievement and offer all children the opportunity to acquire vital transferable skills.
Policies on the language of instruction can hold the key for making education systems more inclusive for disadvantaged groups. In Ethiopia, the introduction of mother tongue instruction in 1994 is estimated to have increased education attainment by half a year, the ability to read by 40% and the probability of reading a newspaper by about 25% (Ramachandran, 2017).
Another challenge is how to adapt the curriculum and its delivery to the needs of poor or marginalized students. Malawi’s government targeted a nationally representative apprenticeship programme at vulnerable youth, mainly defined as orphans or school dropouts. Master craftspeople offered about three months of training in 17 trades, based on a set of customized training modules. The programme improved both self-assessed practical skills and the number of hours spent on skill development one year after the training was completed, although only for male participants (Cho et al., 2013). Second-chance programmes with more applied and practical curricula are also vital in reaching out to marginalized groups. In Nicaragua, a non-formal adult education programme for youth who had not completed primary school improved learning outcomes and, unlike in formal programmes, poverty was not correlated with achievement. In addition, participants were more engaged in civic and social groups (Handa et al., 2009).
In New Delhi, a vocational training programme in stitching and tailoring, implemented by non-government organizations Pratham and Social Awakening Through Youth Action, was offered to poor young women living in migrant slums. Six months after the end of the programme, women who received training were six percentage points more likely to be employed, worked 2.5 more hours per week, and gained 1.5 times more monthly earnings. After 18 months, all initial effects were sustained (Maitra and Mani, 2016).
POLICY PAPER 32 / FACT SHEET 44 • Reducing global poverty through universal primary and secondary education 16
ConclusionFar too many children, adolescents and youth are still out of school for multiple reasons relating to their living conditions, financial constraints and social adversities. Education can play a transformative role to help them escape poverty, but education policies need to do far more to improve access and inclusion.
While it is very challenging to bring out-of-school youth back into education, there is also a disquieting slowdown in the pace at which the world’s children and adolescents are being integrated into national education systems. The global primary out-of-school rate has remained stubbornly at 9% for eight years in a row. As education and poverty are dynamic phenomena with strong inter-generational effects, failure to act now jeopardizes the future of several generations. As shown in this paper, global poverty could be more than halved almost within a generation if all adults completed secondary school.
UNESCO Institute for Statistics (UIS)C.P. 6128 Succursale Centre-villeMontreal, Quebec H3C 3J7 CanadaTel: +1 514 343 6880Fax: +1 514 343 5740Email: [email protected]://www.uis.unesco.org
The UIS is the official source of education data used to monitor SDG 4-Education 2030. The UNESCO eAtlas of Out-of-School Children lets you explore the data with interactive maps at http://on.unesco.org/oosc-map. Go straight to the source of the data at http://www.uis.unesco.org.
EFA Global Education Monitoring Report c/o UNESCO 7, place de Fontenoy 75352 Paris 07 SP, France Email: [email protected] Tel: +33 (1) 45 68 07 41 Fax: +33 (1) 45 68 56 41 www.unesco.org/gemreport
Developed by an independent team and published by UNESCO, the Global Education Monitoring Report is an authoritative reference that aims to inform, influence and sustain genuine commitment towards the global education targets in the new Sustainable Development Goals (SDGs) framework.
© UNESCO 2017/ED/GEMR/MRT/PP/32
i For all age groups, the UIS uses the same definition of ‘out of school’: children, adolescents and youth of primary, lower secondary and upper secondary school age who are not enrolled in formal primary, secondary or post-secondary education.
ii Details on the estimation models and results are available in a technical note (UNESCO, 2017a). The analysis is based on a system generalized methods of moments model. Data for attainment rates and years of schooling over the period 1965 to 2010 are drawn from the last update of the Barro and Lee dataset (2016), while data on gross domestic product per capita and poverty headcount are drawn from the World Development Indicators.
References to this policy paper can be found here: https://en.unesco.org/gem-report/sites/gem-report/files/ Out_of_School_References.pdf