Embed Size (px)
Citation preview

(i)
(!)
Reducing Fire Deaths in Older Adults:Optimizing the Smoke Alarm Signal
Research Project
Summary technical report
THEFIRE PROTECTIONRESEARCH FOUNDATION
.. .". .". " -- ........ ."..-... -.. --
--.W
.......--"' . - -
11
-.. -...---..--..-
...---. 11."'-
"'.
THE FIRE PROTECTIONRESEARCH FOUNDATION
ONE BATTERYMARCH PARKQUINCY, MASSACHUSETTS , U. A. 02269
MAIL: Foundation(ij)NFPA.org
(i)
(!)
Reducing Fire Deaths in Older Adults:Optimizing the Smoke Alarm Signal
Research Project
Summary technical report
Prepared by
Justin A. GeimanDaniel T. Gottuk
Hughes Associates , Inc.
THEFIRE PROTECTIONRESEARCH FOUNDATION
.". -
.". F_
-- ........ ."..- . .. .. -
--. w ..
..... --"' . - - -
11
-.. -- . . . --- . . --.. - ... .---.
11.... -
... .
THE FIRE PROTECTIONRESEARCH FOUNDATION
ONE BATTERYMARCH PARKQUINCY, MASSACHUSETTS , U. A. 02269
MAIL: FoundationCi!'NFPA.org (g Copyright The Fire Protection Research Foundation
May 2006

FOREWORD
Smoke alarm and signaling systems are a proven strategy for reduction of firefatalities in the general population. However, studies have shown that the elderlydo not fully benefit from conventional smoke alarm systems , particularly duringthe sleeping hours. In April of 2005 , the Fire Protection Research Foundationwas awarded a Fire Prevention and Safety Grant by the US Fire Administrationfor a new project to study this topic.
The Dverall goal of the project was to optimize the performance requirements foralarm and signaling systems to meet the needs of an aging population. Thisreports presents the results of the study, which involved several tasks including arisk assessment to estimate the potential impact in lives saved of changes inwaking effectiveness of smoke alarms for older adults , quantifying the humanbehavior aspects of the problem , developing benchmark performance criteria foralarm and signaling systems, and reviewing new and promising technologies thataddress the performance criteria.
A portion of the study involved the conduct of human behavior studies toinvestigate the arousal thresholds from sleep in older adults to the current USsmoke alarm and compare these thresholds to several alternative signals , and toinvestigate the performance abilities of older adults when awoken suddenly by analarm. The detailed results of this portion of the study are presented in acompanion report entitled " Investigation of Auditory Arousal With Different AlarmSignals in Sleeping Older Adults
The Research Foundation expresses gratitude to: the report authors: JustinGeiman and Daniel Gottuk , Hughes Associates , Inc. , the Project TechnicalPanel: Guylene Proulx , David Albert , Dana Mulvany, Arthur Lee , DonaldSievers , Rita Fahy, Wendy Gifford , Isaac Papier, Karen Boyce , LeonardBelliveau , Paul Patty, and Lee Richardson; and the project sponsors: US FireAdministration , BRK Brands/First Alert , Innovalarm , SimplexGrinnell , SiemensBuilding Technologies , National Electrical Manufacturers Association , GESecurity, Honeywell , and Kidde.
The content , opinions and conclusions contained in this report are solely those ofthe authors.

Reducing Fire Deaths in Older Adults:Optimizing the Smoke Alarm Signal
Research Project
Technical Panel
David Albert, InnovAlarm
Leonard Belliveau , Hughes Associates , Inc.
Karen Boyce , University of Ulster
Rita Fahy, NFPA
Wendy Gifford , Invensys Controls/Firex
Arthur Lee , U.S. Consumer Product Safety Commission
Dana Mulvany
Isaac Papier, Honeywell Life Safety
Paul Patty, Underwriters Laboratories Inc.
Guylene Proulx , National Research Council of Canada
Lee Richardson , NFPA
Donald Sievers , D. E. Sievers & Associates , Ltd.
SponsorsS. Fire Adminsitration
BRK Brands/First Alert
GE Security
Honeywell
InnovAlarm
Kidde
National Electrical Manufacturers Association
Siemens Building Technologies
SimplexGrinnell

Reducing Fire Deaths in Older Adults:Optimizing the Smoke Alarm Signal
Prepared for:
The Fire Protection Research Foundation1 Batterymarch Park
Quincy, MA 02169-7471
Prepared by:
Justin A. Geiman and Daniel T. GottukHughes Associates, Inc.
3610 Commerce Drive, Suite 817Baltimore, MD 21227- 1652
May 30, 2006

EXECUTIVE SUMMARY
Older adults (those 65 years of age and over) have been identified as a high risk group interms of fire safety. People age 65 and over have a fire death rate more than twice that of thenational average and the disparity in fire death rate increases with age. Given that the U.Census Bureau estimates that the older adult population will more than double over the nextthirty years, there is certainly cause for concern. The use of smoke alarm and signaling systemsis associated with a reduction in fire fatalities in the general population-reducing the chances ofdying in a fire by 40 to 50 percent when present. However, recent studies suggest that olderadults may not fully benefit from conventional smoke alarm systems , particularly duringsleeping hours. The tendency for older adults to experience high frequency hearing loss has beenattributed as a potential fire safety problem since typical residential smoke alarms have a highfrequency signal , between 3 000-4 000 Hertz (Hz).
The objective of this project was to assess and optimize the performance requirements foralarm and signaling systems to meet the needs of an aging population. This project wasseparated into several tasks in order to achieve its objective. First, the older adult population wascharacterized relative to potential risk factors. Second, a risk assessment of older adults wasperformed to quantify the potential impact of improving the waking effectiveness of smokealarms , in terms of the number of potential lives saved. This assessment was based on existingdata regarding the characteristics offire victims and fires. Third, the human behavior aspects ofthe problem were addressed; this work consisted of a sleep study of older adults and the detailsare presented in a companion report. Both the arousal thresholds from sleep for variousfrequencies and types of alann signals, as well as the cognitive and physical abilities uponwaking were examined in the sleep study. Fourth, a review was conducted of new and promisingtechnologies that may improve the waking effectiveness of smoke alarms for older adults andimprove their overall fire safety.
Numerous factors associated with the risk of fire death have been identified in the literatureincluding many that are likely to be significant to older adults. The primary focus of this study ison risk factors such as the age of the occupant, whether the victim was sleeping at the time of thefire , and whether smoke alarms were present and operated. Beyond simply the age of theoccupant, other characteristics and behaviors of the occupant likely affect the fire risk of olderadults , such as disabilities, smoking, chemical substance use (e. , medicine and alcohol), andbeing home alone at the time of the fire. The rate of disabilities among older adults are at leasttwo to three times that of the general population. Intuitively, since many disabilities impact theability to quickly escape, the high rate of disabilities among older adults may be a primary factorin their higher risk of fire death. However, little data exists to assess the importance ofdisabilities to the fire death risk of older adults. Smoking materials are the leading cause ofdeath in all age groups over 35 , including older adults. Despite having the lowest prevalence ofsmokers (less than half of the general population), older adults have an equal or greater risk ofdying in smoking related fires. Alcohol intoxication is a significant and often underreportedfactor in fire deaths. Although intoxicated older adults certainly are at a higher risk of death infire , alcohol intoxication appears to be less common in older adults than the general population.In several studies, around half of all adult fire victims were legally intoxicated. However, forolder adults the proportion offire victims that were intoxicated was as low as one in five.Another risk factor that is not often addressed , but may be a contributor for older adults with

disabilities or for those with difficulty hearing the alarm, is whether the victim was alone at thetime ofthe fire. Older adults, particularly women , are approximately three times more likelythan the general population to be living alone. One study found that nearly half of all older adultfire victims that died despite having a smoke alann that operated were alone at the time of thefire.
Operable smoke alarms are associated with a reduction fire death risk. However, severalsmall studies have indicated that older adults may be more likely to have maintenance issueswith their smoke alarms than the general population. Also, these studies found a significantnumber (at least 20 percent) of the alarms found in the homes of older adults were believed to beover 10 years old and needed replacement. Likewise, based on a review of smoke alannrequirements and the ages of homes older adults typically occupy, it is estimated that up to 90percent of older adult households do not have interconnected smoke alanns or smoke alanns inbedrooms. With interconnected smoke alarms, when one smoke alarm goes into alarm, allconnected smoke alarms also alarm. This arrangement increases the sound levels of audiblealarms throughout a home so occupants are aware of fires, even if the fire is on the other end ofthe home or on a different story of the home. Instant notification from the first smoke alarmincreases the time available for escape compared to waiting for additional alarms closer to theoccupant to respond. Overall , the limited data available on smoke alarm usage among olderadults indicates that they may not be receiving the full benefit provided by current coderequirements for operational smoke alarms that are interconnected and located on every floor andin bedrooms.
In an effort to understand the potential impact of improving the waking effectiveness ofsmoke alarms for older adults, a risk analysis was perfonned to determine the reduction in riskassociated with such changes. Based on national estimates derived from the National FireIncident Reporting System (NFIRS) and annual National Fire Protection Association (NFPA)surveys , smoke alarms that are improved to wake all sleeping occupants would reduce theestimated risk to older adults by 27-32 percent. There are two primary reasons for the modestrisk reduction found. First, even if all occupants were awakened , some of the occupants wouldstill be expected to die as a result of unsuccessful escape attempts or because the occupant selectsan activity, such as firefighting or attempting to rescue others , that may involve indefinitelyextended time in hazardous conditions. Secondly, only 36-38 percent of older adult firefatalities were reported to be sleeping when fatally injured. Therefore, a 27-32 percent riskreduction for older adults represents a realistic upper bound to the potential impact of improvingthe smoke alarm signal. This equates to an annual reduction in home fire deaths of 230-270people age 65 and over, based on the annual average of older adult home fire deaths from 1999-2002.
The practicality of achieving the risk reduction expected from improved wakingeffectiveness must be assessed in light of the presence and operability of smoke alarms. Victimsthat do not have an operable smoke alarm will not benefit from an improved smoke alarm signal.Less than one out of four older adult fire victims who were sleeping when fatally injured had anoperable smoke alarm.

The risk reduction expected from improvements in the waking effectiveness of smoke alarmsfor other age groups was also analyzed for comparison to older adults. For both the under 18 and18-64 age groups, larger risk reductions than those expected for older adults are estimated. Theprimary driver of the larger risk reduction for these two age groups is that they have a greaterpercentage of occupants sleeping when fatally injured (56-58 percent for those under age 18 and44-45 percent for those 18-64 years) compared to older adults (36-38 percent). The statistics onsmoke alarm presence and operability for fire fatalities in the under 18 and 18-64 age groupswere remarkably similar to those of older adult fire fatalities. The implication of these statisticsis that although improving the waking effectiveness of smoke alarms is important, it is alsonecessary to increase the presence and operability of smoke alanns. In order to realize thebenefits of improved smoke alarm waking effectiveness , smoke alarms must be present andoperable. This conclusion applies to older adults, as well as the general population.
The sleep study portion ofthis project provided insights into the human behavior aspects ofwaking older adults exposed to varying types of signals and varying sound levels. A total of 42older adults, ranging in age from 65-85 years, participated in the study. Four signals wereexamined , including a 3000 Hz high-frequency T-3 alarm signal (typical of that used in U.smoke alarms), a 500 Hz low-frequency T-3 alarm signal , a 500-2500 Hz mixed frequency T-alarm signal , and a male voice (200-2500Hz) alann signal. The results showed that the mixedfrequency T-3 alann signal provided the greatest waking effectiveness of the signals evaluatedincluding the high frequency T- , typical of most current alarms. In fact, the high-frequency T-performed the most poorly of the alternative signals tested. There was a substantial difference inthe median auditory arousal thresholds (20 dBA) between the high-frequency T-3 alann signaland the mixed frequency T-3. The results also indicate that a male voice alarm is not suitable forolder adults. In tenns of the cognitive and physical abilities of older adults upon waking to analarm , a decrement in physical functioning of around 10-17 percent was observed, with noimportant effects on simple or cognitive functioning.
In summary, the sleep study concluded that the high frequency alarm signal that is typicallyused in current smoke alarms should be replaced by an alternative signal that offers significantlybetter waking effectiveness across the general population, once the nature of the best signal hasbeen determined. While the research to determine such a signal is ongoing, it is imperative thatthe use of interconnected smoke alarm in bedrooms be encouraged to provide the maximumpotential benefit of current and future alarms. Proper use and maintenance of smoke alanns isalso critical to realizing the benefits of smoke alanns.
Numerous, current and promising technologies are available that may improve the wakingeffectiveness of smoke alarms for older adults and improve their fire safety. These technologiescan be broadly categorized as those that provide alternative audible alann signals, those thatprovide alternative sensory stimuli (visual, tactile), those related to the interconnection of smokealarms and notification devices , and those that facilitate testing and maintenance of alanns.Despite research, including the work done as part of this project, that shows alternative audiblealarm signals may benefit smoke alarm users, including older adults , there are few productscurrently available that address this issue. The focus of the smoke alarm industry in terms ofaddressing the needs of the hearing impaired has largely been on technologies that provide visualstimuli (i.e. strobes) to supplement audible alarms. However, recent research has focused
Iii

renewed interest on tactile (vibratory) stimuli as an effective means of waking occupants.Although the technology is available, there has been only limited use and commercialdevelopment of tactile (vibratory) notification technology integrated with smoke alanns.
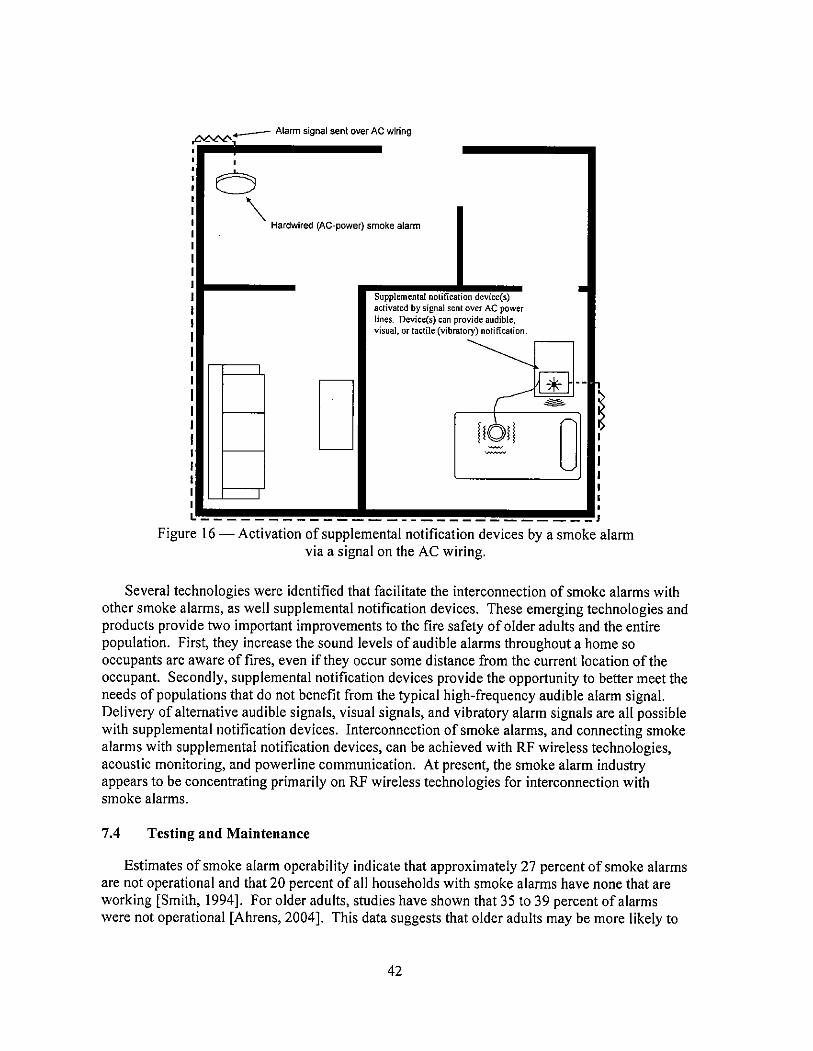
Recent technological advances have occurred that facilitate the interconnection of smokealarms with other smoke alarms, as well as with supplemental notification devices.Interconnection of smoke alarms and connecting smoke alarms with supplemental notificationdevices can be achieved with RF wireless technologies , acoustic monitoring, and powerlinecommunication. These emerging technologies and products provide two importantimprovements to the fire safety of older adults and the entire population. First, they readilyenable increased sound levels of audible alarms throughout a home so occupants are aware offires , even if the fire occurs remote from the current location of the occupant and the nearestsmoke alarm. Secondly, the interconnection of supplemental notification devices provides theopportunity to better meet the needs of select populations. Delivery of alternative audiblesignals, visual signals, and vibratory alarm signals are all possible with supplemental notificationdevices that are wirelessly connected to smoke alarms.
Although technologies that facilitate testing and maintenance of smoke alarms do notinfluence the waking effectiveness of smoke alarms, they are expected to be able to impact theoverall fire safety of older adults. Maintenance problems with battery-operated smoke alarmssuch as difficulty testing alanns or missing, dead , and disconnected batteries, are being addressedby various smoke alarm technologies. Technologies are available that allow users to test theoperation of smoke alarms remotely and that eliminate battery changes for the life of the smokealarm. Designs of battery doors and drawers allow replacement of smoke alarm batteries withoutremoving the alann from the ceiling, and silence features allow the user to temporarily silencealarms without removing the batteries from the alarm.

ACKNOWLEDGEMENTS
This project was conducted for the Fire Protection Research Foundation under a grant fromthe U. S. Fire Administration. This work reflects a collaborative effort between three principalorganizations , Victoria University, the National Fire Protection Association (NFPA) and HughesAssociates , Inc. The authors gratefully acknowledge the insightful discussions and contributionsby Professor Dorothy Bruck of Victoria University and Dr. John Hall and Dr. Rita Fahy of theNFPA. In particular, we would like to thank Dr. Hall for conducting the risk analysis presentedin this report and the multiple, interesting and productive discussions.

EXECUTIVE SUMMARY ...................................................... ...................................................... I
ACKNOWLEDGEMENTS............................................................................................................
LIST OF TABLES ....................................................................................................................... VII
LIST OF FIGURES ..................................................................................................................... VII
NOMENCLATURE ..................................................................................................................... IX
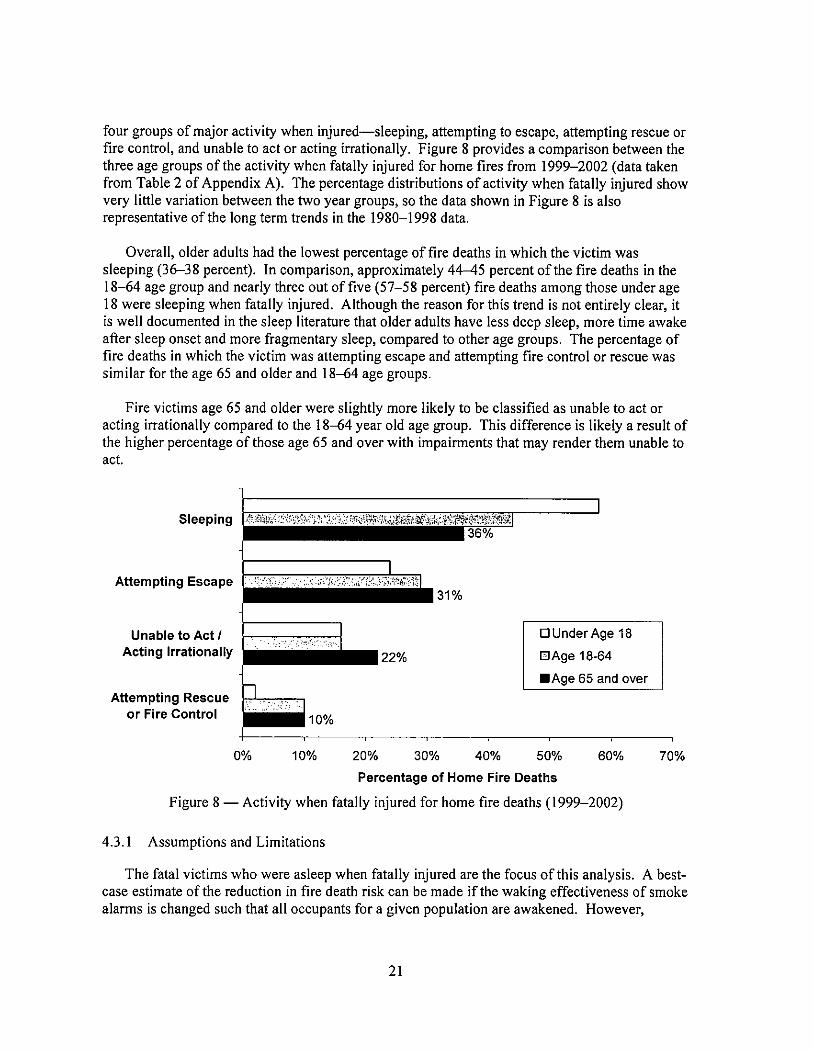
INTRODUCTION """""""""""""""""""""""""""......""'..,...........................................
THE SMOKE ALARM SIGNAL........................................................................................
Requirements ............,..............................................................................................Waking Thresholds .....,...........................................................................................
2.3 Audibility in Typical Residential Dwellings ...........................................................
CHARACTERIZATION OF THE OLDER ADULT POPULATION ...............................
Population Trends .............................................................,......................................Impairments and Disabilities .....................................................,.............................
1 General.........................................................................................................Hearing Impairment.....................................................................................
3 Housing..................................................................................................................
STATUS OF FIRE SAFETY AMONG OLDER ADULTS .............................................
Risk Factors ......................................................,....................................................Smoke Alarm Usage ...................................................................,..........................
4.3 Estimating the Impact ofImproved Waking Effectiveness .................................. .19Assumptions and Limitations ....................................................................Risk Reduction...........................................................................................
RESPONSE OF OLDER ADULTS TO THE SMOKE ALARM SIGNAL .....................
ANAL YSIS........................................................................................................................
REVIEW OF POTENTIAL TECHNICAL SOLUTIONS ................................................
Alternative audible alann signals.......................................................................... .30Alternative alarm stimuli ................................,......................................................
1 Visual........................................................................................................ .32Tactile ......................................................................,.................................
2.3 Olfactory """""""""""""""""""""""""""""""""""""""..................... .34Interconnection of Smoke Alarms and Notification Devices ................................
7.4 Testing and Maintenance ..................".................................................................. .42
CONCLUSIONS............................................................................................................... .44
RESEARCH NEEDS........................................................................................................ .46
REFERENCES ................................................................................................................. .47
CONTENTS
10.
APPENDIX A DETAILED DERIVATION OF BASIC MODEL ...............................................
APPENDIX B RELATING PARAMETER A TO PDEATH ASLEEP / PDEATH NOT ............................
APPENDIX C ESTIMATION OF PARAMETER A USING LEAST-SQUARES METHODSAPPLIED TO MODEL OF RISK AS A FUNCTION OF HOUR OF DAY ....................
APPENDIX D PARAMETER VALUES USED IN REGRESSION ANAL YSIS.......................
APPENDIX B CONTACT INFORMATION FOR PRODUCTS MENTIONED........................
LIST OF TABLES
Table I - Home ownership among older adults and overall U. S. populations........................... 11Table 2 - Types of homes in which older adults live. """""""""""""""""""""""""""""""" 12Table 3 - Age of structures in which older adults live. """"""""""""""""""""""""""""""" 12Table 4 - Older adult and overall U. S. populations by sex and the portion of those living
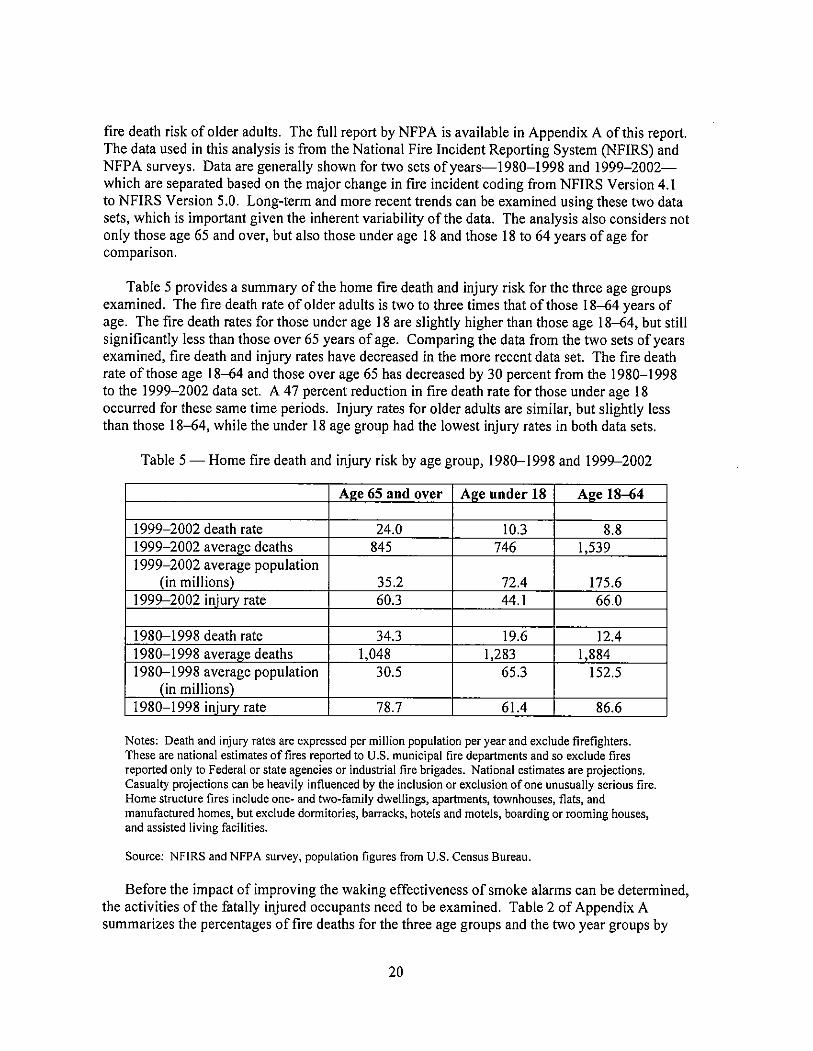
alone. """""""""""""""""""""""""""""""""""""""""""'..,"""""""""""""""'" 13Table 5 - Home fire death and injury risk by age group, 1980-1998 and 1999-2002.............. 20Table 6 Percentage of home fire fatalities who were intimate with ignition, by age
group and activity when injured , 1980-1998. ............................................................Table 7 Percentage of home fire fatalities with smoke alarms present or present and
operated by age group and activity when fatally injured, 1996-1998. """"""""""'" 25Table 8 - Summary of auditory arousal thresholds (AA Ts) of older adults to the four
signals. """""""""""""""""""""""""""""""""""""""..........................................
Table 9 - Summary of older adults that did not wake to the four signals at three soundlevels. ............""""""""""""""""""""""""""""""""""'".......................................
LIST OF FIGURES
Figure I Fire death rate in home fires as a function of age of the victim (Hall , 2005).............. 2Figure 2 - Examples of the temporal-three (T-3) smoke alarm signal. ........................................ 4Figure 3 - Current and projected number of people age 65 and over in the U. S. ........................ 7Figure 4 Disability status of older adults and overall U.S. population. """""""""""""""""'" 8Figure 5 - Hearing threshold levels among adults age 60-69 years........................................... 10Figure 6 Percentages of households living in structures built prior to 1990 and built from
1995-2000 according to the age of the householder. ............................................. 13Figure 7 Potential fire risk factors. """"""""""""""""""""""""""""""""""""""""""""" 15Figure 8 Activity when fatally injured for home fire deaths (1999-2002).............................. 21Figure 9 Cumulative frequency of AATs for the four signals. """""""""""""""""""""""" 28Figure 10 Single-station smoke alanns.................................................................................... 36Figure 11 - Hardwired multiple-station (interconnected) smoke alanns. ..................................Figure 12 Wireless multiple-station (interconnected) smoke alarms. .....................................Figure 13 Activation of supplemental notification devices by an acoustic monitor that is
located remotely from the smoke alann.................................................................. 39Figure 14 Activation of supplemental notification devices by an acoustic monitor with
wireless transmitter that is located adjacent to the smoke alann. ..."...................... 39
vii

Figure 15 - Activation of supplemental notification devices by a wireless smoke alann..........
Figure 16 Activation of supplemental notification devices by a smoke alarm via a signal onthe AC wiring..........................................................................................................
viii
AAT
ADAANSICPSCdBAISONAEEECNCHSNFIRSNIDCDNRLCDCNFPA
SHHH
USFA
NOMENCLATURE
Auditory Arousal ThresholdAlternating Current
Americans with Disabilities ActAmerican National Standards InstituteConsumer Product Safety CommissionDecibels (A-weighting)International Organization for Standardization
National Appliance and Equipment Energy Efficiency Committee (Australia)National Center for Health Statistics
National Fire Incident Reporting SystemNational Institute on Deafness and Other Communication Disorders
Naval Research Laboratory
Centers for Disease Control and PreventionNational Fire Protection Association
Radio FrequencySelf Help for Hard of Hearing People
Underwriters LaboratoriesUnited States Fire Administration

1.0 INTRODUCTION
The S. Fire Administration (USF A) has identified older adults (those 65 years of age andover) as a high risk group in terms of fire safety. Recent estimates offatalities in home fires byNFP A, based on data from 1999-2002 , indicate approximately 2 960 fire deaths occur in the
S. each year. In terms of a fire death rate, or fire risk, this equates to lOA deaths per millionpeople annually. People age 65 and older have a fire death rate (22.7 deaths/million) more thantwice that of the national average (Hall, 2005). In total , older adults account for around 800 firedeaths per year. Although older adults comprise around 12 percent of the S. population, theyexperience approximately 27 percent of the home fire fatalities.
The disparity in fire death rate increases with age. Figure 1 shows the trend in the fire deathrate (deaths per million people per year) as a function of the age of the victim. People age75 and older have a fire death rate three times the national average and those age 85 and overhave a fire death rate more than four times the national average (Hall, 2005). It is believed thatvarious changes associated with aging may be a factor in the increased fire death rate amongolder adults.
The use of smoke alarm and signaling systems is associated with a reduction of fire fatalitiesin the general population, particularly for occupants of one and two family dwellings. Thechances of dying in a fire are reduced by 40 to 50 percent when smoke alanns are present(Ahrens, 2004). Sekizawa (2005) found a similar reduction in fire death risk in Japanese and
fire statistics. When smoke alarms are known to be operational and provide the alann, Hall(2004) found a 60 to 80 percent reduction in fire death risk. However, older adults may not fullybenefit from conventional smoke alarm systems, particularly during sleeping hours. Recentstudies (Bruck, 2001) have indicated that as many as 25 percent of older adults may not awakefrom a hallway smoke alarm; however, this data is incomplete. Reduced waking effectiveness inolder adults may be a result offactors such as high frequency hearing loss or ingestion of sleepaid medication. Even when awakened by a smoke alann, older adults may have a reduced abilityto evacuate quickly as a result of impaired mobility or increased cognitive confusion / sleepinertia.

0..""",mnn A,.~,.d.."",..
~ ~ " . V ~ ~ ~ ~ ~ ~ y f f ~ ~ ~ 0 ~ 0 ~ ~ ~ ~ v ~ ~ ~ ~ ~ ~ ~-if'
-\0.
Figure 1 - Fire death rate in home fires as a function of age of the victim (Hall , 2005).
The objective of this project was to assess and optimize the performance requirements foralarm and signaling systems to meet the needs of an aging population. This project wasseparated into several tasks in order to achieve its objective. First, a risk assessment of olderadults was performed to quantify the potential impact of improving the waking effectiveness ofsmoke alarms , in terms of the number of potential lives saved. This assessment was based onexisting data regarding the characteristics of fire victims and fires. Second , the human behavioraspects of the problem were addressed; this work consisted of a sleep study of older adults and ispresented in a separate report (Bruck, et aI., 2006). Both the arousal thresholds from sleep forvarious frequencies and types of alarm signals, as well as the cognitive and physical abilitiesupon waking were examined in the sleep study. A review was conducted of new and promisingtechnologies that may improve the waking effectiveness of smoke alanns for older adults andimprove their overall fire safety. Finally, the previous tasks are integrated to determine researchneeds to further address the fire safety of older adults.
THE SMOKE ALARM SIGNAL
It is important to understand the current smoke alarm signal prior to considering alternativesignals. Subsequent sections describe the current requirements for the smoke alann signal, theaudibility of the signal in typical residential homes, and the waking thresholds typicallyassociated with the signal in the general population.
Requirements
Since 1996 , NFP A 72 National Fire Alarm Code has required the use of a three-pulsetemporal pattern, or temporal-three (T-3), as an alarm signal for new buildings. This signal isintended to indicate that immediate evacuation of the building is required. Although this signalis a relatively recent requirement, it has been recommended by NFPA 72 (and its predecessors)since 1979. This signal has also been adopted as an American National Standard (ANSI S3.41

Audible Emergency Evacuation Signal) and an International Standard (ISO 8201 AudibleEmergency Evacuation Signal).
Identifying an optimal evacuation signal that will reach occupants and be heard andrecognized can be difficult because of variations (e. , loudness , frequency, pattern) inbackground noise among occupancies as well as various human factors. The T-3 standards onlyspecify the on/off pattern of the signal. This approach allows manufacturers to select appropriatefrequencies for an acoustic signal that may differ for given applications. This approach alsoallows visual and tactile signals to take advantage of the standard temporal-three pattern.
The T-3 pattern consists ofa 0. 5 second ON phase, followed by a 0. 5 OFF phase. After thethird ON phase, a 1.5 second OFF phase completes the cycle. The total time through one cycleof the signal is 4 seconds. Supplemental verbal instructions are allowed to be inserted in the
5 second OFF phase. There is also an exception made for single-stroke bells or chimes, whichare allowed to chime at three consecutive one second intervals, followed by a two second OFFphase. Figure 2 illustrates several examples of the T-3 pattern; the topmost figure is typical ofthe signal used in residential smoke alarms.
Although not mandated as part ofthe requirements of ANSI S3.41 or ISO 8201 , residentialsmoke alarms typically employ an alann frequency of 3 000-4 000 Hz. In tests of oneresidential smoke alann, the U.S. Consumer Product Safety Commission (CPSC) determined theoperating frequency of the smoke alarm to be 3,200 Hz (Lee, 2005aJ. The alarm signal in asmoke alarm is typically generated with a piezoelectric horn. These devices are used due to theirability to produce significant sound levels while using relatively little power, which is essentialwhen relying on batteries as a power source.
The voluntary UL standard for single-station smoke alanns, UL 217 , also providesrequirements for the smoke alarm signal. These requirements include the use of the temporal-three pattern and also require that a minimum sound level of 85 dBA be produced at 10 feet froma smoke alarm operating in a room of a specific configuration (see Section 65 ofUL 217 fordetails).

11--
Single Frequency (Tone)
Saw Tooth Tone (High/Low)
Saw Tooth Tone (Low/High)
JL--JTwo-Tone (High/Low)
Two-Tone (Low/High)
1/
Single-Stroke Beil or Chime
One Cycie
---lTime (seconds)
Figure 2 - Examples of the temporal-three (T -3) smoke alarm signal.
Waking Thresholds
Several studies have examined the response of adult occupants to the smoke alarm signal(Nober, et a!. , 1981; Kahn, 1984; Bruck and Horasan, 1995). Bruck (200l) provides a summaryof these and several other studies. In general , an unimpaired sleeping adult will awake quickly toa smoke alarm signal that reaches the occupants at a sound level of 55-60 dBA (Bruck, 200l).Early work by Nober, et al. (1981) indicated that 18-29 year old adults could be aroused fromsleep by a 55 dBA sound level in a relatively quiet environment. In a more noisy environment(window air conditioner running), a 70 dBA signal was required. Kahn (1984) obtained similarresults when he presented male, college-age students (mean age 21.3) with alarm signals of 44
, and 78 dBA with background noise of 44 dBA. All participants awoke for the 78 dBAsignal , 50 percent awoke for the 54 dBA signal , and 25 percent awoke for the 44 dBA signal.Bruck and Horasan (1995) found that 75-87 percent of the 18-24 year olds studied awoke to a

smoke alarm signal of 60 dBA with background noise of less than 30 dBA, depending on theirsleep stage.
Data from the auditory arousal threshold (AAT) literature, such as Zepelin, et al. (1984) orthat used in the review by Berry (1978), suggests occupants would be less responsive to a 55-dBA signal than was cited in the previous studies. However, the frequency of the sound used inthe AA T studies was typically significantly different than that of a smoke alann (Bruck , 2001).Nevertheless , Berry (1978) concludes from a review of the literature that 75 dBA "canreasonably be expected to awaken a person under most circumstances.
Berry (1978) and Bruck (2001) both note numerous factors which can affect responsivenessand should be considered when applying AATs, including:
Large individual variation in AA THearing impainnents
Sleep medicationBackground noise levelsDrug/alcohol use
Sleep deprivationBeing a child/teenager, andBeing an older adult.
Audibility in Typical Residential Dwellings
A study recently published by the Consumer Product Safety Commission (CPSC) examinedsound levels from smoke alanns in several residential dwellings (Lee, 2005a). Soundmeasurements were taken in three homes constructed from 1960 to 1989 , ranging in size fromapproximately 1 100 to 3 300 ft2
The first home in which sound measurements were taken was a typical 1 100 fr suburbanranch house built in 1960. Directly under operating smoke alarms, sound levels ofapproximately 90-105 dBA were recorded. Sound measurements taken in three bedrooms with asmoke alann operating in the adjacent hallway ranged from 85-96 dBA with the door open and71-88 dBA with the doors to the bedrooms closed. A smoke alann operating in one of thebedrooms produced sound levels at the pillow of approximately 90 dBA, regardless of whetherthe door to the bedroom was open or closed. The sound level in the master bedroom ofthe ranchhome was as low as 45 dBA (with the bedroom door closed) with a smoke alarm operating in thebasement (at the bottom of the basement stairway on the ceiling, 5 feet from the stairs).
The second home in which sound measurements were taken was a 2 300 fr, two-story home(no basement) built in 1973. A smoke alarm operating in the first floor hallway produced soundlevels as low as 42 dBA in the second floor bedrooms when the bedroom doors were closed.The final home in which smoke alarm measurements were taken was a 3 300 ft2 two-story (plus
a basement) Georgian colonial-style home. Sound levels measured in the second floor bedroomswith a smoke alarm operating on the first floor were as low as 61 dBA with the bedroom doorsclosed. The sound level in the master bedroom of the colonial home (on the second floor) was as

low as 34 dBA with the bedroom door closed and a smoke alarm operating in the basement (atthe bottom of the basement stairway on the ceiling, 5 feet from the stairs).
Based on their measurements of sound levels in typical residential homes, the CPSCestimated that residential interior doors attenuate a smoke alann signal approximately 10-dBA and that each level of the home through which the signal must travel attenuates anadditional 20 dBA (Lee, 2005a). From these results, the CPSC concluded that the signal fromsmoke alarms that are not interconnected may not be able to alert all occupants throughout two-or three- level homes. Therefore , interconnected smoke alarms or notification appliances on atleast every level , and possibly in bedrooms as well, may be necessary to provide adequateprotection throughout a dwelling.
CHARACTERIZATION OF THE OLDER ADULT POPULATION
Several important distinctions can be made between older adults (65 years and older) and theoverall population that are relevant to this analysis. Two recent reports highlight some of thesedifferences (Smith , 2005; USFA, 2006). The first report, published by the CPSC addresses age-related differences in the perceptual , cognitive, and physical abilities in adults and relates thisunderstanding to improving product safety (Smith , 2005). This CPSC report is based on anextensive literature review and serves as a valuable overview of characteristics of older adults inrelation to safety. Similarly, the USFA published a report on fire and older adults, whichcontains a characterization of older adults and discusses several fire risk factors relevant to thispopulation. This section provides a general characterization of the older adult population interms of their population trends, impairments and disabilities, and housing conditions. For moredetailed information on this topic, consult (Smith, 2005) and (USFA, 2006).
Population Trends
According to the U. S. Census Bureau , there were 35,0 million people 65 years of age andover in the United States in 2000 (Hetzel and Smith , 200lj. The older adult populationrepresents 12.4 percent of the total population of the United States. Despite an increase in thenumber of the people in this age group, the proportion of the U.S. population in this age groupdeclined slightly (from 12.6 percent in 1990 to 12.4 percent in 2000). This trend is expected toreverse as the "baby boomers" (those born 1946 to 1964) reach 65 years of age starting in 2011(Federal Interagency Forum on Aging-Related Statistics, 2004). Figure 3 shows population datafrom the most recent (2000) decennial U. S. Census, as well as projected population estimates forthe next 50 years for people 65 years of age and over.
Over the last century, the older adult population in the U. S. grew from 3 million to35 million, with the population age 85 and over growing from 100 000 to 4.2 million (FederalInteragency Forum on Aging-Related Statistics, 2004). According to the U.S. Census Bureauthe number of older adults will increase dramatically during the 2010-2030 period. By 2030 , theolder adult population is expected to more than double its numbers from 2000, representingapproximately 20 percent of the U.S. population. Rapid growth is expected in the population85 years of age and over beyond 2030. This age group is projected to reach nearly 21 millionpeople in 2050 , representing nearly one quarter of older adults (Federal Interagency Forum onAging-Related Statistics, 2004).
Millions of People100
~-,
~:.-.~~o
~~- _.. - --.,.. ------
2000 2010 2020 2030 2040 2050
Source: U.S. Census Bureau (2004)
Figure 3 Current and projected number of people age 65 and over in the U.
Impairments and Disabilities
General
According to the U. S. Census Bureau, 42 percent of the population 65 years of age and overreported some type of long term condition or disability in 2000 (Gist and Hetzel , 2004). Census2000 showed disability rates rising with age for both sexes (Waldrop and Stern , 2003). TheCensus provides information on five categories of disabilities (Gist and Hetzel, 2004):
Sensory-long- lasting blindness , deafness, or hearing impairmentPhysical-long- lasting, substantial limitation on one or more basic physical activitiessuch as walking, climbing stairs , reaching, lifting, or carryingMental-Learning, remembering, or concentratingSelf-care-Dressing, bathing, or getting around inside the homeDifficulty going outside the home-Going outside the home alone to shop or visit adoctor s office
Figure 4 compares the percentages of older adults and the general population that report eachof the five disability categories distinguished in Census 2000. For three of the five disabilitiesmeasured by Census 2000 , the disability rate for those 65 years of age and over was at least triple
the rate of the total population (Gist and Hetzel , 2004). Sensory disabilities, which include longlasting blindness, deafness , or hearing impairment, affect 14.2 percent of older adults. This isnearly four times the rate at which sensory disabilities affect the total population. Similarly,28. 6 percent of older adults are affected by physical disabilities, which are described as longlasting, substantial limitation on one or more basic physical activities such as walking, climbingstairs, reaching, lifting, or carrying. The rate of physical disability among the total population isonly 8.2 percent. Due to long term physical , mental , or emotional conditions , 9. 5 percent ofolder adults have difficulties providing self-care (dressing, bathing, or getting around inside thehome). This is greater than three times the rate at which the total population has difficultyproviding self-care (2.6 percent).
Percentage of thePopulation
DTotai population (5 years and over)
.People 65 years and over
Physical Mental disability
Disability
Source: U.S. Census Bureau (Waldrop and Stern , 2003)
Any disabiiity Sensory Seit-care GO-outside-home
Figure 4 Disability status of older adults and overall U.S. population.
For the remaining two disabilities measured by Census 2000 , the disability rate for those65 years of age and over was at least double that of the total population. Mental difficulties, suchas problems learning, remembering, or concentrating, were reported by 10. 8 percent of olderadults. This is over twice the rate at which these difficulties were reported by the total
population. Over 20 percent of older adults reported difficulties going outside the home alone toshop or visit a doctor s office. The total population reported only 7. 1 percent with this disability.

Over 50 percent of the population over the age of 85 reported a physical disability, with47 percent indicating difficulties going outside the home (Gist and Hetzel, 2004). Forcomparison , only 13 percent of people 65 to 74 years of age reported difficulties going outsidethe home. Similar trends were reported for sensory disabilities; nearly 35 percent of those85 years and older reporting blindness, deafness , or hearing impairment, whereas onlyapproximately 9 percent of those age 65 to 74 years reported similar difficulties.
The Census data on disabilities does not provide details regarding the extent of the disability.It is also possible, maybe even likely, that this data underestimates the magnitude of the problemsince the information is based on the perception of the respondent. Regardless , since disabilitiescan affect people s ability to escape, this data suggests that the high rate of disabilities in olderadults may contribute to their high risk of death in home fires.
Hearing Impainnent
The National Institute on Deafness and Other Communication Disorders (NIDCD), one ofthe institutes that comprise the National Institutes of Health (NIH), estimates that 28 millionpeople in the U. S. are deaf or hard of hearing (NIDCD , 1996). Hearing impainnents affect asignificant portion of the older adult population. Older adults comprise approximately37 percent of all hearing- impaired individuals in the United States, despite representing onlyaround 12 percent of the total U.S. population (Desai et aI. , 2001). Around 30 percent of olderadults are affected by presbycusis, gradual age-related hearing loss (Gates, et aI. , 1990)
Cruickshanks et al. (1998) conducted a large epidemiological study to measure theprevalence of hearing loss in older adults using standard audiometric testing. Study participantsranged in age from 48-92 years, with a mean age of about 66 years. Overall , 46 percent of thestudy participants had a hearing loss of at least 25 dB in the worse ear. They also found that therisk of hearing loss increases with age such that almost 90 percent of participants over 80 yearsof age experienced hearing loss. Figure 5 shows mean hearing threshold levels for men andwomen60-69 years of age. The error bars in Figure 5 show one standard deviation and are onlypresented for males. Age-related hearing loss is primarily at the higher frequencies (greater than
000 Hz) and is greater for men than women, as shown in Figure 5. Hearing thresholds wereslightly worse (higher) for left ears than right ears at frequencies above 250 Hz. The worse earwas used to determine the prevalence of hearing loss, so average hearing thresholds from the leftear are presented in Figure 5. As the number of older adults increases in the future, the numberof older adults with hearing impairments will likely increase as well.
It is also important to recognize that many older adults may be unaware of their hearingdifficulties. In the human behavior portion of this project (Bruck , et aI. , 2006), approximately15 percent ofthe potential participants, who believed they had average or better hearing for theirage, failed the hearing screening. Although this screening was fairly stringent, requiring eachperson to perform within one standard deviation of the mean threshold sound level for their ageand sex at each frequency (500 , 1000 2000 3000, and 4000 Hz) in both ears, these resultshighlight the prevalence and lack of awareness of hearing impainnents among older adults.

A significant proportion of the older adult population with hearing impairments has not takencorrective action. In 1995 , 76 percent of people age 70 and older with a hearing problem hadseen a doctor for the problem; however, only 34 percent used a hearing aid (Desai, et aI. , 2001).In contrast, over 98 percent of those age 70 or older with a visual problem had seen a doctor and93 percent wore glasses. Similar statistics exist for the overall population of those with hearingloss. Of the 28 million Americans with hearing loss only about 25 percent currently use hearingaids (SHHH, 2006). Thirty percent of those with hearing loss cannot afford hearing aids, 33percent deny or hid their hearing loss and 7 percent are unaware of their hearing loss (SHHH2006). Only around 5 percent of those with hearing loss require medical or surgical proceduresto treat their hearing loss (SHHH , 2006). In the context of this report, it is important to note thatpeople that use hearing aids typically do not wear their hearing aids while sleeping.
-+-
Males
,..
Females
~ 60
..J
'"0
III
/~'-
1000
-&~
lSj.
0r-
2000 3000 4000
Pure-Tone Frequency (Hz)Source: Cruickshanks et al. (1998)
Figure 5 - Hearing threshold levels among adults age 60-69 years.

Housing
Data from the 2000 U.S. Census can be used to characterize the types of housing that olderadults occupy. Census data regarding housing is typically characterized according to householdsand householders. Households include all people who occupy a housing unit (i.e. a house, anapartment, a mobile home or trailer, a group of rooms , or a single room occupied as separateliving quarters). A householder is the person, or one of the people, in whose name the home isowned , being bought, or rented (U. S. Census Bureau , 2006). Previous versions of the Censusused the term "head of household" rather than householder.
Table 1 shows that there were 35 million people age 65 years and over, which was 12 percentof the 281 million total U.S. population. Of the 35 million older adults, 33 million (94%) were inoccupied households , as opposed to group living quarters. Consequently, the statistics related tooccupied households represent the vast majority of the older adult population. As shown inTable I , the rate of home ownership among those 65 years of age and over was higher than thegeneral population. Seventy-eight percent of householders age 65 and over owned the homethey occupied , whereas only 66 percent of all householders owned the home they occupied.However, the percentage owning their home declined with age within the 65 and over age group(Gist and Hetzel , 2004). Table 2 provides further information on the types of homes that olderadults occupy. Among householders 65 years of age and over who owned a home, 84 percent(around 15 million households), lived in single-unit attached or detached structures (i.e. single-family homes). When combined with renter-occupied structures, 71 percent (around 16 millionhouseholds) of householders 65 years of age and older lived in single-unit structures.
Older adults are also more likely to live in older structures. As Table 3 shows the year inwhich the structure was built was relatively consistent for owner- and renter-occupiedhouseholds. Only 5 percent of housing units with householders age 65 and over were builtwithin the five years preceding Census 2000 (1995-2000). It is not surprising then that90 percent of the housing units in which older adults live were built prior to 1990 and 60 percentwere built prior to 1970.
Table I - Home ownership among older adults and overall U. S. populations.
Total for All Ages 65 years and over
Number t Percent Number Percent 2
Population 281.4 100% 35. 12%
Occuoied Households 105. 100% 22. 21%
Owner-Occupied Households 69. 66% 17. 78%Renter-Occunied Households 35. 34% 22%
1. Number in millions (people or households , as appropriate).2. Percentages for population and occupied househoids are based on the totai for ail ages.Percentages of owner- and renter-occupied households are based on the number of occupiedhouseholds in the age group specified.Source: Census 2000 , Summary File 3
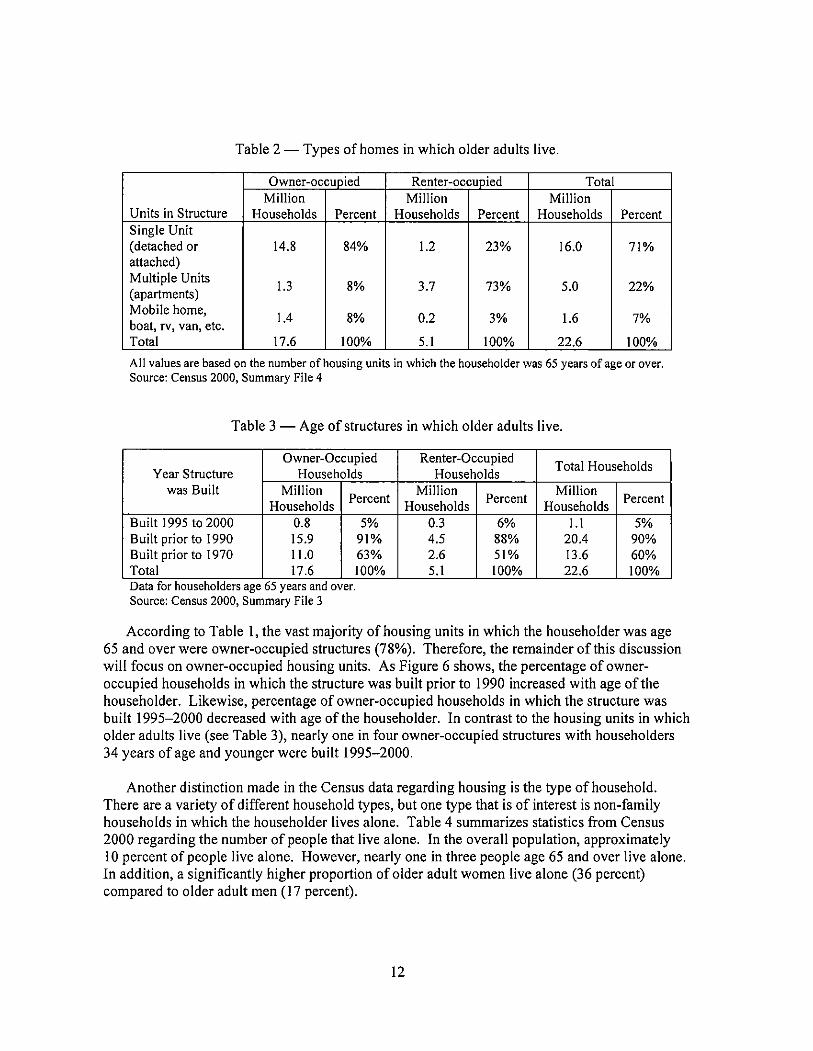
Table 2 - Types of homes in which older adults live.
Owner-occupied Renter-occupied TotalMillion Million Million
Units in Structure Households Percent Households Percent Households PercentSingle Unit(detached or 14. 84% 1.2 23% 16. 71%attached)Multiple Units
1.3 73% 22%(apartments)Mobile home
1.4 0.2 1.6boat, rv, van, etc.Total 17. 100% 100% 22. 100%
All values are based on the number of housing units in which the householder was 65 years of age or over.Source: Census 2000, Summary File 4
Table 3 - Age of structures in which older adults live.
Owner-Occupied Renter-OccupiedTotal Households
Year Structure Households Householdswas Built Million
PercentMillion
PercentMillion
PercentHouseholds Households Households
Built 1995 to 2000 0.3 !.IBuilt prior to 1990 15. 91% 4.5 88% 20.4 90%Built prior to 1970 11.0 63% 51% 13. 60%Total 17. 100% 100% 22. 100%Data for householders age 65 years and over.Source: Census 2000, Summary File 3
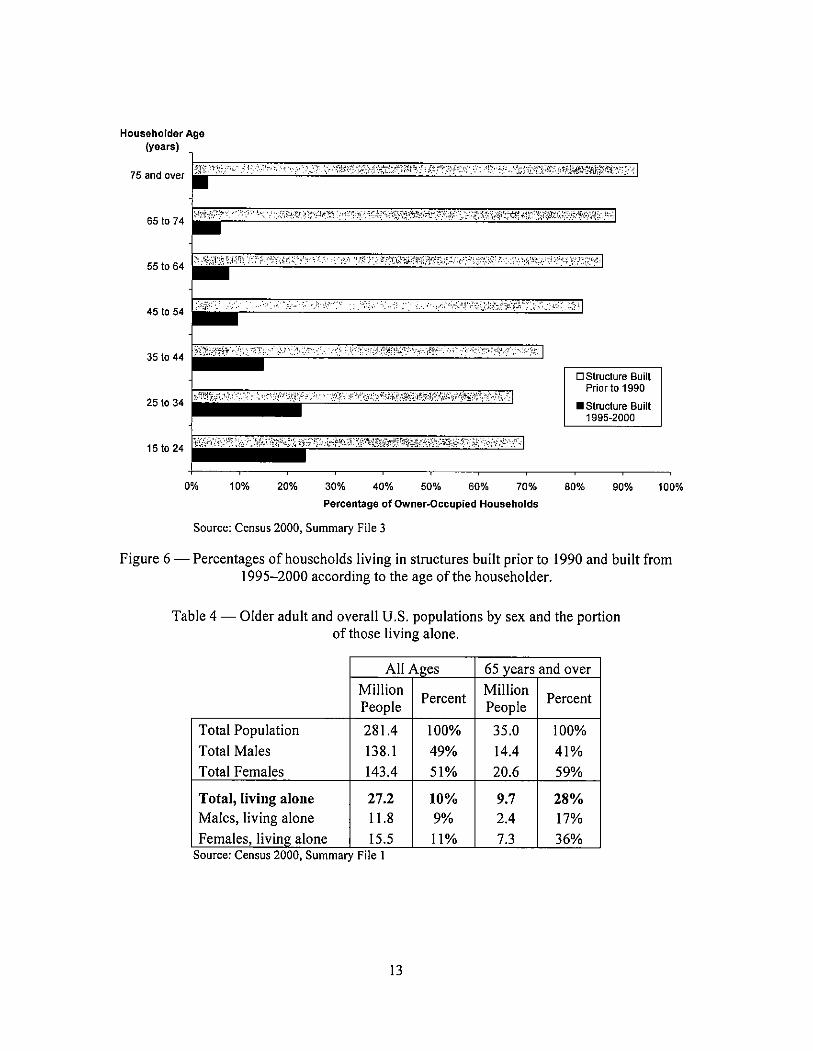
According to Table 1 , the vast majority of housing units in which the householder was age65 and over were owner-occupied structures (78%). Therefore, the remainder of this discussionwill focus on owner-occupied housing units. As Figure 6 shows, the percentage of owner-occupied households in which the structure was built prior to 1990 increased with age of thehouseholder. Likewise , percentage of owner-occupied households in which the structure wasbuilt 1995-2000 decreased with age of the householder. In contrast to the housing units in whicholder adults live (see Table 3), nearly one in four owner-occupied structures with householders34 years of age and younger were built 1995-2000.
Another distinction made in the Census data regarding housing is the type of household.There are a variety of different household types, but one type that is of interest is non-familyhouseholds in which the householder lives alone. Table 4 summarizes statistics from Census2000 regarding the number of people that live alone. In the overall population, approximately10 percent of people live alone. However, nearly one in three people age 65 and over live alone.In addition , a significantly higher proportion of older adult women live alone (36 percent)compared to older adult men (17 percent).
Householder Age(years)
e ,
;""":;; ':':):' ~:;;" "':': , ";" " ',:", /,.'
i:;f: ti~""c;;!~i"";', c;'
651074
"";j,,," ,""" :":
:"i' ;'il"
""":;",,,,:",,,""
:2":1:,;,j"i~;'\\1;1t"' ?Nr'::"",
~,,',,,,:,
"i.
"!: "
!ri'!' /f:\.' l""/i:' ;iY';""",,:" ;jI;",,,,'
-"":,'" , , ',', ; ,"',""
45 10 54
"-' ':'.'"" : :!:!:" !:",,' .-: ,,"
351044 hi?,
.. '" "):;","":" '!' ,~:",,:, "
IC,
0 Structure BuiitPrior to 1990
. Structure Buiit
1995-20002510 34
:~~r.iV"
':"
"!""'!C'i
""" ":'
i'",;i, -,1",,Mt?/,
",,:,;"
"""i
151024 ",,;.cin,::"':, Wi\"""
"";'
":;h"':,;j';:' "i"'i,~"C",,,~,"i,:\:,,-,,,:,-
';"" ,":' !:"
10% 20% 30% 40% 50% 60% 70%
Percentage of Owner-Occupied Households
80% 90% 100%
Source: Census 2000 , Summary File 3
Figure 6 Percentages of households living in structures built prior to 1990 and built from1995-2000 according to the age of the householder.
Table 4 - Older adult and overall U. S. populations by sex and the portionof those living alone.
All Ages 65 vears and overMillion
PercentMillion
PercentPeople People
Total Population 281.4 100% 35. 100%
Total Males 138. 49% 14.4 41%Total Females 143.4 51% 20. 59%
Total, living alone 27. 10% 28%Males , living alone 11.8 2.4 17%
Females, living alone 15. 11% 36%Source: Census 2000, Summary File I
STATUS OF FffiE SAFETY AMONG OLDER ADULTS
Older adults clearly face a higher risk of death in fires than other groups; this was establishedin Section 1.0. However, simply knowing that older adults are at high risk is not sufficient. Thissection aims to provide insights into why this high risk situation may exist for older adults. Withthe data currently available, it is not possible to positively identify the cause(s) of the elevatedfire risk of older adults. Nevertheless, risk factors believed to be the most significant andrelevant are identified and discussed. Smoke alann usage among older adults is also analyzedincluding examining the presence , operability, and locations of smoke alarms in older adulthouseholds. This section also analyses the potential benefits of smoke alarms that provideimproved waking effectiveness for older adults.
Risk Factors
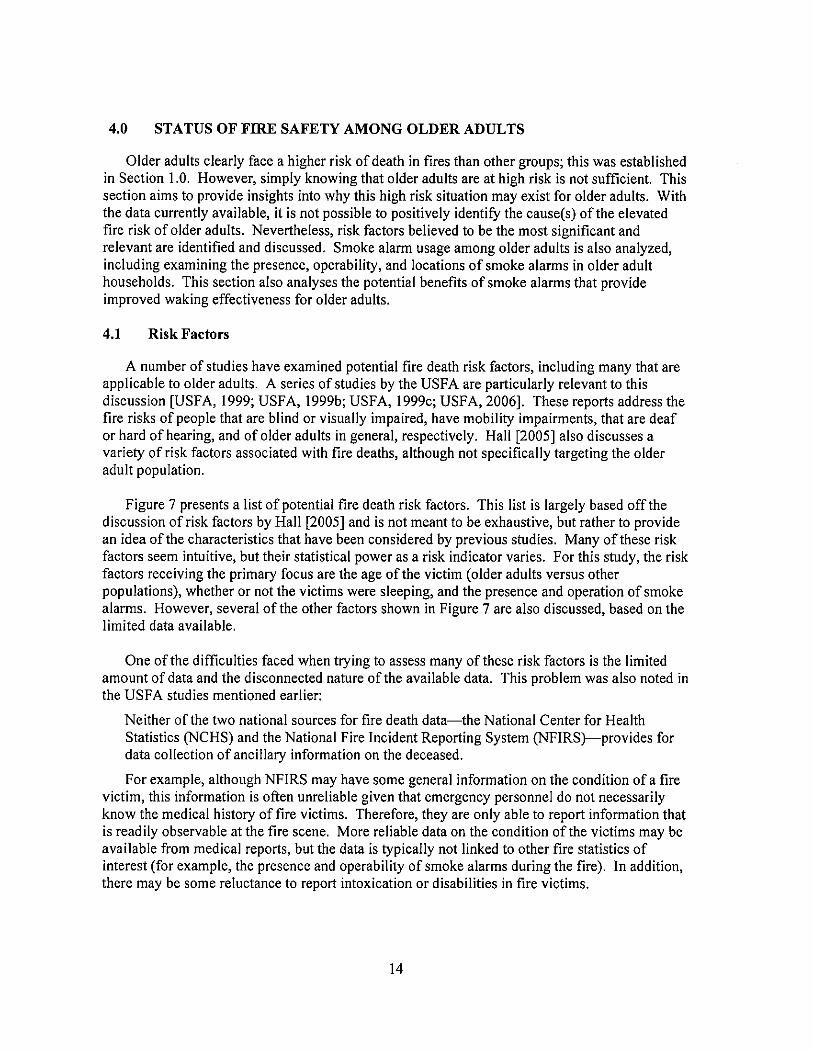
A number of studies have examined potential fire death risk factors, including many that areapplicable to older adults. A series of studies by the USF A are particularly relevant to thisdiscussion (USFA, 1999; USFA , 1999b; USFA, 1999c; USFA , 2006). These reports address thefire risks of people that are blind or visually impaired , have mobility impairments, that are deafor hard of hearing, and of older adults in general , respectively. Hall (2005) also discusses avariety of risk factors associated with fire deaths, although not specifically targeting the olderadult population.
Figure 7 presents a list of potential fire death risk factors. This list is largely based off thediscussion of risk factors by Hall (2005) and is not meant to be exhaustive, but rather to providean idea of the characteristics that have been considered by previous studies. Many of these riskfactors seem intuitive, but their statistical power as a risk indicator varies. For this study, the riskfactors receiving the primary focus are the age ofthe victim (older adults versus otherpopulations), whether or not the victims were sleeping, and the presence and operation of smokealarms. However, several ofthe other factors shown in Figure 7 are also discussed , based on thelimited data available.
One of the difficulties faced when trying to assess many of these risk factors is the limitedamount of data and the disconnected nature of the available data. This problem was also noted inthe USFA studies mentioned earlier:
Neither of the two national sources for fire death data-the National Center for HealthStatistics (NCHS) and the National Fire Incident Reporting System (NFIRS)-provides fordata collection of ancillary information on the deceased.
For example, although NFIRS may have some general information on the condition of a firevictim , this information is often unreliable given that emergency personnel do not necessarilyknow the medical history of fire victims. Therefore, they are only able to report information thatis readily observable at the fire scene. More reliable data on the condition of the victims may beavailable from medical reports , but the data is typically not linked to other fire statistics ofinterest (for example, the presence and operability of smoke alarms during the fire). In additionthere may be some reluctance to report intoxication or disabilities in fire victims.

Age
Rac
e / E
thni
city
Edu
catio
n
Poverty level
Family Structure
Dis
abili
ties
Smok
ing
Dru
g/A
lcoh
olIn
toxi
catio
n
Slee
ping
Alo
ne a
t Tim
e of
Fire
Potential Fire
Ris
k F
acto
rs ;F;R
~*~i
t~~;
ii'~~~
"
Vac
ancy
Rat
e
Ow
ners
vs
Ren
ters
Age
of
hous
ing
Figu
re 7
Po
tent
ial f
ire
risk
fac
tors
.
Hea
ting
Equ
ipm
ent
Coo
king
Equ
ipm
ent
Sm
oke
Ala
rms
Spri
nkle
rs

Some of the risk factors identified in Figure 7 seem to logically apply to older adults, but arenot supported by the data. For example, given the prevalence of older housing among olderadults, as discussed in Section 3.3 , one might expect that the age of housing would be important.However, previous studies have shown that the age ofa home is not a primary driver of fire risk(Hall , 2005). Another example is the expectation of an increased risk of cooking-related firedeaths for older adults; however the data does not support this.
There is some data regarding risk factors associated with occupant behavior and productchoices. Smoking materials are a significant contributor to fire risk-they "are the leading causeof home fire deaths , overall and for victims in every age group from age 35 up" (Hall, 2005).For older adults (age 65 and over), smoking materials cause 32 percent offatal home fires , whichis consistent with the percentages of other age groups. The highest percentage offire deathsattributed to smoking materials for any age group was for those 65-74 years of age , which had37 percent of fire deaths caused by smoking materials. These statistics are somewhat surprisingwhen the prevalence of smoking among older adults is considered. A study by the CDC in 2004found that people age 65 and older have the lowest prevalence of current cigarette smoking(8. 8 percent) among all adults (CDC , 2005). In comparison, approximately 20.9 percent of U.adults were current smokers in 2004. Older adults appear to be at a disproportionately high riskof death in smoking-related fires , compared to the number of smokers in this age group.
Although alcohol intoxication certainly increases fire risk, it is not clear that the problem issufficiently prevalent to significantly contribute to the high fire death risk of older adults.Studies from several states in which the blood alcohol levels of fire victims was examined foundthat 45-5 I percent of adult fire victims had blood alcohol contents over 0. 1 percent (Berl andHalpin , 1978; McGwin et aI. , 2000; Hall, 2005). In the study on Maryland fire deaths (Berl andHalpin, 1978), 39 percent of fire victims age 60 and over were intoxicated compared to51 percent of those age 20 and over. Similarly, a study of Minnesota fire deaths found that21 percent of fire victims age 60 and over were intoxicated, compared to 46 percent of those age20 and over (data from Minnesota Fire Marshal' s Office in (Hall , 2005)). Older adults consumealcohol on more days each month than younger adults, but typically consume less in one sitting(USFA, 2006). This may be significant given that Ball and Bruck (2004) found the greatesteffect of alcohol on waking thresholds at only moderate levels of alcohol consumption (a bloodalcohol content of 0.05).
Fahy and Molis (2004) conducted a study done in which they examined detailed narratives offires from 1997-1998 where fatalities occurred in spite of smoke alanns operating. This work isof particular interest to the current discussion. Fahy and Molis examined 218 fires and 277deaths, including 72 people over age 70. Forty-three percent of the older adult fire deaths in thisstudy resulted from smoking-related fires; over a quarter of these older adults were smokingwhile on oxygen. The percentage of fire deaths associated with smoking for older adults is notsignificantly more than that ofthe overall population, in which 36 percent of deaths were fromsmoking-related fires. These statistics are consistent with the overall fire experience, discussedearlier. Fahy and Molis also found that 43 percent of the older adult fire victims in their studywere believed to have some type of disability. This is significantly higher than the overallpopulation (I8 percent), but is relatively consistent with the disparity of disability rates betweenolder adults and the overall population. Another risk factor that was examined by Fahy and
Molis was whether the victims were the only ones in the home at the time of the fire. Overallpercent of victims age 16 and older were home alone at the time of the fire. For older adultsalmost half (48 percent) of the victims examined were alone at the time of the fire. Given thelarge number of older adults living alone , this may be a contributing risk factor, particularly forthose who have disabilities or difficulty hearing the alarm. Consistent with the previouslypresented data, a lower percentage of older adult fire victims (6 percent) were believed to beintoxicated than the overall population of adults 18 and over (23 percent). The detennination ofintoxication is based on the detailed narratives and not on tests of the blood alcohol content ofthe victims. Although the trend is similar to the previously presented results on alcoholintoxication and fire risk, it appears that the number of intoxicated victims may be under-reported. Regardless, intoxication does not appear to be as common for older adults. Althoughthe data is not specific to older adults , Fahy and Molis found that 109 of the 154 victims(71 percent) with a known sleep status were asleep; the sleep status of 123 victims wasundetermined. Clearly this indicates that in cases where smoke alanns do operate and there arestill fatalities, the majority of these fire victims are sleeping. However, it is unclear from thisdata if the waking effectiveness of the alarm signal is the primary reason these victims wereunable to escape. Other circumstances such as being intimate with ignition, alcohol ormedication usage , or the inability to get out of bed may have contributed to some of these deaths.
Smoke Alarm Usage
An integral part of evaluating the fire safety of older adults is examining smoke alann usage.Issues related to the usage of smoke alarms by older adults include whether or not smoke alarmsare present, the operability of the smoke alanns during a fire, and the location of smoke alanns inthe home. In general , there is limited data on smoke alann usage, operability, and placement inhomes. The information that is available is summarized below.
One source of general data on smoke alann usage is the annual report published by NFP Atitled Us. Experience with Smoke Alarms (Ahrens, 2004). In the most recent version of thisreport, NFPA estimates that 96 percent of homes (24 out of25 homes) with a telephone have atleast one smoke alarm (Ahrens , 2004). However, there is relatively little information on thesmoke alann usage among older adults. The infonnation that does exist suggests that householdswithout smoke alarms are slightly more likely to be headed by an adult over 65 years old(Ahrens , 2004). Other socioeconomic factors such as being poor or non-white had a similarlyminor effect. More importantly, only around 60 percent of homes that reported fires have smokealarms. This means that homes without smoke alanns report a disproportionate number of fires(4 percent of homes report around 40 percent of the fires). The reasons for this disparity are notobvious. However, two potential theories are that homes without smoke alanns are occupied bypeople who are less fire safe in general or that occupants of homes with alanns are alerted tofires earlier and are able to intervene before the fire reaches a size that necessitates contacting thefire department. NFPA has conducted an exploratory analysis of the latter explanation, and thisanalysis suggests that smoke alarms may reduce the number of fires reported to the firedepartment by 75 to 80 percent when compared to the number of fires that would be reportedwithout smoke alanns (Ahrens, 2004).
It is also important to understand the source of power used by smoke alarms. NFIRS datafrom home fires in 1999-2001 indicates that around 72 percent of smoke alarms are battery-