Embed Size (px)
Citation preview
Reducing False Positives in CRISPR/Cas9 Screens from Copy Number Variations
Alexander Wu1,2, Tengfei Xiao3,4, Teng Fei5, X. Shirley Liu1,4, Wei Li1,4,6,7
1Department of Biostatistics and Computational Biology, Dana-Farber Cancer Institute and
Harvard School of Public Health, Boston, MA 02215, USA 2Program in Computational Biology and Quantitative Genetics, Harvard School of Public Health,
Boston, MA 02215, USA 3Division of Molecular and Cellular Oncology, Department of Medical Oncology, Dana-Farber
Cancer Institute, Boston, MA 02215, USA 4Center for Functional Cancer Epigenetics, Dana-Farber Cancer Institute, Boston, MA 02215
USA 5College of Life and Health Sciences, Northeastern University, Shenyang 110819, People’s
Republic of China. 6Center for Generic Medicine Research, Children's National Health System, Washington, DC
20010, USA. 7Department of Genomics and Precision Medicine, The George Washington School of Medicine
and Health Sciences, Washington, DC 20010, USA.
Abstract
CRISPR/Cas9 knockout screens have been widely used to interrogate gene functions across a
wide range of cell systems. However, the screening outcome is biased in amplified genomic
regions, due to the ability of the Cas9 nuclease to induce multiple double-stranded breaks and
strong DNA damage responses at these regions. We developed algorithms to correct biases
associated with copy number variations (CNV), even when the CNV profiles are unknown. We
demonstrated that our methods effectively reduced false positives in amplified regions while
preserving signals of true positives. In addition, we developed a sliding window approach to
estimate regions of high copy numbers for cases in which CNV information is not available.
These copy number estimations can subsequently be used to effectively correct CNV-related
biases in CRISPR screening experiments. Our approach is integrated into the existing
MAGeCK/MAGeCK-VISPR analysis pipelines and provides a convenient framework to
improve the precision of CRISPR screening results.
All rights reserved. No reuse allowed without permission. (which was not peer-reviewed) is the author/funder, who has granted bioRxiv a license to display the preprint in perpetuity.
The copyright holder for this preprint. http://dx.doi.org/10.1101/247031doi: bioRxiv preprint first posted online Jan. 11, 2018;
Introduction
The CRISPR/Cas9 (clustered regularly interspaced short palindromic repeats/CRISPR-associated
9) system has been shown to be a highly effective genome editing tool for mammalian cells [1-
3]. This system has led to the application of CRISPR/Cas9 loss-of-function genome screening [4,
5], in which tens of thousands of genes are knocked out and evaluated for association with cell
proliferation (or other phenotypes). While CRISPR screens have demonstrated great promise for
investigating gene functions in cancer and other research areas [6, 7, 8], the outcomes of
CRISPR/Cas9 knockout screens are influenced by the copy number variations (CNVs) of regions
targeted by single guide RNAs (sgRNAs) [9]. In regions with high CNVs, sgRNAs direct Cas9
to induce cuts at every single copy, triggering a stronger DNA damage response, cell cycle
arrest, and decreasing cell proliferation. This leads to sgRNA depletion in screening readouts,
even if the function of targeted regions is unrelated to the screening phenotype [10]. This
problem is particularly relevant for cancer cells, as copy number alterations are common in
human cancers [11]. Therefore, reducing or correcting these copy number-related effects is
critical for improving the precision of downstream CRISPR screening analysis.
Currently, CERES is the only known computational method to decouple the copy number bias in
CRISPR screens [12]. It models sgRNA readouts as the combination of both CNV bias and
underlying gene knockout effects and uses a constrained least square optimization model to
decouple both effects. While this approach is effective in reducing the effect of copy number bias
in a large number of cell lines, it does not take into consideration many of the other biases that
exist in CRISPR screen analyses, including frequent absence of replicates, variability in sgRNA
knockout efficiencies, and variability in read count distributions. Furthermore, the model
All rights reserved. No reuse allowed without permission. (which was not peer-reviewed) is the author/funder, who has granted bioRxiv a license to display the preprint in perpetuity.
The copyright holder for this preprint. http://dx.doi.org/10.1101/247031doi: bioRxiv preprint first posted online Jan. 11, 2018;
requires CNV profiles for each cell type as input and, thus, cannot be applied to cells with
unknown CNV profiles.
We introduced two computational correction methods to correct copy number biases in CRISPR
screens. For cells with known CNV profiles, we built a regression model to capture the
relationship between CNV and gene essentiality, and subsequently correct the effects of CNV
biases. We demonstrated that our method is effective in reducing the prevalence of false
positives in high copy number regions, while retaining robust results for the identification of
essential genes with CRISPR screens. In addition, we developed a computational model to
approximate the relative CNVs for genomic regions that are susceptible to copy number biases.
It operates by locally analyzing sgRNA read count changes over a broad genomic region, and
subsequently estimating the copy number status based on the behaviors of all sgRNAs in the
region. This approach is particularly suitable for screening experiments in which CNV profiles
are unknown. We demonstrated that this approach correctly identified known amplified regions.
Both methods are integrated into MAGeCK [13] and MAGeCK-VISPR [14], two computational
algorithms we previously developed for the analysis of CRISPR screens.
Methods
MAGeCK and MAGeCK-VISPR
MAGeCK and MAGeCK-VISPR are algorithms we developed to estimate the effects of gene
knockouts in CRISPR screens. MAGeCK builds a mean-variance model to estimate the variance
of the read counts, and uses these variance estimations to model the read count changes for each
sgRNA in the treatment samples relative to the control samples. The read count changes
All rights reserved. No reuse allowed without permission. (which was not peer-reviewed) is the author/funder, who has granted bioRxiv a license to display the preprint in perpetuity.
The copyright holder for this preprint. http://dx.doi.org/10.1101/247031doi: bioRxiv preprint first posted online Jan. 11, 2018;
(calculated as “sgRNA scores” in MAGeCK) of all sgRNAs targeting each gene are then ranked
and summarized into one score for the gene (“gene score”), using a modified robust ranking
aggregation (RRA) algorithm. For clarification, we refer to this approach as “MAGeCK-RRA”.
In contrast, MAGeCK-VISPR consists of an algorithm named “MAGeCK-MLE” that estimates
the essentiality of genes in a CRISPR screen via a maximum likelihood approach. MAGeCK-
MLE initially takes in as input a raw table of reads, and the read count of each sgRNA for each
sample is modeled as a negative binomial (NB) random variable. For each sgRNA 𝑖 in sample 𝑗,
the mean of the NB random variable is subsequently modeled as 𝜇𝑖𝑗~ exp (𝛽𝑖0 + ∑ 𝑑𝑗𝑟𝛽𝑔𝑟𝑟 ),
where 𝛽𝑖0 represents the initial abundance of sgRNA 𝑖, and 𝛽𝑔𝑟 describes the effect of knocking
out targeting gene g for condition r. Importantly, 𝛽𝑔𝑟 (named the “𝛽 score”) represents the
essentiality of gene g in condition r and can be interpreted similarly to a log-fold change value: a
negative 𝛽 score suggests that gene g is negatively selected in condition r, and vice versa. The
value of 𝛽𝑔𝑟 is inferred by maximizing the joint log-likelihood of observing the read counts
associated with all sgRNAs targeting gene g for condition r.
CNV Bias Correction for CRISPR Screen Experiments using MAGeCK-MLE
To correct for copy number biases in MAGeCK-MLE, we model the relationship between 𝛽
scores and copy numbers for all genes in condition r with the following equation:
𝛽𝑔,𝑟 (𝐶𝑔,𝑟) = {
𝑏𝑔𝑟 − 𝛿𝑟𝐶𝑔,𝑟 , 𝑖𝑓 0 < 𝐶𝑔,𝑟 < 𝑝𝑟
𝑏𝑔𝑟 − 𝛿𝑟𝑝𝑟 , 𝑖𝑓 𝐶𝑔,𝑟 ≥ 𝑝𝑟
where 𝐶𝑔𝑟 is the copy number estimation of gene g, 𝛿𝑟 is a constant describing the relative effect
of CNV profiles on 𝛽 score, 𝑝𝑟 is the copy number threshold at which the cell cycle arrest is
All rights reserved. No reuse allowed without permission. (which was not peer-reviewed) is the author/funder, who has granted bioRxiv a license to display the preprint in perpetuity.
The copyright holder for this preprint. http://dx.doi.org/10.1101/247031doi: bioRxiv preprint first posted online Jan. 11, 2018;
fully activated, and 𝑏𝑔𝑟 is the 𝛽 score for a gene whose knockout does not trigger any DNA
damage response mechanism (i.e., no CNV effect). The values of 𝑏𝑔𝑟 , 𝑝𝑟, and 𝛿𝑟 are estimated
for each condition r by minimizing the least squared error between the observed 𝛽 scores and the
𝛽 scores estimated by the equation defined with these parameters. An example of the model
defining the relationship between 𝛽 scores and gene copy numbers for MCF7 cells is presented
in Figure 1a.
After defining the 𝛽 score-copy number model, the 𝛽 score for each gene g in condition r is
adjusted by an additive correction factor Δ. The value of Δ is equivalent to the magnitude of the
bias associated with the gene’s copy number relative to the bias associated with a gene of copy
number 2. In other words, the adjusted 𝛽 scores for gene g in condition r is defined as 𝛽𝑔,𝑟𝑎𝑑𝑗
=
𝛽𝑔,𝑟𝑟𝑎𝑤 + Δ = 𝛽𝑔,𝑟
𝑟𝑎𝑤 + [ 𝛽𝑔,𝑟 (2.0) − 𝛽𝑔,𝑟
(𝐶𝑁𝑔,𝑟)].
CNV Bias Correction for CRISPR Screen Experiments using MAGeCK-RRA
In the MAGeCK-RRA algorithm, we correct for CNV biases in the sgRNA scores, or the sgRNA
read count changes between two conditions (as calculated via the NB model). Similar to the
MAGeCK-MLE CNV correction model, we model sgRNA scores and gene CNV profiles as
follows:
𝑠𝑔,��(𝐶𝑔,𝑟) = {𝑠𝑔𝑟 − 𝛿𝑟𝐶𝑔,𝑟 , 𝑖𝑓 0 < 𝐶𝑔,𝑟 < 𝑝𝑟
𝑠𝑔𝑟 − 𝛿𝑟𝑝𝑟 , 𝑖𝑓 𝐶𝑔,𝑟 ≥ 𝑝𝑟
where 𝑠𝑖,𝑟 is the score of sgRNA i in comparison r. An example of the sgRNA score and copy
number variation is shown in Figure 1b. The sgRNA scores are similarly corrected for the copy
number bias effect by introducing the additive corrective factor Δ to each sgRNA score: 𝛽𝑔,𝑟𝑎𝑑𝑗
=
All rights reserved. No reuse allowed without permission. (which was not peer-reviewed) is the author/funder, who has granted bioRxiv a license to display the preprint in perpetuity.
The copyright holder for this preprint. http://dx.doi.org/10.1101/247031doi: bioRxiv preprint first posted online Jan. 11, 2018;
𝛽𝑔,𝑟𝑟𝑎𝑤 + Δ = 𝛽𝑔,𝑟
𝑟𝑎𝑤 + [𝑓(2.0) − 𝑓(𝐶𝑁𝑔,𝑟)]. After adjusting the sgRNA scores, the sgRNAs are
ranked by their scores, and gene essentiality is estimated via the RRA algorithm. An example of
the model defining the relationship between sgRNA scores and gene copy numbers for MCF7
cells is presented in Figure 1b.
A schematic of the CNV correction procedure for both MAGeCK-RRA and MAGeCK-MLE is
presented in Figure 1c.
CNV Estimation using sgRNA Read Counts from CRISPR Screen Experiments
The method mentioned above and other methods (like CERES) require CNV profiles as an input.
In the absence of relevant copy number data, we estimate the relative gene copy numbers via a
sliding window approach, in which we model sgRNA abundance changes within large genomic
regions. This approach uses a 2 Mb window and a step size of 0.1 Mb as default settings to scan
across entire chromosomes for all chromosomes in the genome. For each window, the log-fold
change values associated with all sgRNAs in the window are aggregated. The mean of these
values is then assigned as a window score if the corresponding window encompass 5 or more
genes. Once all window scores are computed, each gene is assigned a gene score 𝑤𝑔,𝑟 that equals
the mean of the window scores corresponding to the windows that overlap the gene. The relative
copy number for each gene g in condition r is then calculated from the distribution of gene
scores as follows: 𝐶𝑔,𝑟 =1
𝜎𝑟(𝑐𝑔,𝑟 − 𝜇𝑟) + 𝜇𝑟, where 𝑐𝑔,𝑟 = −𝑤𝑔,𝑟 is the negated gene score, 𝐶𝑔,𝑟
is the estimated relative copy number, 𝜎𝑟 is the standard deviation of the distribution of the 𝑐𝑔,𝑟
values, and 𝜇𝑟 is the mean of the 𝑐𝑔,𝑟 values. 𝜎𝑟 is introduced to adjust for the variability in
All rights reserved. No reuse allowed without permission. (which was not peer-reviewed) is the author/funder, who has granted bioRxiv a license to display the preprint in perpetuity.
The copyright holder for this preprint. http://dx.doi.org/10.1101/247031doi: bioRxiv preprint first posted online Jan. 11, 2018;
essentiality scores across different cell lines (i.e. some cell lines will have more negative/positive
essentiality scores than others).
The relative copy number estimates can subsequently be incorporated into the copy number bias
correction algorithms described above. In order to account for the strongly amplified genomic
regions, only the sgRNA scores or 𝛽 scores of the genes with the highest 2% of copy number
estimates are adjusted.
Results and Discussion
CNV Bias Correction Reduces False Positives in Gene Essentiality Identification
We first applied the correction algorithms of MAGeCK-MLE and MAGeCK-RRA to CRISPR
screens performed on MCF7 and T47D, two breast cancer cell lines. The MCF7 cell line
possesses a high copy number region in Chromosome 17 that does not exist in the T47D cell line
(Figure 2a). As expected, a high correlation was observed between amplified regions and
strongly negative 𝛽 scores (calculated by MAGeCK-MLE) and RRA scores (calculated by
MAGeCK-RRA) before adjustment (Figure 2a). MAGeCK-MLE decreased the magnitude of 𝛽
scores in these regions, reducing the effects of amplifications. Similar corrections to RRA scores
were observed in MCF7 (Figure 2b). As for T47D, the raw and adjusted 𝛽 (and RRA) scores
showed little difference due to the absence of high copy numbers within this same region
(Figures 2c, d).
We systematically evaluated the relationship between copy numbers and CRISPR screening
results in T47D and MCF7. Genes that have the highest copy numbers demonstrated
All rights reserved. No reuse allowed without permission. (which was not peer-reviewed) is the author/funder, who has granted bioRxiv a license to display the preprint in perpetuity.
The copyright holder for this preprint. http://dx.doi.org/10.1101/247031doi: bioRxiv preprint first posted online Jan. 11, 2018;
significantly smaller 𝛽 scores relative to the remaining genes in both cell lines (p < 2.2e-16 and p
= 1.085e-9, respectively, using the Kolmogorov-Smirnov test). Upon inclusion of the CNV
correction feature in MAGeCK-MLE, the difference in the distribution of 𝛽 scores between the
two groups of genes is smaller (p = 1.999e-4 and p = 0.5058 for MCF7 and T47D, respectively;
Figure 3a-b). The same reduction of differences between high CNV genes and other genes is
observed for RRA scores as well (Figure 3c-d).
Gene set enrichment analysis (GSEA) also demonstrated that genes with high copy numbers are
less enriched after CNV bias correction in negatively selected gene sets for MCF7 cells (Figure
4). Genes in amplified regions are less enriched after bias correction in T47D cells as well.
CNV Bias Correction Retains Robust Results from MAGeCK-MLE and MAGeCK
We next tested whether the correction algorithms affected the identification of essential genes,
by examining known essential genes in the amplified region of Chromosome 17. PPM1D,
BRIP1, and PECAM1 are three known oncogenes in breast cancer cells that are frequently
amplified in Chromosome 17 [15-19]. These genes are strongly negatively selected in the
amplified region of MCF7 cells and remained strongly negatively selected after CNV correction,
an indication that both correction algorithms do not eliminate truly essential genes in the screen
(Figure 5a-b). In contrast, these genes only demonstrated moderate negative selection in T47D
cells, which do not have amplifications in the corresponding genomic region (Figure 5c-d).
To comprehensively evaluate the overall effects of CNV correction across the genome, we
examined the enrichment of known essential genes in the negatively selected gene list. These
All rights reserved. No reuse allowed without permission. (which was not peer-reviewed) is the author/funder, who has granted bioRxiv a license to display the preprint in perpetuity.
The copyright holder for this preprint. http://dx.doi.org/10.1101/247031doi: bioRxiv preprint first posted online Jan. 11, 2018;
genes include genes in the pathways associated with ribosomes and spliceosomes, both are
known to be highly essential across the vast majority of cells. In both the MCF7 and T47D
samples, ribosomes and splicesomes (either ranked by 𝛽 scores or RRA scores) remain strongly
enriched in essential gene list before and after correction (Figure 6), providing evidence that our
algorithms preserve the signals from truly essential genes identified in CRISPR screens.
CNV Correction without CNV profiles
For samples without CNV profiles, we employed a sliding window approach to estimate gene
copy numbers by averaging the log-fold change values of sgRNAs within broad genomic
windows across the entire genome. We applied this approach to MCF7 cells and compared the
results with known MCF7 CNV profiles. The CNV estimates were highly correlated with actual
CNV measurements in MCF7 cells, especially for regions with strong amplifications and deep
deletions (Pearson’s correlation coefficient, r = 0.630; Figure 7a). In particular, the estimates of
relative gene copy numbers in the region of Chromosome 17 correspond well to the actual CNV
measurements within this same region (Figure 7b). Furthermore, when using the estimated CNV
profiles for CNV bias correction, both MAGeCK-MLE and MAGeCK-RRA reduced the effects
of CNV amplifications in Chromosome 17 (Figure 7c-d). Therefore, in cases where the copy
number data is absent, our approach serves as a valuable tool for correcting copy number biases
in CRISPR screening results.
Conclusion
Copy number variations (CNVs) are one of the major sources of false positives in CRISPR/Cas9
knockout screens. Supplementing the current MAGeCK and MAGeCK-VISPR computational
All rights reserved. No reuse allowed without permission. (which was not peer-reviewed) is the author/funder, who has granted bioRxiv a license to display the preprint in perpetuity.
The copyright holder for this preprint. http://dx.doi.org/10.1101/247031doi: bioRxiv preprint first posted online Jan. 11, 2018;

frameworks, we introduced CNV bias correction algorithms to effectively reduce biases
associated with copy numbers. In addition, we developed an approach to correct CNV biases
when CNV profiles are unknown, expanding the applicability of these algorithms to a broad
range of CRISPR screening datasets for which CNV profiles are not available. We demonstrated
that our algorithms reduced the prevalence of false positives while simultaneously retaining true
essential genes, further enhancing the results of MAGeCK and MAGeCK-VISPR.
All rights reserved. No reuse allowed without permission. (which was not peer-reviewed) is the author/funder, who has granted bioRxiv a license to display the preprint in perpetuity.
The copyright holder for this preprint. http://dx.doi.org/10.1101/247031doi: bioRxiv preprint first posted online Jan. 11, 2018;
References
1. Hsu PD, Lander ES, Zhang F. Development and applications of CRISPR-Cas9 for genome
engineering. Cell 2014;157:1262–1278.
2. Jinek M, East A, Cheng A, Lin S, Ma E, Doudna J. RNA-programmed genome editing in
human cells. eLife 2013;2:e00471.
3. Cong L, Ran FA, Cox D, Lin S, Barretto R, Habib N, Hsu PD, Wu X, Jiang W, Marraffini LA,
Zhang F: Multiplex genome engineering using CRISPR/Cas systems. Science 2013;
339:819–823.
4. Wang T, Wei JJ, Sabatini DM, Lander ES. Genetic screens in human cells using the CRISPR-
Cas9 system. Science 2014;343:80–4.
5. Shalem O, Sanjana NE, Zhang F. High-throughput functional genomics using CRISPR-Cas9.
Nat Rev Genet 2015;16:299–311.
6. Shi, J., E. Wang, J.P. Milazzo, et al., Discovery of cancer drug targets by CRISPR-Cas9
screening of protein domains. Nature biotechnology, 2015. 33(6): p. 661-7.
7. Chen, S., Sanjana, N.E., Zheng, K., Shalem, O., Lee, K., Shi, X., Scott, D.A., Song, J., Pan,
J.Q., Weissleder, R., et al. (2015). Genome-wide CRISPR screen in a mouse model of tumor
growth and metastasis. Cell 160, 1246–1260.
8. Platt RJ, Chen S, Zhou Y, Yim MJ, Swiech L, Kempton HR, Dahlman JE, Parnas O, Eisenhaure TM, Jovanovic M, Graham DB, Jhunjhunwala S, Heidenreich M, Xavier 45 RJ, Langer R, Anderson DG, Hacohen N, Regev A, Feng G, Sharp PA, Zhang F. CRISPR-Cas9
knockin mice for genome editing and cancer modeling. Cell 2014;159:440–55.
9. Aguirre AJ et al. Genomic copy number dictates a gene-independent cell response to
CRISPR/Cas9 targeting. Cancer Discovery. 2016;6:914–929.
10. Hart T, Chandrashekhar M, Aregger M, Steinhart Z, Brown KR, MacLeod G, et al. High-
Resolution CRISPR Screens Reveal Fitness Genes and Genotype-Specific Cancer Liabilities.
Cell 2015;163:1515–26.
11. Beroukhim R, Mermel CH, Porter D, et al. The landscape of somatic copy-number alteration
across human cancers. Nature. 2010;463(7283):899-905.
12. Meyers RM, Bryan JG et al., Computational correction of copy-number effect improves
specific of CRISPR-Cas9 essentiality screens in cancer cells. bioRxiv 160861.
13. Li W, Xu H, Xiao T, Cong L, Love MI, Zhang F, et al. MAGeCK enables robust
identification of essential genes from genome-scale CRISPR/Cas9 knockout screens.
Genome Biol. 2014;15:554.
14. Li W, Koster J, Xu H, Chen CH, Xiao T, Liu JS, Brown M, Liu XS. Quality control,
modeling and visualization of CRISPR screens with MAGeCK-VISPR. Genome
All rights reserved. No reuse allowed without permission. (which was not peer-reviewed) is the author/funder, who has granted bioRxiv a license to display the preprint in perpetuity.
The copyright holder for this preprint. http://dx.doi.org/10.1101/247031doi: bioRxiv preprint first posted online Jan. 11, 2018;
Biol 2015;16:281.
15. Li, J. et al. Oncogenic properties of PPM1D located within a breast cancer amplification
epicenter at 17q23. Nature Genet. 2002;31(2):133-134.
16. Lambros MB, Natrajan R, Geyer FC, et al. PPM1D gene amplification and overexpression in
breast cancer: a qRT-PCR and chromogenic in situ hybridization study. Mod Pathol
2010;23:1334.
17. De Nicolo A, Tancredi M, Lombardi G, et al. A novel breast cancer-associated BRIP1
(FANCJ/BACH1) germ line mutation impairs protein stability and function. Clinical cancer
research : an official journal of the American Association for Cancer Research.
2008;14(14):4672-4680.
18. Cantor SB, Guillemette S. Hereditary breast cancer and the BRCA1-associated
FANCJ/BACH1/BRIP1. Future oncology (London, England). 2011;7(2):253-261.
19. Tang DG, Chen YQ, Newman PJ, Shi L, Gao X, Diglio CA, Honn KV: Identification of
PECAM-1 in solid tumor cells and its potential involvement in tumor cell adhesion to
endothelium. J Biol Chem 1993, 268:22883-22894.
All rights reserved. No reuse allowed without permission. (which was not peer-reviewed) is the author/funder, who has granted bioRxiv a license to display the preprint in perpetuity.
The copyright holder for this preprint. http://dx.doi.org/10.1101/247031doi: bioRxiv preprint first posted online Jan. 11, 2018;
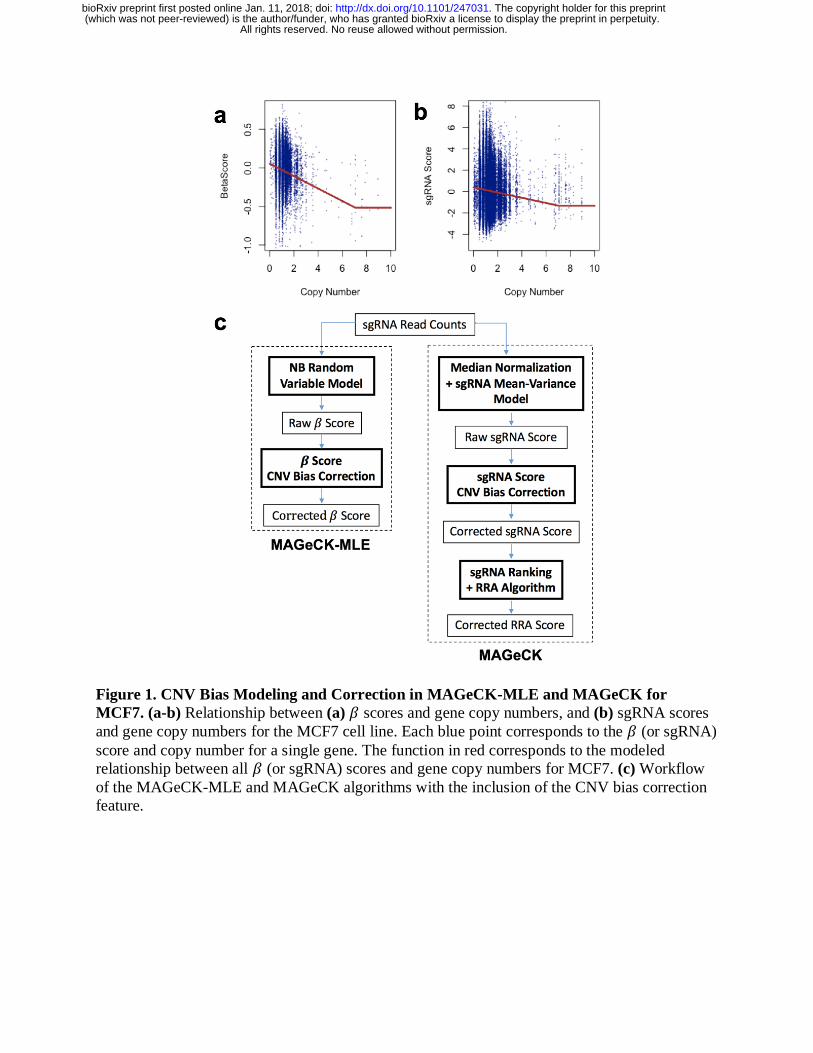
Figure 1. CNV Bias Modeling and Correction in MAGeCK-MLE and MAGeCK for
MCF7. (a-b) Relationship between (a) 𝛽 scores and gene copy numbers, and (b) sgRNA scores
and gene copy numbers for the MCF7 cell line. Each blue point corresponds to the 𝛽 (or sgRNA)
score and copy number for a single gene. The function in red corresponds to the modeled
relationship between all 𝛽 (or sgRNA) scores and gene copy numbers for MCF7. (c) Workflow
of the MAGeCK-MLE and MAGeCK algorithms with the inclusion of the CNV bias correction
feature.
All rights reserved. No reuse allowed without permission. (which was not peer-reviewed) is the author/funder, who has granted bioRxiv a license to display the preprint in perpetuity.
The copyright holder for this preprint. http://dx.doi.org/10.1101/247031doi: bioRxiv preprint first posted online Jan. 11, 2018;
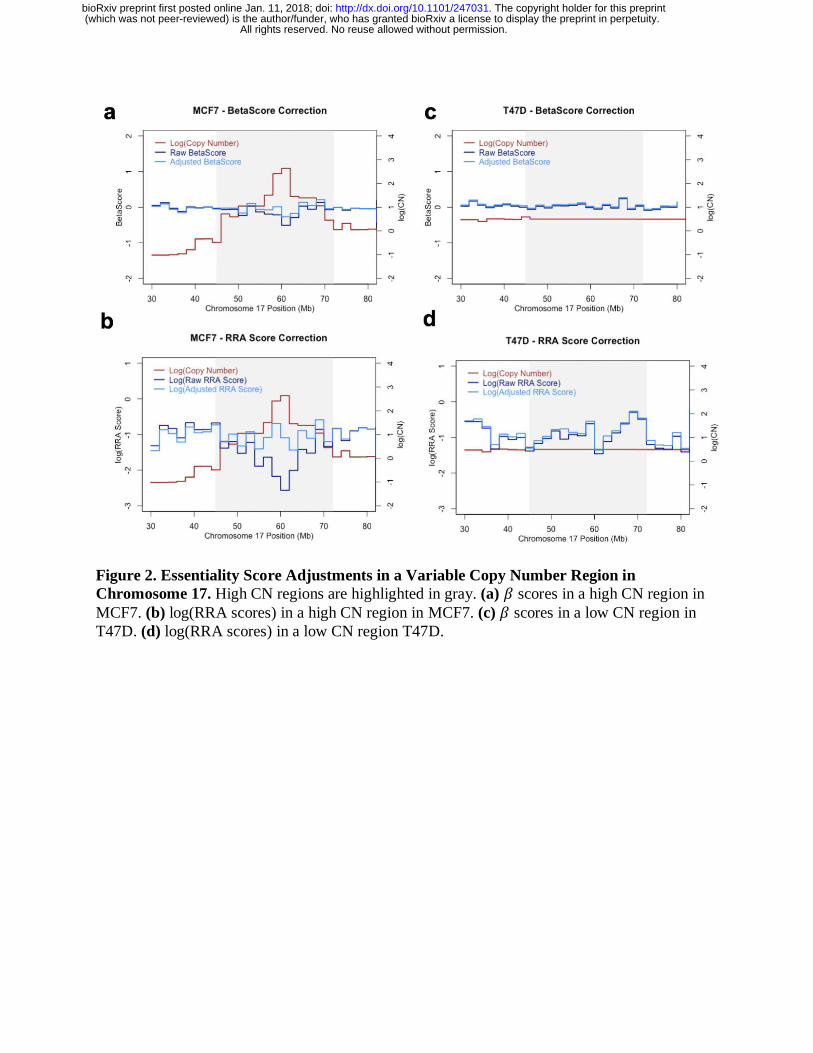
Figure 2. Essentiality Score Adjustments in a Variable Copy Number Region in
Chromosome 17. High CN regions are highlighted in gray. (a) 𝛽 scores in a high CN region in
MCF7. (b) log(RRA scores) in a high CN region in MCF7. (c) 𝛽 scores in a low CN region in
T47D. (d) log(RRA scores) in a low CN region T47D.
All rights reserved. No reuse allowed without permission. (which was not peer-reviewed) is the author/funder, who has granted bioRxiv a license to display the preprint in perpetuity.
The copyright holder for this preprint. http://dx.doi.org/10.1101/247031doi: bioRxiv preprint first posted online Jan. 11, 2018;
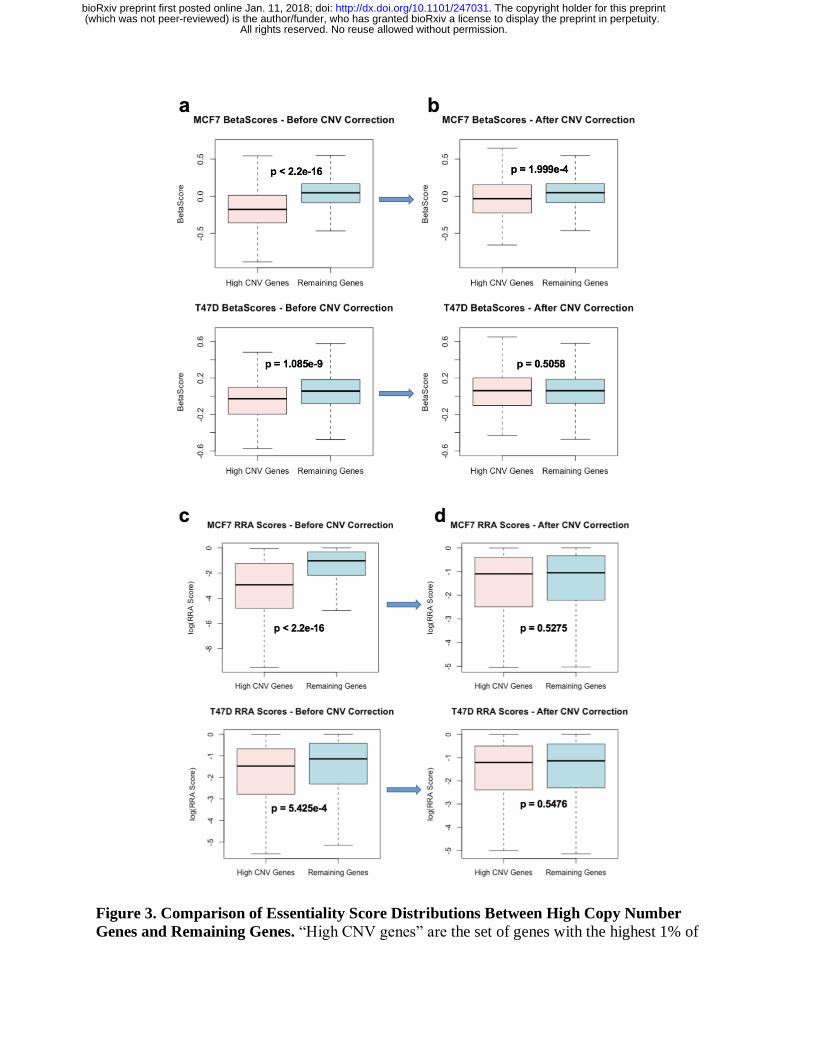
Figure 3. Comparison of Essentiality Score Distributions Between High Copy Number
Genes and Remaining Genes. “High CNV genes” are the set of genes with the highest 1% of
All rights reserved. No reuse allowed without permission. (which was not peer-reviewed) is the author/funder, who has granted bioRxiv a license to display the preprint in perpetuity.
The copyright holder for this preprint. http://dx.doi.org/10.1101/247031doi: bioRxiv preprint first posted online Jan. 11, 2018;

copy numbers. (a-b) Distribution of 𝛽 scores from MAGeCK-MLE without copy number bias
correction (a) and with copy number bias correction (b). (c-d) Distribution of log(RRA scores)
from MAGeCK without copy number bias correction (c) and with copy number bias correction
(d).
All rights reserved. No reuse allowed without permission. (which was not peer-reviewed) is the author/funder, who has granted bioRxiv a license to display the preprint in perpetuity.
The copyright holder for this preprint. http://dx.doi.org/10.1101/247031doi: bioRxiv preprint first posted online Jan. 11, 2018;
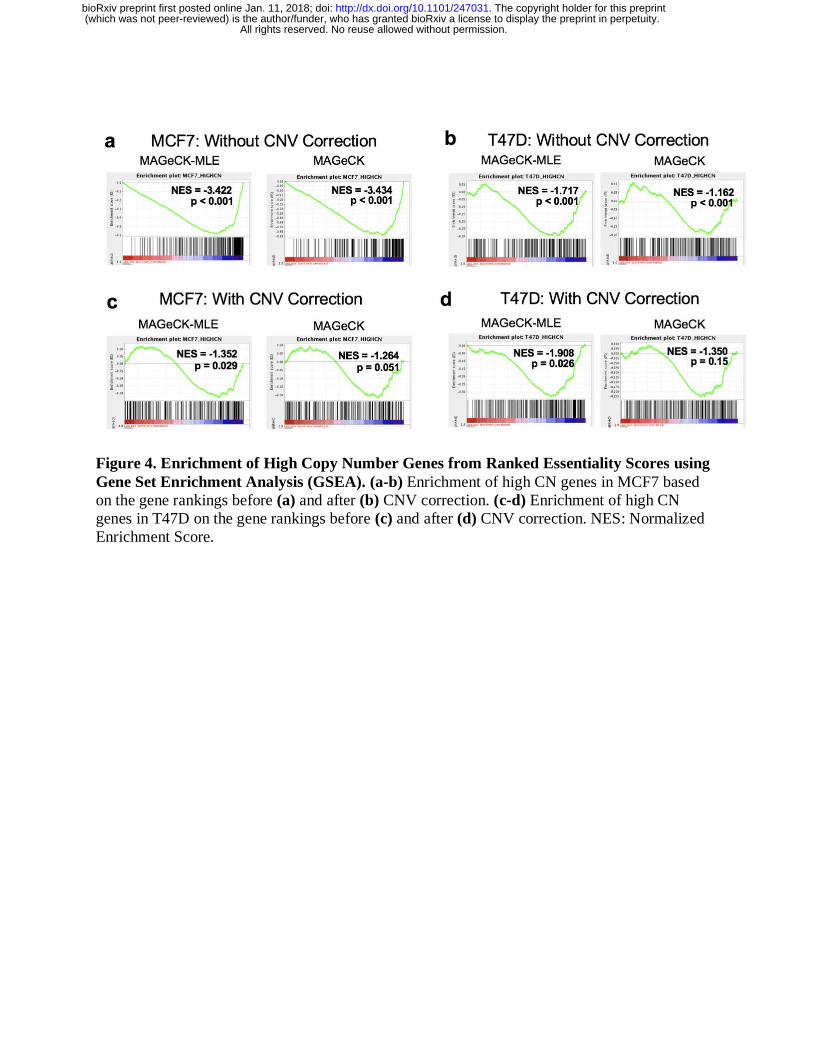
Figure 4. Enrichment of High Copy Number Genes from Ranked Essentiality Scores using
Gene Set Enrichment Analysis (GSEA). (a-b) Enrichment of high CN genes in MCF7 based
on the gene rankings before (a) and after (b) CNV correction. (c-d) Enrichment of high CN
genes in T47D on the gene rankings before (c) and after (d) CNV correction. NES: Normalized
Enrichment Score.
All rights reserved. No reuse allowed without permission. (which was not peer-reviewed) is the author/funder, who has granted bioRxiv a license to display the preprint in perpetuity.
The copyright holder for this preprint. http://dx.doi.org/10.1101/247031doi: bioRxiv preprint first posted online Jan. 11, 2018;
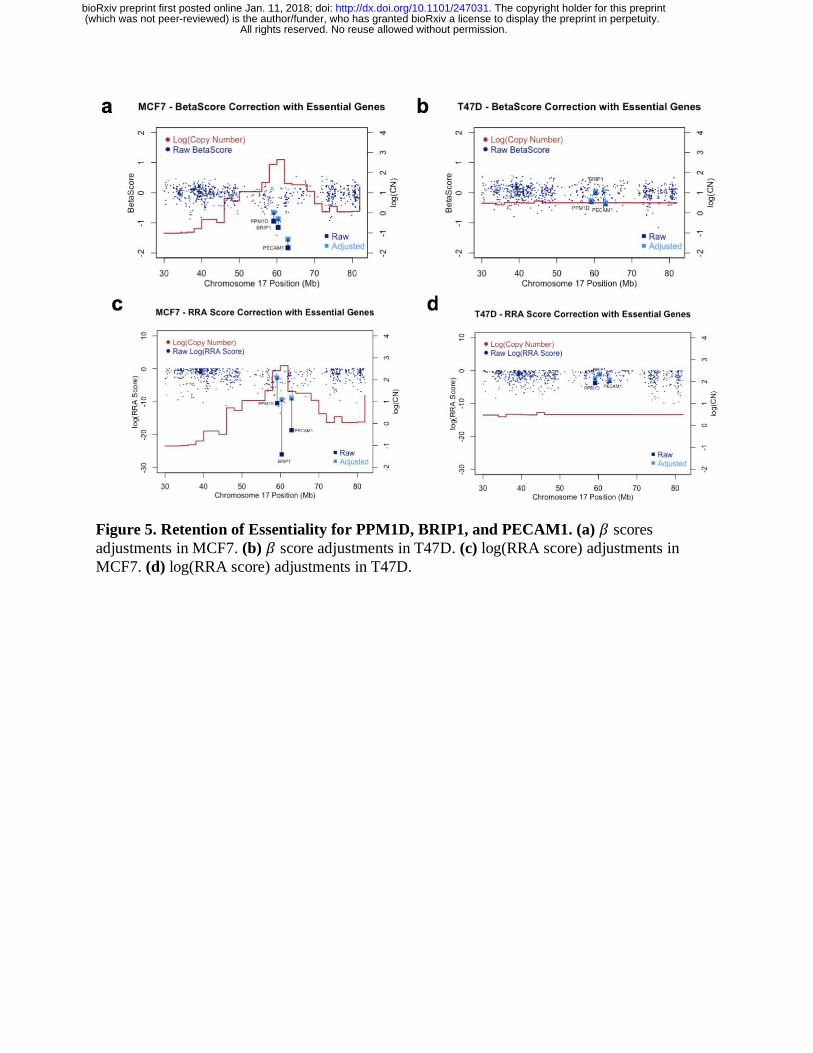
Figure 5. Retention of Essentiality for PPM1D, BRIP1, and PECAM1. (a) 𝛽 scores
adjustments in MCF7. (b) 𝛽 score adjustments in T47D. (c) log(RRA score) adjustments in
MCF7. (d) log(RRA score) adjustments in T47D.
All rights reserved. No reuse allowed without permission. (which was not peer-reviewed) is the author/funder, who has granted bioRxiv a license to display the preprint in perpetuity.
The copyright holder for this preprint. http://dx.doi.org/10.1101/247031doi: bioRxiv preprint first posted online Jan. 11, 2018;
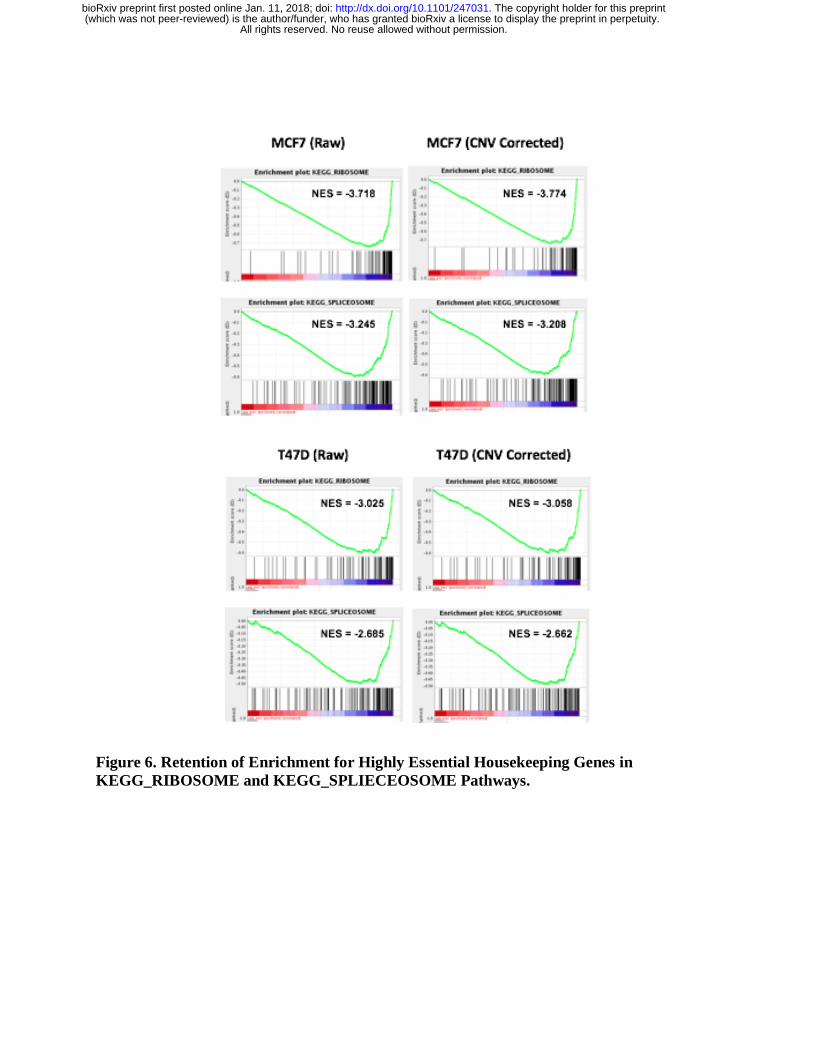
Figure 6. Retention of Enrichment for Highly Essential Housekeeping Genes in
KEGG_RIBOSOME and KEGG_SPLIECEOSOME Pathways.
All rights reserved. No reuse allowed without permission. (which was not peer-reviewed) is the author/funder, who has granted bioRxiv a license to display the preprint in perpetuity.
The copyright holder for this preprint. http://dx.doi.org/10.1101/247031doi: bioRxiv preprint first posted online Jan. 11, 2018;
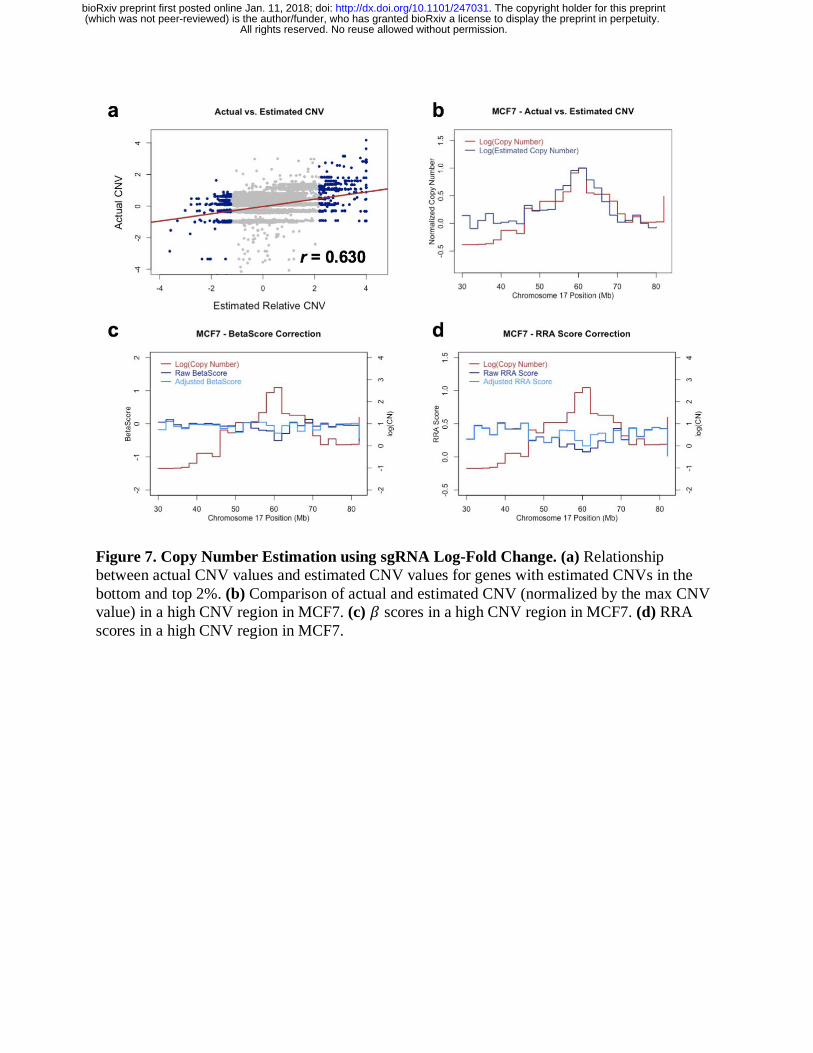
Figure 7. Copy Number Estimation using sgRNA Log-Fold Change. (a) Relationship
between actual CNV values and estimated CNV values for genes with estimated CNVs in the
bottom and top 2%. (b) Comparison of actual and estimated CNV (normalized by the max CNV
value) in a high CNV region in MCF7. (c) 𝛽 scores in a high CNV region in MCF7. (d) RRA
scores in a high CNV region in MCF7.
All rights reserved. No reuse allowed without permission. (which was not peer-reviewed) is the author/funder, who has granted bioRxiv a license to display the preprint in perpetuity.
The copyright holder for this preprint. http://dx.doi.org/10.1101/247031doi: bioRxiv preprint first posted online Jan. 11, 2018;


![Generation of Targeted Knockout Mutants in Arabidopsis ... · Keywords: CRISPR/Cas9, Genome editing, Arabidopsis thaliana, Plants, Knockout [Background] The CRISPR/Cas9 system (Cas9)](https://img.pdfslide.us/doc/110x75/5fcbdfb69ddbe939ee10f004/generation-of-targeted-knockout-mutants-in-arabidopsis-keywords-crisprcas9.jpg)