Embed Size (px)
Citation preview
Reducing False Alarm Rates for Critical Arrhythmias Using the Arterial Blood
Pressure Waveform
Authors: Anton Aboukhalil1, Larry Nielsen3, Mohammed Saeed1,2,3, Roger G.
Mark1,2, Gari D. Clifford1,2
Affiliations: 1 Massachusetts Institute of Technology, Cambridge, MA, USA 2 Harvard-MIT Division of Health Sciences & Technology, 45 Carleton St.,
Cambridge, MA, USA 3 Philips Medical Systems, Andover, MA, USA
Corresponding author:
Dr. Gari D. Clifford
Laboratory for Computational Physiology
Harvard-MIT Division of Health Sciences & Technology
Rm E25-505DA,
45 Carleton St.,
Cambridge
MA 02142
1
Abstract
Background. Over the past two decades, high false alarm (FA) rates have remained
an important yet unresolved concern in the Intensive Care Unit (ICU). High FA rates
lead to desensitization of the attending staff to such warnings, with associated
slowing in response times and detrimental decreases in the quality of care for the
patient. False arrhythmia alarms are commonly due to single channel ECG artifacts
and low voltage signals, and therefore it is likely that the FA rates may be reduced if
information from other independent signals is used to form a more robust hypothesis
of the alarm's etiology.
Methods. A large multi-parameter ICU database (PhysioNet's MIMIC II database)
was used to investigate the frequency of five categories of false critical (“red” or
“life-threatening”) ECG arrhythmia alarms produced by a commercial ICU
monitoring system, namely: asystole, extreme bradycardia, extreme tachycardia,
ventricular tachycardia and ventricular fibrillation/tachycardia. Non-critical
(“yellow”) arrhythmia alarms were not considered in this study. Multiple expert
reviews of 5,386 critical ECG arrhythmia alarms from a total of 447 adult patient
records in the MIMIC II database were made using the associated 41,301 hours of
simultaneous ECG and arterial blood pressure (ABP) waveforms. An algorithm to
suppress false critical ECG arrhythmia alarms using morphological and timing
information derived from the ABP signal was then tested.
Results. An average of 42.7% of the critical ECG arrhythmia alarms were found to
be false, with each of the five alarm categories having FA rates between 23.1% and
90.7%. The FA suppression algorithm developed was able to suppress 59.7% of the
false alarms, with FA reduction rates as high as 93.5% for asystole and 81.0% for
extreme bradycardia. FA reduction rates were lowest for extreme tachycardia
(63.7%) and ventricular-related alarms (58.2% for ventricular fibrillation/tachycardia
2
and 33.0% for ventricular tachycardia). True alarm (TA) reduction rates were all 0%,
except for ventricular tachycardia alarms (9.4%).
Conclusions. The FA suppression algorithm reduced the incidence of false critical
ECG arrhythmia alarms from 42.7% to 17.2%, where simultaneous ECG and ABP
data were available. The present algorithm demonstrated the potential of data fusion
to reduce false ECG arrhythmia alarms in a clinical setting, but the non-zero TA
reduction rate for ventricular tachycardia indicates the need for further refinement of
the suppression strategy. To avoid suppressing any true alarms, the algorithm could
be implemented for all alarms except ventricular tachycardia. Under these conditions
the FA rate would be reduced from 42.7% to 22.7%. This implementation of the
algorithm should be considered for prospective clinical evaluation. The public
availability of a real-world ICU database of multiparameter physiologic waveforms,
together with their associated annotated alarms is a new and valuable research
resource for algorithm developers.
Keywords: annotated database; blood pressure; false alarms; false alarm reduction;
intensive care unit; life-threatening alarms; signal quality
3
1. Introduction
False alarms in the Intensive Care Unit (ICU) can lead to a disruption of care,
impacting both the patient and the clinical staff through noise disturbances,
desensitization to warnings and slowing of response times [1], leading to decreased
quality of care [2,3]. ICU alarms produce sound intensities above 80 dB that can
lead to sleep deprivation [1,4,5], inferior sleep structure [6,7,8], stress for both
patients and staff [9,10,11,12,13] and depressed immune systems [14]. There are
also indications that the incidence of re-hospitalization is lower if disruptive noise
levels are decreased during a patient’s stay [15]. Furthermore, such disruptions have
been shown to have an important effect on recovery and length of stay [2,10]. In
particular, cortisol levels have been shown to be elevated (reflecting increased
stress) [12,13], and sleep disruption has been shown to lead to longer stays in the
ICU [5]. ICU false alarm (FA) rates as high as 86% have been reported, with
between 6% and 40% of ICU alarms having been shown to be true but clinically
insignificant (requiring no immediate action) [16]. In fact, only 2% to 9% of alarms
have been found to be important for patient management [17].
Previous investigations into reducing false alarms in data recorded from
critically ill patients are relatively few, and were performed on small data sets.
Mäkivirta et al. [18] implemented a recursive two-stage median filter for heart rate
trends which provided improved smoothing at the expense of increased error in heart
rate estimation. The first (3-point, 15 s) filter removed only brief transients, and the
second longer (15-point) filter removed more persistent artifacts. Makivirta's
approach reduced FA frequency from 88% to 51% in data from 10 post-cardiac
surgery patients. Sittig and Factor [19] developed a multi-state Kalman filter
approach to identifying artifacts and reducing alarms, but only tested the system on
simulated data. Koski et al [20] used 134 hours of data from 15 patients to develop
a knowledge-based system for reducing false alarms on post-operative patients,
4
achieving an increase in specificity from 20% to 74%. However, none of these
studies used a large, representative database for training or testing. GE Medical
(Waukesha, WI) is currently awaiting FDA 510(k) approval for their ‘Intellirate’
algorithm, which uses a range of simultaneously available pulsatile signals in the
ICU (such as the pulse oximeter and arterial blood pressure waveforms) to help
verify electrocardiogram (ECG)-based alarms. However, little has been published
concerning the Intellirate algorithm, including details of the relatively small set of
data on which the algorithm was tested. Schapira and Van Ruiswyk, in a poster
presentation [21], reported an evaluation of GE’s algorithm. The algorithm
employed by the monitors was shown to have a sensitivity of 94% and a positive
predictive value of 74%. After applying an unspecified fusion algorithm that used
the information in all the recorded channels the sensitivity remained unchanged, but
the positive predictive value increased to 86%. Unfortunately, no per-alarm category
analysis was given based upon alarm type, and only 151 alarms in total were used.
In a previous work, we analyzed a public database of ICU data which contained 89
distinct critical (life-threatening) ECG arrhythmia alarms (defined as asystole,
extreme bradycardia, extreme tachycardia, ventricular tachycardia and ventricular
fibrillation/tachycardia) recorded from a total of 21 subjects and 800 hours of ICU
waveform data [22]. A total of 25% of the 89 critical ECG arrhythmia alarms were
found to be false. An ABP analysis strategy (that involved checking to see if the
morphology and timing of the ABP was commensurate with the issued alarm) was
successful in suppressing all the false alarms in this study, without suppressing any
true alarms. However, given the small size of the dataset, it is unlikely that the FA
suppression rate would remain at 100% on a larger set of data, and some true alarm
suppression would likely be inevitable.
To avoid erroneous triggers of critical ECG ICU alarms, noisy sections of data
could be rejected using signal quality measures. Furthermore, intelligent multi-lead
5
ECG analysis (as is employed by most ICU monitors) and the use of data derived
from an independent cardiac-cycle signal might facilitate the rejection of false
arrhythmia alarms. The corroboration of alarms using information extracted from a
signal highly correlated with the ECG, (such as a pulsatile waveform) that uses an
independent sensor to monitor the cardiac cycle, might be able to suppress a large
number of false ECG alarms in the ICU. The ABP waveform signal is generated by
an independent transducer located away from the torso, exhibits different noise
characteristics from an ECG waveform, and is unlikely to contain ECG-related
artifacts (except in the case of large body movements of the patient that affect both
sensors simultaneously). Therefore, by using information derived from ABP and
ECG waveforms, it is likely that true ECG alarms can be effectively corroborated
and false ECG alarms suppressed. In the study presented in this article, a new multi-
parameter ICU database (PhysioNet’s MIMIC II database) [23, 24, 25] was used to
investigate the frequency of true and of false critical ECG arrhythmia alarms
generated by patient monitors in real ICU settings. No second-level “yellow” alarms
were considered in this study. The methods presented here are broken down into two
pieces of work. Firstly, procedures to identify and annotate critical ECG arrhythmia
alarms are detailed. Secondly, a strategy is presented for suppressing false critical
ECG arrhythmia alarms using an algorithm that exploits morphological and timing
information derived from the ABP waveform. Methods for optimizing the algorithm
are discussed. Results are then presented in three sections: 1) false and true alarm
rates of the annotated data, 2) optimized parameters values for the FA suppression
algorithm using the training set, and 3) the performance of the FA suppression
algorithm. Weaknesses of, and possible improvements to the algorithm are
discussed.
6
2. Methods
2.1. Data Sources
The Multi-Parameter Intelligent Monitoring for Intensive Care II (MIMIC II)
database was assembled primarily to facilitate the development and evaluation of
ICU decision support systems [23, 24, 25]. The database currently includes more
than 2,000 records containing multiparameter physiologic waveforms and
accompanying data which span approximately 10,000 patient-days. Each record
contains up to four channels of continuously monitored waveforms (usually two
leads of ECG, arterial BP, and pulmonary arterial pressure where available), as well
as monitor-generated alarms. Data was obtained under an IRB-approved protocol
from adult patients (ages 18 - >90 years, mean 68.3 years), in 48 medical, surgical,
and coronary intensive care beds at an urban tertiary-level hospital. All waveform
data and alarms were collected using Philips CMS bedside patient monitors (Philips
Medical Systems, Andover, MA). Although multi-lead arrhythmia analysis was
available in these monitors, it is important to note that the clinical staff at the data
collection site chose to use single lead arrhythmia analysis. Waveforms were stored
at 125 Hz with 8 bit resolution. The original ECG sampling rate was 500 Hz, and the
ECG was then compressed to 125Hz using a turning point algorithm to preserve
ECG peaks [26]. A subset of records were selected from the MIMIC II database that
fulfilled two criteria: 1) a critical ECG arrhythmia alarm was issued at some time
during the ICU stay, and 2) one channel of ECG and an ABP waveform were
present at the time of the arrhythmia alarm.
2.2. Alarm Definitions
In a modern ICU virtually all bedside monitors generate two classes of alarms: A
“yellow” alarm for notification of something abnormal, and a “red” alarm for
7
notification of a critical or life-threatening event. The “yellow” alarms are typically
not very loud and last for 5 or 6 seconds. However, the critical or “red” alarms have
a much louder and distinctive tone that remain on until they are “acknowledged” by
the care giver, usually a nurse. In this study we considered only critical “red” ECG
alarms, which comprise approximately 4% to 8% of the ECG alarms in our database.
Critical arrhythmia alarms issued by the bedside monitors as a result of ECG
signal processing were defined by the manufacturer according to the current
ANSI/AAMI EC13 Cardiac Monitor Standards [27] as follows: (1) Asystole alarms
were triggered by a default asystolic pause of 4 seconds that was user-adjustable
between 2.5 and 4 seconds. (2) Extreme bradycardia was defined to be a heart rate
(HR) less than 40 BPM. (3) Extreme tachycardia was defined to be a HR greater
than 140 BPM, adjustable up to 200 BPM for an adult population. (4) VTach was
defined as a run of ventricular beats at a rate of at least 100 BPM, lasting 5 or more
beats. (5) VTach/VFib was defined as a fibrillatory waveform lasting for at least 4
seconds. Table 1 details the alarm definitions and thresholds for the monitors used in
this study. Note that each triggered alarm also documented the currently valid user-
defined threshold settings where applicable.
2.3. “Gold Standard” Alarms: Annotation & Adjudication
Since no large annotated dataset of alarms is publicly available, a new set of
“gold standard” alarms was required to support the development and testing of false
alarm rejection strategies. Patient records which met the required criteria (described
above), were selected from the MIMIC II database, yielding 496 adult patient
records with a total of 45,370 hours of simultaneous ECG & ABP waveforms
containing 8,636 alarms.
Eleven volunteers were recruited to manually review the alarms. The
volunteers consisted of two main groups; first, a group of experienced researchers
8
(one physician with several decades of experience, and four signal processing
experts, each with over a decade of experience analyzing such data), and second, a
group of six graduate students, all with graduate level training in cardiac
electrophysiology [28]. The dataset was carefully reviewed by two annotators
working independently and in different locations. The reviewers were able to view
all the ECG and ABP waveforms surrounding each alarm (with a controllable
window size), using a standard open-source tool (‘WAVE’, available from
PhysioNet.org [29]). The default view provided all available bedside monitor signals
30 seconds either side of the alarm. Reviewers could expand and shrink both the
time and amplitude scales at their discretion to provide more detailed information or
to add context to the alarm. The reviewers were instructed to mark each alarm as
true, false, or ambiguous (if they were not completely certain). The reviewers’
annotations were recorded by the annotation software. The two passes were then
digitally compared for each individual alarm. Two sets were produced: 1) a set of
6,402 matched alarms where both reviewers agreed on the state of the alarm as true
or false, and 2) a set of 2,234 mismatched alarms, where the two reviewers either
disagreed, or at least one of them was uncertain of the state of the alarm. The
mismatched set was reviewed by one experienced physician or one experienced
research engineer to provide a final adjudication. The entire matched set was also
reexamined by a graduate student to ensure consistency, with any anomalies fed
back to the research engineers or physician. During the adjudication process, any
uncertainty was directed to the experienced physician for resolution. Throughout the
iterative process, alarms without associated physiological waveforms (due to
disconnections), and alarm repetitions referring to the same event, were removed.
Furthermore, 49 patients who had active intra-aortic balloon pumps (IABP) were
excluded, since their ABP waveforms did not appear as “physiologically normal”.
The final “gold standard” alarm set comprised 5,386 alarms from 447 patients
9
during a total of 41,301 hours. Hence, on average, there were approximately 3
critical ECG arrhythmia alarms per patient per day. Table 2 details the relative
frequency of each alarm category and their associated true and false rates, as judged
by the annotators.
2.4. Algorithm Architecture
The algorithm described here was designed to be used as a post-processing
module that could filter a bedside monitor’s critical alarm output in real-time. The
logic flow, depicted in Figure 1, consisted of using evidence from the ABP
waveform to accept or suppress an ECG-based alarm. At the onset of each critical
ECG arrhythmia alarm, a 17-second ABP waveform segment was extracted,
including 13 seconds prior to the alarm onset and 4 seconds after the alarm. The
AAMI standards [27] require that asystole and rate-limit arrhythmia alarms must be
triggered within 10 seconds of the onset of the event. Given that each alarm was
triggered within 5 to 6 seconds of the onset of the event, an additional 4 second
delay from the processing still satisfied the AAMI requirements.
After notification of each alarm, the algorithm first determined whether the
signal quality of the ABP was high enough to enable a decision concerning the
validity of the alarm to be made (except in the case of asystole or bradycardia, where
the algorithm searched for the absence of beats). This filter used the signal
abnormality index (SAI) of Sun et al. [30] and the beat detection algorithm of Zong
et al [31, 32]. The SAI value (‘0’ for a good beat and ‘1’ for an abnormal beat) was
calculated by comparing intervals, gradients and amplitudes of the blood pressure
waveform to pre-defined thresholds. If more than a given number of beats, M,
(which could be optimized differently for different alarm types) in the 17-second
analysis window were considered abnormal, then the ABP signal was deemed
10
unsuitable for further processing and by default, the arrhythmia alarm was accepted
as true. If a sufficient number of beats were considered normal, each arrhythmia
alarm was processed as detailed below.
2.4.1 Asystole Processing
An asystole alarm was issued by the bedside monitor if a beat-to-beat interval
longer than TA seconds (the variable asystole pause interval) was found for the
single lead being monitored. To decide on the truth of each asystole alarm the ABP
waveform was used to compute first, the largest pulse-to-pulse interval within the
analysis window (in case the asystole resolves itself within the window) and second,
the last pulse-to-window end interval (i.e. the time interval between the last detected
pulse onset and the end of the analysis window, in case the asystole was sustained
beyond the end of the analysis window). If the larger of the two intervals was greater
than TA, the asystole alarm was accepted; otherwise it was suppressed.
2.4.2 Extreme Bradycardia Processing
To determine the validity of an extreme bradycardia alarm, NB of the longest
pulse-to-pulse intervals extracted from the ABP waveform in the analysis window
were used to estimate the mean heart rate (by using the mean interval between
consecutive high quality beats). If the mean HR was above the monitor’s HR
threshold by at least E
B
BB BPM, the corresponding extreme bradycardia alarm was
suppressed.
2.4.3 Extreme Tachycardia Processing
The mean HR was computed based on the NT shortest pulse-to-pulse intervals
in the ABP waveform within the analysis window. There were three requirements
for alarm suppression: 1) there must be less than or equal to MT abnormal ABP
11
beat(s) (determined by the SAI algorithm), 2) the duration of the MT abnormal
beat(s), if any exist, must be less than a total of TT seconds, and 3) the mean HR
(calculated from NT beats) must be lower than ET BPM below the monitor’s adjusted
threshold. The condition of permitting MT abnormal beat(s) lasting a total of less
than TT seconds was designed to decrease the method's sensitivity to spurious noise,
and to allow suppression of alarms with a marginally abnormal ABP waveform. (In
this context, marginal means at least one and less than six beats in the 17-second
window were labeled as abnormal by the SAI algorithm.)
2.4.4 Ventricular Tachycardia
The mean HR was computed based on the NVT shortest pulse-to-pulse
intervals in the ABP waveform within the analysis window. A VTach alarm was
suppressed if both of the following conditions held: 1) the ABP waveform contained
less than or equal to MVT abnormal beats as defined by the SAI algorithm, and 2) the
mean HR (calculated over NVT beats) was below a variable threshold, RVT BPM.
2.4.5 Ventricular Fibrillation/Tachycardia
The mean HR was computed based on the NVF shortest pulse-to-pulse
intervals in the ABP waveform within the analysis window. A ventricular fibrillation
alarm was suppressed if both of the following conditions held: 1) the ABP waveform
displayed abnormal behavior (as judged by the SAI algorithm) for less than TVF
seconds and, 2) the mean HR (calculated over NVF beats) was below a variable
threshold, RVF BPM.
2.5. Algorithm Development: Training and Test Data Sets
The data in this study were divided into a test set and a training set of roughly
equal sizes. Optimization of each of the 13 parameters, (TA, EB, ET, NB, NT, NVT, NVF,
12
TT, TVF, MT, MVT, RVT and RVF) described above (in section 2.4) was performed over
the training set, between the limits listed in Table 3. The test set was used to estimate
the algorithm’s performance on ‘unseen’ data. The alarms were distributed amongst
the training and test groups on a per-patient basis, balancing them according to the
frequency of arrhythmia alarms. The patient records were rank-ordered with respect
to frequency of alarms and then divided into training (n=267) and test (n=180)
groups.
The distribution of the 5,386 distinct critical ECG arrhythmia alarms for each
group (and each alarm) is detailed in Table 4, together with their respective false
alarm rates. As can be observed from the table, each group was roughly equally
balanced for each type of alarm, although there were few true asystole and
VTach/VFib alarms in each group. The imbalance between the FA rates in the
training and test sets for the extreme bradycardia group indicated that the true and
false alarm rates for extreme bradycardia (but not the other critical alarm types in
this study) were highly subject specific, particularly with respect to the ratio of the
true to false alarms.
2.6 Algorithm Optimization
Due to the low number of algorithm parameters required for processing each
alarm type and the relatively small search-space required, complex optimization
schemes (such as gradient descent or Newton-based methods) were not required.
Furthermore, in some cases there were large areas of optimality where either the
extremes or the centroids of the parameter domains were appropriate. Since an
asymmetric optimization of several parameters using two cost functions sequentially
was required, (the minimum TA suppression rate, and then the maximum FA
suppression rate), a slightly unconventional approach was employed. Generally, for
13
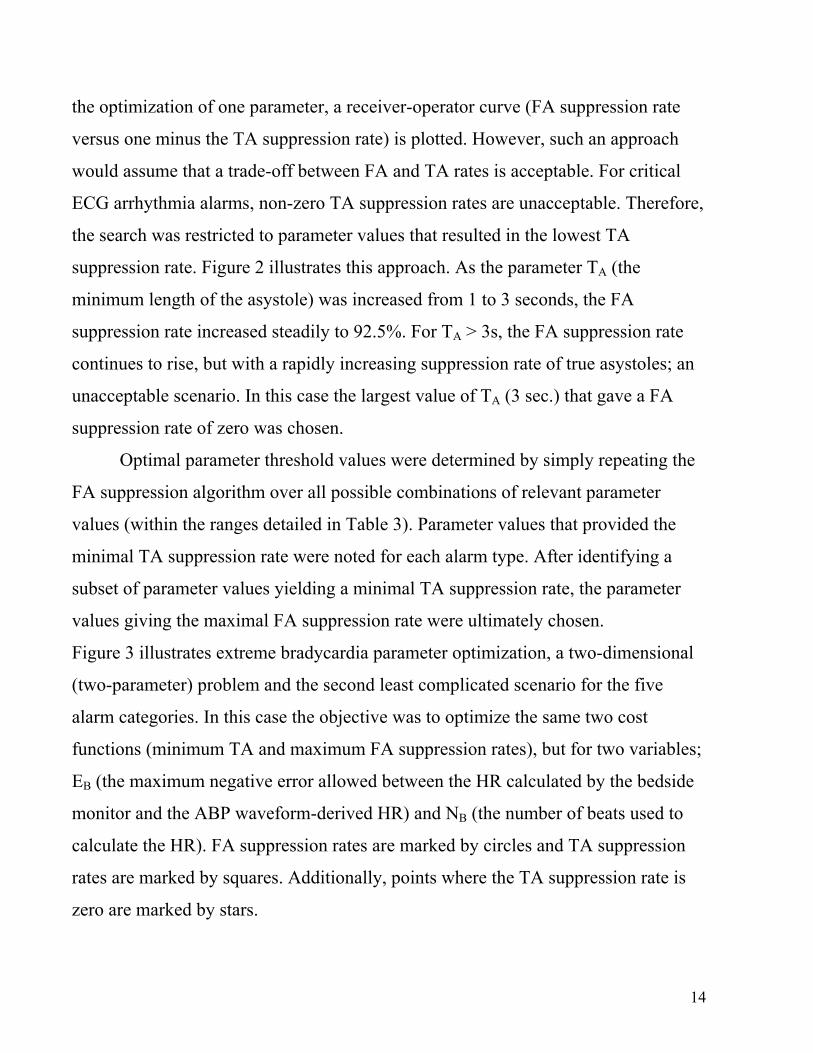
the optimization of one parameter, a receiver-operator curve (FA suppression rate
versus one minus the TA suppression rate) is plotted. However, such an approach
would assume that a trade-off between FA and TA rates is acceptable. For critical
ECG arrhythmia alarms, non-zero TA suppression rates are unacceptable. Therefore,
the search was restricted to parameter values that resulted in the lowest TA
suppression rate. Figure 2 illustrates this approach. As the parameter TA (the
minimum length of the asystole) was increased from 1 to 3 seconds, the FA
suppression rate increased steadily to 92.5%. For TA > 3s, the FA suppression rate
continues to rise, but with a rapidly increasing suppression rate of true asystoles; an
unacceptable scenario. In this case the largest value of TA (3 sec.) that gave a FA
suppression rate of zero was chosen.
Optimal parameter threshold values were determined by simply repeating the
FA suppression algorithm over all possible combinations of relevant parameter
values (within the ranges detailed in Table 3). Parameter values that provided the
minimal TA suppression rate were noted for each alarm type. After identifying a
subset of parameter values yielding a minimal TA suppression rate, the parameter
values giving the maximal FA suppression rate were ultimately chosen.
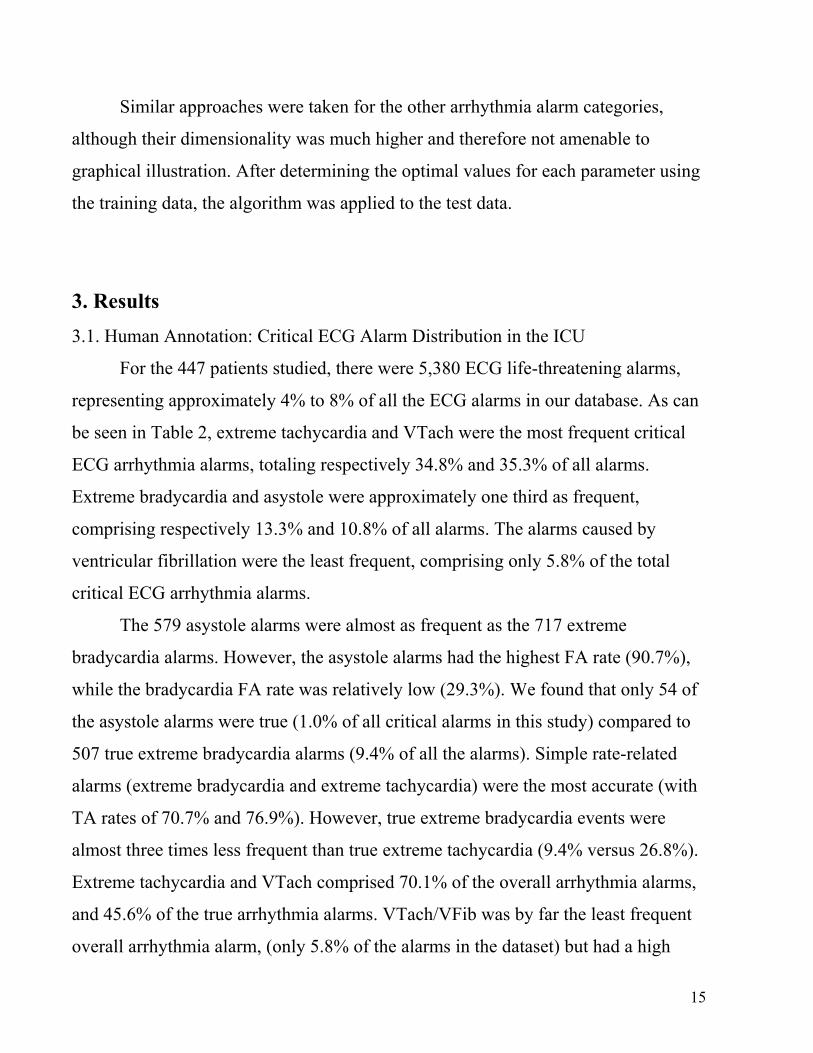
Figure 3 illustrates extreme bradycardia parameter optimization, a two-dimensional
(two-parameter) problem and the second least complicated scenario for the five
alarm categories. In this case the objective was to optimize the same two cost
functions (minimum TA and maximum FA suppression rates), but for two variables;
EB (the maximum negative error allowed between the HR calculated by the bedside
monitor and the ABP waveform-derived HR) and N
B
BB (the number of beats used to
calculate the HR). FA suppression rates are marked by circles and TA suppression
rates are marked by squares. Additionally, points where the TA suppression rate is
zero are marked by stars.
14
Similar approaches were taken for the other arrhythmia alarm categories,
although their dimensionality was much higher and therefore not amenable to
graphical illustration. After determining the optimal values for each parameter using
the training data, the algorithm was applied to the test data.
3. Results
3.1. Human Annotation: Critical ECG Alarm Distribution in the ICU
For the 447 patients studied, there were 5,380 ECG life-threatening alarms,
representing approximately 4% to 8% of all the ECG alarms in our database. As can
be seen in Table 2, extreme tachycardia and VTach were the most frequent critical
ECG arrhythmia alarms, totaling respectively 34.8% and 35.3% of all alarms.
Extreme bradycardia and asystole were approximately one third as frequent,
comprising respectively 13.3% and 10.8% of all alarms. The alarms caused by
ventricular fibrillation were the least frequent, comprising only 5.8% of the total
critical ECG arrhythmia alarms.
The 579 asystole alarms were almost as frequent as the 717 extreme
bradycardia alarms. However, the asystole alarms had the highest FA rate (90.7%),
while the bradycardia FA rate was relatively low (29.3%). We found that only 54 of
the asystole alarms were true (1.0% of all critical alarms in this study) compared to
507 true extreme bradycardia alarms (9.4% of all the alarms). Simple rate-related
alarms (extreme bradycardia and extreme tachycardia) were the most accurate (with
TA rates of 70.7% and 76.9%). However, true extreme bradycardia events were
almost three times less frequent than true extreme tachycardia (9.4% versus 26.8%).
Extreme tachycardia and VTach comprised 70.1% of the overall arrhythmia alarms,
and 45.6% of the true arrhythmia alarms. VTach/VFib was by far the least frequent
overall arrhythmia alarm, (only 5.8% of the alarms in the dataset) but had a high
15
associated FA rate (79.6%). The true VTach/VFib alarms were therefore almost as
infrequent (1.2% of all alarms in the dataset) as true asystole alarms. The overall FA
rate for the data used in this study was found to be 42.7%, with asystole, extreme
tachycardia and VTach being the major contributors to the FA rate.
3.2. Algorithm optimization
Table 5 lists the optimal parameter values found during algorithm training. In
some cases, a broad range of parameters was possible, in which case either the
center of the parameter ranges, or the most logical upper or lower limits were
chosen. (For example, when computing HR it is logical to use as many beats as
possible, within the optimal range, to obtain the best estimate. When choosing the
threshold for bradycardia, it is logical to choose the optimal value that most closely
maps to the clinical threshold for bradycardia.)
Figure 2 illustrates that an optimal value of TA=3 sec gave a FA suppression
rate of zero for asystole alarms. Figure 3 illustrates the more complicated scenario
for bradycardia FA suppression optimization, where two parameters (EB and NB BB) can
be varied. The circled area is the subset of points where the FA suppression rate is
largest given a TA suppression rate of zero, and where small changes in parameter
values do not change the performance substantially. An 80% FA suppression rate is
possible (with a zero TA suppression rate) for a non-unique set of values for EB and
N
B
BB. In this case the center of the region is used, giving EB=6 and NB BB=3. Note that
decreasing EB or decreasing NB BB can improve the FA suppression rate by at most 2%
(to 82%) but at the great cost of elevating the TA suppression rate from 0% to as
high as 80%.
16
3.3. Algorithm performance
Surprisingly, the performance of the arrhythmia alarm suppression algorithm
was better on the test set than on the training set, and hence a slight asymmetry in
the quality of the signals must exist between the test and training sets. Normally, we
would have expected a better performance on the training set, and would have
reported the (generally poorer results) on the test set. Since in this case the test set
essentially inflates the performance of the algorithm we were testing, we decided to
report also the lower performance statistics provided by averaging the results from
both the training and testing sets.
Table 6 details the FA and TA suppression performance of the algorithm on
the training and test sets, and also on the combined training and test sets. FA
suppression rates for the combined set ranged between 58.2% and 93.5% for all
arrhythmia alarm types except for VTach. The last two columns of Table 6 provide
the FA rates before and after suppression for the combined set. The asystole FA
rates were reduced from 90.7% to 5.5%. Extreme bradycardia and tachycardia FA
rates were reduced from 29.3% and 23.1% to 5.5% and 8.4% respectively.
VTach/VFib FA rates were reduced from 79.6% to 33.1%. The false VTach alarm
suppression rate was the lowest of all alarm categories tested, with a reduction in the
FA rate from 46.6% to 30.8%, at the cost of suppressing 9.4% of the true VTach
alarms (14.5% in the training data and 4.0% in the test data). No true alarms were
suppressed for any other critical alarm group in this study. The overall FA rate was
reduced from 42.7% to 17.2%.
17
4. Discussion
In the present study, for patients with invasive ABP monitoring, false critical
ECG arrhythmia alarm rates in the ICU were found to be, on average, 42.7%, with
individual rates varying between 23.1% and 90.7%. The literature reports FA rates
in ICU data (for both “red” and “yellow” conditions) between 40% and 90% [16-
21]; results which are consistent with those presented in this study. The false
asystole alarm rates (and FA rates for all the critical ECG arrhythmia alarms) in our
data may have been higher than they needed to be. Firstly, the critical care units
from which these data were recorded chose to standardize arrhythmia analysis on
only one selected lead of ECG even though the monitors were capable of using
multilead arrhythmia analysis. Hence the arrhythmia alarms included in the MIMIC-
II database do not reflect the optimal performance of the vendor’s arrhythmia
algorithms. In addition, most false asystole alarms were caused by low amplitude
QRS complexes in the ECG (less than 150 microvolts), which could not be reported
as valid beats according to the current ANSI/AAMI EC13 Cardiac Monitor
Standards [27].
The false alarm suppression strategy explored in this study proved remarkably
effective at suppressing false arrhythmia alarms in ICU data, reducing the average
FA rate from 42.7% to 17.2%. The algorithm was particularly successful in reducing
FA rates for asystole, extreme bradycardia, and extreme tachycardia, with zero
suppression of true alarms. The algorithm achieved more moderate reductions in FA
rates for VTach and VTach/VFib, and only at the expense of suppressing 9.4% of
true VTach alarms. To avoid suppressing any true alarms, the algorithm could be
implemented for all alarms except VTach. In this case, the average FA rate would be
reduced from 42.7% to 22.7%.
The algorithm’s requirement for simultaneous ECG and ABP signals is a
condition that is not always satisfied in the ICU since not all patients require
18
invasive ABP monitoring. Only 63.8% of patients in the MIMIC II database had
invasive ABP monitoring during part of their ICU stay, and hence the algorithm
described in this paper will not affect FA rates for the other 36.2% of patients.
Furthermore, it is likely that the FA rates in patients not requiring ABP monitoring
are higher, reflecting their more active behavior.
Future work will focus on extracting information from the ECG and other
pulsatile waveforms (such as the pulse oximeter and pulmonary arterial pressure) to
improve the FA reduction rate on a broader patient population. Additionally,
information from multiple leads of ECG is required to reduce the number of
suppressed true VTach alarms to a negligible amount, and increase the number of
false VTach alarms one can suppress. Such an approach is likely to require a
combination of signal quality indices [33] and additional signal processing methods
applied to the ECG and other cardiovascular signals. Other improvements should
include a method for automatically identifying intra-aortic balloon pumps, and
developing signal quality indices for the pulse oximeter waveform (to allow the
incorporation of this signal into this FA suppression framework).
5. Conclusions
The study described in this paper demonstrated that a FA suppression
algorithm that used only one extra channel of non-ECG information (the ABP
waveform) and some simple logic allowed for the identification and suppression of
the majority of false critical ECG arrhythmia alarms. The algorithm demonstrated
the potential of using multiple physiologic waveforms for reducing false alarms in
the clinical setting. An extension of the algorithm could be applied to physiological
monitoring in a general sense (to other signals, other alarms categories, and in other
settings, such as the operating room) and would only be limited by the number of
related cardiovascular signals and their respective signal qualities. Specific
19
extensions to the algorithm should include a fusion of data from multiple ECG leads
and from other pulsatile waveforms, such as that derived from the pulse oximeter.
The analysis of the pulse oximeter waveform is important for the subset of patients
that are not being monitored with an invasive ABP line. The analysis of multiple
ECG leads will be of particular use in dealing with the “yellow” second-level
alarms.
The demonstrated improvement in alarm performance described in this study
should motivate monitoring vendors to process multiple physiologic waveforms
within their own alarm algorithm architectures. In fact, the present algorithm should
be deployed in a controlled small scale clinical study to assess its impact on reducing
false critical arrhythmia alarms in the ICU. To avoid suppressing any true positive
alarms the algorithm could be run for all alarm types except for VTach, where the
suppression strategy needs further refinement.
Since the annotated database used in this work is publicly available [25], it is
hoped that other research groups and device manufacturers will improve both on the
algorithms described here, and on the quality and quantity of the annotated data
(such as a subset of the “yellow alarms”). It would be useful to identify possible
errors (or points of contention) in the annotations, and to identify arrhythmic events
that were missed by the original monitors. It is likely, given previous studies [21],
that around 200 to 300 such false negative events are hidden within the data used
here. If current device manufacturers run their arrhythmia algorithms on this data,
some of the missing events may be identified. Ultimately, collaborative efforts are
needed to develop new multi-parameter annotated databases that can serve as “gold-
standards” to support the development and evaluation of novel monitoring
algorithms and to provide high quality metrics for regulatory bodies.
20
Acknowledgements
This work was performed as part of a Bioengineering Research Partnership funded
by the U.S. National Institute of Biomedical Imaging and Bioengineering (NIBIB)
and the National Institutes of Health (NIH) under Grant Number R01-EB001659,
and also in part by Philips Medical Systems. Anton Aboukhalil was also partially
supported by a postgraduate scholarship from the Natural Sciences and Engineering
Research Council of Canada (NSERC). The content of this document is solely the
responsibility of the authors and does not necessarily represent the official views of
the NIBIB, the NIH, Philips Medical Systems or the NSERC. The authors thank the
numerous database developers and annotators who contributed to the construction of
the alarms database, including Omar Abdala, Thomas Heldt, Caleb Hug, Sherman
Jia, Tin Htet Kyaw, Li-Wei Lehman, Benjamin Moody, George Moody, Greg Raber,
Andrew Reisner, Ali Saeed, Dewang Shavdia, Mauricio Villarroel, Ying Zhang and
Wei Zong. The authors also thank the anonymous reviewers for their helpful
suggestions.
21
References
[1] Chambrin MC. Review: Alarms in the intensive care unit: how can the number
of false alarms be reduced? Critical Care. 2001 Aug; 5(4):184–8. Epub 2001 May
23.
[2] Donchin Y, Seagull FJ. The hostile environment of the intensive care unit. Curr
Opin Crit Care. 2002 Aug;8(4):316-20.
[3] Imhoff M, Kuhls S. Alarm algorithms in critical care monitoring. Anesth Analg.,
2006 May; 102(5):1525–37.
[4] Meyer TJ, Eveloff SE, Bauer MS, Schwartz WA, Hill NS, Millman RP. Adverse
environmental conditions in the respiratory and medical ICU settings. Chest. 1994
Apr; 105(4), 1211-16.
[5] Parthasarathy S, Tobin MJ. Sleep in the intensive care unit. Intensive Care Med.
2004 Feb; 30(2), 197-206.
[6] Johnson AN. Neonatal response to control of noise inside the incubator. Pediatr
Nurs. 2001 Nov-Dec; 27(6), 600-5.
[7] Slevin M, Farrington N, Duffy G, Daly L, Murphy JF. Altering the NICU and
measuring infants' responses. Acta Paediatr. 2000 May; 89(5), 577-81.
[8] Zahr LK, de Traversay J. Premature infant responses to noise reduction by
earmuffs: effects on behavioral and physiologic measures. J of Perinatol. 1995 Nov-
Dec; 15(6), 448-55.
[9] Baker CF. Discomfort to environmental noise: heart rate responses of SICU
patients. Crit Care Nurs Q. 1992 Aug; 15(2), 75-90.
[10] Cropp AJ, Woods LA, Raney D, Bredle DL. Name that tone. The proliferation
of alarms in the intensive care unit. Chest. 1994 Apr; 105(4):1217–20.
[11] Novaes MA, Aronovich A, Ferraz MB, Knobel E. Stressors in ICU: patients'
evaluation. Intensive Care Med. 1997 Dec; 23(12), 1282-5.
22
[12] Topf M, Thompson S. Interactive relationships between hospital patients' noise
induced stress and other stress with sleep. Heart Lung. 2001 Jul-Aug; 30(4), 237-43.
[13] Morrison WE, Haas EC, Shaffner DH, Garrett ES, Fackler JC. Noise, stress,
and annoyance in a pediatric intensive care unit. Crit Care Med. 2003 Jan; 31(1),
113-9.
[14] Berg S. Impact of reduced reverberation time on sound-induced arousals during
sleep. Sleep. 2001 May 1; 24(3), 289-92.
[15] Hagerman I, Rasmanis G, Blomkvist V, Ulrich R, Eriksen CA, Theorell T.
Influence of intensive coronary care acoustics on the quality of care and
physiological state of patients. Int J Cardiol. 2005 Feb 15; 98(2):267-70.
[16] Lawless ST. Crying wolf: false alarms in a pediatric intensive care unit. Crit
Care Med. 1994 Jun; 22(6):981-5.
[17] Tsien CL, Fackler JC. Poor prognosis for existing monitors in the intensive care
unit. Crit Care Med. 1997 Apr; 25(4):614–9.
[18] Mäkivirta A, Koski E, Kari A, Sukuvaara T. The median filter as a preprocessor
for a patient monitor limit alarm system in intensive care. Comput Methods
Programs Biomed. 1991 Feb-Mar; 34(2-3):139-44
[19] Sittig DF, Factor M. Physiologic trend detection and artifact rejection: a parallel
implementation of a multi-state Kalman filtering algorithm. Comput Methods
Programs Biomed. 1990 Jan; 31(1):1-10.
[20] Koski EM, Sukuvaara T, Mäkivirta A, Kari A. A knowledge-based alarm
system for monitoring cardiac operated patients-assessment of clinical performance.
Int J Clin Monit Comput. 1994 May; 11(2):79-83.
[21] Schapira RM, Van Ruiswyk J. Reduction in alarm frequency with a fusion
algorithm for processing monitor signals. Meeting of the American Thoracic
Society. 2002; Session A56, Poster H57. Available online at:
http://www.abstracts2view.com/atsall/
23
[22] Clifford GD, Aboukhalil A, Sun JX, Zong W, Janz BA, Moody GB, Mark RG.
Using the blood pressure waveform to reduce critical false ECG alarms, Comput.
Cardiol. 2006; 33:829-32.
[23] Saeed M, Lieu C, Raber G, Mark RG. MIMIC II: a massive temporal ICU
patient database to support research in intelligent patient monitoring. Comput.
Cardiol. 2002; 29:641-4.
[24] Goldberger AL, Amaral LA, Glass L, Hausdorff JM, Ivanov PC, Mark RG, et
al. PhysioBank, PhysioToolkit, and PhysioNet: components of a new research
resource for complex physiologic signals. Circulation. 2000 Jun 13; 101(23):e215-
20.
[25] The MIMIC II Database. Available online at:
http://www.physionet.org/physiobank/database/mimic2db/
[26] Jalaleddine SMS, Hutchens CG, Strattan RD, Coberly WA. ECG data
compression techniques – a unified approach. IEEE Trans. Biomed. Eng. Apr. 1990;
37(4):329-43.
[27] Cardiac monitors, heart rate meters, and alarms, American National Standard
(ANSI/AAMI EC13:2002). Arlington, VA: Association for the Advancement of
Medical Instrumentation, 2002.
[28] Mark, RG. HST.542J / 2.792J / 20.371J / 6.022J Quantitative Physiology:
Organ Transport Systems, Spring 2004; Open CourseWare, M.I.T. Available online
at: http://ocw.mit.edu/OcwWeb/Health-Sciences-and-Technology/HST-542JSpring-
2004/CourseHome/index.htm
[29] Moody GB. WAVE User’s Guide. 5th Edition. Available online at:
http://physionet.org/physiotools/wug/
[30] Sun JX, Reisner AT, Mark RG. A signal abnormality index for arterial blood
pressure waveforms. Comput. Cardiol. 2006; 33:13-6.
24
[31] Zong W, Heldt T, Moody GB, Mark RG. An open-source algorithm to detect
onset of arterial blood pressure pulses, Comput. Cardiol. 2003; 30:259-62.
[32] Zong W, Moody GB, Mark RG. Reduction of false arterial blood pressure
alarms using signal quality assessment and relationships between the
electrocardiogram and arterial blood pressure. Med Biol Eng Comput. 2004 Sep;
42(5):698-706.
[33] Li Q, Mark RG, Clifford GD. Robust heart rate estimate fusion using signal
quality indices and a Kalman filter IOP Physiol. Meas.2008 Jan; 29:15-32.
25
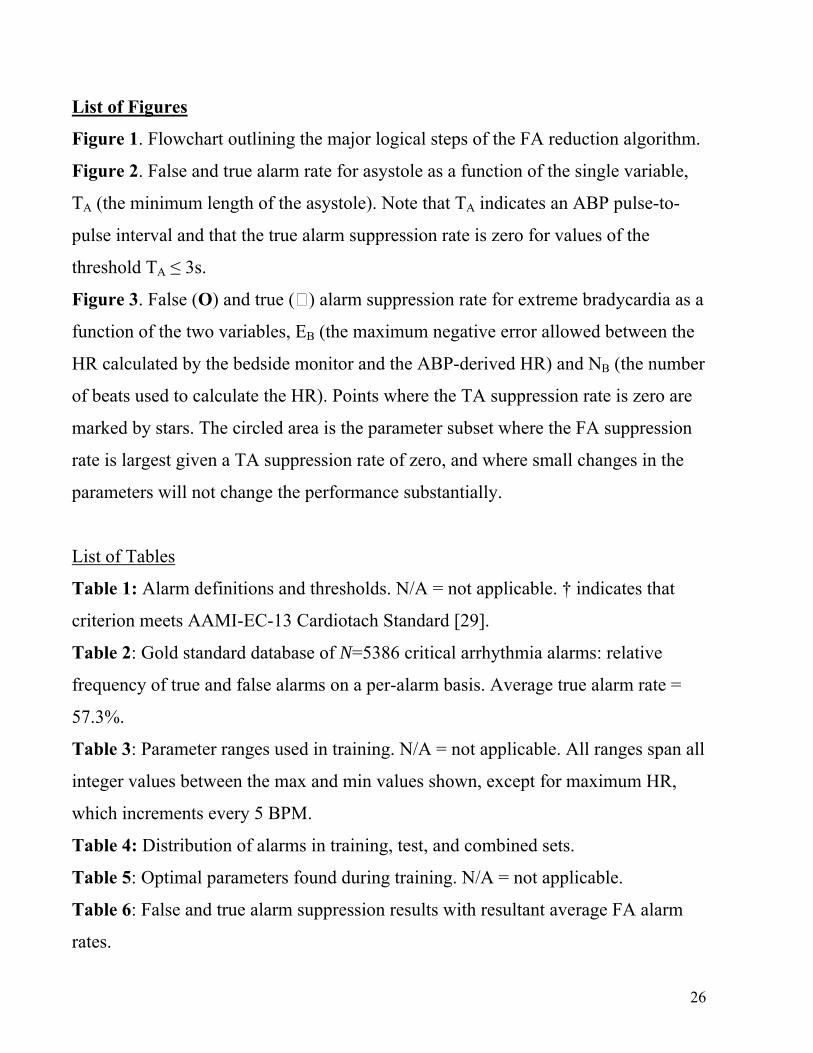
List of Figures
Figure 1. Flowchart outlining the major logical steps of the FA reduction algorithm.
Figure 2. False and true alarm rate for asystole as a function of the single variable,
TA (the minimum length of the asystole). Note that TA indicates an ABP pulse-to-
pulse interval and that the true alarm suppression rate is zero for values of the
threshold TA ≤ 3s.
Figure 3. False (O) and true () alarm suppression rate for extreme bradycardia as a
function of the two variables, EB (the maximum negative error allowed between the
HR calculated by the bedside monitor and the ABP-derived HR) and N
B
BB (the number
of beats used to calculate the HR). Points where the TA suppression rate is zero are
marked by stars. The circled area is the parameter subset where the FA suppression
rate is largest given a TA suppression rate of zero, and where small changes in the
parameters will not change the performance substantially.
List of Tables
Table 1: Alarm definitions and thresholds. N/A = not applicable. † indicates that
criterion meets AAMI-EC-13 Cardiotach Standard [29].
Table 2: Gold standard database of N=5386 critical arrhythmia alarms: relative
frequency of true and false alarms on a per-alarm basis. Average true alarm rate =
57.3%.
Table 3: Parameter ranges used in training. N/A = not applicable. All ranges span all
integer values between the max and min values shown, except for maximum HR,
which increments every 5 BPM.
Table 4: Distribution of alarms in training, test, and combined sets.
Table 5: Optimal parameters found during training. N/A = not applicable.
Table 6: False and true alarm suppression results with resultant average FA alarm
rates.
26
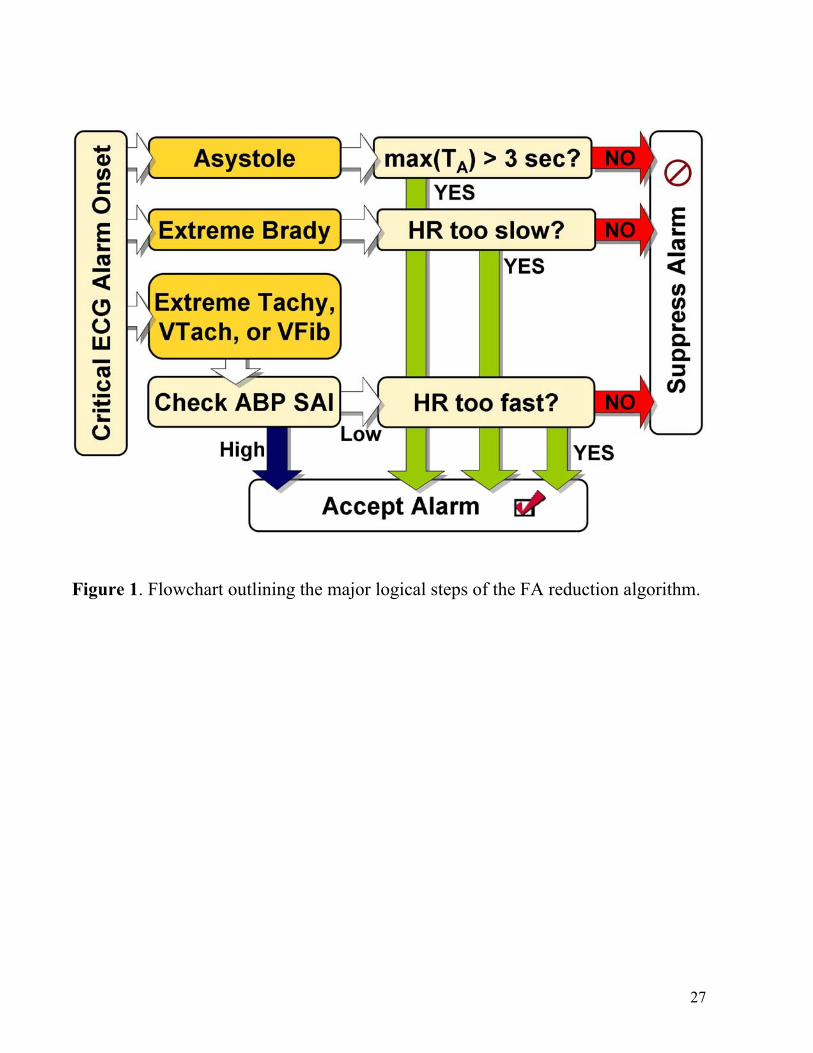
Figure 1. Flowchart outlining the major logical steps of the FA reduction algorithm.
27
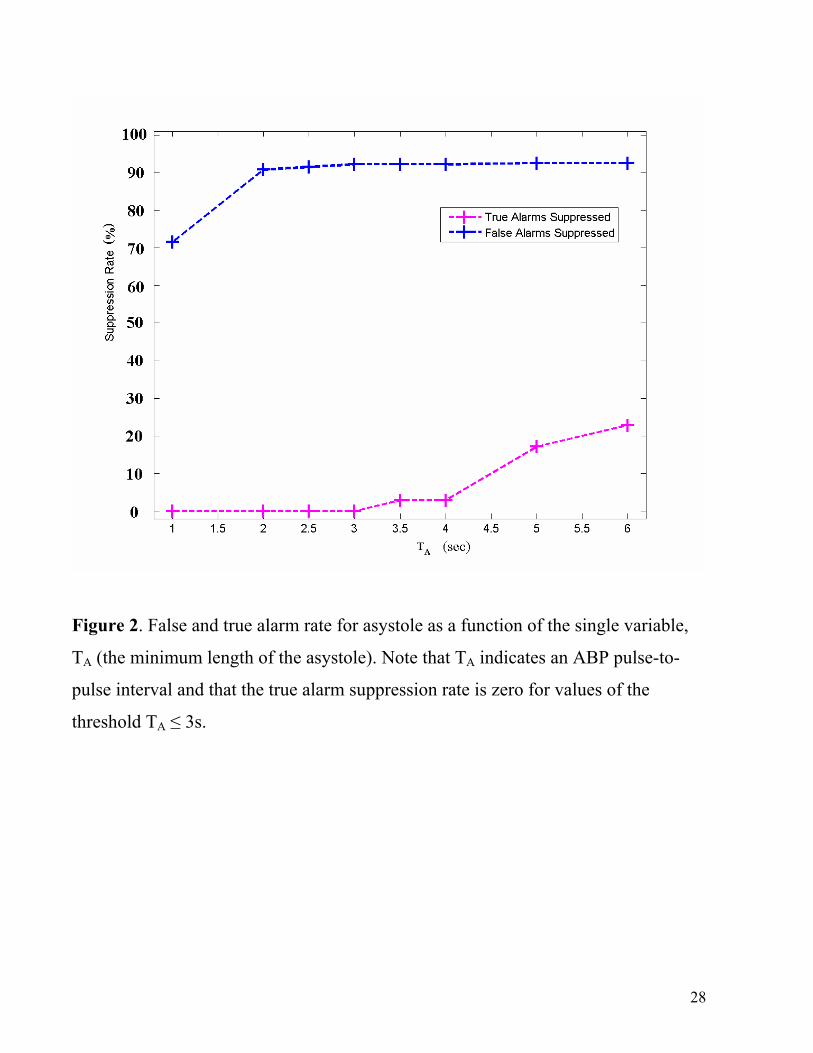
Figure 2. False and true alarm rate for asystole as a function of the single variable,
TA (the minimum length of the asystole). Note that TA indicates an ABP pulse-to-
pulse interval and that the true alarm suppression rate is zero for values of the
threshold TA ≤ 3s.
28
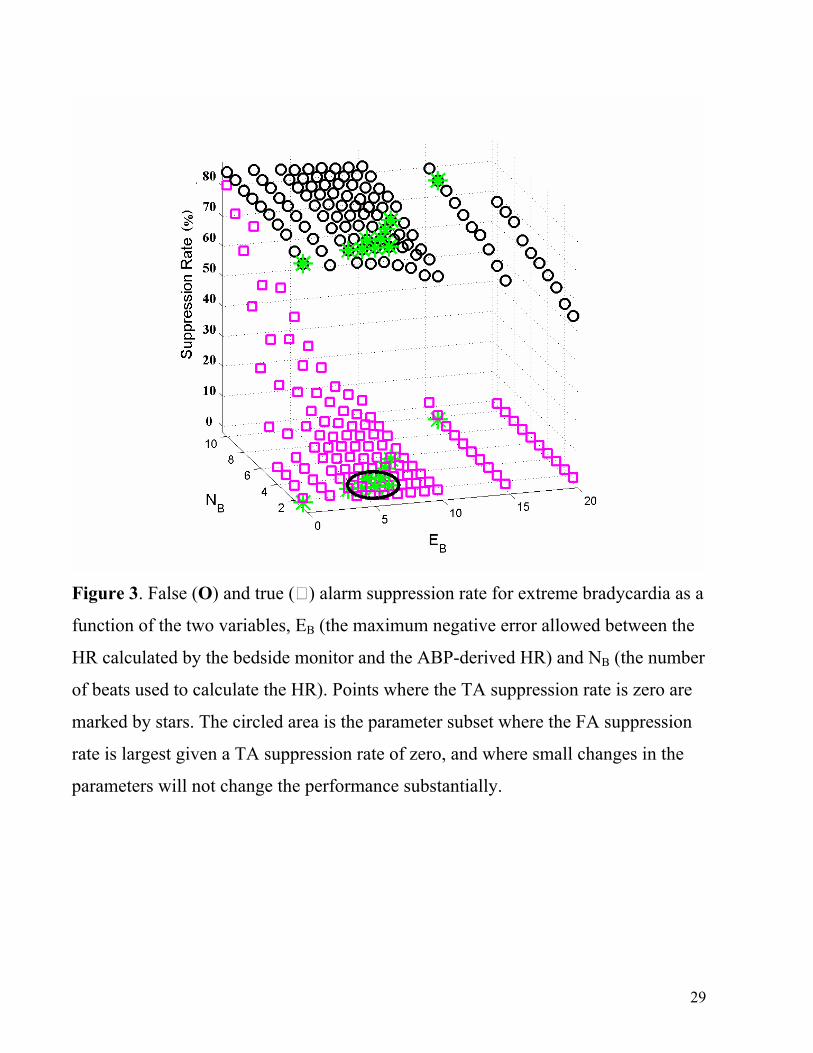
Figure 3. False (O) and true () alarm suppression rate for extreme bradycardia as a
function of the two variables, EB (the maximum negative error allowed between the
HR calculated by the bedside monitor and the ABP-derived HR) and N
B
BB (the number
of beats used to calculate the HR). Points where the TA suppression rate is zero are
marked by stars. The circled area is the parameter subset where the FA suppression
rate is largest given a TA suppression rate of zero, and where small changes in the
parameters will not change the performance substantially.
29
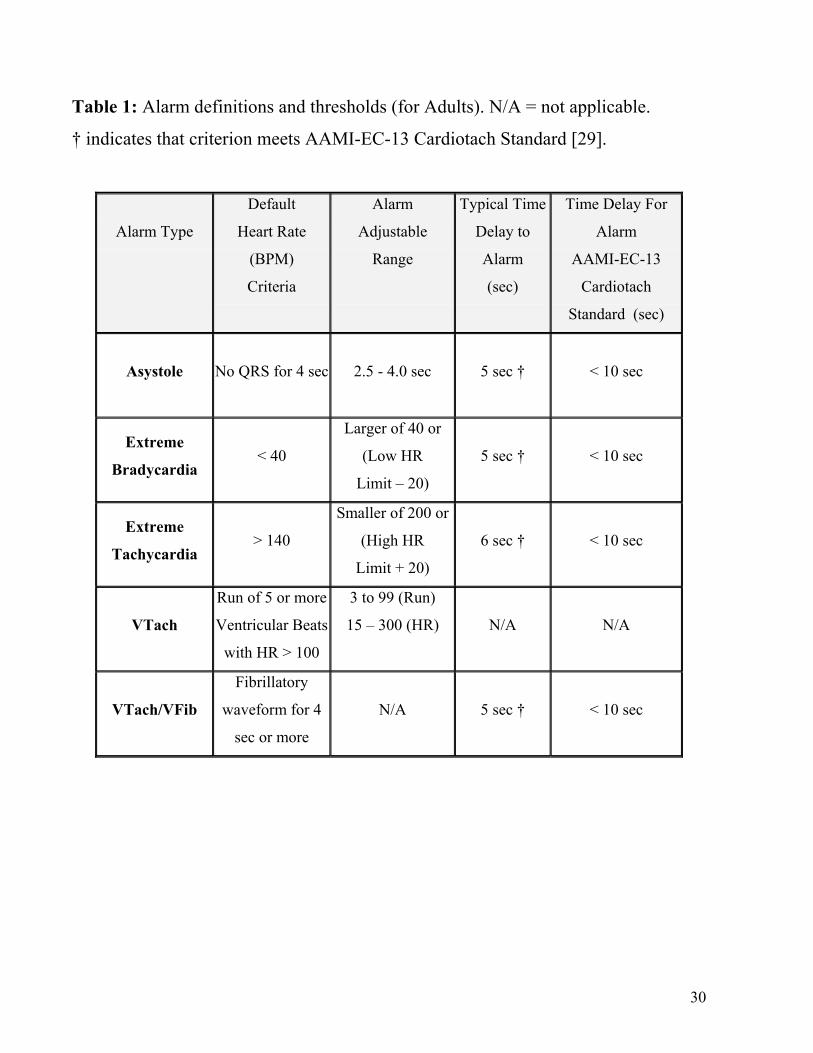
Table 1: Alarm definitions and thresholds (for Adults). N/A = not applicable.
† indicates that criterion meets AAMI-EC-13 Cardiotach Standard [29].
Alarm Type
Default
Heart Rate
(BPM)
Criteria
Alarm
Adjustable
Range
Typical Time
Delay to
Alarm
(sec)
Time Delay For
Alarm
AAMI-EC-13
Cardiotach
Standard (sec)
Asystole
No QRS for 4 sec
2.5 - 4.0 sec
5 sec †
< 10 sec
Extreme
Bradycardia
< 40
Larger of 40 or
(Low HR
Limit – 20)
5 sec †
< 10 sec
Extreme
Tachycardia
> 140
Smaller of 200 or
(High HR
Limit + 20)
6 sec †
< 10 sec
VTach
Run of 5 or more
Ventricular Beats
with HR > 100
3 to 99 (Run)
15 – 300 (HR)
N/A
N/A
VTach/VFib
Fibrillatory
waveform for 4
sec or more
N/A
5 sec †
< 10 sec
30
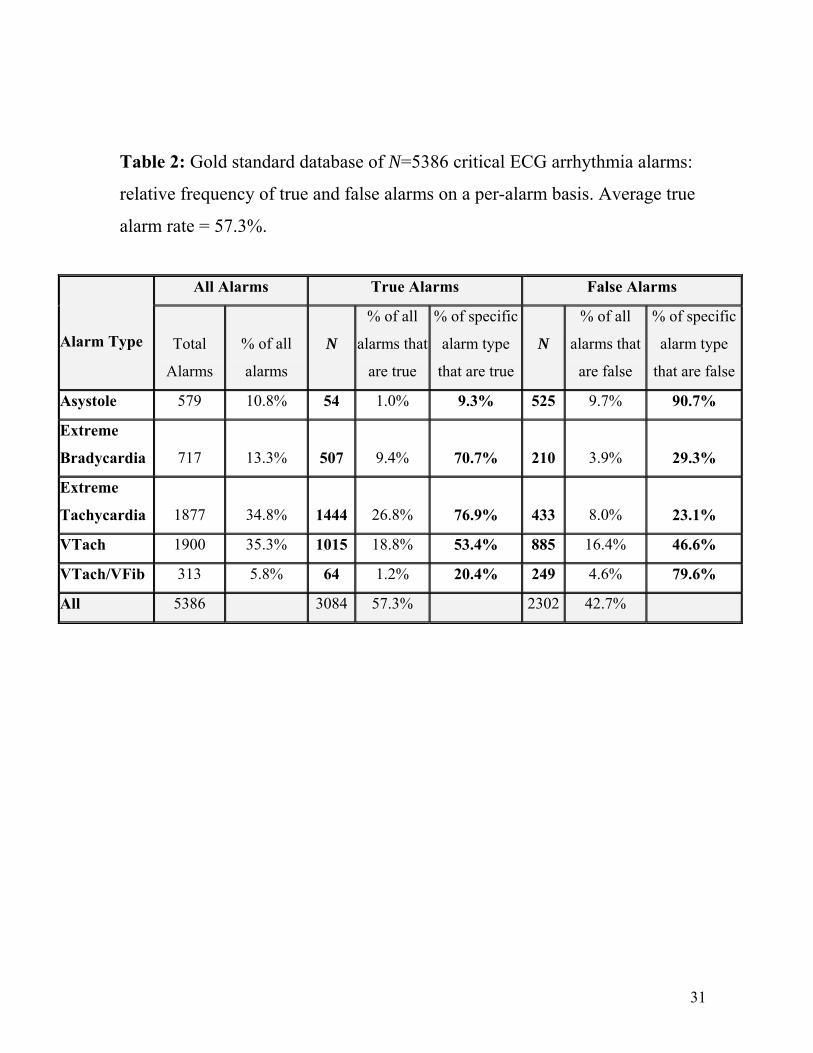
Table 2: Gold standard database of N=5386 critical ECG arrhythmia alarms:
relative frequency of true and false alarms on a per-alarm basis. Average true
alarm rate = 57.3%.
All Alarms True Alarms False Alarms
Alarm Type
Total
Alarms
% of all
alarms
N
% of all
alarms that
are true
% of specific
alarm type
that are true
N
% of all
alarms that
are false
% of specific
alarm type
that are false
Asystole 579 10.8% 54 1.0% 9.3% 525 9.7% 90.7%
Extreme
Bradycardia 717 13.3%
507 9.4%
70.7%
210 3.9%
29.3%
Extreme
Tachycardia 1877 34.8%
1444 26.8%
76.9%
433 8.0%
23.1%
VTach 1900 35.3% 1015 18.8% 53.4% 885 16.4% 46.6%
VTach/VFib 313 5.8% 64 1.2% 20.4% 249 4.6% 79.6%
All 5386 3084 57.3% 2302 42.7%
31
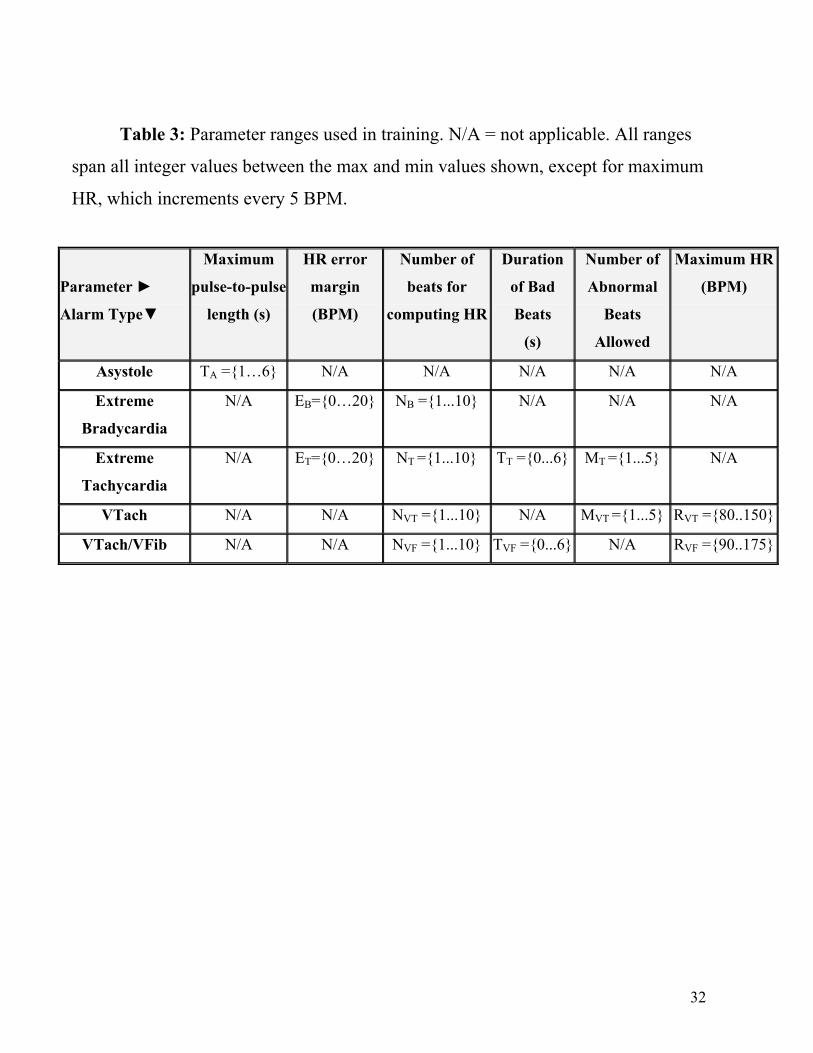
Table 3: Parameter ranges used in training. N/A = not applicable. All ranges
span all integer values between the max and min values shown, except for maximum
HR, which increments every 5 BPM.
Parameter ►
Alarm Type▼
Maximum
pulse-to-pulse
length (s)
HR error
margin
(BPM)
Number of
beats for
computing HR
Duration
of Bad
Beats
(s)
Number of
Abnormal
Beats
Allowed
Maximum HR
(BPM)
Asystole TA ={1…6} N/A N/A N/A N/A N/A
Extreme
Bradycardia
N/A EB={0…20} NB ={1...10} N/A N/A N/A
Extreme
Tachycardia
N/A ET={0…20} NT ={1...10} TT ={0...6} MT ={1...5} N/A
VTach N/A N/A NVT ={1...10} N/A MVT ={1...5} RVT ={80..150}
VTach/VFib N/A N/A NVF ={1...10} TVF ={0...6} N/A RVF ={90..175}
32
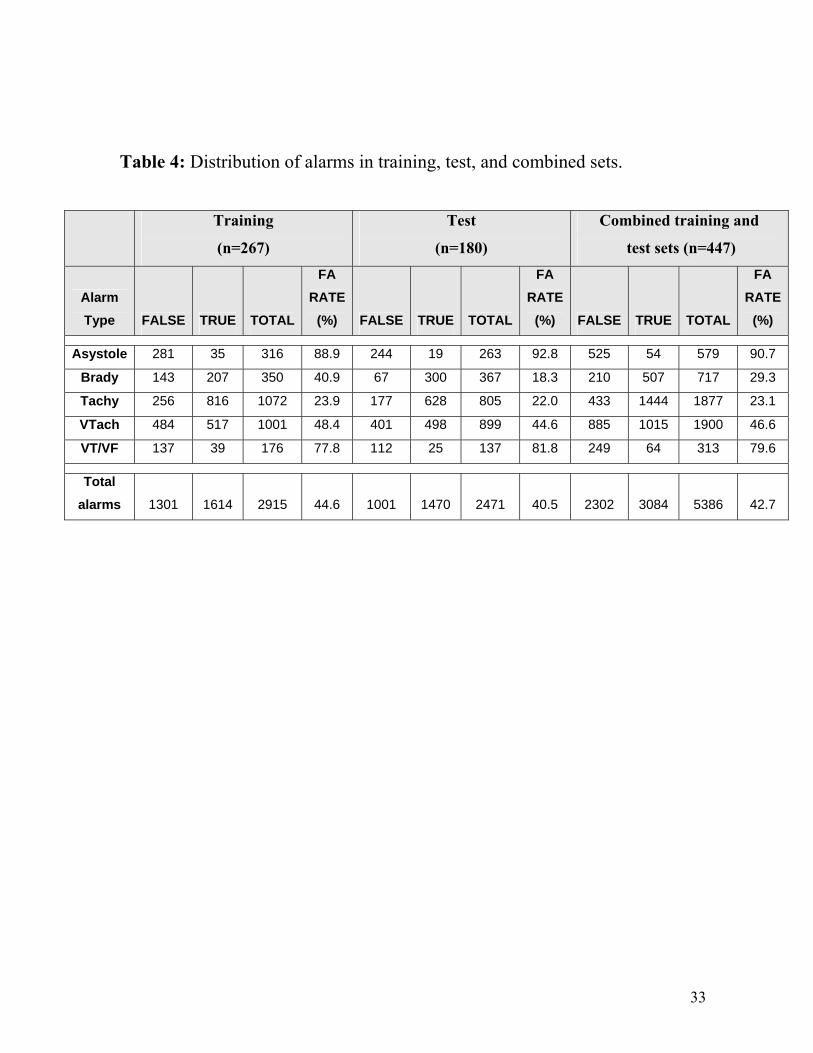
Table 4: Distribution of alarms in training, test, and combined sets.
Training
(n=267)
Test
(n=180)
Combined training and
test sets (n=447)
Alarm Type FALSE TRUE TOTAL
FA RATE
(%) FALSE TRUE TOTAL
FA RATE
(%) FALSE TRUE TOTAL
FA RATE
(%)
Asystole 281 35 316 88.9 244 19 263 92.8 525 54 579 90.7 Brady 143 207 350 40.9 67 300 367 18.3 210 507 717 29.3 Tachy 256 816 1072 23.9 177 628 805 22.0 433 1444 1877 23.1 VTach 484 517 1001 48.4 401 498 899 44.6 885 1015 1900 46.6 VT/VF 137 39 176 77.8 112 25 137 81.8 249 64 313 79.6
Total alarms 1301 1614 2915 44.6 1001 1470 2471 40.5 2302 3084 5386 42.7
33
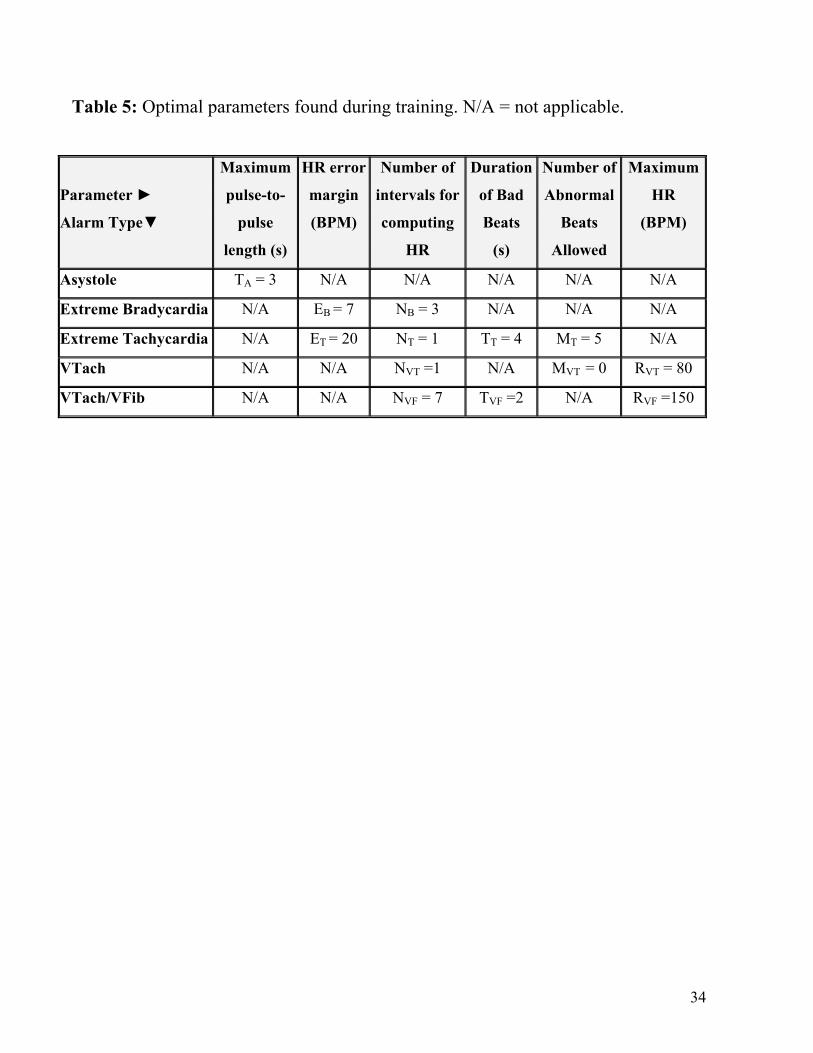
Table 5: Optimal parameters found during training. N/A = not applicable.
Parameter ►
Alarm Type▼
Maximum
pulse-to-
pulse
length (s)
HR error
margin
(BPM)
Number of
intervals for
computing
HR
Duration
of Bad
Beats
(s)
Number of
Abnormal
Beats
Allowed
Maximum
HR
(BPM)
Asystole TA = 3 N/A N/A N/A N/A N/A
Extreme Bradycardia N/A EB = 7 NB = 3 N/A N/A N/A
Extreme Tachycardia N/A ET = 20 NT = 1 TT = 4 MT = 5 N/A
VTach N/A N/A NVT =1 N/A MVT = 0 RVT = 80
VTach/VFib N/A N/A NVF = 7 TVF =2 N/A RVF =150
34
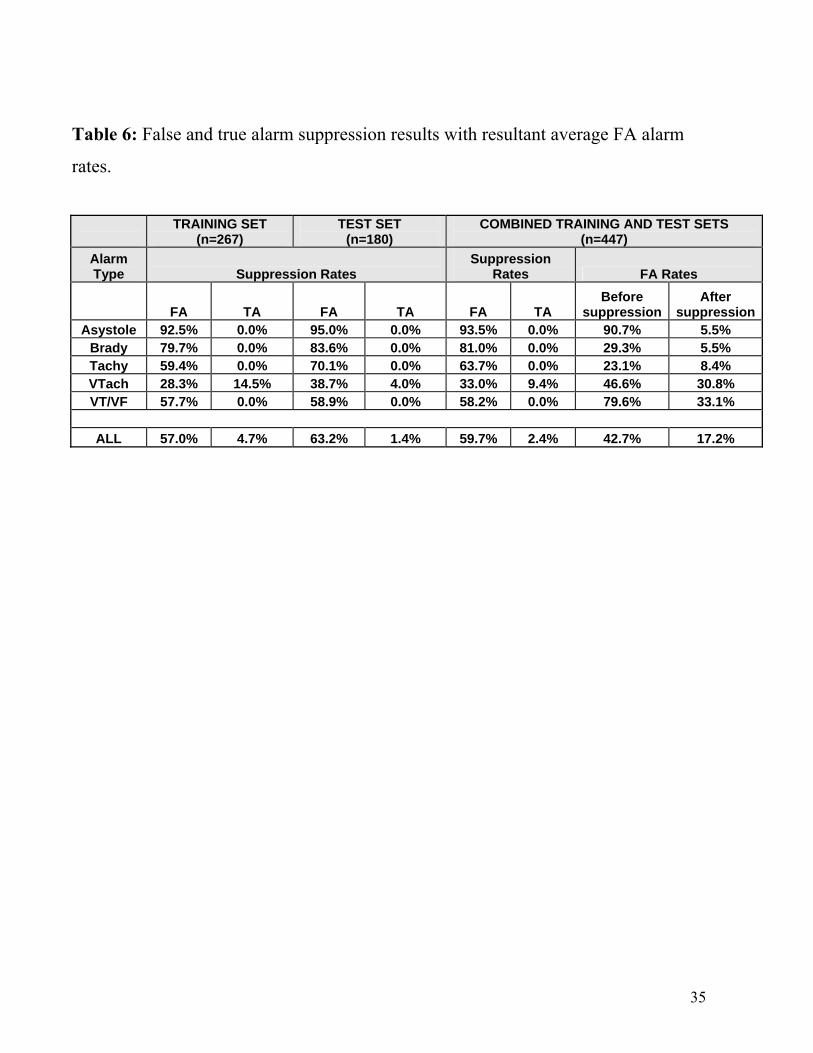
Table 6: False and true alarm suppression results with resultant average FA alarm
rates.
TRAINING SET
(n=267) TEST SET
(n=180) COMBINED TRAINING AND TEST SETS
(n=447) Alarm Type Suppression Rates
Suppression Rates FA Rates
FA TA FA TA FA TA Before
suppressionAfter
suppressionAsystole 92.5% 0.0% 95.0% 0.0% 93.5% 0.0% 90.7% 5.5%
Brady 79.7% 0.0% 83.6% 0.0% 81.0% 0.0% 29.3% 5.5% Tachy 59.4% 0.0% 70.1% 0.0% 63.7% 0.0% 23.1% 8.4% VTach 28.3% 14.5% 38.7% 4.0% 33.0% 9.4% 46.6% 30.8% VT/VF 57.7% 0.0% 58.9% 0.0% 58.2% 0.0% 79.6% 33.1%
ALL 57.0% 4.7% 63.2% 1.4% 59.7% 2.4% 42.7% 17.2%
35