Embed Size (px)
Citation preview

Reducing Data Center Loads for a Large-scale, Low-energy Office Building: NREL’s Research Support Facility
The NREL Approach • December 2011
NREL is a national laboratory of the U.S. Department of Energy, Office of Energy Efficiency and Renewable Energy, operated by the Alliance for Sustainable Energy, LLC.

2
National Renewable Energy Laboratory
Reducing Data Center Loads for a Large-Scale, Low-Energy Office Building: NREL’s
Research Support Facility
Michael Sheppy, Chad Lobato, Otto Van Geet, Shanti Pless, Kevin Donovan, Chuck Powers
National Renewable Energy Laboratory
Golden, Colorado
December 2011
NREL/BK-7A40-52785 • December 2011

3
National Renewable Energy Laboratory
Executive Summary Background
In June 2010, the National Renewable Energy Laboratory (NREL) completed construction on the new 220,000-square foot (ft2) Research Support Facility (RSF) which included a 1,900-ft2 data center (the RSF will expand to 360,000 ft2 with the opening of an additional wing December, 2011). The project’s request for proposals (RFP) set a whole-building demand-side energy use requirement of a nominal 35 kBtu/ft2 per year. On-site renewable energy generation offsets the annual energy consumption. The original “legacy” data center had annual energy consumption as high as 2,394,000 kilowatt-hours (kWh), which would have exceeded the total building energy goal. As part of meeting the building energy goal, the RSF data center annual energy use had to be approximately 50% less than the legacy data center’s annual energy use. This report documents the methodology used to procure, construct, and operate an energy-efficient data center suitable for a net-zero-energy-use building.
Development Process
The legacy data center on NREL’s campus used a number of individual servers, with a utilization of less than 5%. When the total data center power draw was divided among all users, the continuous power consumption rate per person was 151 watts (W). The uninterruptible power supply (UPS) and room power distribution units were 80% efficient. Chilled water was created using one multi-stage air-cooled chiller unit and a backup single-stage air conditioning (AC) chiller unit, delivering chilled water to seven computer room air handlers (CRAHs). This cool air was delivered through an underfloor plenum, which was also a passageway for most cables, conduits, and chilled
water pipes. This increased the fan energy required to move air between the CRAHs and the servers. Open hot and cold aisles added to the inefficiency of the existing data center by allowing the chilled supply air to mix with hot return air. Additionally, two walls of the data center were floor-to-ceiling exterior windows with southwestern exposure that introduced solar heat gain to the space and required additional cooling.
Evaluation Approach and Results
The RSF data center was designed using blade servers running virtualized servers. When the total data center power draw is divided among all users, the continuous power consumption rate per person is 45 W. The UPS and room power distribution is 95% efficient. Evaporative cooling and air-side economizing is designed to cool the air to 74oF.
Cool air is supplied to the servers through dedicated underfloor and overhead plenums. Cooling efficiency is enhanced by having a contained hot aisle. This also allows waste heat from the hot aisles to be recovered and used elsewhere in the building when needed, which reduces heating loads. The new data center is mostly below grade and has no windows, helping to insulate the room from ambient outdoor conditions.
Results
At 958,000 kWh, the RSF annual data center energy use is approximately 60% less than the legacy data center annual energy use; this results in a measured power utilization effectiveness (PUE) of 1.16. The NREL legacy data center had a PUE of approximately 2.28. The power per person was reduced from a peak of 151 W/person in the legacy data center to 45 W/person in the RSF. Additionally, hot aisle containment allows waste heat from
Reducing Data Center Loads for a Large-Scale, Low-Energy Office Building: NREL’s Research Support Facility

4
National Renewable Energy Laboratory
the RSF data center to be recovered and used to heat other areas of the building. This has resulted in an energy reuse effectiveness (ERE) of 0.91 .
Several implementation challenges were overcome successfully during the RSF data center’s design, construction, and first 11 months of operation. In one example, “hot spots” in server racks required air to be
supplied at lower temperatures than what the designers had estimated. This caused the cooling loads to be higher than anticipated. NREL is currently improving the overhead air delivery system to provide more air to the “hot spots” and to allow higher-supply air temperatures. Despite these challenges, the RSF data center was still able to achieve a world-class PUE and a low ERE.

5
National Renewable Energy Laboratory
List of Acronyms
AC Air conditioningAHU Air handling unitASHRAE American Society of Heating, Refrigerating and Air-Conditioning EngineersBUG Backup generatorCAF Conductive anodic filamentCRAH Computer room air handlerDOE U.S. Department of EnergyDX Direct expansionEA Exhaust airEPA Environmental Protection AgencyEPEAT Electronic Product Environmental Assessment ToolERE Energy reuse effectivenessESD Electrostatic dischargeESIF Energy Systems Integration FacilityEUI energy use intensityFEMP Federal Energy Management ProgramFLOPS Floating point operations per secondHVAC Heating, ventilation, and air conditioningIT Information technologyLCD Liquid crystal displayLED Light emitting diodeLEED Leadership in Energy and Environmental DesignNREL National Renewable Energy LaboratoryNZE Net zero energyOA Outdoor airPDU Power distribution unitPUE Power utilization effectivenessPV PhotovoltaicsRFP Request for proposalsRH Relative humidityRSF Research Support FacilitySA Supply airTCO Total cost of ownershipUPS Uninterruptible power supply
VoIP Voice over Internet Protocol

6
National Renewable Energy Laboratory
Table of Contents
1.0 Introduction 7
2.0 Legacy Data Centers – NREL’s Legacy Example 7
3.0 How to Gain Buy-in on Energy Efficiency Improvements from Data Center Designers, Operators and Owners 7
3.1 Gaining Buy-in from Data Center Managers and Operators 8
3.1.1 Reduce Energy Footprint to Increase Uptime 8
3.1.2 Comply with Building Codes: Allow for Higher Temperature and Relative Humidity Set Points 8
3.1.3 Stay Competitive in a Changing Industry; Provide the Opportunity for Career Development 9
3.1.4 Reduce Upfront Capital Costs 9
3.1.5 Eliminate Old Problematic Equipment; Gain the Benefits of New Technologies 9
3.1.6 Comply with Company and Federal Policies 10
3.1.7 Comply with Contractual Energy Goals 10
3.2 Gaining Buy-In from the Design Team 10
3.2.1 Meet Contractually Required Building Performance Specifications 10
3.3 Lessons Learned about Gaining Buy-In from Operators and Designers 10
4.0 Reducing Data Center Loads: NREL RSF Example 11
4.1 Data Center and Server Room Strategies 10
4.1.2 Lighting 13
4.1.3 Heating, Ventilation, and Air Conditioning (HVAC) System Design Intent: NREL RSF Data Center 13
4.1.4 HVAC System Successes and Challenges: NREL RSF Data Center 14
4.1.5 Miscellaneous Data Center Strategies 18
4.1.6 Track Data Center Performance through Power Metering 18
5.0 Results 24
5.1 RSF Data Center Performance 24
5.1.1 RSF Power Utilization Effectiveness 24
5.1.2 RSF Energy Reuse Effectiveness 25
5.2 The RSF Data Center versus the Legacy Data Center 26
6.0 Conclusion 28
7.0 References 29
7
National Renewable Energy Laboratory
List of Figures Figure 2 1. NREL’s legacy data center 2
Figure 4 1. Diagram of the equipment and operations of the NREL legacy data center versus the NREL RSF data center 7
Figure 4 2. Diagram of server virtualization in the RSF 8
Figure 4 3. Designed HVAC regimes for an entire year plotted on a psychometric chart 9
Figure 4 4. Chilled water coil in the RSF data center supply air stream 11
Figure 4 5. Model of the hot aisle/cold aisle layout in the NREL legacy data center 12
Figure 4 6. View of the RSF data center in the cold aisle (left) and from inside of the contained hot aisle (right) 13
Figure 4 7. Diagram comparing the air management strategies of NREL’s legacy data center (left) to NREL’s RSF data center (right). Side view of the server racks. 13
Figure 4 8. Comparison of the cable management strategies of the NREL legacy data center (left) to the NREL RSF data center (right). Rear view of the server racks. 14
Figure 4 9. Server cowlings force air to flow through, rather than around servers. Top: server with cowling installed. Bottom: server without cowling installed. 15
Figure 4 10. Diagram of the power meters in the RSF data that allow PUE calculation 17
Figure 4 11. Data center energy balance diagram for calculating energy reuse 19
Figure 5 1. Monthly energy use for the RSF data center over the first 11 months of operations 22
Figure 5 2. Load profile for the RSF data center over the first 11 months of operations 23
Figure 5 3. Hourly PUE performance over the first 11 months 24
Figure 5 4. Monthly average PUE for the RSF data center 25
Figure 5 5. ERE as a function of outdoor air temperature for the RSF data center 26
Figure 5 6. Annual energy and cost comparison between the legacy and RSF data centers 27
Figure 5 7. Load breakdown for the legacy and RSF data center 28
Figure 5 8. Power per person breakdown for the legacy and RSF data center 29
Figure 5 9. of NREL’s legacy and RSF data center PUE numbers 29

8
National Renewable Energy Laboratory
Acknowledgments This document was prepared by the National Renewable Energy Laboratory (NREL) for the Federal Energy Management Program (FEMP) under Agreement 17990, Task FE11.6310 in the High Energy Buildings task. The authors would like to thank the NREL Information Services (IS) department for its dedicated support of this project. Thanks to Josh Korosec for helping test out heating, ventilation, and air conditioning (HVAC) control strategies in the data center and improve its performance.
We would like to thank all of the peer reviewers for their time and constructive feedback, including NREL colleagues Ian Metzger and Caleb Rockenbaugh. Special thanks to Marjorie Schott, Josh Bauer, Alex Swindler, and Joelynn Schroeder who provided figures and graphic design for this report. We would also like to thank Molly Riddell of NREL who proofread and edited this document.

9
National Renewable Energy Laboratory
1.0 Introduction
Data centers are energy-intensive spaces that facilitate the transmission, receipt, processing, and storage of digital data. These spaces require redundancies in power and storage, as well as infrastructure, to cool computing equipment and manage the resulting waste heat (Tschudi, Xu, Sartor, and Stein, 2003). Data center spaces can consume more than 100 times the energy of standard office spaces (VanGeet 2011). The U.S. Environmental Protection Agency (EPA) reported that data centers used 61 billion kilowatt-hours (kWh) in 2006, which was 1.5% of the total electricity consumption in the U.S. (U.S. EPA, 2007). Worldwide, data centers now consume more energy annually than Sweden (New York Times, 2009). Given their high energy consumption and conventional operation practices, there is a potential for huge energy savings in data centers.
The National Renewable Energy Laboratory (NREL) is world renowned for its commitment to green building construction. In June 2010, the laboratory finished construction of a 220,000-square-foot (ft2), LEED Platinum, Research Support Facility (RSF), which included a 1,900-ft2 data center. The RSF will expand to 360,000 ft2 with the opening of an additional wing December, 2011. The project’s request for proposals (RFP) set a whole-building demand-side energy use requirement of a nominal 35 kBtu/ft2 per year. On-site renewable energy generation will offset the annual energy consumption. To support the RSF’s energy goals, NREL’s new data center was designed to minimize its energy footprint without compromising service quality.
Several implementation challenges emerged during the design, construction, and first 11 months of operation of the RSF data center. This document highlights these challenges and describes in detail how NREL successfully overcame them. The IT settings and strategies outlined in this document have been used to significantly reduce data center energy requirements in the RSF; however, these can also be used in existing buildings and retrofits.
2.0 Legacy Data Centers – NREL’s Legacy Example
NREL’s original data center used a number of individual servers with a utilization of less than 5%. When the total data center power draw was divided among all users, the continuous power consumption rate per person reached a peak of 151 watts (W). Chilled water was created using one multi-stage air-cooled chiller unit and a backup single-stage air conditioning (AC) chiller unit, which delivered chilled water to seven computer room air handlers (CRAHs). This cool air was delivered through an underfloor plenum which was also a passageway for most cables, conduits and chilled water pipes. The cluttered underfloor plenum increased the fan energy required to move air between the CRAHs and the servers. Adding to the inefficiency of the legacy data center were the open hot and cold aisles, which allowed mixing of cool supply air and hot return air. As a result, air had to be supplied at a much lower temperature, wasting energy. Additionally, two walls of the data center were floor-to-ceiling exterior windows with southwestern exposure that introduced solar heat gain to the space and required additional cooling.
The legacy data center’s peak total load was 273 kW. It operated with an average power utilization effectiveness (PUE) of 2.28, which is consistent with typical data centers. The UPS and room power distribution units (PDUs) were 80% efficient; this created additional heat that needed to be cooled.

10
National Renewable Energy Laboratory
3.0 How to Gain Buy-in on Energy Efficiency Improvements from Data Center Designers, Operators and Owners
All parties involved in the design and operation of a data center need to be invested in meeting its energy goals. This helps ensure that these goals are considered, and hopefully met, at all key decision-making points.
During the planning and design phase of the RSF, NREL set a stretch goal to achieve annual net-zero energy use with on-site renewables. To support the RSF’s energy goals, the data center was designed to minimize its energy footprint without compromising service quality. However, data center operators and designers initially expressed some concerns about minimizing risks to operations.
3.1 Gaining Buy-in from Data Center Managers and Operators
The following sections highlight the strategies that were used in the RSF to successfully gain buy-in from data center managers and operators.
3.1.1 Reduce Energy Footprint to Increase Uptime
A major concern of data center operators is uptime; which is the amount of uninterrupted operation. Data centers are designed with UPS, backup generators (BUG), and a spectrum of sensors to ensure that servers operate for as long as possible during a power failure without being shut down.
The load of the RSF data center is so low that it can be run entirely off the backup generator. As a result, the data center has a significantly higher uptime. This feature, above all others, gained strong buy-in from the data center operators. In the 11 months of operation to date, the entire data center, has successfully run off the backup generator several times during power outages.
3.1.2 Comply with Building Codes: Allow for Higher Temperature and Relative Humidity Set Points
Data center operators pay very close attention to the supply air (SA) temperature and relative humidity (RH). Often, the set point for SA temperature and RH is set lower than needed. Increasing SA temperature has its benefits and drawbacks. Higher SA temperatures allow for more hours of economizer use per year (for economizer systems) and higher chilled water temperature set points (for non-economizer systems) (ASHRAE, 2008); both result in significant energy savings. However, excessively high SA temperatures can cause equipment to overheat and shut down, reducing uptime. For example, one manufacturer recommends SA temperatures between 50oF and 95oF (HP, 2011).
A number of data centers currently operate without any active humidity control and still maintain a high level of reliability (Hydeman and Swenson, 2010). For those data centers that wish to use active humidity control, increasing the RH setpoint also has its benefits and drawbacks. A higher RH setpoint potentially reduces the need for dehumidification, offering significant energy savings. However, an excessively high RH setpoint can cause a number of problems: conductive anodic filament (CAF) growth; head fly-ability and corrosion in disk drives; and
Figure 2 1. NREL’s legacy data center Photo by Patrick Corkery, NREL/PIX 15885

11
National Renewable Energy Laboratory
head wear and head corrosion in tape drives. Conversely, low RH increases the risk of electrostatic discharge (ESD) (ASHRAE, 2008).
To realize energy savings, the SA temperature and RH should be increased as high as data center equipment can handle without compromising service quality and reliability. In 2008, ASHRAE released environmental guidelines for data communications (datacom) equipment which expanded the recommended environmental envelope (ASHRAE, 2008). In this guide, the recommended maximum SA temperature is 80.6oF (previously 77oF in 2004 guidelines), the recommended maximum SA moisture is 60% RH, and the recommended dew point is 59oF (previously 55% RH in 2004 guidelines).
With official ASHRAE guidelines, we were able to convince the data center operators to attempt to run the RSF data center at a higher temperature and with greater humidity. This will yield significant reductions in cooling and dehumidification loads for the data center, especially during the summer.
3.1.3 Stay Competitive in a Changing Industry; Provide the Opportunity for Career Development
Designing a world-class low-energy data center was an opportunity for the data center manager(s) to become experts in this area. The NREL legacy data center operators were an integral part of the design and operations planning. As a result, the operators acquired valuable knowledge and skills that made them more valuable in supporting the implementation of the design and in monitoring and improving operations.
Additionally, these operators are now sought after industry experts and industry mentors for designing low energy data centers. People want to learn from the operators how they can save energy in their own facilities. The data center operators find that this has added some prestige to their jobs, along with professional development opportunities.
3.1.4 Reduce Upfront Capital Costs
Because the RSF has net-zero energy goals, every watt of
demand must be offset with a renewable energy source. Based on the project’s location and economics, every one watt of demand in the RSF requires 6.7 watts ($33 worth) of photovoltaics (PV) on site to offset the energy use on an annual basis. Therefore, data center operators were given a mission to meet NREL’s computing needs as efficiently as possible to save on capital costs for PV and meet the energy goals of the RSF. The energy consumption of the data center was reduced by roughly 60%, which met these goals.
Having an energy-efficient data center can also save on capital costs in other ways. If your data center is located in a climate that can provide free cooling for a significant amount of the year, you would save considerably on chiller costs. The planned data center in NREL’s Energy Systems Integration Facility (ESIF) building is an example. It will use no mechanical cooling. Instead, the computing equipment will be liquid-cooled and the heat will be rejected using a cooling tower.
3.1.5 Eliminate Old Problematic Equipment; Gain the Benefits of New Technologies
NREL’s legacy data center operators were given the opportunity to procure new equipment for the RSF data center. This allowed them to address the inefficiency problems they had with the legacy data center equipment. For example, the UPS that was selected for the RSF is 95% efficient (compared to 80%). The RSF UPS was initially configured to provide 125 kW of backup power. NREL data center operators are able to service the UPS system without turning to vendor assistance or having to power down the whole system. The UPS is also expandable in 25 kW increments to accommodate future growth in NREL’s computing needs.
Operators also procured and implemented more efficient equipment and technologies—such as blade servers and virtual server environments—that allowed for electricity use reductions and increased utilization. There is a strong business case for cost expenditures for energy-efficient data center equipment and operations—the total lifetime power costs for data center equipment will exceed the

12
National Renewable Energy Laboratory
cost of the original capital investment (Metzger et al. 2011). With new equipment and technologies, RSF data center operators are able to provide a greater level of service while using a fraction of the energy.
3.1.6 Comply with Company and Federal Policies
NREL has a campus-wide sustainability mission in which the director, executive management, senior management, and workers must reduce energy use in building designs and operations (within available funds) (NREL, 2011). This mission gave data center managers and operators an extra incentive to investigate and pursue energy efficiency opportunities in the RSF.
In addition to complying with the campus-wide sustainability mission, NREL must comply with Federal goals and requirements. At the forefront of Federal regulations is Executive Order 13514 —“Federal Leadership in Environmental, Energy, and Economic Performance.” Federal agencies are required to save $3 billion overall by procuring Electronic Product Environmental Assessment Tool (EPEAT®), ENERGY STAR®, and Federal Energy Management Program (FEMP)-designated electronic products; establishing and implementing energy-efficient policies and practices; consolidating facilities; and implementing best practices for energy management of servers (Obama, 2009). There are several programs in place to help Federal agencies with data center energy efficiency, including Save Energy Now in Data Centers, Data Center Efficiency for Federal Agencies, and ENERGY STAR.
3.1.7 Comply with Contractual Energy Goals
The project’s RFP set a whole-building demand-side energy use requirement of a nominal 35 kBtu/ft2 per year. The legacy data center had annual energy consumption as high as 2,394,000 kWh, which would have exceeded the total building energy goal. As part of meeting the building energy goal, the RSF data center’s annual energy use had to be approximately 50% less than the legacy data center’s annual energy use.
When procuring new data center equipment and infrastructure, operators had to comply with the contractual energy requirements for the RSF.
3.2 Gaining Buy-In from the Design Team
The sections below highlight the strategies that were used to successfully gain buy-in from the design team.
3.2.1 Meet Contractually Required Building Performance Specifications
Data center operators are not the only parties involved in creating new data centers. The design team plays an equally important role in specifying the mechanical systems and infrastructure that support the facility. For the RSF project, the design team was given the contractual whole-building demand-side energy use requirement of 35 kBtu/ft2 per year. The contractual energy use requirement for the RSF was open-ended; the contract did not specify how the design team would reduce energy in the building. This allowed them to develop a creative solution to meet the contractual requirements.
As a result, the design team took advantage of air-side economizing and evaporative cooling to meet the majority of the cooling load. The design team further reduced the whole building energy use by reusing the waste heat exhausted from the data center to offset heating loads in other parts of the building.
3.3 Lessons Learned about Gaining Buy-In from Operators and Designers
Although NREL successfully gained buy-in from operators and designers, it would be advantageous in future projects to put data center performance metrics into the contract. PUE, energy recovery effectiveness (ERE), energy use intensity (EUI), and watts per user are all useful metrics to classify the energy efficiency of a data center (these metrics are defined and discussed later in this report). It is also recommended that the performance capabilities of the data center (i.e., floating point operations per second (FLOPS) and storage capacity) be monitored continually over time. The ratio of data center performance to energy usage can provide a more accurate picture of energy efficiency.
Each metric, including the watts per user metric, has its drawbacks. Data centers are typically capable of providing service to many more users than they actually support. As an example, if the number of users for a given data
13
National Renewable Energy Laboratory
center increases by 25% and the total load does not increase by a noticeable amount, then more computing service is being provided than needed. In this case, the watts per user metric would decrease, but energy is still being wasted by overprovisioning computing service. Computing services should be tailored to the needs of users and should allow for a reasonable amount of growth over time.
4.0 Reducing Data Center Loads: NREL RSF Example
There are many strategies available to reduce data center loads, ranging from decommissioning obsolete equipment to air-side economizing and evaporative cooling. The following sections summarize the strategies that have been implemented in NREL’s RSF data center to meet the whole-building demand-side energy use goal of 35 kBtu/ft2 per year.
Several implementation challenges emerged while trying to reduce loads in the RSF data center. This section highlights these challenges and describes in detail how NREL overcame them.
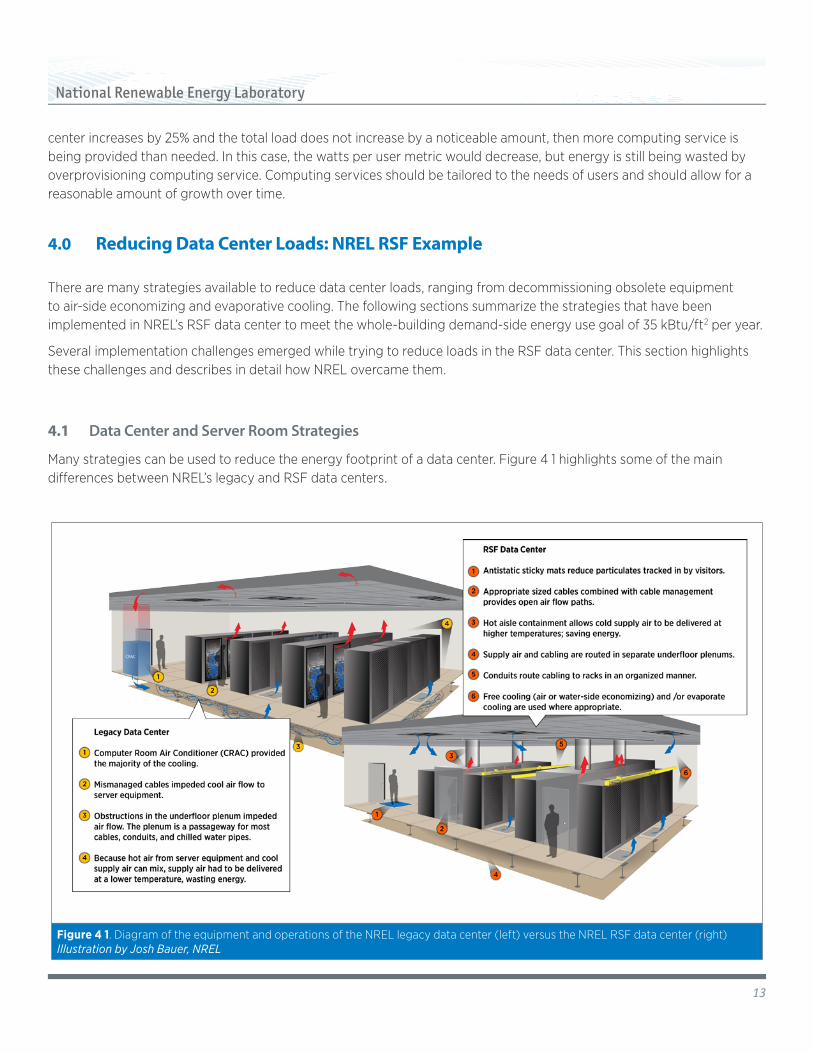
4.1 Data Center and Server Room Strategies
Many strategies can be used to reduce the energy footprint of a data center. Figure 4 1 highlights some of the main differences between NREL’s legacy and RSF data centers.
Figure 4 1. Diagram of the equipment and operations of the NREL legacy data center (left) versus the NREL RSF data center (right) Illustration by Josh Bauer, NREL

14
National Renewable Energy Laboratory
4.1.1 IT Equipment Strategies
NREL implemented several equipment strategies to reduce data center loads.
4.1.1.1 Decommission obsolete equipment to save energy and increase performance
In any data center, equipment will eventually become obsolete and will need to be replaced. This offers data center operators an opportunity to procure more energy-efficient equipment that can also provide a higher level of service. The ENERGY STAR and EPEAT databases are excellent resources for finding energy-efficient enterprise servers. When purchasing new IT equipment, enough should be provided to meet the current service needs, allowing for growth. End-user serviceable equipment can save on repair service calls and increase uptime. Also, when procuring new equipment, make sure to perform long-term capacity planning for power and service needs.
In the transition from the legacy to the RSF data center, obsolete equipment was replaced wherever possible. Previously, 1-unit (U) servers (with dual 700-W power supplies, 9 cooling fans, and typically less than 5% utilization) and 4U servers (with up to four 800- to 1200-W power supplies, 6 cooling fans, and typically less than 5% utilization) were used. The new data center uses a 10U blade server chassis with up to six 700-W power supplies, up to ten cooling fans, up to 16 servers in a chassis, and an average of 20 virtualized servers per individual blade server (Figure 4 2). The servers in the RSF use variable-speed fans and energy-efficient power supplies.
4.1.1.2 Virtualize servers where possible
Server virtualization allows the RSF to run a workload that used to require approximately 20 servers on just one server. In NREL’s transition from the legacy to RSF data center, the energy footprint was reduced by more than 96% for each server through virtualization. Figure 4 2 is a diagram of how server energy has been reduced in the RSF through virtualization.
Figure 4 2. Diagram of server virtualization in the RSF Photo by Alex Swindler, NREL
4.1.1.3 Implement an ultra-efficient uninterruptible power supply
UPSs provide power to data center and server room equipment during power outages until the BUG turns on. They also condition incoming power to protect the connected loads from surges and spikes. The UPS in the legacy data center was 80% efficient; the UPS in the RSF data center is 95% efficient. In addition to reducing the IT equipment load, this significantly reduces the required cooling load for the entire data center.
4.1.1.4 Implement an ultra-efficient power distribution infrastructure
PDUs distribute power to equipment racks in a data center or server closet. The PDUs in the RSF were designed to handle higher UPS voltages, which reduces losses. The power distribution order is as follows: UPS = 480 volts (V); PDU = 208 V; rack PDU = 208 V. The PDUs are located as centrally as possible so that shorter conductors can be used, which reduces energy losses from resistive (ohmic) heating. The PDUs are loaded so that they operate at their peak efficiency. In addition, the power factor for the PDUs is 0.97.

15
National Renewable Energy Laboratory
4.1.2 Lighting
4.1.2.4.1 Implement manual on, occupancy off lighting controls
The legacy data center used fluorescent lamps which were controlled by manual switches. Occasionally, the lights were left on continuously.
In the RSF, data center lighting is provided by 21 fluorescent fixtures and the adjacent office lighting is provided by eight fluorescent fixtures (each fixture using 43 W). A lighting audit revealed that over the course of 900 hours, data center lights were on 6.9% of the time and the adjacent office lights were on 11.8% of the time. The continuous average lighting load for the PUE calculation is 103 W.
To reduce lighting loads in the RSF data center, lights are turned off when unoccupied. Additionally, vacancy sensor light switches were installed if staff forget to manually turn off the switches. Signage and policies encourage data center staff to turn off lights when they leave.
4.1.3 Heating, Ventilation, and Air Conditioning (HVAC) System Design Intent: NREL RSF Data Center
Direct-expansion (DX) cooling is traditionally used in many data centers and typically accounts for approximately 50% of the total energy usage (Metzger et al. 2010). The cooling system for the RSF data center was designed to minimize the use of traditional cooling and significantly reduce total data center energy consumption.
0.000
0.002
0.004
0.006
0.008
0.010
0.012
0.014
0.016
0.018
0.020
0.022
0.024
0.026
0.028
0.030
0.032
0.034
0.036
30 40 50 60 70 80 90 100 110 120
Hum
idity
Rat
io (l
b W
ater
/lb D
ry A
ir)
Dry-Bulb Temperature (ºF)
RSF Data Center HVAC Regimes
60ºF
50ºF
40ºF
Rel
ativ
e H
umid
ity
80% 60% 40% 20%
100%
Rel
ativ
e H
umid
ity
80% 60% 40% 20%
100%
Chilled Water Cooling Economizing Evapora5ve Cooling Mixing Mixing and Humidifica5on Hourly Air Condi5on
Figure 4 3. Designed HVAC regimes for an entire year plotted on a psychometric chart Illustration by Chad Lobato and Ian Metzger, NREL
NREL is located in Golden, Colorado, which has a climate that allows the RSF data center to utilize “free cooling.” The cooling system was designed to use air-side economizing and direct evaporative cooling methods to handle the majority of the cooling load. It was designed to provide supply air ranging from 66°F to 77°F to the data center with a relative humidity of up to 60%.
Metzger et al. have created a geographical map that helps determine whether your data center’s climate zone is appropriate for free or evaporative cooling (Metzger et al. 2011). Free cooling can be achieved through air-side or water-side economizing, or both.
Figure 4 3 shows the design intention for the HVAC regimes in the RSF data center. Each hour of the year is plotted as a function of temperature and humidity; different HVAC regimes are indicated by colored regions on the psychometric chart.
Air-side economizing was designed to be used for 559 hours per year when the outdoor air can satisfy the supply air criteria with no additional conditioning. Evaporative cooling was designed to be used for 984 hours per year when adiabatic humidification and cooling (70% effectiveness) of outside air can meet the supply air criteria. Mixing of outdoor air with hot aisle air was designed to be used for 1063 hours per year. Mixing and humidification was designed to be used for 6110 hours per year when the outside air is cool and dry. In this regime, outdoor air is mixed with hot aisle air then adiabatically humidified to the supply air criteria.
Chilled water cooling was designed to be used for 44 hours per year when evaporative cooling alone cannot meet the cooling demands of the data center, or when the outdoor air is more humid than the acceptable supply air criteria.
16
National Renewable Energy Laboratory
4.1.4 HVAC System Successes and Challenges: NREL RSF Data Center
During the first 11 months of operation, several unexpected challenges came up that required NREL to troubleshoot and tune the HVAC system in the RSF data center. After resolving these challenges, the RSF was still able to achieve world-class performance with an average PUE of 1.16 and a power per person ratio of 45 W.
4.1.4.1 Hot Spots
The biggest challenge that arose in the first 11 months of operation was the issue of “hot spots” and cold air delivery to racks. In the RSF, servers and other equipment were installed in groups based on their main functions. By having equipment with similar functions located right next to each other, NREL was able to use shorter and fewer cables between equipment. However, this strategy grouped together several pieces of equipment that typically run hot, creating “hot spots.” What made matters worse was that the majority of cold air was being supplied through overhead four-directional diffusers. These diffusers were dumping air directly onto the tops of the racks, rather than onto their faces, which did not alleviate the hot spots.
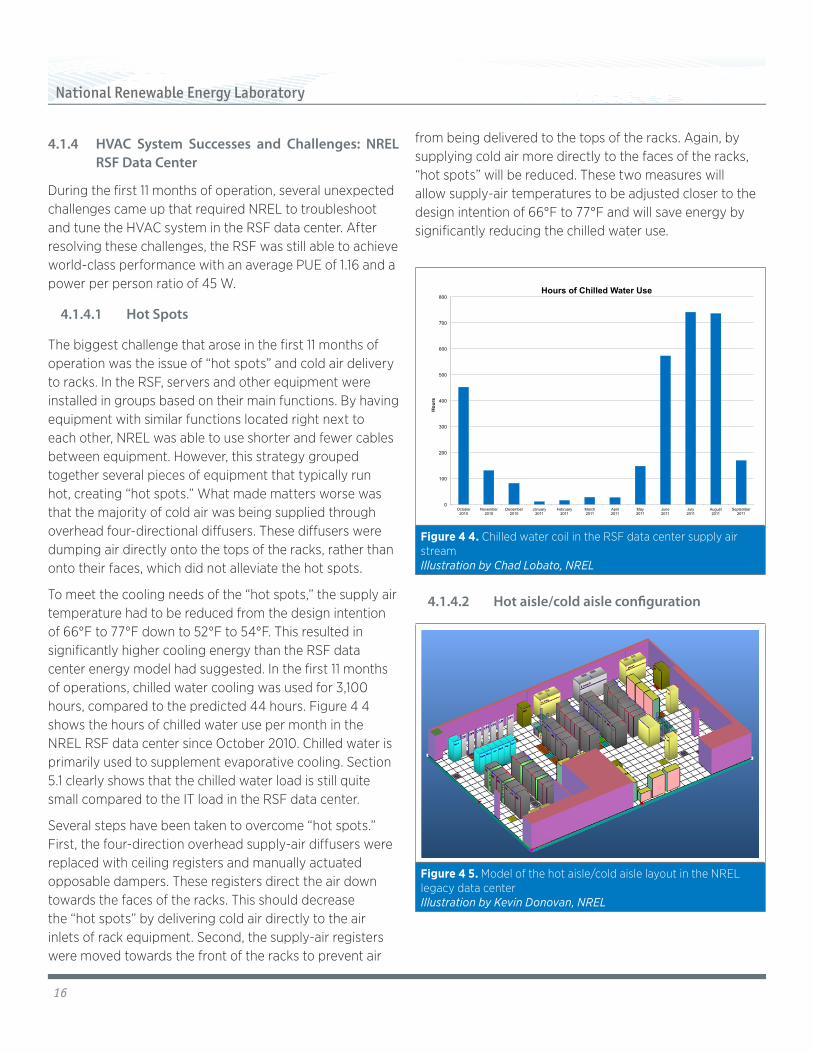
To meet the cooling needs of the “hot spots,” the supply air temperature had to be reduced from the design intention of 66°F to 77°F down to 52°F to 54°F. This resulted in significantly higher cooling energy than the RSF data center energy model had suggested. In the first 11 months of operations, chilled water cooling was used for 3,100 hours, compared to the predicted 44 hours. Figure 4 4 shows the hours of chilled water use per month in the NREL RSF data center since October 2010. Chilled water is primarily used to supplement evaporative cooling. Section 5.1 clearly shows that the chilled water load is still quite small compared to the IT load in the RSF data center.
Several steps have been taken to overcome “hot spots.” First, the four-direction overhead supply-air diffusers were replaced with ceiling registers and manually actuated opposable dampers. These registers direct the air down towards the faces of the racks. This should decrease the “hot spots” by delivering cold air directly to the air inlets of rack equipment. Second, the supply-air registers were moved towards the front of the racks to prevent air
from being delivered to the tops of the racks. Again, by supplying cold air more directly to the faces of the racks, “hot spots” will be reduced. These two measures will allow supply-air temperatures to be adjusted closer to the design intention of 66°F to 77°F and will save energy by significantly reducing the chilled water use.
0
100
200
300
400
500
600
700
800
October 2010
November 2010
December 2010
January 2011
February 2011
March 2011
April 2011
May 2011
June 2011
July 2011
August 2011
September 2011
Hou
rs
Hours of Chilled Water Use
Figure 4 4. Chilled water coil in the RSF data center supply air stream Illustration by Chad Lobato, NREL
4.1.4.2 Hot aisle/cold aisle configuration
Figure 4 5. Model of the hot aisle/cold aisle layout in the NREL legacy data center Illustration by Kevin Donovan, NREL

17
National Renewable Energy Laboratory
In both the legacy and RSF data center, the racks are configured as hot aisle/cold aisle. In a hot aisle/cold aisle configuration, the racks are divided into pairs with the rows of each pair parallel and the hot sides facing each other. The cold supply air is delivered to the cold sides of server racks and the hot sides of the server racks are positioned close to return air inlets. Figure 4 5 is a model of the hot aisle/cold aisle layout of the NREL legacy data center.
The server rack layout shown in Figure 4 5 helps to reduce fan energy and cooling load because cold air has less of an opportunity to mix with hot air exhausted from the racks. As a result, supply air can be delivered at a higher temperature and a lower flow rate, which saves energy.
4.1.4.3 Hot Aisle Containment
In the RSF data center, NREL took the hot and cold aisle configuration one step further. Special server racks were installed to create a hard-walled, sealed envelope around the hot aisles (see Figure 4 6). The envelope prevents hot air from leaking out of the hot aisle and mixing with the cold supply air.
In practice, the roof of the hot aisle came from the manufacturer with many built-in holes intended for cable tray mounting, which makes it “leaky.” NREL is currently looking at several off-the-shelf options for sealing these holes and increasing the overall effectiveness of our containment strategy. Cable penetrations through the rack roofs and fronts, as well as gaps between the bottom of the racks and the floor, were additional sources of hot air leaks into the cold aisles. To accommodate the leaking hot air, supply air temperatures needed to be reduced from the design temperatures, which required increased cooling energy. The solution to cable penetrations and leaking from under the racks are discussed section 4.1.4.4.
Since the majority of hot air is routed out of the data center, the supply air can be delivered at much higher temperatures (with a cushion for safety so that servers do not overheat). This significantly reduces the cooling load. As a starting point for supply air temperature, NREL referred to the ASHRAE environmental guidelines for datacom equipment (ASHRAE, 2008).
Figure 4 6. View of the RSF data center in the cold aisle (top) and from inside of the contained hot aisle (bottom) Photo by Dennis Schroeder, top: NREL/PIX 19219, bottom: NREL/PIX 17897
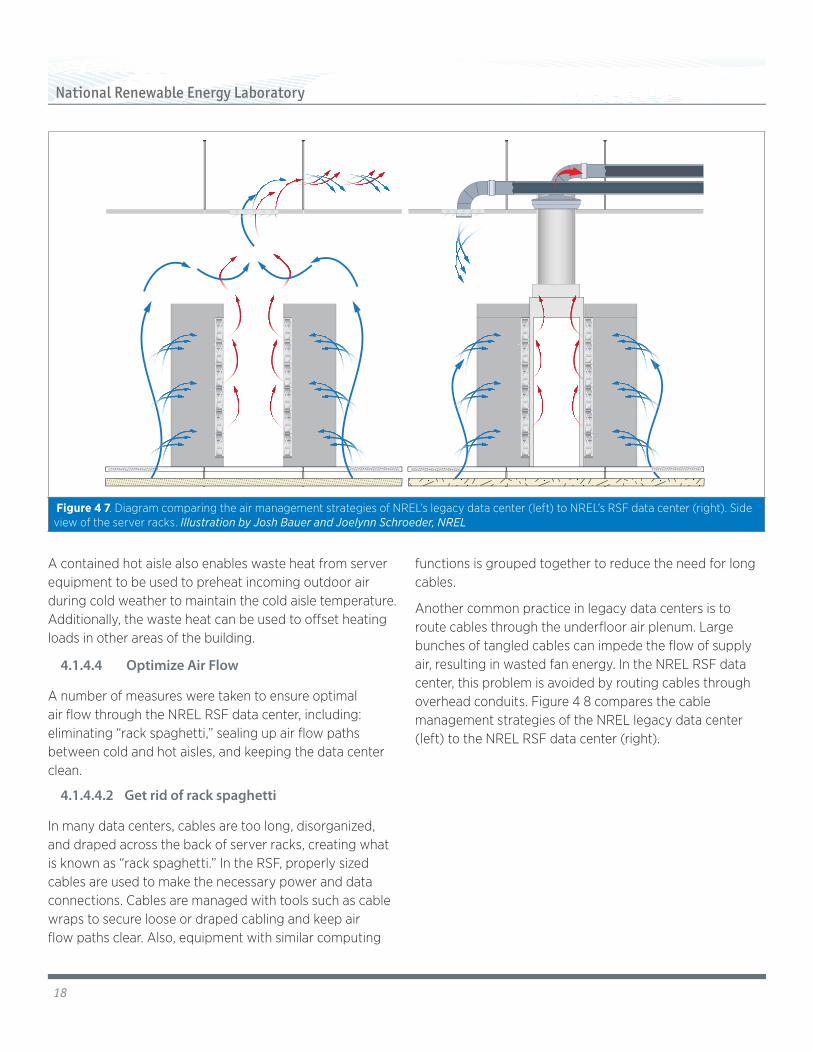
An additional benefit of being able to use hot aisle containment is that supply air can be delivered at a much lower flow rate since mixing is minimized. In the RSF, hot aisle containment resulted in an approximately 75% reduction in air handling unit (AHU) fan energy. Figure 4 7 below depicts the air flow through server racks without and with hot aisle containment. The air flow path is as follows: (1) the server equipment pulls air from the cold aisle, (2) through the front of the cabinet, (3) and out of the back of the equipment into the hot aisle.
18
National Renewable Energy Laboratory
Figure 4 7. Diagram comparing the air management strategies of NREL’s legacy data center (left) to NREL’s RSF data center (right). Side view of the server racks. Illustration by Josh Bauer and Joelynn Schroeder, NREL
A contained hot aisle also enables waste heat from server equipment to be used to preheat incoming outdoor air during cold weather to maintain the cold aisle temperature. Additionally, the waste heat can be used to offset heating loads in other areas of the building.
4.1.4.4 Optimize Air Flow
A number of measures were taken to ensure optimal air flow through the NREL RSF data center, including: eliminating “rack spaghetti,” sealing up air flow paths between cold and hot aisles, and keeping the data center clean.
4.1.4.4.2 Get rid of rack spaghetti
In many data centers, cables are too long, disorganized, and draped across the back of server racks, creating what is known as “rack spaghetti.” In the RSF, properly sized cables are used to make the necessary power and data connections. Cables are managed with tools such as cable wraps to secure loose or draped cabling and keep air flow paths clear. Also, equipment with similar computing
functions is grouped together to reduce the need for long cables.
Another common practice in legacy data centers is to route cables through the underfloor air plenum. Large bunches of tangled cables can impede the flow of supply air, resulting in wasted fan energy. In the NREL RSF data center, this problem is avoided by routing cables through overhead conduits. Figure 4 8 compares the cable management strategies of the NREL legacy data center (left) to the NREL RSF data center (right).

19
National Renewable Energy Laboratory
Figure 4 8. Comparison of the cable management strategies of the NREL legacy data center (left) to the NREL RSF data center (right). Rear view of the server racks. Illustration by Josh Bauer and Joelynn Schroeder, NREL
4.1.4.4.3 Seal up air flow path as much as possible and remove obstructions
In many data centers, hot air from the server equipment can readily mix with cold supply air. In the RSF, the hot aisle is contained and the air flow paths are sealed as much as possible. This helps to force the majority of the cold air directly through the rack equipment, and the hot air directly out of the return vents.
In the RSF, supply air enters the cold aisles through floor and ceiling diffusers. The floor is well sealed so that air flows only through the floor grates and out to the desired racks. Commercially available grommets are used to seal cable openings in raised floors. Weather stripping is used to seal the bases of the equipment racks and the access doors to the hot aisles.
The equipment racks in the RSF were designed to support servers with front ventilation. Brush panels are used to seal front-mounted cable connections. Additionally, blanking panels cover all open rack spaces (on the cold aisle side). Initially, several of the onboard server fans were blowing
air from the hot aisle to the cold aisle, causing them to overheat. Once these fans were fixed, the servers no longer overheated. When procuring server equipment, it is important to check that the onboard fans will blow from the cold to hot aisle (given the way they will be mounted). This prevents hot air from “short circuiting” from the hot to the cold side of the rack.
Some of the computing equipment purchased for the RSF data center was not full rack depth. Initially, cold supply air was flowing around rather than through this equipment. Custom cowlings were made for these servers. One side of the cowling matches up flush with 2U openings on the front (cold aisle) side of the racks. The other side matches up with the front face of the server. As a result, cold air is forced to flow through the server and not around it (see Figure 4 9).

20
National Renewable Energy Laboratory
Figure 4 9. Server cowlings force air to flow through, rather than around servers. Left: server with cowling installed. Right: server without cowling installed. Photo by Michael Sheppy, NREL/PIX 19936
NREL compared the average temperatures of the hot and cold aisles before and after server cowling installation. The average temperature increase in the hot aisle was 1oF. The average temperature decrease in the cold aisle was 7oF. As a result of installing the server cowlings, the equipment is being cooled more effectively, resulting in increased uptime. In addition, the supply air temperature can be further increased, reducing cooling loads and saving significant energy.
4.1.4.4.4 Keep it clean to increase cooling efficiency
Several “clean” practices have been adopted in the RSF data center to prevent dust from clogging server fans and other openings. With fewer obstructions, cold supply air can flow efficiently through hot equipment. Antistatic sticky mats are at the entrances to remove static charge from occupants and grime from dirty shoes. Cardboard, food, and drinks are all prohibited within the data center. Access is limited and the data center is regularly cleaned.
4.1.5 Miscellaneous Data Center Strategies
In the RSF, data center managers have developed and maintained good relationships between IT staff members and facilities staff members by conducting regular meetings during which these employees review the energy performance of the data center and adjust operations to maximize energy savings.
To justify changing data center operations and procuring new (efficient) IT equipment, NREL upper management, data center managers, and IT staff have made energy
consumption a part of the data center’s total cost of ownership (TCO) analysis.
4.1.6 Track Data Center Performance through Power Metering
Metering in data centers allows operators to perform continuous commissioning, and to track performance over time to adjust and improve operation. With metered data in hand, data center operators can detect problems early on, which can save money on energy bills as well as capital costs (i.e., repair, maintenance, and replacement). Metering also allows you to compare your performance to other data centers and be competitive in the industry.
4.1.6.1 Power Utilization Effectiveness
To ensure optimal performance, data center managers should implement energy and environmental metering in order to benchmark and track performance. To understand the performance of an entire data center (including mechanical and other miscellaneous equipment), the following variables are useful to monitor electrical power, temperature, humidity, air flow rates, and pressure differentials. This metered data can be used to troubleshoot problems, fine-tune operations, and calculate several energy efficiency metrics. Power utilization effectiveness, or PUE, is the industry standard metric for data center energy efficiency, and is calculated as a ratio as follows:

21
National Renewable Energy Laboratory
PUE=
Typical data centers have a PUE of around 2.0, while best-in-class data centers have been shown to have a PUE of around 1.10 (Google, 2011).
Figure 4 10. Diagram of the power meters in the RSF data that allow PUE calculation Illustration by Marjorie Schott, NREL
The specific metering needed to calculate PUE will depend on your data center. At a minimum, you need to meter:
■ All data center HVAC loads separately from building HVAC loads
■ Data center lighting separately from building lighting
■ Data center miscellaneous loads separately from building miscellaneous loads
■ UPS equipment.
(Cooling+Power+IT Equipment) (IT Equipment)

22
National Renewable Energy Laboratory
In the RSF, an array of energy meters makes it possible for NREL to track PUE over time. The following electrical loads are monitored in the RSF data center: data center lighting, auxiliary plug loads, air handler units, return fans, chilled water, and computer power (UPS, PDU, and computers). Figure 4 10 is a diagram of how PUE is measured in the RSF data center.
PUE only measures how well an organization has optimized its energy use for data center cooling and power systems. It does not take into account efforts to optimize energy use for servers, storage, and network infrastructure. Imagine that two data centers have the same electrical loads and, therefore, the same PUE. However, one data center has very inefficient servers and the other has very efficient servers. The data center with more efficient servers can provide a higher level of computing services using the same amount of energy, but the PUE metric makes both look like they are performing equally. Therefore, other metrics should also be calculated. Dividing the total data center load among the number of users provides another way to evaluate overall energy efficiency.
Metering is especially handy when performing retrofits (as well as new construction) because it provides hard numbers to justify the cost of the retrofits and ensures that the design team and contractors are meeting their contractual energy requirements.
4.1.6.2 Energy Reuse Effectiveness
Efficiency gains as a result of reusing the waste heat within the data center itself cannot be factored into the PUE because it is already accounted for in reduced data center loads (Patterson et al. 2010). In other words, a PUE less than 1.0 is not allowed, by definition. For facilities such as the RSF that reuse waste heat in other parts of the building (outside of the data center), the ERE metric can be used to give credit for the resulting energy efficiency gains. The formula for ERE is:
ERE = =
where ERF stands for the energy recovery factor, which is zero when there is no waste heat reuse (Patterson et al. 2010).
(Total Energy-Reuse Energy)
(IT Energy)
ERE= (1-ERF)×PUE
(Reuse Energy)
(Total Energy)
(Cooling+Power + IT Equipment)-(Reuse)
(IT Energy)
ERF=
23
National Renewable Energy Laboratory
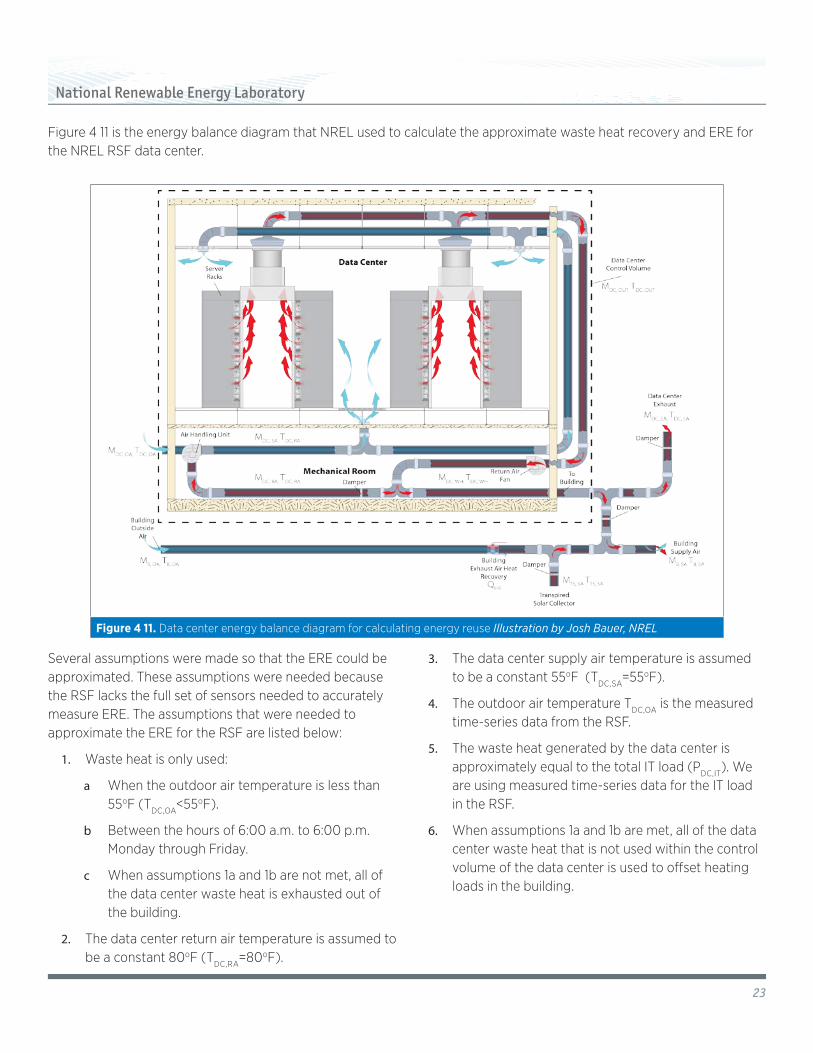
Figure 4 11 is the energy balance diagram that NREL used to calculate the approximate waste heat recovery and ERE for the NREL RSF data center.
Figure 4 11. Data center energy balance diagram for calculating energy reuse Illustration by Josh Bauer, NREL
Several assumptions were made so that the ERE could be approximated. These assumptions were needed because the RSF lacks the full set of sensors needed to accurately measure ERE. The assumptions that were needed to approximate the ERE for the RSF are listed below:
1. Waste heat is only used:
a When the outdoor air temperature is less than 55oF (TDC,OA<55oF).
b Between the hours of 6:00 a.m. to 6:00 p.m. Monday through Friday.
c When assumptions 1a and 1b are not met, all of the data center waste heat is exhausted out of the building.
2. The data center return air temperature is assumed to be a constant 80oF (TDC,RA=80oF).
3. The data center supply air temperature is assumed to be a constant 55oF (TDC,SA=55oF).
4. The outdoor air temperature TDC,OA is the measured time-series data from the RSF.
5. The waste heat generated by the data center is approximately equal to the total IT load (PDC,IT). We are using measured time-series data for the IT load in the RSF.
6. When assumptions 1a and 1b are met, all of the data center waste heat that is not used within the control volume of the data center is used to offset heating loads in the building.

24
National Renewable Energy Laboratory
The energy balance for the data center supply-air stream is:
mDC,SA hDC,SA = mDC,OA hDC,OA + mDC,RA hDC,RA [1]
where mDC,SA, mDC,RA, and mDC,OA are the mass flow rates of the supply, return, and outdoor air streams in the data center, respectively. hDC,SA, hDC,RA, and hDC,OA are the enthalpies of the supply, return and outdoor air streams in the data center, respectively. The humidity ratio of all of the data center air streams is assumed to be constant. A constant humidity ratio is assumed because when the outdoor air temperatures are low enough to reuse the heat, there would not be a need for evaporative cooling (raising the humidity ratio), or chilled water cooling (lowering the humidity ratio). The return air had a constant humidity ratio because there is negligible latent load in the data center. Accounting for sensible heat transfer only, Equation 1 becomes:
mDC,SA Cp,airTDC,SA = mDC,OACp,air TDC,OA + mDC,RACp,air TDC,RA [2]
where TDC,SA, TDC,RA, and TDC,OA are the temperatures of the supply, return, and outdoor air streams in the data center, respectively. Cp,air is the specific heat of air. The mass balance for the data center supply-air stream is
mDC,SA = mDC,OA + mDC,RA [3]
Substituting [3] into [1] yields:
mDC,SA hDC,SA = mDC,OA hDC,OA + (mDC,SA - mDC,OA) hDC,RA [4]
Expanding yields:
mDC,SA hDC,SA = mDC,OA hDC,OA + mDC,SA hDC,RA - mDC,OA hDC,RA [5]
25
National Renewable Energy Laboratory
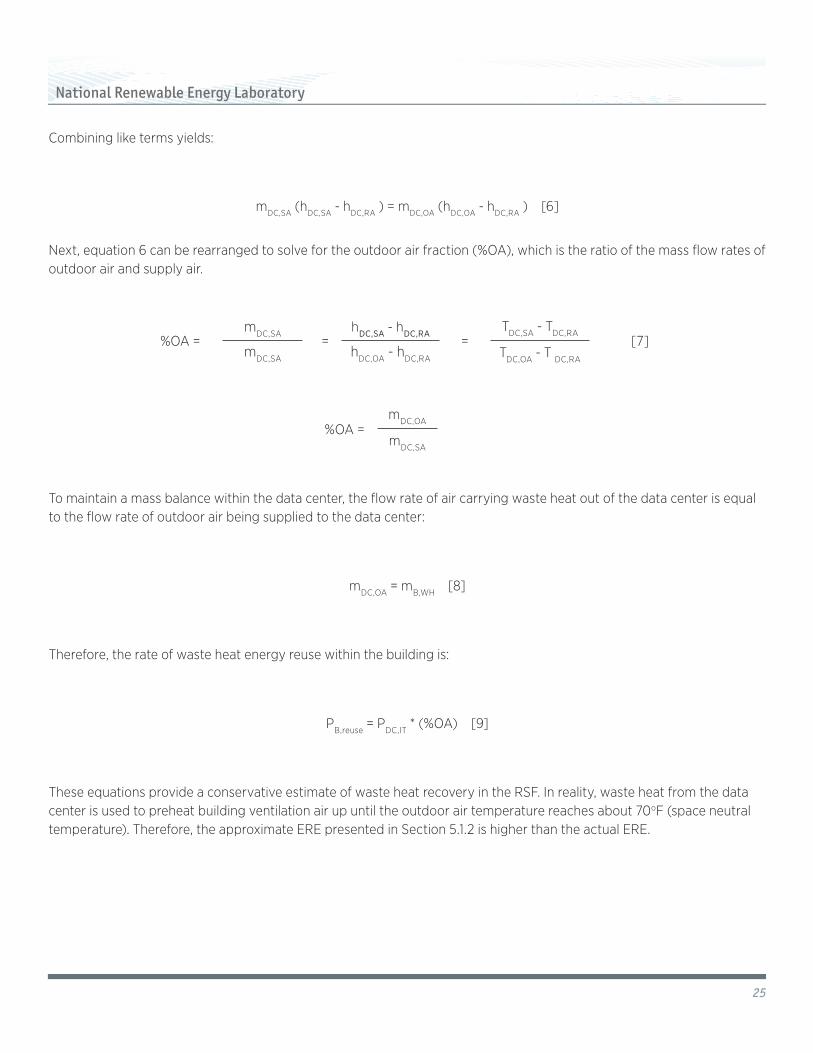
Combining like terms yields:
mDC,SA (hDC,SA - hDC,RA ) = mDC,OA (hDC,OA - hDC,RA ) [6]
Next, equation 6 can be rearranged to solve for the outdoor air fraction (%OA), which is the ratio of the mass flow rates of outdoor air and supply air.
%OA = = = [7]
%OA =
To maintain a mass balance within the data center, the flow rate of air carrying waste heat out of the data center is equal to the flow rate of outdoor air being supplied to the data center:
mDC,OA = mB,WH [8]
Therefore, the rate of waste heat energy reuse within the building is:
PB,reuse = PDC,IT * (%OA) [9]
These equations provide a conservative estimate of waste heat recovery in the RSF. In reality, waste heat from the data center is used to preheat building ventilation air up until the outdoor air temperature reaches about 70oF (space neutral temperature). Therefore, the approximate ERE presented in Section 5.1.2 is higher than the actual ERE.
mDC,OA
mDC,SA
mDC,SA
mDC,SA
hDC,SA - hDC,RA
hDC,OA - hDC,RA
TDC,SA - TDC,RA
TDC,OA - T DC,RA

26
National Renewable Energy Laboratory
5.0 Results
The strategies previously discussed have allowed the RSF data center to be energy efficient and help achieve the building’s overall energy goals. In the first 11 months of operations, the data center accounted for 41% of the RSF’s energy use. This was slightly higher than the model predictions (35%) because the model assumed an IT equipment load of 65 W/person for 1200 data center users compared to the actual 45 W/person for 2400 users. The energy use and associated energy costs were significantly reduced when compared to the NREL legacy data center. Section 5.2 provides a comparison between NREL’s legacy and RSF data centers.
5.1 RSF Data Center Performance
Figure 5 1 provides a breakdown of the monthly energy use for the RSF data center over the first 11 months of operation. The primary energy end use was the IT equipment. The energy from fans, lighting, miscellaneous loads, and losses made up 13% of the energy use. Note that despite using cooling during significantly more hours than predicted in the design, the overall cooling energy is only about 2% of the total energy.
0
10,000
20,000
30,000
40,000
50,000
60,000
70,000
80,000
90,000
100,000
October 2010
November 2010
December 2010
January 2011
February 2011
March 2011
April 2011
May 2011
June 2011
July 2011
August 2011
Ener
gy (k
Wh)
Data Center Energy Fan, Lighting, and Miscellaneous Energy
Cooling Energy
IT Energy
Figure 5 1. Monthly energy use for the RSF data center over the first 11 months of operations Illustration by Chad Lobato, NREL
Figure 5 2 provides the hourly times series load profile for the RSF data center for the first 11 months. The total data center load is the purple line, the IT equipment is the red line, chilled water cooling is the blue line, and hourly outdoor temperature is the faint pink line. There was a slight increase in UPS output because of increased data center utilization. Various computing processes that were previously handled at the workstation level were pushed to the data center for more efficient operations and UPS backup. Both the total load and cooling load show how outdoor weather conditions impact the data center cooling. During the cooler fall, winter, and spring months, the data center was able to meet the cooling loads through economizing and, occasionally, evaporative cooling. As outdoor temperatures increased, the amount of chilled water cooling increased. The total data center load ranges from 90 kW to 134 kW depending on outdoor weather conditions.
-40
-20
0
20
40
60
80
100
0
10
20
30
40
50
60
70
80
90
100
110
120
130
140
10/1/10 11/30/10 1/29/11 3/30/11 5/29/11 7/28/11
Out
door
Tem
pera
ture
(°F)
Pow
er (k
W)
Data Center Power Total Data Center
Cooling Load
IT Load
Outdoor Temperature
Figure 5 2. Load profile for the RSF data center over the first 11 months of operations Illustration by Chad Lobato, NREL
5.1.1 RSF Power Utilization Effectiveness
PUE is the industry-standard metric for energy efficiency in data centers. The PUE is being monitored closely to ensure that the data center operates efficiently. Figure 5 3 provides the hourly time series PUE measurements and outdoor air temperatures.

27
National Renewable Energy Laboratory
-20
-5
10
25
40
55
70
85
100
0.70
0.80
0.90
1.00
1.10
1.20
1.30
1.40
1.50
10/1/10 11/30/10 1/29/11 3/30/11 5/29/11 7/28/11 O
utdo
or T
empe
ratu
re (°
F)
PUE
Data Center PUE RSF Data Center PUE
Outdoor Temperature
Figure 5 3. Hourly PUE performance over the first 11 months Illustration by Chad Lobato, NREL
The supply air to the data center was controlled to maintain a 52°F to 55°F temperature range. When dehumidification was not required and when outdoor air temperatures were below the desired supply air temperature, cooling was not required. The limited use of cooling and fan energy allowed the data center to achieve low PUE values. The overall average PUE for the RSF data center is 1.16. During the cooler hours of the year, the data center was operating at an average PUE of 1.12. Increased outdoor air temperatures caused an increase in cooling energy, resulting in increased PUE numbers. The average PUE during the warmer summer months was 1.22. Figure 5 3 shows a decrease in PUE in late July through August even though outdoor air temperatures remained fairly constant. This decrease in PUE was due to changes in the data center cooling and ventilation controls that were identified through monitoring. The supply air temperature set point was increased from 52°F to 55°F. Also, the data center exhaust fans were reprogrammed to operate two fans at 60% speed, instead of one fan at 100% speed. A comparison between monthly average PUE is shown in Figure 5 4.
0.00
0.20
0.40
0.60
0.80
1.00
1.20
1.40
October 2010
November 2010
December 2010
January 2011
February 2011
March 2011
April 2011
May 2011
June 2011
July 2011
August 2011
PUE
Average PUE
Figure 5 4. Monthly average PUE for the RSF data center Illustration by Chad Lobato, NREL
5.1.2 RSF Energy Reuse Effectiveness
The RSF data center ERE was approximated by using the energy balance discussed in section 4.1.6.2. The calculated average ERE was 0.91. Figure 5 5 shows the calculated ERE for the RSF data center over the first 11 months of operations. The hourly ERE values are shown as a function of outdoor air temperature.
Figure 5 5. ERE as a function of outdoor air temperature for the RSF data center Illustration by Michael Sheppy, NREL
TOA < 55°F6AM – 6PMERE < PUE
TOA > 55°FERE = PUE
TOA < 55°F6PM – 6AMERE = PUE
28
National Renewable Energy Laboratory
Figure 5 5 shows three distinct regions. The waste heat from the data center was assumed to be used only when outdoor temperatures were below 55°F during occupied hours. The vertical line represents the 55°F boundary. In the area to the right of the boundary, the ERE was equal to the PUE because the building did not use the waste heat; it was simply rejected from the building. The upper left area of the graph also shows ERE as equal to PUE. This area depicts hours of operation in which the outdoor temperature was below 55°F, but the building was unoccupied and did not have a need for the data center waste heat.
The lower left area of the graph shows occupied hours in which the outdoor temperature was below 55°F (when the waste heat could be reused). The ERE approached zero as the temperature approached 55°F because all of the heat from the data center was able to be reused elsewhere in the building. As the temperature decreased, the ERE increased because a greater portion of the waste heat was used within the data center to heat the incoming supply air. It should be noted that the 55°F temperature is a conservative assumption. In reality, the waste heat from the data center is used in the building during occupied hours with outdoor air temperatures as high as 70°F to 75°F. At these elevated temperatures, there is a diminishing use of the data center waste heat in the building. Currently, there is insufficient information to approximate the waste heat recovery between 55°F and 75°F during occupied hours.
5.2 The RSF Data Center versus the Legacy Data Center
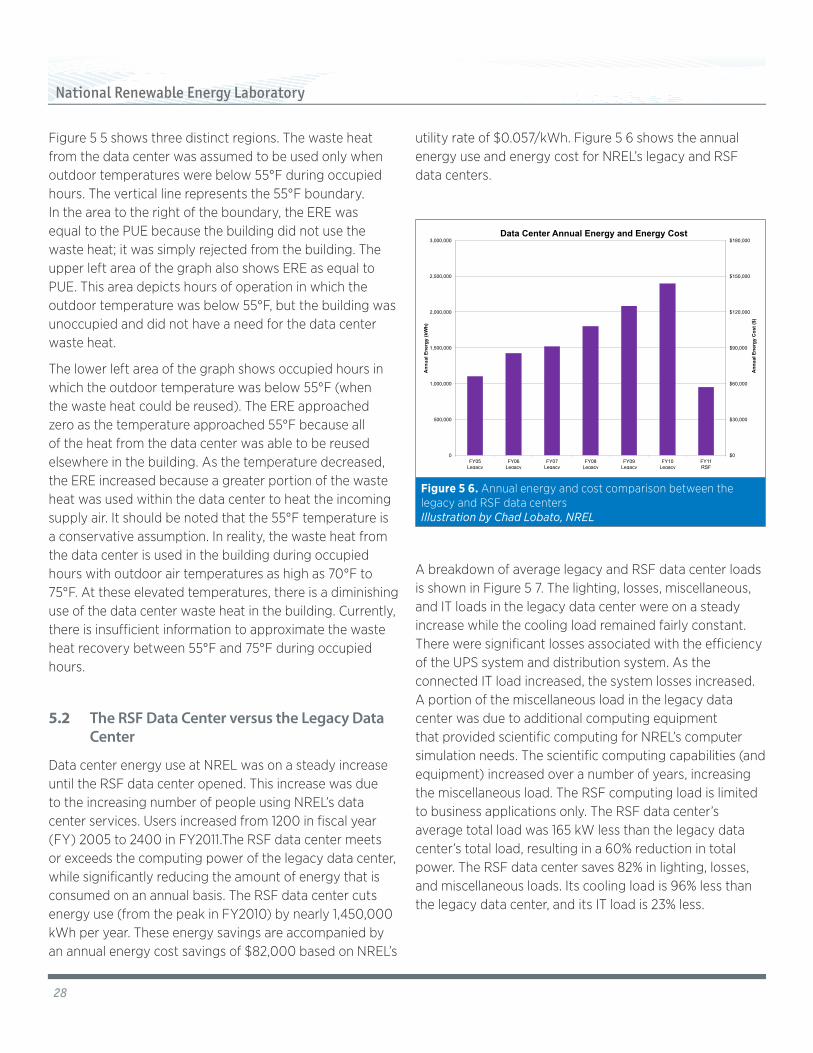
Data center energy use at NREL was on a steady increase until the RSF data center opened. This increase was due to the increasing number of people using NREL’s data center services. Users increased from 1200 in fiscal year (FY) 2005 to 2400 in FY2011.The RSF data center meets or exceeds the computing power of the legacy data center, while significantly reducing the amount of energy that is consumed on an annual basis. The RSF data center cuts energy use (from the peak in FY2010) by nearly 1,450,000 kWh per year. These energy savings are accompanied by an annual energy cost savings of $82,000 based on NREL’s
utility rate of $0.057/kWh. Figure 5 6 shows the annual energy use and energy cost for NREL’s legacy and RSF data centers.
$0
$30,000
$60,000
$90,000
$120,000
$150,000
$180,000
0
500,000
1,000,000
1,500,000
2,000,000
2,500,000
3,000,000
FY05 Legacy
FY06 Legacy
FY07 Legacy
FY08 Legacy
FY09 Legacy
FY10 Legacy
FY11 RSF
Ann
ual E
nerg
y C
ost (
$)
Ann
ual E
nerg
y (k
Wh)
Data Center Annual Energy and Energy Cost
Figure 5 6. Annual energy and cost comparison between the legacy and RSF data centers Illustration by Chad Lobato, NREL
A breakdown of average legacy and RSF data center loads is shown in Figure 5 7. The lighting, losses, miscellaneous, and IT loads in the legacy data center were on a steady increase while the cooling load remained fairly constant. There were significant losses associated with the efficiency of the UPS system and distribution system. As the connected IT load increased, the system losses increased. A portion of the miscellaneous load in the legacy data center was due to additional computing equipment that provided scientific computing for NREL’s computer simulation needs. The scientific computing capabilities (and equipment) increased over a number of years, increasing the miscellaneous load. The RSF computing load is limited to business applications only. The RSF data center’s average total load was 165 kW less than the legacy data center’s total load, resulting in a 60% reduction in total power. The RSF data center saves 82% in lighting, losses, and miscellaneous loads. Its cooling load is 96% less than the legacy data center, and its IT load is 23% less.

29
National Renewable Energy Laboratory
0
50
100
150
200
250
300
FY05 Legacy
FY06 Legacy
FY07 Legacy
FY08 Legacy
FY09 Legacy
FY10 Legacy
FY11 RSF
Pow
er (k
W)
Data Center Power Lighting, Misc., and Losses Cooling Load
IT Load
Figure 5 7. Load breakdown for the legacy and RSF data center Illustration by Chad Lobato, NREL
Although there was a definite upward trend in energy consumption and power draw in the legacy data center, there was a downward trend in watts per person. The peak power per person was 151 W/ person in FY 2006, which then decreased to 119 W/person by FY 2010. This decrease in watts per person was due to an effort to replace aging equipment with newer energy efficient equipment in preparation for the RSF data center. The RSF data center power per person is an average 45 W/person. Figure 5 8 shows a breakdown of the power per person of the legacy and RSF data centers.
0
20
40
60
80
100
120
140
160
FY05 Legacy
FY06 Legacy
FY07 Legacy
FY08 Legacy
FY09 Legacy
FY10 Legacy
FY11 RSF
Pow
er (W
/per
son)
Data Center Power Per Person Lighting, Misc., and Losses Cooling Load
IT Load
Figure 5 8. Power per person breakdown for the legacy and RSF data center Illustration by Chad Lobato, NREL
The legacy data center operated with an average PUE of around 2.28, which is consistent with typical data centers. The total energy grew proportionally with the increasing IT load. The RSF data center’s PUE is significantly lower at 1.16. Figure 5 9 shows a comparison between the legacy and RSF data centers’ PUE.
0.00
0.50
1.00
1.50
2.00
2.50
FY05 Legacy
FY06 Legacy
FY07 Legacy
FY08 Legacy
FY09 Legacy
FY10 Legacy
FY11 RSF
PUE
Data Center PUE
Figure 5 9. Comparison of NREL’s legacy and RSF data center PUE numbers Illustration by Chad Lobato, NREL

30
National Renewable Energy Laboratory
6.0 Conclusion
NREL is world renowned for its commitment to green building construction. In June 2010, the laboratory finished construction of a 220,000-ft2, LEED Platinum, Research Support Facility (RSF) which included a 1900-ft2 data center. The RSF is designed to have an annual energy use intensity of 35 kBtu/ft2. The building will be equipped with enough on-site renewable energy generation to offset the annual energy consumption. To support the NREL RSF’s energy goals, its data center was designed to minimize its energy footprint without compromising needed service quality.
The previous data center on NREL’s campus used a number of individual servers with a utilization of less than 5%. When the total data center power draw was divided among all users, the continuous power consumption rate per person was 151 W (based on 2006 statistics). Chilled water was created using one multi-stage air cooled chiller unit and a backup single-stage AC chiller unit, delivering chilled water to seven CRAHs. This cool air was delivered through an underfloor plenum which was also a passageway for most of the equipment cables, conduits and chilled water pipes. This increased the fan energy required to move air between the CRAHs and the servers. Adding to the inefficiency of the existing data center were the open hot and cold aisles, which allowed mixing of cool supply air and hot return air; as a result, air had to be supplied at a much lower temperature, wasting energy. The legacy data center’s peak total load was 273 kW. It operated with an average power utilization effectiveness (PUE) of 2.28, which is consistent with typical data centers. The UPS and room power distribution units (PDUs) were 80% efficient; this created additional heat that needed to be cooled.
The data center loads had to be significantly reduced to allow the RSF to meet its energy goals. However, there were initially some concerns from data center operators about minimizing risks to operations. To gain buy-in from the data center operators, the design team emphasized the following key points:
■ Reducing the data center energy footprint increases uptime.
■ New ASHRAE guidelines allow for higher temperature and humidity set points in data centers.
■ Building a low-energy data center provides operators with an opportunity for career development.
■ A low-energy design can reduce upfront capital costs.
■ Building a new data center allows operators to get rid of old problematic equipment.
■ A low-energy design significantly reduces utility bills.
■ A low-energy design helps data center operators comply with NREL and Federal policies.
■ A low-energy design helps data center operators comply with the contractual energy goals of the RSF.
The data center in NREL’s RSF uses blade servers that run virtualized servers. When the total data center power draw is divided among all users, the continuous per-person power consumption rate is 45 W. The UPS and room PDU are 95% efficient. Currently, the UPS is configured with 125 kW capacity and scales in 25-kW increments. Ultra-efficient PDUs distribute power to the equipment racks.
NREL is located in Golden, Colorado, which has a climate that allows “free cooling.” This means outdoor air can provide most of the data center’s cooling needs. When outdoor air alone is insufficient, direct evaporative cooling methods are used to minimize traditional air-conditioned cooling.
The equipment racks are arranged in a hot aisle/cold aisle configuration with hot aisle containment. Waste heat from the hot aisle is captured for reuse in the building. The new data center is well insulated, largely because it is mostly below grade, and has no windows.
Within the first 11 months of operation, the measured PUE for NREL’s RSF data center is an average 1.16, which is extremely low and unique among data centers worldwide. The ERE is approximately 0.91 on average, which is also quite low compared to other data centers. The ERE may be lower if you assume waste heat is used to offset building heating loads up until the outdoor air temperature is equal to the building supply air temperature set point.
Based on the status of its RSF data center project, NREL is advising other government organizations on data

31
National Renewable Energy Laboratory
center efficiency. The laboratory places great emphasis on the use of key metrics—such as PUE and ERE—to track performance. By carefully monitoring these metrics and making adjustments, NREL is able to continuously improve the performance of its data center operations.
7.0 References
American Society of Heating, Refrigerating and Air-Conditioning Engineers. 2008 ASHRAE Environmental Guidelines for Datacom Equipment: Expanding the Recommended Environmental Envelope. Atlanta, GA. 2008
Donovan, Kevin. Building a Better Data Center. 24x7 Exchange. National Renewable Energy Laboratory. March 15, 2011.
ENERGY STAR. 2011. ENERGY STAR database. www.energystar.gov/ index.cfm?fuseaction=find_a_product.showProductGroup&pgw_ code=DC.
EPEAT. 2006. EPEAT database. www.epeat.net/.
Google. 2011. “Efficiency Measurements.” http://www.google.com/corporate/data center/efficiency-measurements.html. Accessed June 20, 2011.
Hewlett-Packard Development Company. 2011. HP Integrity BL860c i2 Server Blade: Cost-effective mission-critical Converget Infrastructure. Data Sheet. http://h20195.www2.hp.com/v2/GetPDF.aspx/4AA0-1975ENW.pdf. Date accessed: September 20, 2011.
Hydeman, M.; Swenson, D. (March 2010). “Humidity Controls for Data Center: Are They Necessary?” ASHRAE Journal.
Lobato, C.; Pless, S.; Sheppy, M.; Torcellini, P. (2011). “Reducing Plug and Process Loads for a Large Scale, Low Energy Office Building: NREL’s Research Support Facility; Preprint.” Golden, CO: National Renewable Energy Laboratory. www.nrel.gov/docs/fy11osti/49002 .pdf.
Metzger, I.; Rockenbaugh, C.; VanGeet, O.; Dean, J.; Kurnik, C. 2011. “Psychrometric Bin Analysis for Alternative Cooling Strategies in Data Centers.” ASHRAE Transactions No. ML-11-CO31.
NREL. Sustainable NREL Policy. URL: <http://www.nrel.gov/sustainable_nrel/pdfs/sustainable_nrel_policy.pdf>. Date accessed: June 14, 2011.
Obama, Barack. Executive Order 13514. Federal Leadership in Environmental, Energy, and Economic Performance. October 5, 2009.
Patterson, M. et al. “Towards the Net-Zero Data Center: Development and Application of an Energy Reuse Metric.” Prepared for the ASHRAE Summer Conference, 2011.
Patterson, M.; Tschudi, B.; Vangeet, O.; Cooley; J., Azevedo, D. (2010). “ERE: A Metric for Measuring the Benefit of Reuse Energy from a Data Center.” The Green Grid.
Pouchet, J. (November 2010). “Intelligent Controls.” Sustainable Facility.
Sisk, D. et al. “Real-Time Data Center Energy Efficiency at Pacific Northwest National Laboratory.” Prepared for the ASHRAE Winter Conference, 2009.
Tschudi, W.; Xu, T.; Sartor, D.; Stein, J. 2003. High Performance Data Centers: A Research Roadmap. Berkeley, CA: Lawrence Berkeley National Laboratory. LBNL-53483. http://hightech.lbl.gov/documents/_roadmap_final.pdf.
U.S. Environmental Protection Agency ENERGY STAR Program. Report to Congress on Server and Data Center Energy Efficiency: Public Law 109-431. August 2, 2007.
Vamderbilt, Tom. Data Center Overload. The New York Times. June 8, 2009.
VanGeet, O. (2011). Best Practices Guide for Energy-Efficient Data Center Design. U.S. Department of Energy Federal Energy Management Program.
Vangeet, O. NREL Research Support Facility. NREL.ASHRAE Rocky Mountain Chapter Technical Conference. April 15, 2011.

Reducing Data Center Loads for a Large-scale, Low-energy Office Building: NREL’s Research Support FacilityThe NREL Approach
National Renewable Energy Laboratory1617 Cole Boulevard, Golden, Colorado 80401-3305303-275-3000 • www.nrel.gov
NREL is a national laboratory of the U.S. Department of Energy Office of Energy Efficiency and Renewable Energy Operated by the Alliance for Sustainable Energy, LLC
NREL/BK-7A40-52785 • December 2011
Printed with a renewable-source ink on paper containing at least 50% wastepaper, including 10% post consumer waste.