Embed Size (px)
Citation preview

Market Data / Supplier Selection / Event Presentations / User Experience Benchmarking / Best Practice / Template Files / Trends & Innovation
Reducing Customer Struggle 2013
in association with IBM Tealeaf

Reducing Customer Struggle 2013 in association with IBM Tealeaf
Econsultancy London
4th Floor, Farringdon Point
29-35 Farringdon Road
London EC1M 3JF
United Kingdom
Telephone:
+44 207 269 1450
http://econsultancy.com
Econsultancy New York
350 7th Avenue, Suite 307
New York, NY 10001
United States
Telephone:
+1 212 971 0630
All rights reserved. No part of this publication may be
reproduced or transmitted in any form or by any means,
electronic or mechanical, including photocopy, recording
or any information storage and retrieval system, without
prior permission in writing from the publisher.
Copyright © Econsultancy.com Ltd 2013
Published June 2013

Reducing Customer Struggle 2013 in association with IBM Tealeaf Page 3
All rights reserved. No part of this publication may be reproduced or transmitted in any form or by any means, electronic or mechanical, including photocopy, recording or any information storage
and retrieval system, without prior permission in writing from the publisher. Copyright © Econsultancy.com Ltd 2013
Contents
1. Executive Summary and Highlights ................................ 5
1.1. About Econsultancy .................................................................. 10
1.2. About IBM Tealeaf ..................................................................... 11
2. Foreword by IBM Tealeaf .............................................. 12
3. Methodology and Sample .............................................. 13
3.1. Methodology ............................................................................... 13
3.2. Respondent profiles ................................................................... 13
3.2.1. Business objectives ................................................................ 14
4. Findings ......................................................................... 15
4.1. Understanding the digital customer experience ....................... 15
4.1.1. Understanding types of customer behaviour ........................ 15
4.1.2. Value of different types of customer behaviour .................... 17
4.1.3. Difficulty collecting information about customer behaviour ............................................................................... 18
4.1.4. Understanding the overall online customer experience ....... 19
4.1.5. Methods used for understanding the customer experience .. 21
4.1.6. Effectiveness of different methods ........................................ 22
4.1.7. Responsibility for online customer experience ..................... 24
4.1.8. Barriers to understanding the online customer experience . 25
4.2. Problems or issues with the online experience ........................ 27
4.2.1. Discovering issues with the online experience ...................... 27
4.2.2. Effectiveness of different approaches to identifying problems ................................................................................ 28
4.2.3. Most common website issues ................................................ 30
4.2.4. Most serious website issues ................................................... 31
4.2.5. Quantifying lost revenue ........................................................ 33
4.2.6. Measuring differences in conversion rates ............................ 34
4.2.7. Prioritising problems and issues customers face online ....... 35
4.2.8. Business initiatives to improve customer experience quality .................................................................................... 36
4.3. Use of customer channels ......................................................... 37
4.3.1. Change in investment in customer channels ........................ 37
4.3.2. Quality of customer experience for different channels ......... 38
4.4. Integrating online with offline channels .................................. 39
4.4.1. Visibility into online customer activity .................................. 39

Reducing Customer Struggle 2013 in association with IBM Tealeaf Page 4
All rights reserved. No part of this publication may be reproduced or transmitted in any form or by any means, electronic or mechanical, including photocopy, recording or any information storage
and retrieval system, without prior permission in writing from the publisher. Copyright © Econsultancy.com Ltd 2013
4.4.2. Rating of multichannel customer experience........................ 41
4.4.3. Integrating the digital and physical experience .................... 42
4.5. Mobile customer experience ..................................................... 44
4.5.1. Importance of mobile to business objectives ........................ 44
4.5.2. How customers interact with companies via mobile devices .................................................................................... 45
4.5.3. Use of mobile platforms ......................................................... 46
4.5.4. Mobile optimisation ............................................................... 47
4.5.5. Proportion of traffic via mobile devices ................................ 48
4.5.6. Understanding the mobile user experience .......................... 49
4.5.7. How customers rate the mobile user experience .................. 52
4.5.8. Most serious mobile issues .................................................... 53
4.5.9. Responsibility for mobile customer experience .................... 54
5. Appendix: Respondent Profiles ..................................... 55
5.1. Business sector .......................................................................... 55
5.2. Geography.................................................................................. 56
5.3. Size of company by revenue ...................................................... 57

Reducing Customer Struggle 2013 in association with IBM Tealeaf Page 5
All rights reserved. No part of this publication may be reproduced or transmitted in any form or by any means, electronic or mechanical, including photocopy, recording or any information storage
and retrieval system, without prior permission in writing from the publisher. Copyright © Econsultancy.com Ltd 2013
1. Executive Summary and Highlights This is the third annual Reducing Customer Struggle report, published by Econsultancy in
association with IBM Tealeaf. The research is based on a global online survey of more than 500
business professionals working for companies involved in ecommerce and e-business. The survey
was conducted in March and April 2013.
The report looks in detail at the extent to which companies understand the overall customer
experience across online and offline channels and the approaches or types of technology they use
to identify and address issues.
This year’s survey explored in more detail how well companies understand the mobile user
experience, what mobile platforms they use, and the most serious issues encountered by
customers when they interact via mobile devices.
The key findings are summarised below:
1. Increased investment and focus on mobile channels but
optimisation challenges remain
Almost three-quarters (72%) of companies surveyed plan to ramp up their mobile
investment this year, while a similar proportion of respondents say that mobile is either
‘critical’ (32%) or ‘important’ (42%) to their business objectives.
The importance of focusing on the mobile customer experience is evidenced by the increased
amount of traffic attributable to mobile devices, reflecting the increased importance of mobile
both as a transactional channel and as part of multichannel consumer behaviour.
The proportion of respondents who say that mobile accounts for more than 20% of their
traffic has more than doubled in the last 12 months, from less than a fifth (17%) in 2012 to
41% this year. On average, survey respondents indicate that 19% of their total traffic can be
attributed to mobile (up from 17% last year).
The proportion of customers purchasing products directly using a mobile device has also
increased, with around half (48%) of organisations surveyed reporting transactional mobile
activity (up from 43% last year). Three in five respondents indicate that their customers
research products for later purchase online (60%, up from 58% last year), while 44% say they
research products for later purchase offline (up from 41% last year).
The proportion of organisations rating the quality of customer experience via
mobile as ‘poor’ has almost halved in the last two years, from around half (46%) in 2011
to 26% this year.
Similarly, only 5% of respondents rate their understanding of the mobile user
experience as ‘poor’, compared to 12% last year. The proportion of those describing their
understanding as ‘good’ or ‘excellent’ has almost doubled in the last 12 months, from just under a
fifth (18%) in 2012 to 30% this year.
An increasing number of organisations are finally realising that mobile channels can no longer be
neglected, but it’s not all good news. Understanding the role of mobile in the overall customer
journey and optimising the user experience for mobile devices is not as simple as flipping a switch
and replicating the same approach that was used for the desktop web.

Reducing Customer Struggle 2013 in association with IBM Tealeaf Page 6
All rights reserved. No part of this publication may be reproduced or transmitted in any form or by any means, electronic or mechanical, including photocopy, recording or any information storage
and retrieval system, without prior permission in writing from the publisher. Copyright © Econsultancy.com Ltd 2013
Survey respondents were asked if they agreed or
disagreed with some statements and two in five
companies (40%) believe that delivering
customer experiences is harder on mobile
than the web.
Last year, we highlighted a significant discrepancy
in how companies specifically rate their
understanding of the mobile experience for their
customers, compared to the overall online
experience. We’ve again sought to analyse this in
more detail and while the gap between the two has
started to narrow in the last 12 months, companies
are still playing catch-up.
Just under a third (30%) of responding
organisations describe their understanding
of the mobile user experience as ‘excellent’
or ‘good’, compared to 44% for the overall online
experience. In 2012, less than a fifth (18%) said
they had a good or excellent understanding of the
mobile experience (compared to 45% for the overall online experience).
Figure 1: How companies rate their understanding of the mobile user experience (compared to the overall online customer experience)
In terms of how companies optimise for mobile, around half of responding organisations
indicated they use responsive design (client-side)1, while only a fifth (22%) use adaptive
design (server-side). This shows that many companies are just trying to make an existing website
work acceptably well on mobile devices, rather than build the mobile experience from the ground
1 With responsive design, the device itself does the work when it comes to displaying the re-sized images and optimised layout. In the case of adaptive design, the server does the work and delivers the page already optimised.
40% of companies agree that ‘delivering positive customer
experiences is harder on mobile than the web’

Reducing Customer Struggle 2013 in association with IBM Tealeaf Page 7
All rights reserved. No part of this publication may be reproduced or transmitted in any form or by any means, electronic or mechanical, including photocopy, recording or any information storage
and retrieval system, without prior permission in writing from the publisher. Copyright © Econsultancy.com Ltd 2013
up. While adaptive design might seem the better choice because it allows you to go the extra mile
and take advantage of the additional features mobile devices have to offer, it’s not always black
and white.
The technical differences between the two approaches are not paramount; companies should be
focused on ensuring that content is optimised for their audiences no matter what devices they’re
using rather than getting bogged down in technical debates.
Other mobile-related findings include:
When looking at the issues customers encounter when they interact with companies via
mobile devices, bad navigation / poor ‘findability’ has emerged as the most
serious issue. Just over a third (36%) say that this is the most serious issue for their
customers, up from 28% last year. The proportion of organisations singling out form-filling
problems has also increased in the last 12 months, from 18% in 2012 to 26% this year.
Compared to European respondents, a higher proportion of those based in North America
consider mobile to be ‘critical’ to their business objectives – 39% compared to 27% of those
based in Europe.
More than half (55%) of companies surveyed indicated they have developed a mobile
optimised site, with around two in five (44%) saying they developed an iPhone app and 33%
having developed an Android phone app.
North American organisations are more likely to have a dedicated mobile team than those
based in Europe, with just over a quarter (28%) saying this is the case (compared to 11% of
European respondents).
Survey respondents were also asked if there are any specific challenges they face when trying
to address the mobile customer experience. Analysis of verbatim answers revealed that many
organisations are plagued with disjointed internal processes and the lack of dedicated mobile
teams only exacerbates this problem.
This is also evident from the quantitative analysis, with only 14% of companies surveyed
saying they have a dedicated mobile team. For just over a third (38%) of respondents,
the ecommerce team is ultimately responsible for the mobile experience. Marketing (25%) is
the department next most likely to be responsible for this.
2. Companies continue to wrestle with familiar customer experience
challenges
While mobile is a focus for many companies, it is clear from this year’s research that wider
online customer experience challenges still remain for many organisations, both in
terms of understanding customer struggle and also addressing pain points.
The proportion of organisations rating their understanding of the overall online customer
experience as ‘excellent’ has increased from 4% in 2012 to 7% this year. A further 78% of
respondents say their company has a ‘good’ or ‘okay’ understanding.
As was the case last year, respondents are more likely to say they have a good understanding of
how customers behave during the initial, awareness stages of the sales funnel. Where companies
have least understanding is around the purchase stages, more specifically around the reasons
behind cart abandonment.
Information relating to conversion rate optimisation is highly valued, but this is also the
information they find most difficult to collect, with the vast majority of companies finding it
difficult to collect information relating to the reasons people abandon the shopping cart
(85%) and leave the site without converting (83%).
Encouragingly, companies are twice as likely to have an ‘accurate idea’ of how much online
revenue is lost through site abandonment (15% compared to 7% last year). The proportion of

Reducing Customer Struggle 2013 in association with IBM Tealeaf Page 8
All rights reserved. No part of this publication may be reproduced or transmitted in any form or by any means, electronic or mechanical, including photocopy, recording or any information storage
and retrieval system, without prior permission in writing from the publisher. Copyright © Econsultancy.com Ltd 2013
those who have a ‘vague idea’ has also increased, from around a third (32%) in 2012 to 43%
this year.
When it comes to problem
prioritisation and resolution,
companies are still finding it
difficult to adopt an integrated
approach to addressing the issues
their customers encounter and
improve the quality of the digital
experience. While 67% of
responding companies undertake
regular evaluation of customer
experience or customer
satisfaction, the proportion of
companies doing this has declined
by 9% (from 76%) in the last 12
months. Companies are also less
likely to have formal structures and processes in place, with 46% of organisations now
doing this (down from 49% in 2012).
The research also explored the extent of integration between online and offline channels. The
proportion of responding organisations indicating that the offline parts of their business have
little or no visibility of online customer activity has increased from 61% in 2012 to 67% this year.
Companies are also less likely to describe the understanding of the multichannel
customer experience as ‘excellent’, with only 4% indicating this (compared to 6% last year).
Other findings include:
Digital experience (session) replay has emerged as the most effective method in
helping to understand the customer experience, with three in five companies
considering it ‘very’ effective. However, only a quarter (28%) of companies use this method.
Digital experience replay is also considered the most effective method for identifying
problems or issues with the digital experience, with the proportion of organisations saying
this is a ‘very’ effective method increasing by 10% in the last 12 months.
Although there has been a slight increase in the number of companies using voice of the
customer (+4%) and social listening (+2%) tools, the proportion of those considering them
effective has continued to decline. Although more than half of organisations agree that
social gives them ‘insight into what is working and what is not’, social tools are
considered to be among the least effective (together with offline surveys).
When looking specifically at how organisations integrate the digital and physical
experience, it’s evident that most focus on basic functionality, such as including
information about offline locations, contact details and opening hours on their websites
(63%). The next most popular methods of integrating the digital and physical experience are
establishing a social presence for offline products or services (38%) and mobile or local
search engine optimisation (31%).
For just over two-thirds (70%) of companies surveyed, the ecommerce or digital team is
responsible for the online customer experience. Marketing (58%) is the next most
likely department to be responsible for this.
A higher proportion of North American respondents say their business is able to accurately
quantify the revenue they lose through site abandonment – 20% compared to 13% of
European respondents.
The proportion of companies who measure the difference in conversion rates between visitors
who have experienced specific website issues, and those who don’t experience any issues, has
increased by 9% in the last 12 months.
Reducing Customer Struggle 2013 in association with IBM Tealeaf Page 9
All rights reserved. No part of this publication may be reproduced or transmitted in any form or by any means, electronic or mechanical, including photocopy, recording or any information storage
and retrieval system, without prior permission in writing from the publisher. Copyright © Econsultancy.com Ltd 2013
The survey has again explored the most common and most serious issues customers
encounter on websites. The proportion of companies saying that bad navigation or poor
‘findability’ is the most common issue has decreased by 16% since last year’s survey. However,
over half (57%) of those surveyed consider it the most serious issue, up from 54% in 2012. It’s also
worth noting that security or trust issues (7%) are least common, but organisations are twice as
likely (14%) to consider them serious.

Reducing Customer Struggle 2013 in association with IBM Tealeaf Page 10
All rights reserved. No part of this publication may be reproduced or transmitted in any form or by any means, electronic or mechanical, including photocopy, recording or any information storage
and retrieval system, without prior permission in writing from the publisher. Copyright © Econsultancy.com Ltd 2013
1.1. About Econsultancy Econsultancy is a global independent community-based publisher, focused on best practice digital
marketing and ecommerce, and used by over 400,000 internet professionals every month.
Our hub has 200,000+ subscribers worldwide from clients, agencies and suppliers alike with over
90% subscriber retention rate. We help our subscribers build their internal capabilities via a
combination of research reports and how-to guides, training and development, consultancy, face-
to-face conferences, forums and professional networking.
For the last 10 years, our resources have helped subscribers learn, make better decisions, build
business cases, find the best suppliers, accelerate their careers and lead the way in best practice
and innovation.
Econsultancy has offices in London, New York, Sydney and Singapore and we are a leading
provider of digital marketing training and consultancy. We are providing consultancy and custom
training extensively across Europe, Asia and the US. We train over 5,000 marketers each year.
Join Econsultancy today to learn what’s happening in digital marketing – and what works.
Call us to find out more on +44 (0)20 7269 1450 (London) or +1 212 971 0630 (New York). You
can also contact us online.
Other related Econsultancy reports
Ecommerce Best Practice Compendium
http://econsultancy.com/reports/e-commerce-best-practice-compendium
Quarterly Digital Intelligence Briefing: Digital Trends for 2013
http://econsultancy.com/reports/quarterly-digital-intelligence-briefing-digital-trends-for-2013
The Realities of Online Personalisation
http://econsultancy.com/reports/the-realities-of-online-personalisation-report
Cross-Channel Marketing Trends Briefing: Digital Cream London 2013
http://econsultancy.com/reports/cross-channel-marketing-trends-briefing-digital-cream-london-2013
Marketing Attribution Management Buyer’s Guide 2013
http://econsultancy.com/reports/marketing-attribution-management-buyers-guide
How the Internet Can Save the High Street
http://econsultancy.com/reports/how-the-internet-can-save-the-high-street
The Multichannel Retail Survey
http://econsultancy.com/reports/the-multichannel-retail-survey
Customer Experience & Engagement Statistics
http://econsultancy.com/reports/customer-experience-statistics

Reducing Customer Struggle 2013 in association with IBM Tealeaf Page 11
All rights reserved. No part of this publication may be reproduced or transmitted in any form or by any means, electronic or mechanical, including photocopy, recording or any information storage
and retrieval system, without prior permission in writing from the publisher. Copyright © Econsultancy.com Ltd 2013
1.2. About IBM Tealeaf IBM Tealeaf is a leading provider of digital customer experience management (CEM) and
customer behavior analysis solutions. IBM Tealeaf CEM solutions enable companies to better
understand the “why” of a customer’s online and mobile interactions to enhance the customer
experience.
IBM Tealeaf CEM solutions extend IBM’s quantitative web and digital analytic capabilities in
Coremetrics and Unica solutions with qualitative analytics capabilities to record, replay and
analyze a customer’s digital interactions.
To find out more about IBM Tealeaf’s CEM solutions contact us on +44 (0) 845 87 20 120 (UK) or
+1 415 495 8000 (US) or visit our website http://www.ibm.com/software/marketing-
solutions/tealeaf/.

Reducing Customer Struggle 2013 in association with IBM Tealeaf Page 12
All rights reserved. No part of this publication may be reproduced or transmitted in any form or by any means, electronic or mechanical, including photocopy, recording or any information storage
and retrieval system, without prior permission in writing from the publisher. Copyright © Econsultancy.com Ltd 2013
2. Foreword by IBM Tealeaf The mobile revolution is happening. At the end of 2012, there were a staggering 6.8 billion mobile
subscriptions globally. That is equivalent to 96% of the world population.2
What’s more, one in six handsets are now smartphones3 and by 2016, annual smartphone
shipments worldwide will account for more than half of all handsets shipped.4
So it doesn’t come as a surprise to any of us that mobile devices are rapidly becoming the primary
medium to access the internet to check email, book flights, shop online and interact with social
media.
But how are brands around the world dealing with mobile? Are they embracing it? Shunning it?
Or, running scared? That’s exactly what we wanted to find out in our third and latest, Reducing
Customer Struggle Report from Econsultancy.
The mobile explosion of the past 12 months has been phenomenal and in this year’s study we
wanted to delve deeper into the mobile customer experience. After all, as we found in last year’s
report, customers expect you to have a perfect mobile specific website and a mobile app and they
increasingly expect the experience delivered by both of these to be second to none.
But here’s the catch, customer expectation today on mobile devices is higher than ever. If the
mobile experience isn’t right first time, customers won’t come back.
Most organisations do understand and recognise the importance of mobile channels but they
don’t always get it right. This has to change. Now. In the next two years everything will become
mobile and access to the internet via a mobile device will become the ‘norm’.
Companies only have one chance with mobile and if they get it wrong, they risk losing out in an
increasingly mobile world.
Get it right, and you will reap the rewards. And this report will help you do just that. It will give
you an insight into what customers want, enhance your understanding of the user journey and
enable you to identify consumer personas. All the while, helping you to deliver a customer
experience strategy that works for your business and your customers.
Geoff Galat
Vice President Marketing
IBM Tealeaf
2 The International Telecommunications Union (February 2013) 3 Portio Research (January 2013) 4 Portio Research (January 2013)

Reducing Customer Struggle 2013 in association with IBM Tealeaf Page 13
All rights reserved. No part of this publication may be reproduced or transmitted in any form or by any means, electronic or mechanical, including photocopy, recording or any information storage
and retrieval system, without prior permission in writing from the publisher. Copyright © Econsultancy.com Ltd 2013
3. Methodology and Sample
3.1. Methodology The Reducing Customer Struggle report is based on an international online survey of more
than 500 business professionals working for companies involved in ecommerce and e-business.
The survey was live during March and April 2013.
Econsultancy promoted the survey to its community of digital marketers and ecommerce
professionals, offering a complimentary copy of this report as the incentive for taking part. IBM
Tealeaf, the research sponsor, also promoted the survey to its contacts.
If you have any questions about the research and methodology, please email Linus Gregoriadis at
Econsultancy ([email protected]).
3.2. Respondent profiles A total of 582 respondents who are employees at an ecommerce or e-business company took part in the survey. The best represented geographies were the UK (44%) and North America (25%). For a more detailed profiling of respondents, see Section 5.
The chart below shows that survey respondents are typically senior within a business, with just
under a third classifying themselves either as heads of digital or ecommerce / VPs (17%) or
business owners / C-level executives / CMOs (11%). Over a quarter of respondents are marketing
managers responsible either for multiple channels (21%) or for a single channel (8%).
Figure 2: Which best describes your level or position within the company?
Respondents: 519
Reducing Customer Struggle 2013 in association with IBM Tealeaf Page 14
All rights reserved. No part of this publication may be reproduced or transmitted in any form or by any means, electronic or mechanical, including photocopy, recording or any information storage
and retrieval system, without prior permission in writing from the publisher. Copyright © Econsultancy.com Ltd 2013
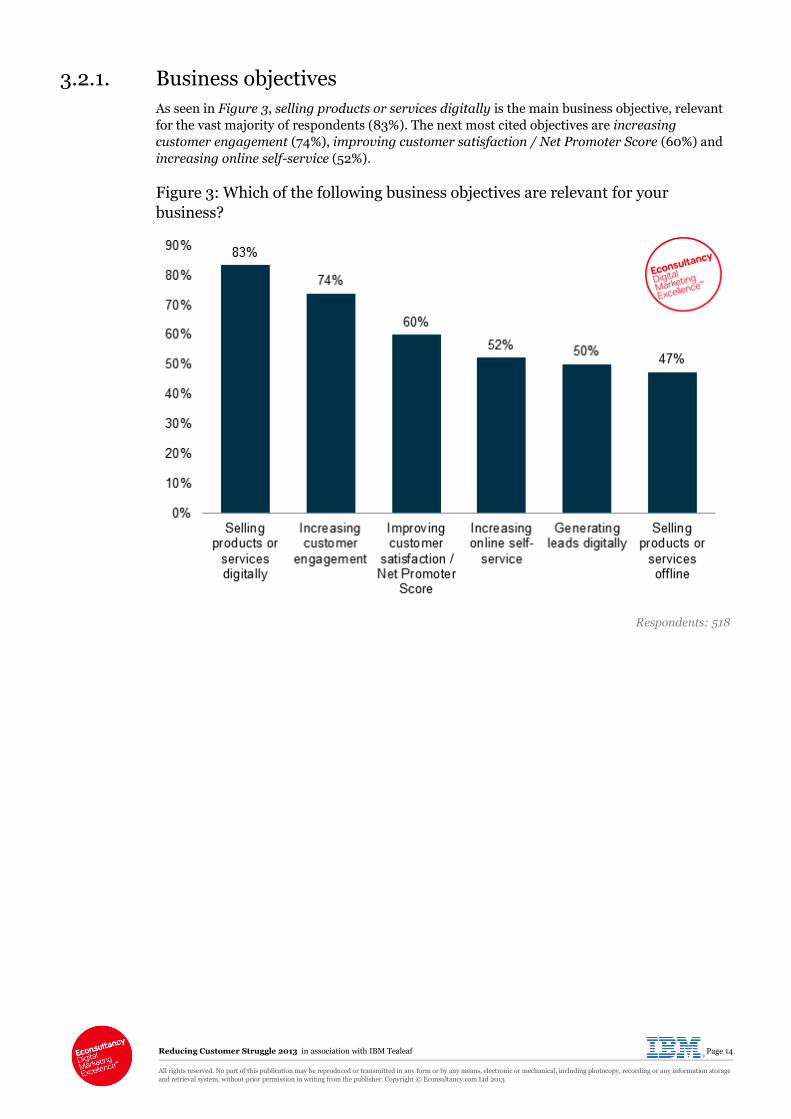
3.2.1. Business objectives
As seen in Figure 3, selling products or services digitally is the main business objective, relevant
for the vast majority of respondents (83%). The next most cited objectives are increasing
customer engagement (74%), improving customer satisfaction / Net Promoter Score (60%) and
increasing online self-service (52%).
Figure 3: Which of the following business objectives are relevant for your
business?
Respondents: 518

Reducing Customer Struggle 2013 in association with IBM Tealeaf Page 15
All rights reserved. No part of this publication may be reproduced or transmitted in any form or by any means, electronic or mechanical, including photocopy, recording or any information storage
and retrieval system, without prior permission in writing from the publisher. Copyright © Econsultancy.com Ltd 2013
4. Findings
4.1. Understanding the digital customer experience
4.1.1. Understanding types of customer behaviour
In this year’s research, we have again sought to understand in more detail how well companies
understand different types of customer behaviour along various stages of the sales funnel
(awareness, consideration and purchase). We have also analysed how valuable that information is
(Section 4.1.2), and how difficult it is to collect it (Section 4.1.3).
Figure 4: Sales funnel stages
From a range of types of customer behaviour, respondents are most likely to say that they have a
‘good understanding’ of how people become aware of their brand or website (68%) or where
people come from before visiting their website (56%) [Figure 5].
Companies also have a better understanding of what types of content make people more likely to
convert (48%), the value of visitors from different sources of traffic (48%) and the reasons for
making a purchase (43%).
At the opposite end of the spectrum, companies are more likely to have ‘limited’ or ‘no
understanding’ of behaviours of different visitor types (78%) or the reasons for abandoning the
shopping cart or transaction (73%).

Reducing Customer Struggle 2013 in association with IBM Tealeaf Page 16
All rights reserved. No part of this publication may be reproduced or transmitted in any form or by any means, electronic or mechanical, including photocopy, recording or any information storage
and retrieval system, without prior permission in writing from the publisher. Copyright © Econsultancy.com Ltd 2013
Figure 5: How well does your company understand the reasons for the following
activity?
Respondents: 475

Reducing Customer Struggle 2013 in association with IBM Tealeaf Page 17
All rights reserved. No part of this publication may be reproduced or transmitted in any form or by any means, electronic or mechanical, including photocopy, recording or any information storage
and retrieval system, without prior permission in writing from the publisher. Copyright © Econsultancy.com Ltd 2013
4.1.2. Value of different types of customer behaviour
As the chart below shows, the vast majority of companies consider that knowing what usability
issues are most likely to affect the conversion is ‘very valuable’ (80%). Information relating to
conversion rate optimisation (CRO) is also highly valued, with just over three-quarters of
respondents saying that knowing why people abandon the shopping cart or transaction (79%) or
why visitors leave the site without converting (78%) is very valuable.
At the other end of the spectrum, just under half (48%) of organisations surveyed regard traffic
sources (where people come from before visiting your website) as ‘very’ valuable information.
Figure 6: How valuable or potentially valuable is the following information for
your business?
Respondents: 442

Reducing Customer Struggle 2013 in association with IBM Tealeaf Page 18
All rights reserved. No part of this publication may be reproduced or transmitted in any form or by any means, electronic or mechanical, including photocopy, recording or any information storage
and retrieval system, without prior permission in writing from the publisher. Copyright © Econsultancy.com Ltd 2013
4.1.3. Difficulty collecting information about customer behaviour
As was the case last year, the vast majority of companies surveyed are more likely to find it
difficult (including ‘very’ and ‘quite’) to collect information around two of the most highly valued
areas: why people abandon the shopping cart or transaction (85%) and why visitors leave the
site without converting (83%).
Around half of responding organisations find it easy to collect information about how they
behave on different devices (46%), what people are most likely to do on their first visit (51%) and
where they come from before visiting their websites (59%).
Figure 7: How difficult is it to collect the following information?
Respondents: 428

Reducing Customer Struggle 2013 in association with IBM Tealeaf Page 19
All rights reserved. No part of this publication may be reproduced or transmitted in any form or by any means, electronic or mechanical, including photocopy, recording or any information storage
and retrieval system, without prior permission in writing from the publisher. Copyright © Econsultancy.com Ltd 2013
4.1.4. Understanding the overall online customer experience
The proportion of companies rating their understanding of the overall online customer experience
as ‘excellent’ has increased from 4% in 2012 to 7% this year.
As was the case last year, over three-quarters (78%) say their company has a ‘good’ (37%) or ‘okay’
(41%) understanding of their customers’ overall online experience. The proportion of companies
rating their understanding of the overall online customer experience as ‘poor’ or ‘very poor’ has
remained roughly the same – 14% compared to 15% last year.
Further analysis revealed that companies in North America are three times as likely to rate their
understanding of the overall online customer experience as ‘excellent’ or ‘good’ as their European
counterparts.
Figure 8: To what extent does your company understand the overall online
customer experience?
Respondents: 419
Respondents 2012: 364 | Respondents 2011: 402
Reducing Customer Struggle 2013 in association with IBM Tealeaf Page 20
All rights reserved. No part of this publication may be reproduced or transmitted in any form or by any means, electronic or mechanical, including photocopy, recording or any information storage
and retrieval system, without prior permission in writing from the publisher. Copyright © Econsultancy.com Ltd 2013
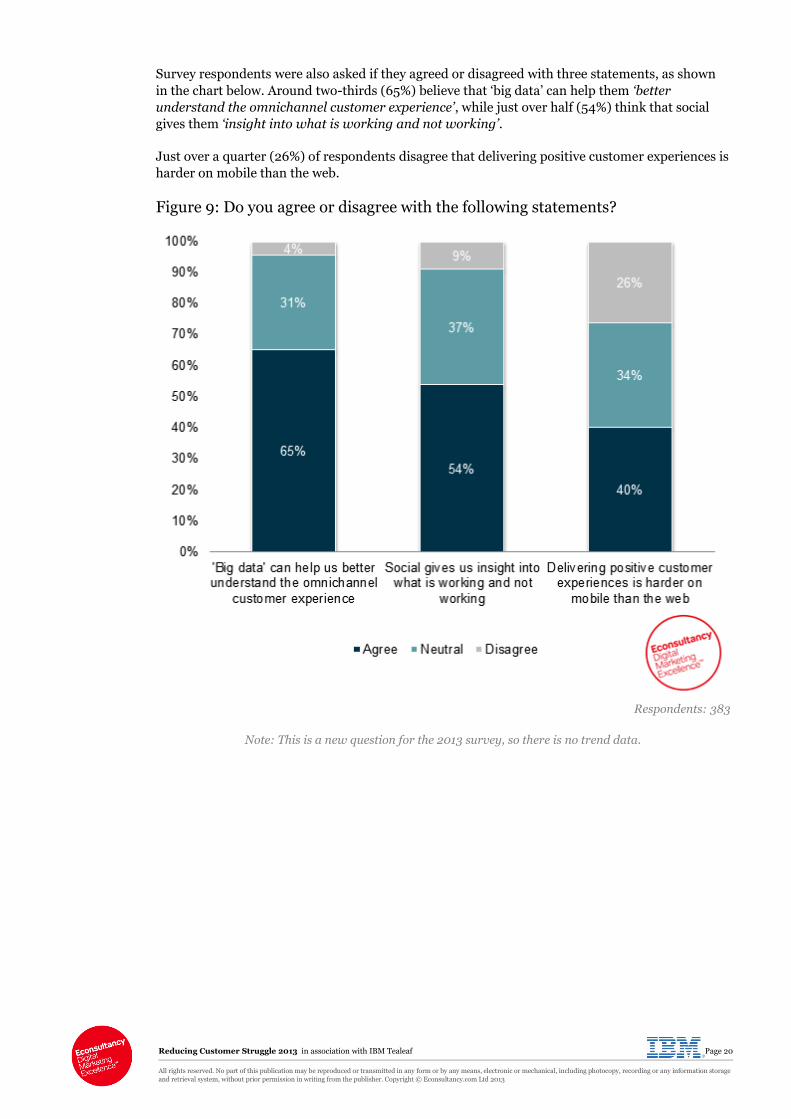
Survey respondents were also asked if they agreed or disagreed with three statements, as shown
in the chart below. Around two-thirds (65%) believe that ‘big data’ can help them ‘better
understand the omnichannel customer experience’, while just over half (54%) think that social
gives them ‘insight into what is working and not working’.
Just over a quarter (26%) of respondents disagree that delivering positive customer experiences is
harder on mobile than the web.
Figure 9: Do you agree or disagree with the following statements?
Respondents: 383
Note: This is a new question for the 2013 survey, so there is no trend data.

Reducing Customer Struggle 2013 in association with IBM Tealeaf Page 21
All rights reserved. No part of this publication may be reproduced or transmitted in any form or by any means, electronic or mechanical, including photocopy, recording or any information storage
and retrieval system, without prior permission in writing from the publisher. Copyright © Econsultancy.com Ltd 2013
4.1.5. Methods used for understanding the customer experience
As shown in the chart below, responding companies are most likely to use digital analytics (75%)
and online surveys (63%) to understand the digital customer experience. Just over half (53%) of
respondents indicated they use online feedback forms and tools, down from 61% last year.
The proportion of companies using A/B or multivariate testing and social media analysis/voice
of the customer tools has increased by 9% and 4%, respectively.
Figure 10: Which of the following approaches or types of technology does your
company use to understand the digital customer experience?
Respondents 2013: 413
Respondents 2012: 363 | Respondents 2011: 398
Note: ‘Digital analytics’ is a new option for this year’s survey (replacing ‘web analytics’), so there is no
trend data. In 2012, 91% of respondents said they used web analytics.

Reducing Customer Struggle 2013 in association with IBM Tealeaf Page 22
All rights reserved. No part of this publication may be reproduced or transmitted in any form or by any means, electronic or mechanical, including photocopy, recording or any information storage
and retrieval system, without prior permission in writing from the publisher. Copyright © Econsultancy.com Ltd 2013
4.1.6. Effectiveness of different methods
The chart below shows the effectiveness of different approaches and technologies used to
understand the customer experience, as perceived by companies surveyed.
While only 28% of respondents use digital experience (session) replay, the vast majority consider
it to be ‘very’ (60%) or ‘quite’ (34%) effective [Figure 12]. Similarly, 94% consider online focus
groups to be effective in helping to understand the customer experience, but only 18% use them.
Although online surveys represent the second most popular method among organisations
surveyed, only a quarter consider them ‘very’ effective.
As shown in the previous section, the proportion of companies using social media analysis/voice
of the customer tools and online reputation monitoring/social listening has increased in the last
12 months. However, they’re considered to be among the least effective approaches, with 24% and
22%, respectively saying they’re very effective.
Further analysis showed that North American respondents are twice as likely to rate online
reputation monitoring or social listening as a ‘very effective’ method than those based in Europe
(30% compared to 15% of European respondents).
Figure 11: How effective are these approaches in helping to understand the
customer experience?
Respondents: 300

Reducing Customer Struggle 2013 in association with IBM Tealeaf Page 23
All rights reserved. No part of this publication may be reproduced or transmitted in any form or by any means, electronic or mechanical, including photocopy, recording or any information storage
and retrieval system, without prior permission in writing from the publisher. Copyright © Econsultancy.com Ltd 2013
Figure 12: Methods used to understand the customer experience

Reducing Customer Struggle 2013 in association with IBM Tealeaf Page 24
All rights reserved. No part of this publication may be reproduced or transmitted in any form or by any means, electronic or mechanical, including photocopy, recording or any information storage
and retrieval system, without prior permission in writing from the publisher. Copyright © Econsultancy.com Ltd 2013
4.1.7. Responsibility for online customer experience
For just over two-thirds (70%) of responding companies, the ecommerce or digital team is
responsible for the online customer experience. Marketing (58%) is the next most likely
department to be responsible for this.
Web development and IT teams are responsible for online customer experience in around a third
of organisations – 38% and 32%, respectively.
Figure 13: Which business departments have responsibility for the online
customer experience?
Respondents 2013: 386
Respondents 2012: 325
Note: Respondents could select multiple options.

Reducing Customer Struggle 2013 in association with IBM Tealeaf Page 25
All rights reserved. No part of this publication may be reproduced or transmitted in any form or by any means, electronic or mechanical, including photocopy, recording or any information storage
and retrieval system, without prior permission in writing from the publisher. Copyright © Econsultancy.com Ltd 2013
4.1.8. Barriers to understanding the online customer experience
For the third year in a row, lack of skilled analysts (48%) is considered to be the main barrier to a
better understanding of the online customer experience. Insufficient budget is the second biggest
concern (39%).
The proportion of companies who indicate that the lack of processes or workflow and a low
business priority is a significant barrier has increased by 5% and 6% respectively in the last 12
months.
Figure 14: What is preventing your business from gaining a better understanding
of the online customer experience?
Respondents 2013: 384
Respondents 2012: 338 | Respondents 2011: 378
Note: Respondents could select up to three options.

Reducing Customer Struggle 2013 in association with IBM Tealeaf Page 26
All rights reserved. No part of this publication may be reproduced or transmitted in any form or by any means, electronic or mechanical, including photocopy, recording or any information storage
and retrieval system, without prior permission in writing from the publisher. Copyright © Econsultancy.com Ltd 2013
Survey respondents were asked to indicate if there was anything in particular that has given their
business valuable insights into the online customer experience. A selection of responses are
shown below, while the size of the words in the tag cloud indicate the number of times a particular
word was used by respondents.
Analysis of verbatim answers revealed that user testing and direct feedback from customers
typically provide the most valuable insights into the online experience of individual customers.
Figure 15: Is there anything in particular that has given your business valuable
insights into the online customer experience?
Powered by Wordle™
Is there anything in particular that has given your business valuable insights into
the online customer experience?
“Many things provide valuable insights; however the issue is they are reactive. The most valuable insight is
knowing when it is happening, not after it happened.”
“Running beta testing with people from different industries and with varying degrees of digital experience to help
understand how different customer types respond to our digital offer.”
“A/B testing has helped to highlight and prove theories on customer abandonment, allowing us to streamline and
optimise processes to increase website usability.”
“Matching their comments in social media with their behaviour on the website.”
“My team has developed a unique Customer Listening Process which yields highly actionable data for identifying
and quantifying customer experience issues in the short term, while also yielding valuable analytics with a
medium-long term focus. Significant and quantified benefits have been demonstrated by implementing this
process across our various listening posts.”
Survey respondents

Reducing Customer Struggle 2013 in association with IBM Tealeaf Page 27
All rights reserved. No part of this publication may be reproduced or transmitted in any form or by any means, electronic or mechanical, including photocopy, recording or any information storage
and retrieval system, without prior permission in writing from the publisher. Copyright © Econsultancy.com Ltd 2013
4.2. Problems or issues with the online experience
4.2.1. Discovering issues with the online experience
Asked how they normally discover problems or issues with the digital experience, three-quarters
(74%) of companies surveyed said they typically discover them through direct customer feedback,
such as calls to customer service teams and customer emails (down by 4% since 2012).
Just over half (53%) of respondents say they discover issues by looking at digital analytics.
Compared to last year, organisations are more likely to use online contact forms (an increase of
5%), customer surveys (+4%), online feedback tools (+4%) and digital experience replay (+6%).
Figure 16: How does your organisation normally discover problems or issues with
the digital experience?
Respondents 2013: 384
Respondents 2012: 338 | Respondents 2011: 378
Note: ‘Digital analytics’ is a new option for this year’s survey (replacing ‘web analytics’), so there is no
trend data. In 2012, 60% of respondents said they used web analytics.

Reducing Customer Struggle 2013 in association with IBM Tealeaf Page 28
All rights reserved. No part of this publication may be reproduced or transmitted in any form or by any means, electronic or mechanical, including photocopy, recording or any information storage
and retrieval system, without prior permission in writing from the publisher. Copyright © Econsultancy.com Ltd 2013
4.2.2. Effectiveness of different approaches to identifying problems
As was the case last year, digital experience (session) replay is considered the most effective
method for identifying problems or issues with the digital experience, with the vast majority
(98%) of responding organisations considering it ‘very’ (67%) or ‘quite’ (31%) effective. The
proportion of respondents rating it as a ‘very effective’ method has increased by 10% in the last 12
months.
Calls to customer service teams (41%) and digital analytics (40%) are the next most effective
approaches. Although only a fifth of respondents use usability/heatmaps to identify problems or
issues with the digital experience (it’s the least used method), more than a third (38%) of
respondents say this is ‘very effective’ [Figure 18].
Similarly, calls to customer service teams and customer emails are the most commonly used
methods, but only 41% and 34% respectively consider them very effective.
Figure 17: How effective are the following for identifying problems or issues with
the digital experience?
Respondents: 291

Reducing Customer Struggle 2013 in association with IBM Tealeaf Page 29
All rights reserved. No part of this publication may be reproduced or transmitted in any form or by any means, electronic or mechanical, including photocopy, recording or any information storage
and retrieval system, without prior permission in writing from the publisher. Copyright © Econsultancy.com Ltd 2013
Figure 18: Methods used for identifying problems or issues with the digital
experience

Reducing Customer Struggle 2013 in association with IBM Tealeaf Page 30
All rights reserved. No part of this publication may be reproduced or transmitted in any form or by any means, electronic or mechanical, including photocopy, recording or any information storage
and retrieval system, without prior permission in writing from the publisher. Copyright © Econsultancy.com Ltd 2013
4.2.3. Most common website issues
As the chart below shows, the proportion of companies saying that bad navigation or poor
‘findability’ is the most common issue their customers encounter on their websites has decreased
by 16% since last year’s survey.
Lack of information (26%) is the second most common issue, while checkout (25%) and form-
filling (23%) problems affect customers of one quarter of survey respondents.
The proportion of companies saying that payment problems and routeing or process issues are
common issues has been gradually decreasing in the last two years, with less than a fifth of
respondents indicating this. Encouragingly, the proportion of organisations for whom security or
trust issues are common has almost halved in the last 12 months, from 13% in 2012 to 7% this
year.
Figure 19: What are the most common issues your customers encounter on your
company’s website(s)?
Respondents 2013: 192
Respondents 2012: 158 | Respondents 2011: 168
Note: Respondents could select up to three options.

Reducing Customer Struggle 2013 in association with IBM Tealeaf Page 31
All rights reserved. No part of this publication may be reproduced or transmitted in any form or by any means, electronic or mechanical, including photocopy, recording or any information storage
and retrieval system, without prior permission in writing from the publisher. Copyright © Econsultancy.com Ltd 2013
4.2.4. Most serious website issues
As shown in the chart below, around three in five companies consider bad navigation or poor
‘findability’ the most serious issue their customers encounter on their websites. Over a quarter
(27%) of respondents think that a lack of information represents the most serious issue for their
customers, down from just over a third (35%) one year ago.
It’s worth noting that the proportion of companies considering registration problems (25%) a
serious issue has increased by 10% in the last 12 months. Although registration-related issues are
less common (fifth most common issue), companies are more likely to consider them serious
[Figure 21].
Figure 20: What do you think are the most serious issues your customers
encounter on your company’s website(s)?
Respondents 2013: 190
Respondents 2012: 156 | Respondents 2011: 166
Note: Respondents could select up to three options.

Reducing Customer Struggle 2013 in association with IBM Tealeaf Page 32
All rights reserved. No part of this publication may be reproduced or transmitted in any form or by any means, electronic or mechanical, including photocopy, recording or any information storage
and retrieval system, without prior permission in writing from the publisher. Copyright © Econsultancy.com Ltd 2013
Figure 21: Most common vs most serious issues customers encounter on
respondents’ websites

Reducing Customer Struggle 2013 in association with IBM Tealeaf Page 33
All rights reserved. No part of this publication may be reproduced or transmitted in any form or by any means, electronic or mechanical, including photocopy, recording or any information storage
and retrieval system, without prior permission in writing from the publisher. Copyright © Econsultancy.com Ltd 2013
4.2.5. Quantifying lost revenue
As Figure 22 shows, the proportion of responding companies saying they have an ‘accurate idea’
of how much online revenue they lose through site abandonment has doubled, from 7% in 2012 to
15% this year.
Encouragingly, the proportion of organisations who are not able to quantify how much online
revenue is lost has declined significantly in the last 12 months, from 61% to 42%.
A higher proportion of North American respondents say their business is able to accurately
quantify the lost revenue – 20% compared to 13% of European respondents.
Figure 22: Is your business able to quantify how much online revenue is lost
through site abandonment due to poor online user experience?
Respondents 2013: 390
Respondents 2012: 328 | Respondents 2011: 345
Reducing Customer Struggle 2013 in association with IBM Tealeaf Page 34
All rights reserved. No part of this publication may be reproduced or transmitted in any form or by any means, electronic or mechanical, including photocopy, recording or any information storage
and retrieval system, without prior permission in writing from the publisher. Copyright © Econsultancy.com Ltd 2013
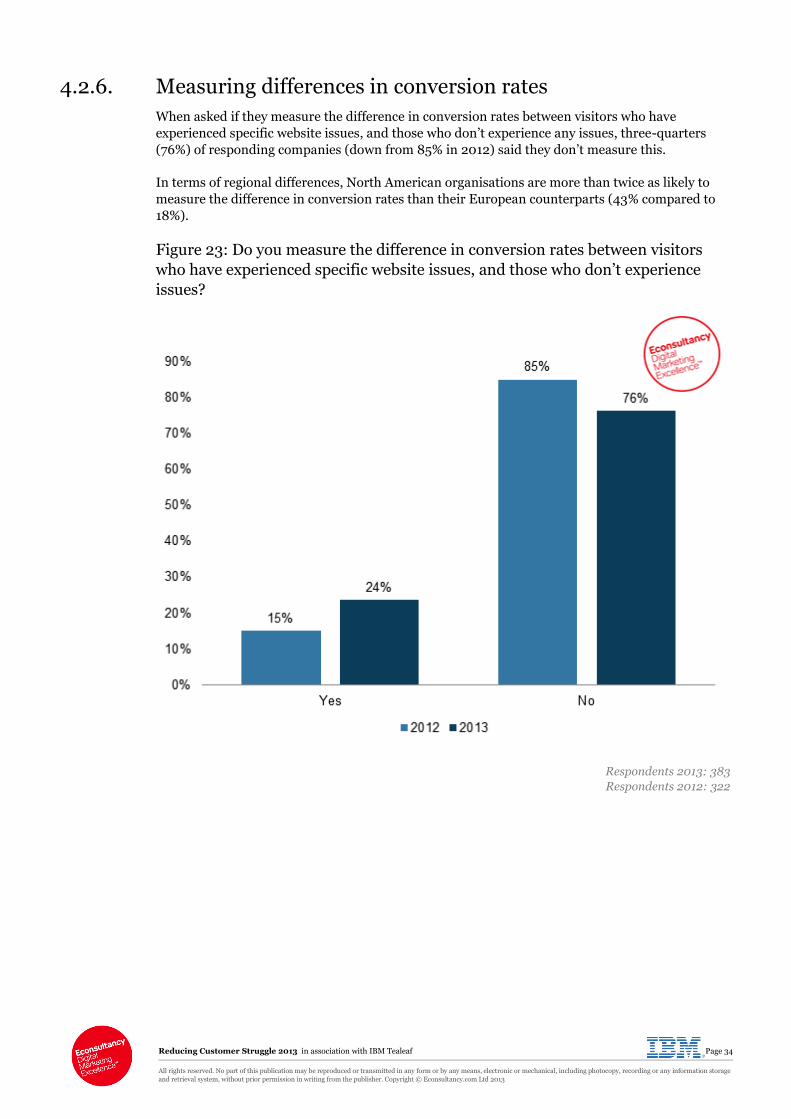
4.2.6. Measuring differences in conversion rates
When asked if they measure the difference in conversion rates between visitors who have
experienced specific website issues, and those who don’t experience any issues, three-quarters
(76%) of responding companies (down from 85% in 2012) said they don’t measure this.
In terms of regional differences, North American organisations are more than twice as likely to
measure the difference in conversion rates than their European counterparts (43% compared to
18%).
Figure 23: Do you measure the difference in conversion rates between visitors
who have experienced specific website issues, and those who don’t experience
issues?
Respondents 2013: 383
Respondents 2012: 322

Reducing Customer Struggle 2013 in association with IBM Tealeaf Page 35
All rights reserved. No part of this publication may be reproduced or transmitted in any form or by any means, electronic or mechanical, including photocopy, recording or any information storage
and retrieval system, without prior permission in writing from the publisher. Copyright © Econsultancy.com Ltd 2013
4.2.7. Prioritising problems and issues customers face online
The proportion of companies surveyed who have processes in place for prioritising problems and
issues customers face online and then addressing then has remained roughly the same, with
three-quarters (77%) indicating this.
Compared to European companies, those based in North America are more likely to have a
documented process in place for collecting and routeing issues, with just over a third (35%)
indicating this (compared to 23% of European respondents).
Figure 24: Does your company have processes in place for prioritising problems
and issues customers face online and then addressing them?
Respondents 2013: 390
Respondents 2012: 329

Reducing Customer Struggle 2013 in association with IBM Tealeaf Page 36
All rights reserved. No part of this publication may be reproduced or transmitted in any form or by any means, electronic or mechanical, including photocopy, recording or any information storage
and retrieval system, without prior permission in writing from the publisher. Copyright © Econsultancy.com Ltd 2013
4.2.8. Business initiatives to improve customer experience quality
Figure 25 shows the level of uptake for a range of internal initiatives businesses use to improve
the quality of the customer experience. As was the case last year, the most common activity
respondents focus on is regular evaluation of customer experience or customer satisfaction
(67%). However, the proportion of companies indicating this has declined by 9% in the last 12
months.
The proportion of companies having formal structures and processes in place to improve
customer experience has also declined, with 46% of respondents reporting this (compared to 49%
last year).
Compared to last year, more companies (+3%) say they measure teams or departments on
customer satisfaction (or Net Promoter Score).
Figure 25: In what ways does your business try to focus internally to improve the
quality of the customer experience?
Respondents 2013: 366
Respondents 2012: 319 | Respondents 2011: 333

Reducing Customer Struggle 2013 in association with IBM Tealeaf Page 37
All rights reserved. No part of this publication may be reproduced or transmitted in any form or by any means, electronic or mechanical, including photocopy, recording or any information storage
and retrieval system, without prior permission in writing from the publisher. Copyright © Econsultancy.com Ltd 2013
4.3. Use of customer channels
4.3.1. Change in investment in customer channels
Just under three-quarters (73%) of companies surveyed plan to increase investment in online
channels in 2013 and a similar proportion of respondents (72%) plan to invest more in mobile
channels.
Offline channels (stores / shops / branches, call centres and mail order) represent a high priority
over the coming months for a significantly lower proportion of companies, with more than two-
thirds of respondents saying they either plan to decrease or maintain the same level of investment
in these channels.
Figure 26: Are you increasing or decreasing investment in the following channels
this year?
Respondents: 386

Reducing Customer Struggle 2013 in association with IBM Tealeaf Page 38
All rights reserved. No part of this publication may be reproduced or transmitted in any form or by any means, electronic or mechanical, including photocopy, recording or any information storage
and retrieval system, without prior permission in writing from the publisher. Copyright © Econsultancy.com Ltd 2013
4.3.2. Quality of customer experience for different channels
For the third year in a row, just over half (52%) of the companies surveyed rate stores / shops /
branches as ‘good’ for quality of customer experience. At the other end of the spectrum,
companies are twice as likely to rate mail order as ‘poor’ than last year.
The proportion of organisations considering that the quality of customer experience via mobile is
poor has continued to decline, from just under a third (31%) in 2012 to 26% this year.
Further interrogation of the data revealed that North America respondents are more likely to rate
the quality of customer experience via mobile as ‘good’: just over a quarter (26%) compared to
15% of European respondents.
Figure 27: Please rate these channels for quality of customer experience.
Respondents: 373
Note: ‘Social’ is a new option for this year’s survey, so there is no trend data.

Reducing Customer Struggle 2013 in association with IBM Tealeaf Page 39
All rights reserved. No part of this publication may be reproduced or transmitted in any form or by any means, electronic or mechanical, including photocopy, recording or any information storage
and retrieval system, without prior permission in writing from the publisher. Copyright © Econsultancy.com Ltd 2013
4.4. Integrating online with offline channels
4.4.1. Visibility into online customer activity
The proportion of companies saying that the offline parts of their business have very good
visibility of how individual customers are engaging with digital channels has slightly declined in
the last 12 months, from 9% in 2012 to 7% this year.
The proportion of respondents indicating that the offline parts of their business have little or no
visibility has increased, from 61% in 2012 to 67% this year.
Figure 28: Do the offline parts of your business have visibility of how individual
customers have engaged with your digital channels?
Respondents 2013: 371
Respondents 2012: 318 | Respondents 2011: 334
Responding organisations were asked to describe how the offline parts of their businesses get
insight into individual online customer activity.
While mention of particular approaches and technologies, such as regular reporting, shared data
between teams and use of digital analytics featured frequently (as shown in the word cloud on the
next page), descriptive responses were more broad in nature with different tactics and methods
being mentioned.

Reducing Customer Struggle 2013 in association with IBM Tealeaf Page 40
All rights reserved. No part of this publication may be reproduced or transmitted in any form or by any means, electronic or mechanical, including photocopy, recording or any information storage
and retrieval system, without prior permission in writing from the publisher. Copyright © Econsultancy.com Ltd 2013
Figure 29: How do offline parts of the business get this insight?
Powered by Wordle™

Reducing Customer Struggle 2013 in association with IBM Tealeaf Page 41
All rights reserved. No part of this publication may be reproduced or transmitted in any form or by any means, electronic or mechanical, including photocopy, recording or any information storage
and retrieval system, without prior permission in writing from the publisher. Copyright © Econsultancy.com Ltd 2013
4.4.2. Rating of multichannel customer experience
Compared to last year, the proportion of companies describing the multichannel customer
experience they provide as ‘excellent’ has slightly declined, from 6% in 2012 to 4% this year.
Just under half (47%) of responding organisations describe the multichannel experience they
provide as ‘okay’. The proportion of those describing it as ‘poor’ or ‘very poor’ has remained
roughly unchanged in the last 12 months.
Figure 30: How would you describe the multichannel customer experience for
your customers?
Respondents 2013: 371
Respondents 2012: 318 | Respondents 2011: 334

Reducing Customer Struggle 2013 in association with IBM Tealeaf Page 42
All rights reserved. No part of this publication may be reproduced or transmitted in any form or by any means, electronic or mechanical, including photocopy, recording or any information storage
and retrieval system, without prior permission in writing from the publisher. Copyright © Econsultancy.com Ltd 2013
4.4.3. Integrating the digital and physical experience
When asked how they integrate the digital and physical experience, just under two-thirds (63%)
of survey respondents indicated they include information about offline locations, contact details
and opening hours on their websites. However, only 23% offer click-to-call functionality.
Social media is not only popular with pure-plays, as just over a third (38%) of respondents said
their offline products or services have a social presence. The third most popular method of
integrating the digital and physical experience is mobile or local search engine optimisation, with
just under a third (31%) using this.
Less than a fifth (18%) of responding organisations said they offer ‘reserve and collect’ services. A
separate survey5 conducted by Econsultancy last year revealed that 80% of customers had used
these services in the past 12 months. Given their popularity and the rapid growth of mobile
commerce, this represents a missed opportunity for retailers.
Figure 31: How does your company integrate the digital and physical experience?
Respondents: 156
Note: This question was conditional on having an offline presence.
5 http://highstreetreport.econsultancy.com/

Reducing Customer Struggle 2013 in association with IBM Tealeaf Page 43
All rights reserved. No part of this publication may be reproduced or transmitted in any form or by any means, electronic or mechanical, including photocopy, recording or any information storage
and retrieval system, without prior permission in writing from the publisher. Copyright © Econsultancy.com Ltd 2013
Respondents were also asked if there’s anything specific that proved effective in helping to bridge
the gap between physical digital. A selection of these responses is shown in the text box on the
next page.
Is there anything specific your company does which is effective in helping to bridge the gap between physical and digital?
“Developing a detailed multichannel strategy in order to decide which products and services we should push/not push online, plus level of contact options (click-to-call, chat and email). In other words, finding the right mix.”
“Developing digital-based retail centres.”
“Looking into bringing digital displays and online payment alternatives into key stores.”
“Promoting in-store expert staff through the website – very effective in helping drive footfall to stores.”
“QR codes, in-store kiosks and tablets.”
“This is not a gap it is a spectrum – online and offline and translating the strategy into meaningful content to an
individual audience within the brand values (brand vision).”
Survey respondents

Reducing Customer Struggle 2013 in association with IBM Tealeaf Page 44
All rights reserved. No part of this publication may be reproduced or transmitted in any form or by any means, electronic or mechanical, including photocopy, recording or any information storage
and retrieval system, without prior permission in writing from the publisher. Copyright © Econsultancy.com Ltd 2013
4.5. Mobile customer experience
4.5.1. Importance of mobile to business objectives
As the chart below shows, three-quarters of organisations surveyed say that mobile is ‘important’
(42%) or ‘critical’ (32%) to their business objectives. Only 6% of respondents don’t consider
mobile important.
Compared to European respondents, a higher proportion of those based in North America
consider mobile as ‘critical’ to their business objectives – 39% compared to just over a quarter
(27%) of European companies.
Figure 32: Thinking about your customers, how important is mobile to your
business objectives?
Respondents: 362
Note: This is a new question for the 2013 survey, so there is no trend data.

Reducing Customer Struggle 2013 in association with IBM Tealeaf Page 45
All rights reserved. No part of this publication may be reproduced or transmitted in any form or by any means, electronic or mechanical, including photocopy, recording or any information storage
and retrieval system, without prior permission in writing from the publisher. Copyright © Econsultancy.com Ltd 2013
4.5.2. How customers interact with companies via mobile devices
According to three in five (60%) companies surveyed, their customers typically research products
on mobile devices for later purchase online. Almost half (48%) of respondents say their customers
purchase products directly using a mobile device, up by 5% since last year.
A similar proportion report that customers research products for later purchase offline (44%),
while just under a fifth (17%) say they use their mobile devices to research in-store.
Figure 33: How are you customers interacting with you via mobile devices?
Respondents 2013: 345
Respondents 2012: 280

Reducing Customer Struggle 2013 in association with IBM Tealeaf Page 46
All rights reserved. No part of this publication may be reproduced or transmitted in any form or by any means, electronic or mechanical, including photocopy, recording or any information storage
and retrieval system, without prior permission in writing from the publisher. Copyright © Econsultancy.com Ltd 2013
4.5.3. Use of mobile platforms
When asked what mobile platforms they have implemented, more than half (55%) of companies
surveyed indicated they have developed a mobile optimised site, while around two in five (44%)
companies indicated they developed an iPhone app.
A third (33%) of respondents indicated they have developed an Android phone app, while only
17% developed an Android app for tablets.
Figure 34: Which of the following mobile platforms has your business
implemented?
Respondents: 360
Note: This question had different options last year, so there is no trend data.
Reducing Customer Struggle 2013 in association with IBM Tealeaf Page 47
All rights reserved. No part of this publication may be reproduced or transmitted in any form or by any means, electronic or mechanical, including photocopy, recording or any information storage
and retrieval system, without prior permission in writing from the publisher. Copyright © Econsultancy.com Ltd 2013
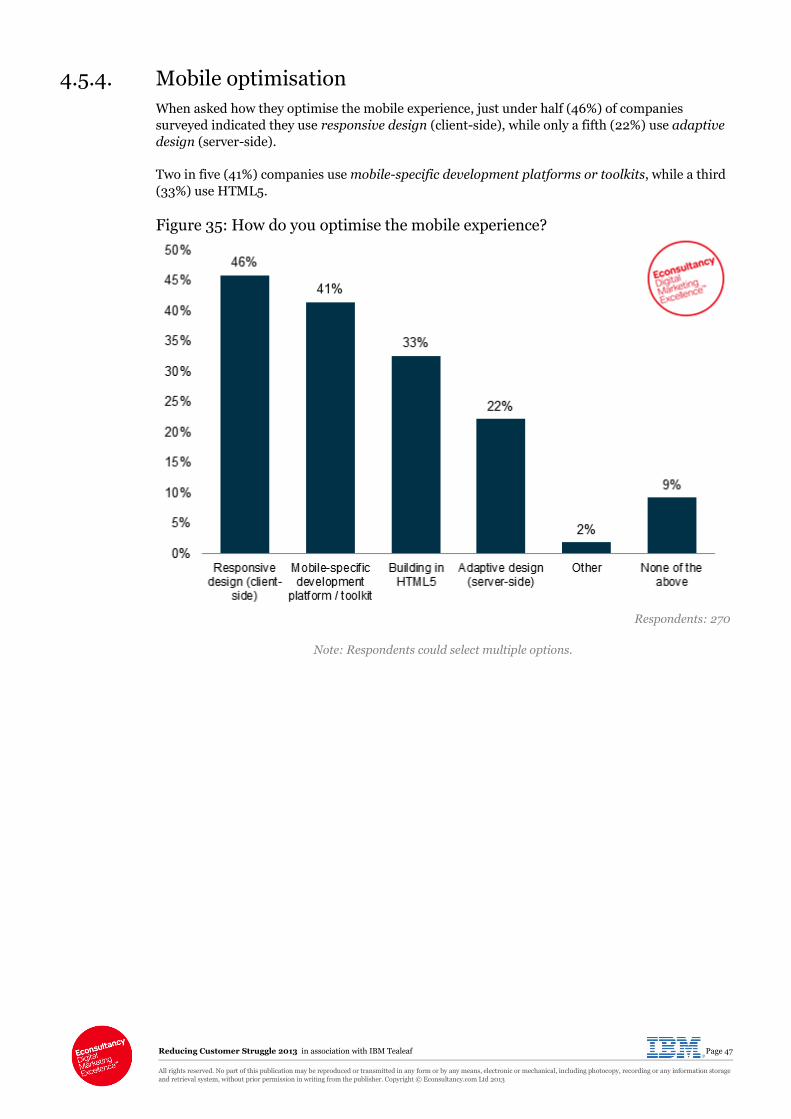
4.5.4. Mobile optimisation
When asked how they optimise the mobile experience, just under half (46%) of companies
surveyed indicated they use responsive design (client-side), while only a fifth (22%) use adaptive
design (server-side).
Two in five (41%) companies use mobile-specific development platforms or toolkits, while a third
(33%) use HTML5.
Figure 35: How do you optimise the mobile experience?
Respondents: 270
Note: Respondents could select multiple options.

Reducing Customer Struggle 2013 in association with IBM Tealeaf Page 48
All rights reserved. No part of this publication may be reproduced or transmitted in any form or by any means, electronic or mechanical, including photocopy, recording or any information storage
and retrieval system, without prior permission in writing from the publisher. Copyright © Econsultancy.com Ltd 2013
4.5.5. Proportion of traffic via mobile devices
Figure 36 shows the proportion of traffic attributed to mobile devices. Around three-quarters
(72%) of responding companies say that mobile accounts for more than 10% of traffic, up from
52% in 2012.
The proportion of respondents who say that more than 20% of their traffic can be attributed to
mobile has more than doubled in the last 12 months, from less than a fifth (17%) in 2012 to 41%
this year.
On average, survey respondents indicate that 19% of their total traffic is via mobile devices, up
from 17% last year.
Figure 36: How much of your total traffic is via mobile devices?
Respondents 2013: 359
Respondents 2012: 314
2012 2013
% of traffic via mobile devices (average) 17% 19%

Reducing Customer Struggle 2013 in association with IBM Tealeaf Page 49
All rights reserved. No part of this publication may be reproduced or transmitted in any form or by any means, electronic or mechanical, including photocopy, recording or any information storage
and retrieval system, without prior permission in writing from the publisher. Copyright © Econsultancy.com Ltd 2013
4.5.6. Understanding the mobile user experience
As Figure 37 shows, the proportion of companies describing their understanding of the mobile
user experience as ‘good’ or ‘excellent’ has almost doubled in the last 12 months, from just under a
fifth (18%) in 2012 to 30% this year. Only 5% of respondents rate their understanding as ‘poor’,
compared to 12% last year.
Figure 37: Please rate your company’s understanding of the mobile user
experience.
Respondents 2013: 360
Respondents 2012: 286

Reducing Customer Struggle 2013 in association with IBM Tealeaf Page 50
All rights reserved. No part of this publication may be reproduced or transmitted in any form or by any means, electronic or mechanical, including photocopy, recording or any information storage
and retrieval system, without prior permission in writing from the publisher. Copyright © Econsultancy.com Ltd 2013
Last year, there was a huge discrepancy in how companies specifically rate their understanding of
the mobile experience for their customers, compared to the overall online experience. The gap
between the two has started to narrow in the last 12 months, as shown in the chart below.
Just under a third (30%) of survey respondents describe their understanding of the mobile user
experience as ‘excellent’ (6%) or ‘good’ (24%), compared to 44% for the overall online experience.
Figure 38: How companies rate their understanding of the mobile user
experience (compared to the overall online customer experience)
Respondents: 360
Survey respondents were also asked if there are any specific challenges they face when trying to
address the mobile customer experience. While the lack of budget and resources was mentioned
frequently, a disjointed approach also seems to be prevalent.
Many respondents seem to be concerned about not having a dedicated team to oversee the mobile
experience and a lack of company-wide vision in terms of what mobile means to them and how
they should approach this channel.

Reducing Customer Struggle 2013 in association with IBM Tealeaf Page 51
All rights reserved. No part of this publication may be reproduced or transmitted in any form or by any means, electronic or mechanical, including photocopy, recording or any information storage
and retrieval system, without prior permission in writing from the publisher. Copyright © Econsultancy.com Ltd 2013
Figure 39: Are there any specific challenges you have when trying to address the
mobile customer experience?
Powered by Wordle™
Are there any specific challenges you have when trying to address the mobile customer experience?
“Aligning mobile with online and offline customer data to provide an integrated view.”
“Internal attitudes towards mobile and doubts it is a viable channel to be concerned about in 2013!”
“Lack of internal resources – people and intelligence.”
Mobile ‘marketing’ site managed by marketing, while mobile ‘client’ site managed by products. Disjointed
experience.”
“Separate teams developing for mobile – no crossover, so disjointed approach resulting in disjointed offering.”
“The same challenge we face universally – no one really responsible and no overarching vision.”
“Technology – not all functionality which is available on desktop can be delivered to mobile devices due to API
restrictions.”
Survey respondents

Reducing Customer Struggle 2013 in association with IBM Tealeaf Page 52
All rights reserved. No part of this publication may be reproduced or transmitted in any form or by any means, electronic or mechanical, including photocopy, recording or any information storage
and retrieval system, without prior permission in writing from the publisher. Copyright © Econsultancy.com Ltd 2013
4.5.7. How customers rate the mobile user experience
Over a quarter (27%) of responding organisations say their customers rate their brand’s mobile
user experience as ‘good’ (23%) or ‘excellent’ (4%), up from a fifth in 2012.
While the proportion of companies indicating their customers rate the mobile user experience as
‘poor’ has slightly increased (from 25% in 2012 to 26% this year), fewer companies say their
customers would describe it as ‘very poor’ (down by 3% since last year).
Figure 40: How would your customers rate your brand’s mobile user experience?
Respondents 2013: 358
Respondents 2012: 308

Reducing Customer Struggle 2013 in association with IBM Tealeaf Page 53
All rights reserved. No part of this publication may be reproduced or transmitted in any form or by any means, electronic or mechanical, including photocopy, recording or any information storage
and retrieval system, without prior permission in writing from the publisher. Copyright © Econsultancy.com Ltd 2013
4.5.8. Most serious mobile issues
The proportion of companies who consider bad navigation / poor ‘findability’ as a serious mobile
issue has increased by 8% in the last year, from just over a quarter (28%) in 2012 to 36% this year.
The same proportion consider scree-sizing issues to be the most serious problems their customers
encounter.
Compared to last year, a significantly higher proportion of organisations say that form-filling
problems represent a serious issue for their customers – 26% compared to just under a fifth
(18%) in 2012.
Figure 41: What do you think are the most serious issues your customers
encounter when they interact with your brand via a mobile device?
Respondents 2013: 351
Respondents 2012: 301
Note: Respondents could select up to three options.

Reducing Customer Struggle 2013 in association with IBM Tealeaf Page 54
All rights reserved. No part of this publication may be reproduced or transmitted in any form or by any means, electronic or mechanical, including photocopy, recording or any information storage
and retrieval system, without prior permission in writing from the publisher. Copyright © Econsultancy.com Ltd 2013
4.5.9. Responsibility for mobile customer experience
For just over a third (38%) of companies surveyed, the ecommerce team is ultimately responsible
for mobile customer experience. Marketing (25%) is the next most likely department to be
responsible for this.
Only 14% of responding companies say they have a dedicated mobile team that’s responsible for
mobile customer experience. North American organisations are more likely to have a dedicated
mobile team than those based in Europe, with just over a quarter (28%) saying that this is the
case (compared to 11% of European respondents).
Figure 42: Who within your business is ultimately responsible for the mobile
customer experience?
Respondents 2013: 355
Respondents 2012: 304
Note: Respondents could select multiple options.

Reducing Customer Struggle 2013 in association with IBM Tealeaf Page 55
All rights reserved. No part of this publication may be reproduced or transmitted in any form or by any means, electronic or mechanical, including photocopy, recording or any information storage
and retrieval system, without prior permission in writing from the publisher. Copyright © Econsultancy.com Ltd 2013
5. Appendix: Respondent Profiles
5.1. Business sector Respondents work across a wide range of business sectors. As seen in the chart below, over a fifth
of respondents (23%) work in the retail or mail order sector, while 15% work in financial
services.
Some 11% of respondents work in the travel sector and 7% work in consumer services. Around a
fifth (18%) of respondents specify ‘other’ as their sector. ‘Other’ in this context includes IT,
telecommunications and public sector.
Figure 43: In which business sector is your organisation or division?
Respondents: 360

Reducing Customer Struggle 2013 in association with IBM Tealeaf Page 56
All rights reserved. No part of this publication may be reproduced or transmitted in any form or by any means, electronic or mechanical, including photocopy, recording or any information storage
and retrieval system, without prior permission in writing from the publisher. Copyright © Econsultancy.com Ltd 2013
5.2. Geography Around two in five respondents (44%) are UK-based, while a quarter are based in North America.
Some 15% are based in Europe (outside UK) and 9% are based in Asia Pacific.
Figure 44: In which country / region are you located?
Respondents: 520

Reducing Customer Struggle 2013 in association with IBM Tealeaf Page 57
All rights reserved. No part of this publication may be reproduced or transmitted in any form or by any means, electronic or mechanical, including photocopy, recording or any information storage
and retrieval system, without prior permission in writing from the publisher. Copyright © Econsultancy.com Ltd 2013
5.3. Size of company by revenue The chart below shows the annual revenue of survey respondents.
Just over a fifth (22%) of respondents work for companies with annual revenues of less than £1 million, while two in five respondents (40%) work for brands with a turnover in excess of £100 million.
Figure 45: Approximately how much revenue did your company generate in
revenue in 2012?
Respondents: 354