Embed Size (px)
Citation preview
Atlantic Marketing Journal
Volume 3 | Issue 3 Article 9
2014
Reducing Cheating Opportunities in Online TestDale VarbleIndiana State University, [email protected]
Follow this and additional works at: http://digitalcommons.kennesaw.edu/amjPart of the Educational Assessment, Evaluation, and Research Commons, and the Marketing
Commons
This Article is brought to you for free and open access by DigitalCommons@Kennesaw State University. It has been accepted for inclusion in AtlanticMarketing Journal by an authorized administrator of DigitalCommons@Kennesaw State University. For more information, please [email protected].
Recommended CitationVarble, Dale (2014) "Reducing Cheating Opportunities in Online Test," Atlantic Marketing Journal: Vol. 3: Iss. 3, Article 9.Available at: http://digitalcommons.kennesaw.edu/amj/vol3/iss3/9
© 2014, Atlantic Marketing Journal
ISSN: 2165-3879 (print), 2165-3887 (electronic)
Atlantic Marketing Journal
Vol. 3, No. 2 (Summer 2014)
131
Reducing Cheating Opportunities in
Online Tests
Dale L. Varble, Indiana State University
Terre Haute, Indiana
Abstract - This paper focuses on reducing cheating opportunities of online test
assessment. Increasing use of online test in all course presentation formats
(online, blended/hybrid or facilitated) has elevated faculty concerns of cheating.
Efforts by educators to reduce cheating have been ongoing and with some
success but, as the results of a study reported here more is needed. Two sections
of a course, one online and one onsite were offered the same semester, with the
same instructor, syllabus, textbook and tests. The online students took all tests
online. The onsite students took all exams online except the last two tests and
final exam which were paper and pencil taken in the classroom. Online students
scored higher than onsite students on all tests with one exception. The scores
were significantly higher when the onsite students took the paper and pencil
tests. Online testing introduces a new testing environment that requires more
thought and care to reduce cheating and uphold academic integrity. Faculty
using online testing must make decisions each semester on how best to achieve
the benefits of online assessment while keeping cheating in check.
Keywords – Online testing, Cheating, Cheating reduction, Test integrity,
Reducing need to cheat, Assessment testing, High and low stakes test
Relevance to Marketing Educators, Researchers and/or Practitioners –
Testing continues to be a popular method of assessing the amount and type of
learning that has occurred. The integrity of the test and the testing process is
fundamental to the validity of the data resulting from tests. As the data collected
from an online section and a face-to-face section of the same course in this
research demonstrates. Marketing educators teaching online courses have a
number of decisions to make that impact the integrity of the test results. The
decisions involve three major conditions; the opportunity to cheat, the need
and/or reward of cheating and the rationalization/attitude of the cheater.
Reducing Cheating Opportunities in Online Tests Atlantic Marketing Journal | 132
Introduction
Online test assessment usage has grown. At least one online course was taken
by 6.7 million students in 2012, Allen and Seaman (2013). An online course as
defined by Allen and Seaman has 80+% of the material delivered online.
Instructors may also opt to use the online mode of test delivery in
blended/hybrid and web facilitated courses. Online objective test delivery
attractions include convenient and quick assembly of test (especially when a test
bank is used,) not having to make paper copies, test scored automatically with
feedback to student immediate, scores automatically recorded in the gradebook
and test analysis available immediately, and in-class time not needed for
testing. The attractions to students of online test include more latitude of where
and when the test is taken.
On-the-other-hand faculty have concerns about the integrity of the online
testing environment and maintaining the environment close to that of paper and
pencil test with cell phones and other technological devices not permitted, given
in a classroom and proctored by a human present in the room. Thus faculty
each semester considers and makes many decisions on techniques to reduce
cheating in online testing.
Literature Review
Cheating and fraud behaviors are related along three conditions that predicate
the behavior Becker et al. (2006); Ramos, M. (2003). The fraud triangle concept
divides the conditions commonly found in fraud and cheating into three
categories; opportunity, incentive/pressure also referred to as need, and
rationalization/attitude. The fraud triangle concepts serves as a basis for a
taxonomy of cheating prevention techniques with potential for reducing cheating
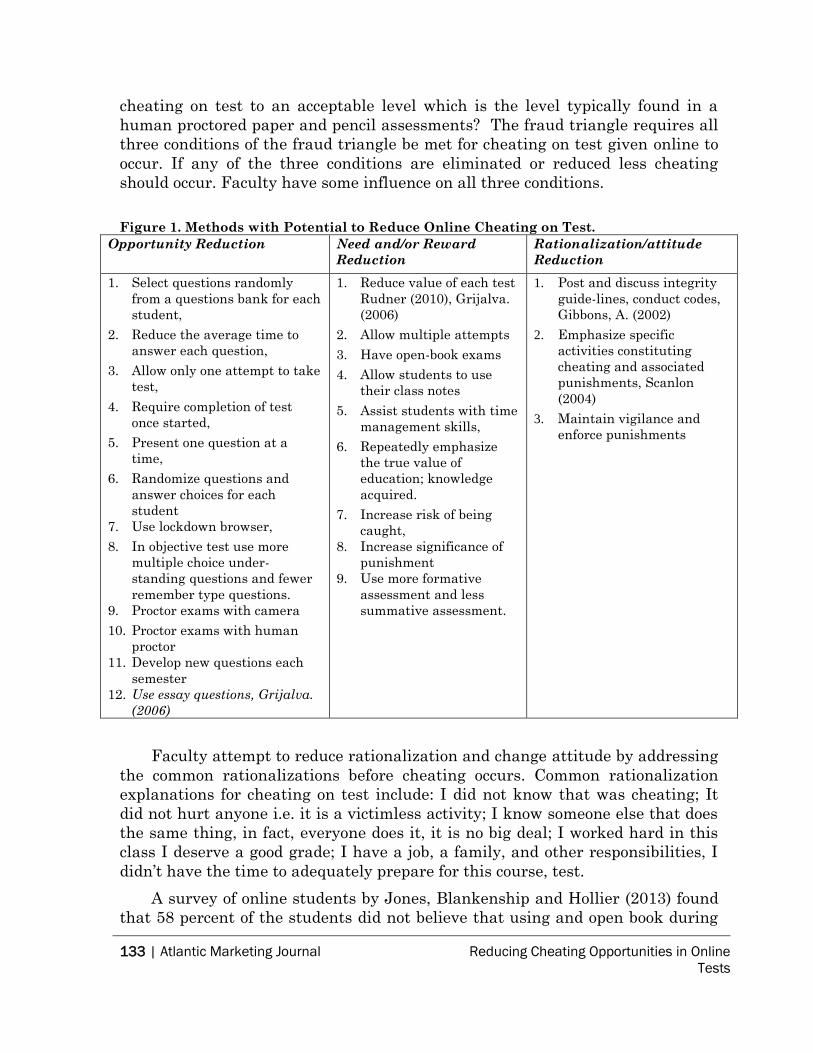
in online tests is shown in figure 1.
In figure 1, all the methods of reducing cheating on a test have drawbacks or
shortcomings some more significant than others. Shortcomings include
increasing time, costs, and intrusion into the student’s personal privacy, with
cameras for example. Moving down the list in each category, especially in the
opportunity reduction category, increases the investment of time for the
instructor and for the student. Both time and dollar investment goes up for the
student as the student typically pays when there are additional costs such as for
cameras and human proctors. For both faculty and students moving down the
category reduces the flexibility of online testing-the very aspect that makes it
attractive to students and faculty alike and may at the same time increase the
frustration by requiring more scheduling, more understanding of software and
more setting up and using of hardware. Therefore how far down in the list of
techniques to reduce cheating in each category do faculty need to move to reduce
133 | Atlantic Marketing Journal Reducing Cheating Opportunities in Online
Tests
cheating on test to an acceptable level which is the level typically found in a
human proctored paper and pencil assessments? The fraud triangle requires all
three conditions of the fraud triangle be met for cheating on test given online to
occur. If any of the three conditions are eliminated or reduced less cheating
should occur. Faculty have some influence on all three conditions.
Figure 1. Methods with Potential to Reduce Online Cheating on Test.
Opportunity Reduction Need and/or Reward
Reduction
Rationalization/attitude
Reduction
1. Select questions randomly
from a questions bank for each
student,
2. Reduce the average time to
answer each question,
3. Allow only one attempt to take
test,
4. Require completion of test
once started,
5. Present one question at a
time,
6. Randomize questions and
answer choices for each
student
7. Use lockdown browser,
8. In objective test use more
multiple choice under-
standing questions and fewer
remember type questions.
9. Proctor exams with camera
10. Proctor exams with human
proctor
11. Develop new questions each
semester
12. Use essay questions, Grijalva.
(2006)
1. Reduce value of each test
Rudner (2010), Grijalva.
(2006)
2. Allow multiple attempts
3. Have open-book exams
4. Allow students to use
their class notes
5. Assist students with time
management skills,
6. Repeatedly emphasize
the true value of
education; knowledge
acquired.
7. Increase risk of being
caught,
8. Increase significance of
punishment
9. Use more formative
assessment and less
summative assessment.
1. Post and discuss integrity
guide-lines, conduct codes,
Gibbons, A. (2002)
2. Emphasize specific
activities constituting
cheating and associated
punishments, Scanlon
(2004)
3. Maintain vigilance and
enforce punishments
Faculty attempt to reduce rationalization and change attitude by addressing
the common rationalizations before cheating occurs. Common rationalization
explanations for cheating on test include: I did not know that was cheating; It
did not hurt anyone i.e. it is a victimless activity; I know someone else that does
the same thing, in fact, everyone does it, it is no big deal; I worked hard in this
class I deserve a good grade; I have a job, a family, and other responsibilities, I
didn’t have the time to adequately prepare for this course, test.
A survey of online students by Jones, Blankenship and Hollier (2013) found
that 58 percent of the students did not believe that using and open book during
Reducing Cheating Opportunities in Online Tests Atlantic Marketing Journal | 134
an exam was cheating nor was using personal or class notes. Faculty address the
“did not know it was cheating” by including in the syllabus a class code of
conduct, a university code of conduct and class discussions of what constitutes
cheating. Other sources of influence exist, however, that may knowingly or
unknowingly encourage rationalization; for example peers with peer pressure,
faculty who have lenient eyes when observing cheating, parents who emphasis
grades and having the degree, and friends who are cooperative. Need and reward
reduction may also necessitate the faculty member to re-think the meaning of
the educational/learning processes. For example, “If the student knows the
material why should the test be open book? An open book test only means that
the student knows how to lookup the answers in the book.” Such an opinion
however runs counter to many of the techniques to reduce cheating within the
need and reward reduction category. Rovai (2000) discusses assessment in terms
of relationships, construction of understanding through discussions, inquiry and
collaborative work for example. Influencing need and reward are more direct for
faculty than the influence for rationalization/attitude but influence on the
opportunity condition is the most direct and immediate for faculty. In the
“Opportunity Reduction” category, the primary focus of this study, the majority
of faculty at colleges and universities use items 1, 2, 3, 4 and 5 in figure 1
according to Gao (2010).
Research Design
This study addresses reducing the opportunities to cheat in online test. Previous
studies have addressed cheating of students taking test online by collecting data
on students’ perceptions of the amount and methods of cheating Harmon,
Lambrinos & Buffolino, (2010); Conner, (2009); Watson & Sottile, (2009); King,
Guyette, & Piotrowski, (2009); Black, Greaser & Dawson, (2008). Data of
students’ actual test scores are analyzed in this study. Two sections of a junior
level undergraduate marketing course, one online and the other in the
traditional classroom (onsite) were used to gather data. The sections were
offered the same semester, with the same instructor, syllabus, textbook,
schedule of assignments and tests. Tests counted for slightly over 60% in the
calculation of the semester grade. The tests were 15 tests one each week and a
comprehensive final test. To give the students time to acclimate to the course,
testing procedure and the instructor the first two tests were not included in the
analysis. Each test consisted of 20 multiple choice questions from a test bank
provided by the book publisher. Questions were from the reading assignment for
the week. The 13 tests included in the analysis and the final exams were online
for the online course. For the onsite course tests, one through 11 were online
and tests, 12, 13 and the final comprehensive test, were paper and pencil in the
classroom and proctored by the instructor. The online tests were administered
through Blackboard and Respondus Lockdown browser combined. The
parameters for the quizzes permitted the student 25 minutes to complete the 20
135 | Atlantic Marketing Journal Reducing Cheating Opportunities in Online
Tests
multiple choice questions. With the requirement that the test be opened in a new window,
one question shown at a time, only one attempt at the test allowed, forced completion of
the 20 questions of the test once started and no backtracking to previously answered or
skipped questions permitted. The questions were randomly selected from a large test
bank and the order randomized for each student. Thus students would not have identical
test questions and, if by chance they did have, the order of the questions would be
different. Additionally Respondus’ Lockdown browser was required to take the test. The
browser locks the computer to any other applications/uses once the test is started.
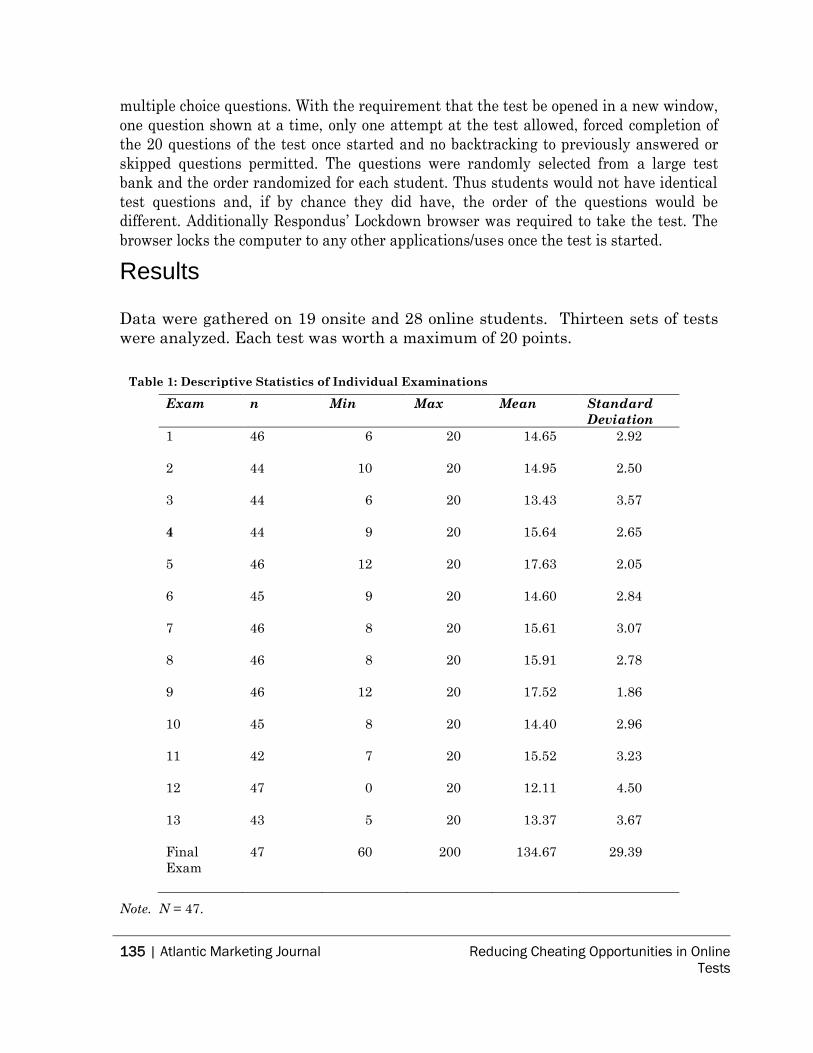
Results
Data were gathered on 19 onsite and 28 online students. Thirteen sets of tests
were analyzed. Each test was worth a maximum of 20 points.
Table 1: Descriptive Statistics of Individual Examinations
Note. N = 47.
Exam n Min Max Mean Standard
Deviation
1 46 6 20 14.65 2.92
2 44 10 20 14.95 2.50
3 44 6 20 13.43 3.57
4 44 9 20 15.64 2.65
5 46 12 20 17.63 2.05
6 45 9 20 14.60 2.84
7 46 8 20 15.61 3.07
8 46 8 20 15.91 2.78
9 46 12 20 17.52 1.86
10 45 8 20 14.40 2.96
11 42 7 20 15.52 3.23
12 47 0 20 12.11 4.50
13 43 5 20 13.37 3.67
Final
Exam
47 60 200 134.67 29.39
Reducing Cheating Opportunities in Online Tests Atlantic Marketing Journal | 136
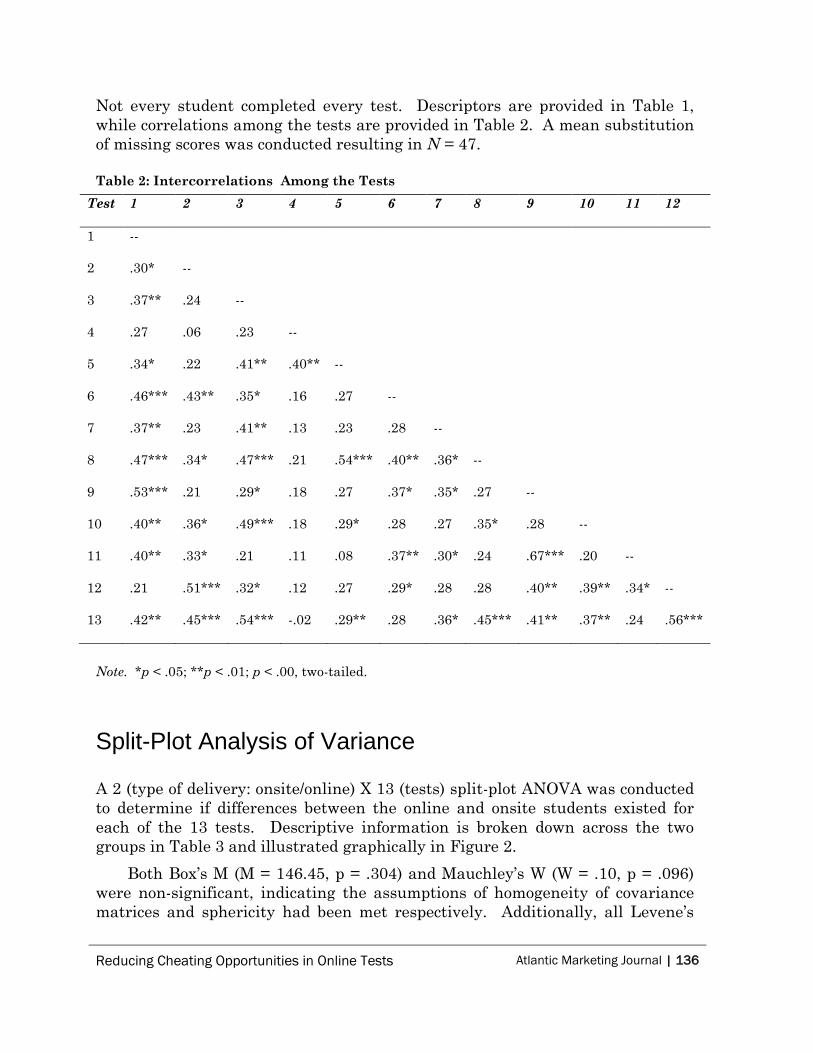
Not every student completed every test. Descriptors are provided in Table 1,
while correlations among the tests are provided in Table 2. A mean substitution
of missing scores was conducted resulting in N = 47.
Table 2: Intercorrelations Among the Tests
Note. *p < .05; **p < .01; p < .00, two-tailed.
Split-Plot Analysis of Variance
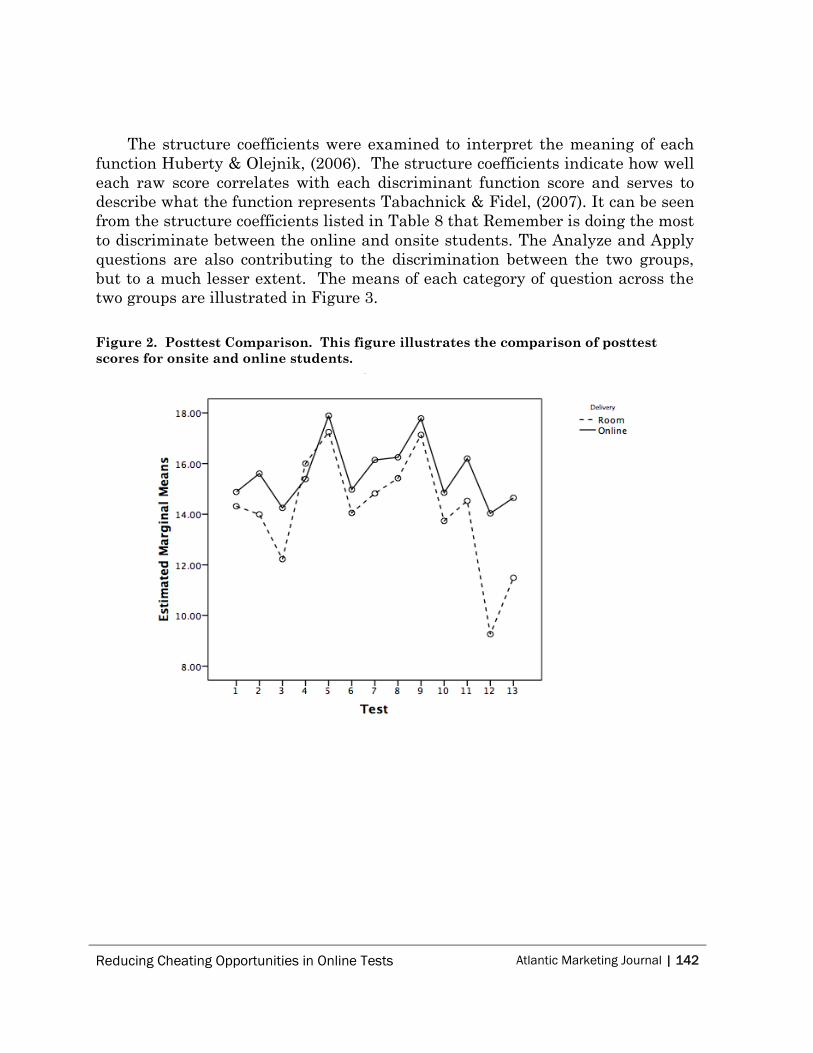
A 2 (type of delivery: onsite/online) X 13 (tests) split-plot ANOVA was conducted
to determine if differences between the online and onsite students existed for
each of the 13 tests. Descriptive information is broken down across the two
groups in Table 3 and illustrated graphically in Figure 2.
Both Box’s M (M = 146.45, p = .304) and Mauchley’s W (W = .10, p = .096)
were non-significant, indicating the assumptions of homogeneity of covariance
matrices and sphericity had been met respectively. Additionally, all Levene’s
Test 1 2 3 4 5 6 7 8 9 10 11 12
1 --
2 .30* --
3 .37** .24 --
4 .27 .06 .23 --
5 .34* .22 .41** .40** --
6 .46*** .43** .35* .16 .27 --
7 .37** .23 .41** .13 .23 .28 --
8 .47*** .34* .47*** .21 .54*** .40** .36* --
9 .53*** .21 .29* .18 .27 .37* .35* .27 --
10 .40** .36* .49*** .18 .29* .28 .27 .35* .28 --
11 .40** .33* .21 .11 .08 .37** .30* .24 .67*** .20 --
12 .21 .51*** .32* .12 .27 .29* .28 .28 .40** .39** .34* --
13 .42** .45*** .54*** -.02 .29** .28 .36* .45*** .41** .37** .24 .56***
137 | Atlantic Marketing Journal Reducing Cheating Opportunities in Online
Tests
tests were non-significant at
.01, indicating homogeneity of variances for all
of the individual tests.
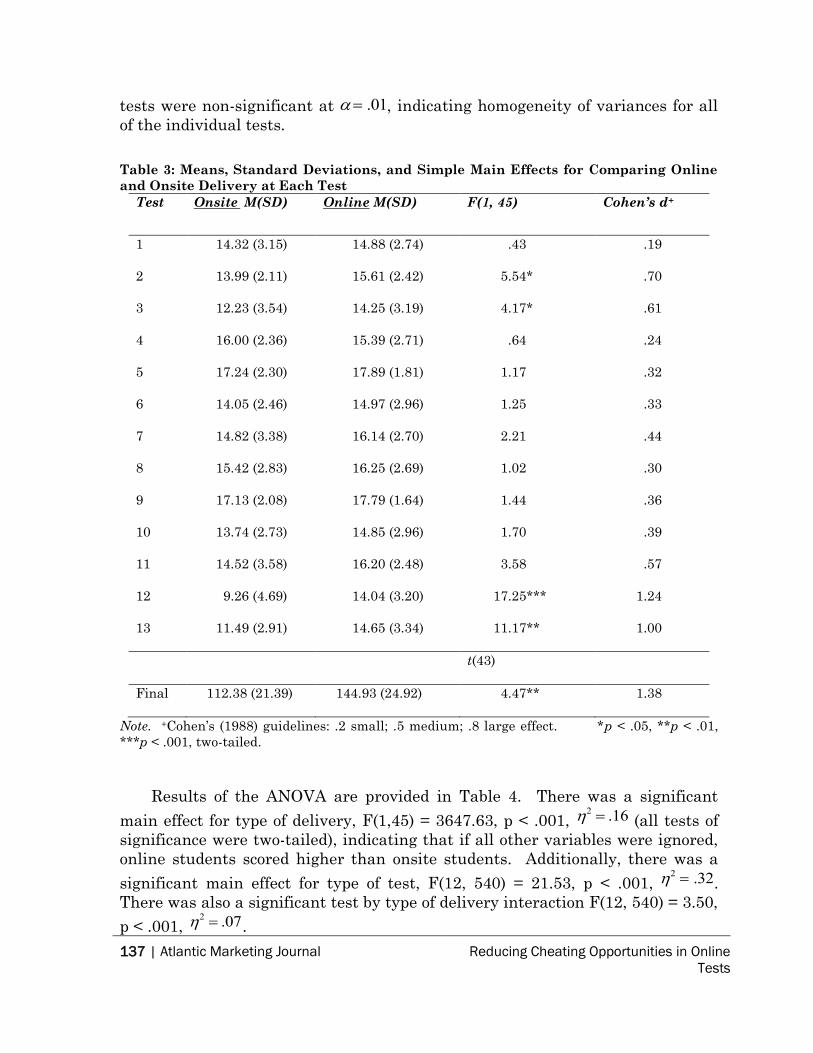
Table 3: Means, Standard Deviations, and Simple Main Effects for Comparing Online
and Onsite Delivery at Each Test
Test Onsite M(SD) Online M(SD) F(1, 45) Cohen’s d+
1 14.32 (3.15) 14.88 (2.74) .43 .19
2 13.99 (2.11) 15.61 (2.42) 5.54* .70
3 12.23 (3.54) 14.25 (3.19) 4.17* .61
4 16.00 (2.36) 15.39 (2.71) .64 .24
5 17.24 (2.30) 17.89 (1.81) 1.17 .32
6 14.05 (2.46) 14.97 (2.96) 1.25 .33
7 14.82 (3.38) 16.14 (2.70) 2.21 .44
8 15.42 (2.83) 16.25 (2.69) 1.02 .30
9 17.13 (2.08) 17.79 (1.64) 1.44 .36
10 13.74 (2.73) 14.85 (2.96) 1.70 .39
11 14.52 (3.58) 16.20 (2.48) 3.58 .57
12 9.26 (4.69) 14.04 (3.20) 17.25*** 1.24
13 11.49 (2.91) 14.65 (3.34) 11.17** 1.00
t(43)
Final 112.38 (21.39) 144.93 (24.92) 4.47** 1.38
Note. +Cohen’s (1988) guidelines: .2 small; .5 medium; .8 large effect. *p < .05, **p < .01,
***p < .001, two-tailed.
Results of the ANOVA are provided in Table 4. There was a significant
main effect for type of delivery, F(1,45) = 3647.63, p < .001,
2 .16 (all tests of
significance were two-tailed), indicating that if all other variables were ignored,
online students scored higher than onsite students. Additionally, there was a
significant main effect for type of test, F(12, 540) = 21.53, p < .001,
2 .32.
There was also a significant test by type of delivery interaction F(12, 540) = 3.50,
p < .001,
2 .07.
Reducing Cheating Opportunities in Online Tests Atlantic Marketing Journal | 138
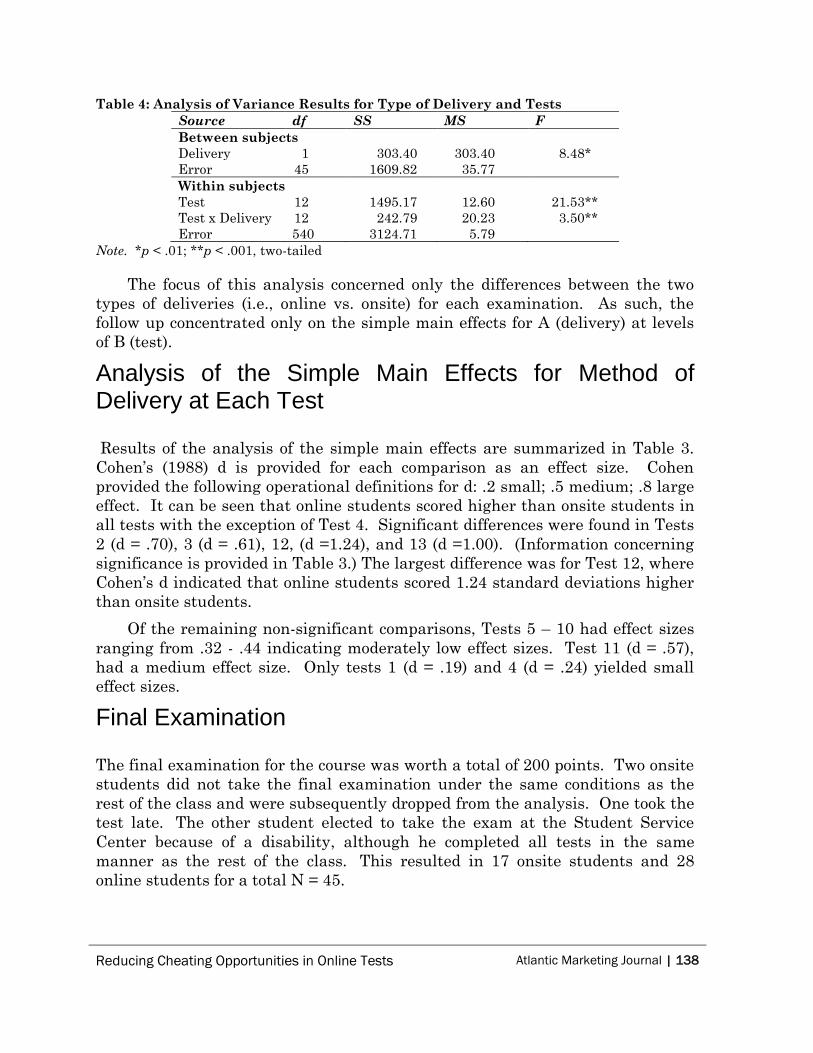
Table 4: Analysis of Variance Results for Type of Delivery and Tests
Source df SS MS F
Between subjects
Delivery 1 303.40 303.40 8.48*
Error 45 1609.82 35.77
Within subjects
Test 12 1495.17 12.60 21.53**
Test x Delivery 12 242.79 20.23 3.50**
Error 540 3124.71 5.79
Note. *p < .01; **p < .001, two-tailed
The focus of this analysis concerned only the differences between the two
types of deliveries (i.e., online vs. onsite) for each examination. As such, the
follow up concentrated only on the simple main effects for A (delivery) at levels
of B (test).
Analysis of the Simple Main Effects for Method of Delivery at Each Test
Results of the analysis of the simple main effects are summarized in Table 3.
Cohen’s (1988) d is provided for each comparison as an effect size. Cohen
provided the following operational definitions for d: .2 small; .5 medium; .8 large
effect. It can be seen that online students scored higher than onsite students in
all tests with the exception of Test 4. Significant differences were found in Tests
2 (d = .70), 3 (d = .61), 12, (d =1.24), and 13 (d =1.00). (Information concerning
significance is provided in Table 3.) The largest difference was for Test 12, where
Cohen’s d indicated that online students scored 1.24 standard deviations higher
than onsite students.
Of the remaining non-significant comparisons, Tests 5 – 10 had effect sizes
ranging from .32 - .44 indicating moderately low effect sizes. Test 11 (d = .57),
had a medium effect size. Only tests 1 (d = .19) and 4 (d = .24) yielded small
effect sizes.
Final Examination
The final examination for the course was worth a total of 200 points. Two onsite
students did not take the final examination under the same conditions as the
rest of the class and were subsequently dropped from the analysis. One took the
test late. The other student elected to take the exam at the Student Service
Center because of a disability, although he completed all tests in the same
manner as the rest of the class. This resulted in 17 onsite students and 28
online students for a total N = 45.
139 | Atlantic Marketing Journal Reducing Cheating Opportunities in Online
Tests
Independent Samples t-test
An independent samples t-test was conducted to determine if online and onsite
students performed differently on the final. (Note: This analysis was done
separately because of the vastly different metrics between the final and the
other exams.) Scores on the final ranged from 60 – 200 (M = 132.64, SD =
28.32). Students taking the final online scored significantly higher (M = 144.93)
than the onsite students (M = 112.38) who took the paper and pencil version of
the test, t(43) = 4.47, p < .001, d = 1.38. The 95% confidence interval for the
mean difference of 25.40 was 18.37 – 46.73. Cohen’s d illustrated the online
students scored almost 1.40 standard deviations higher than the onsite students,
indicating an extremely large effect (Cohen, 1988).
Multivariate Analysis of Variance
A 2 (type of delivery) X 7 (category of question) multivariate analysis of variance
(MANOVA) was completed to assess the relationship between type of delivery
and type of question. The seven categories of questions included the AACSB’s
Analytic, Ethical, and Reflective, and Bloom’s Remember, Understand, Analyze,
and Apply.
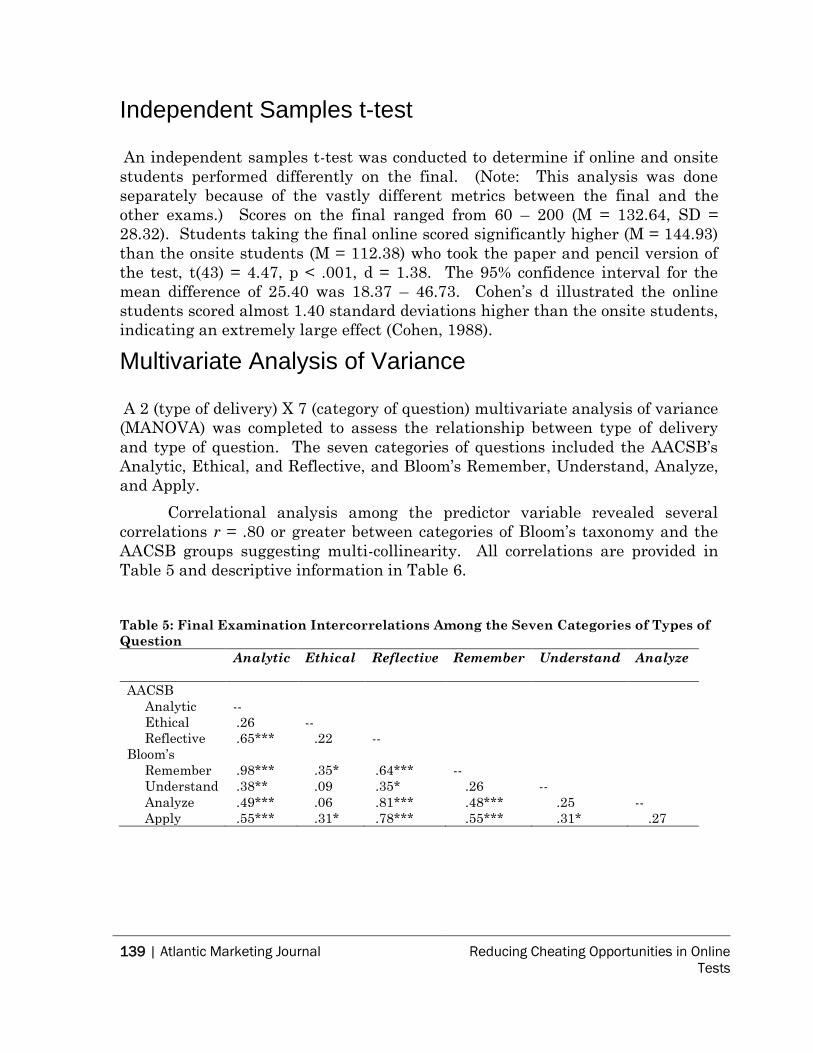
Correlational analysis among the predictor variable revealed several
correlations r = .80 or greater between categories of Bloom’s taxonomy and the
AACSB groups suggesting multi-collinearity. All correlations are provided in
Table 5 and descriptive information in Table 6.
Table 5: Final Examination Intercorrelations Among the Seven Categories of Types of
Question
Analytic Ethical Reflective Remember Understand Analyze
AACSB
Analytic --
Ethical .26 --
Reflective .65*** .22 --
Bloom’s
Remember .98*** .35* .64*** --
Understand .38** .09 .35* .26 --
Analyze .49*** .06 .81*** .48*** .25 --
Apply .55*** .31* .78*** .55*** .31* .27
Reducing Cheating Opportunities in Online Tests Atlantic Marketing Journal | 140
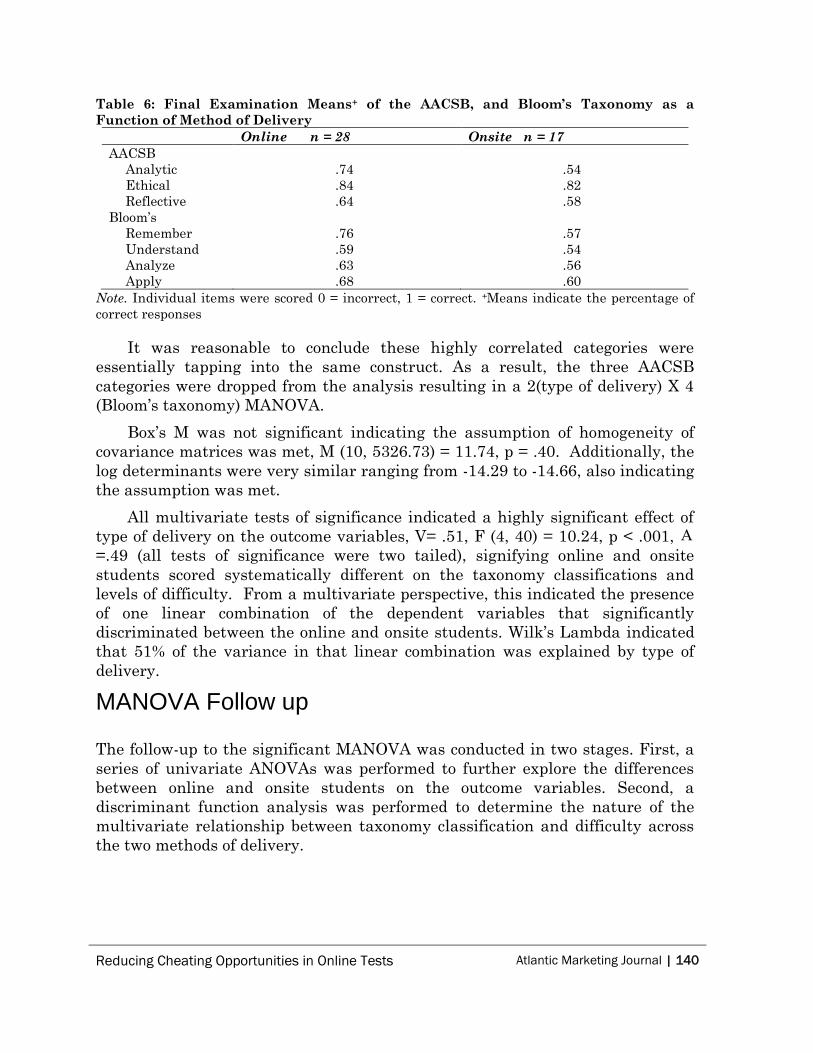
Table 6: Final Examination Means+ of the AACSB, and Bloom’s Taxonomy as a
Function of Method of Delivery
Online n = 28 Onsite n = 17
AACSB
Analytic .74 .54
Ethical .84 .82
Reflective .64 .58
Bloom’s
Remember .76 .57
Understand .59 .54
Analyze .63 .56
Apply .68 .60
Note. Individual items were scored 0 = incorrect, 1 = correct. +Means indicate the percentage of
correct responses
It was reasonable to conclude these highly correlated categories were
essentially tapping into the same construct. As a result, the three AACSB
categories were dropped from the analysis resulting in a 2(type of delivery) X 4
(Bloom’s taxonomy) MANOVA.
Box’s M was not significant indicating the assumption of homogeneity of
covariance matrices was met, M (10, 5326.73) = 11.74, p = .40. Additionally, the
log determinants were very similar ranging from -14.29 to -14.66, also indicating
the assumption was met.
All multivariate tests of significance indicated a highly significant effect of
type of delivery on the outcome variables, V= .51, F (4, 40) = 10.24, p < .001,
=.49 (all tests of significance were two tailed), signifying online and onsite
students scored systematically different on the taxonomy classifications and
levels of difficulty. From a multivariate perspective, this indicated the presence
of one linear combination of the dependent variables that significantly
discriminated between the online and onsite students. Wilk’s Lambda indicated
that 51% of the variance in that linear combination was explained by type of
delivery.
MANOVA Follow up
The follow-up to the significant MANOVA was conducted in two stages. First, a
series of univariate ANOVAs was performed to further explore the differences
between online and onsite students on the outcome variables. Second, a
discriminant function analysis was performed to determine the nature of the
multivariate relationship between taxonomy classification and difficulty across
the two methods of delivery.
141 | Atlantic Marketing Journal Reducing Cheating Opportunities in Online
Tests
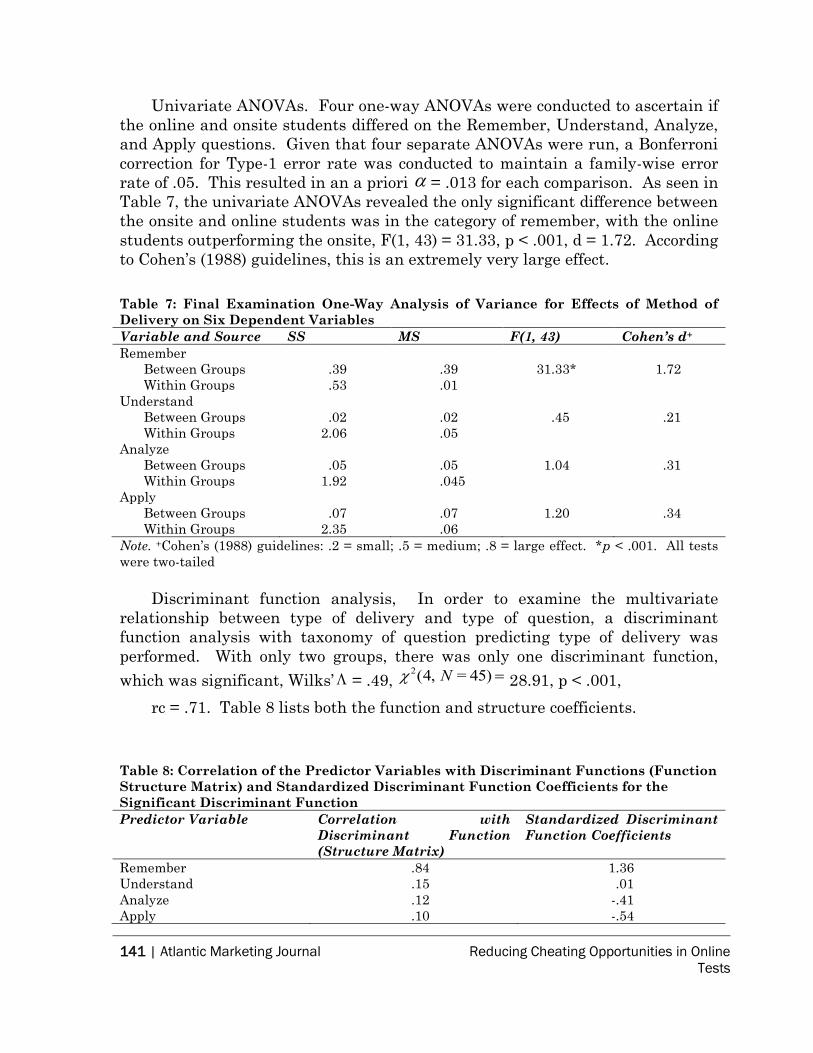
Univariate ANOVAs. Four one-way ANOVAs were conducted to ascertain if
the online and onsite students differed on the Remember, Understand, Analyze,
and Apply questions. Given that four separate ANOVAs were run, a Bonferroni
correction for Type-1 error rate was conducted to maintain a family-wise error
rate of .05. This resulted in an a priori
= .013 for each comparison. As seen in
Table 7, the univariate ANOVAs revealed the only significant difference between
the onsite and online students was in the category of remember, with the online
students outperforming the onsite, F(1, 43) = 31.33, p < .001, d = 1.72. According
to Cohen’s (1988) guidelines, this is an extremely very large effect.
Table 7: Final Examination One-Way Analysis of Variance for Effects of Method of
Delivery on Six Dependent Variables
Variable and Source SS MS F(1, 43) Cohen’s d+
Remember
Between Groups .39 .39 31.33* 1.72
Within Groups .53 .01
Understand
Between Groups .02 .02 .45 .21
Within Groups 2.06 .05
Analyze
Between Groups .05 .05 1.04 .31
Within Groups 1.92 .045
Apply
Between Groups .07 .07 1.20 .34
Within Groups 2.35 .06
Note. +Cohen’s (1988) guidelines: .2 = small; .5 = medium; .8 = large effect. *p < .001. All tests
were two-tailed
Discriminant function analysis, In order to examine the multivariate
relationship between type of delivery and type of question, a discriminant
function analysis with taxonomy of question predicting type of delivery was
performed. With only two groups, there was only one discriminant function,
which was significant, Wilks’
= .49,
2(4, N = 45) 28.91, p < .001,
rc = .71. Table 8 lists both the function and structure coefficients.
Table 8: Correlation of the Predictor Variables with Discriminant Functions (Function
Structure Matrix) and Standardized Discriminant Function Coefficients for the
Significant Discriminant Function
Predictor Variable Correlation with
Discriminant Function
(Structure Matrix)
Standardized Discriminant
Function Coefficients
Remember .84 1.36
Understand .15 .01
Analyze .12 -.41
Apply .10 -.54
Reducing Cheating Opportunities in Online Tests Atlantic Marketing Journal | 142
The structure coefficients were examined to interpret the meaning of each
function Huberty & Olejnik, (2006). The structure coefficients indicate how well
each raw score correlates with each discriminant function score and serves to
describe what the function represents Tabachnick & Fidel, (2007). It can be seen
from the structure coefficients listed in Table 8 that Remember is doing the most
to discriminate between the online and onsite students. The Analyze and Apply
questions are also contributing to the discrimination between the two groups,
but to a much lesser extent. The means of each category of question across the
two groups are illustrated in Figure 3.
Figure 2. Posttest Comparison. This figure illustrates the comparison of posttest
scores for onsite and online students.
143 | Atlantic Marketing Journal Reducing Cheating Opportunities in Online
Tests
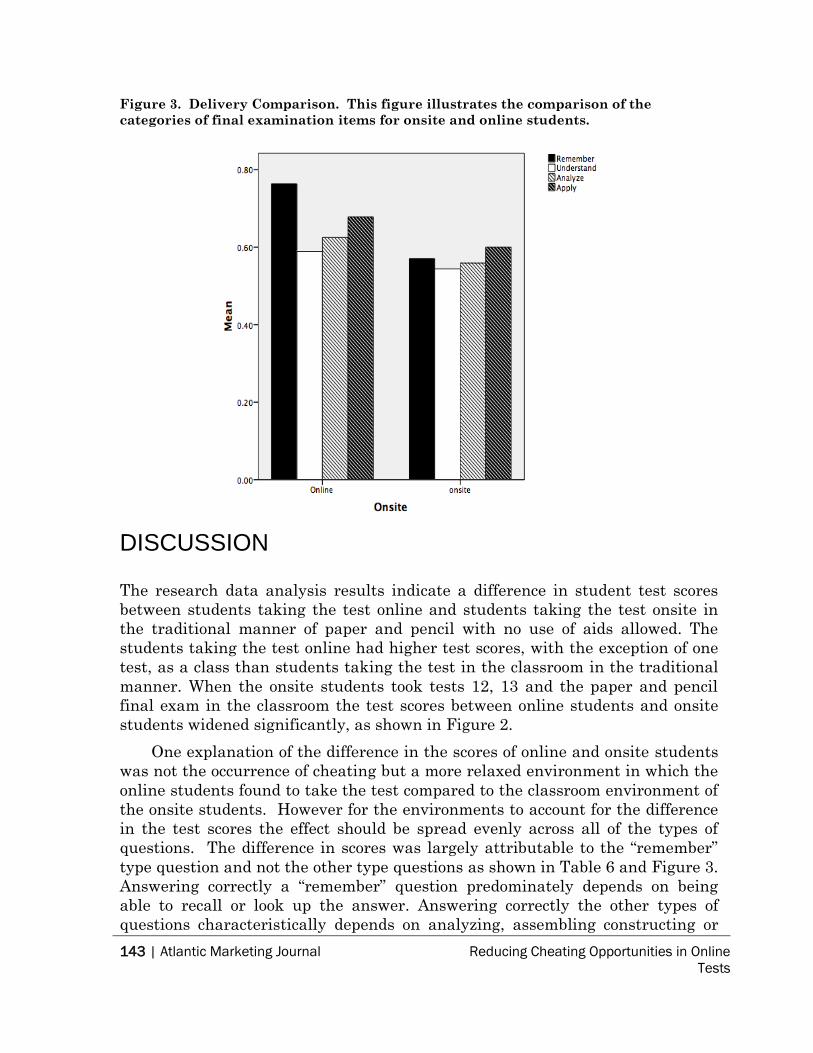
Figure 3. Delivery Comparison. This figure illustrates the comparison of the
categories of final examination items for onsite and online students.
DISCUSSION
The research data analysis results indicate a difference in student test scores
between students taking the test online and students taking the test onsite in
the traditional manner of paper and pencil with no use of aids allowed. The
students taking the test online had higher test scores, with the exception of one
test, as a class than students taking the test in the classroom in the traditional
manner. When the onsite students took tests 12, 13 and the paper and pencil
final exam in the classroom the test scores between online students and onsite
students widened significantly, as shown in Figure 2.
One explanation of the difference in the scores of online and onsite students
was not the occurrence of cheating but a more relaxed environment in which the
online students found to take the test compared to the classroom environment of
the onsite students. However for the environments to account for the difference
in the test scores the effect should be spread evenly across all of the types of
questions. The difference in scores was largely attributable to the “remember”
type question and not the other type questions as shown in Table 6 and Figure 3.
Answering correctly a “remember” question predominately depends on being
able to recall or look up the answer. Answering correctly the other types of
questions characteristically depends on analyzing, assembling constructing or
Reducing Cheating Opportunities in Online Tests Atlantic Marketing Journal | 144
applying to arrive at an answer and thus looking up the answer is more difficult,
if not impossible.
Another possible explanation, the online students were smarter and better
test takers. The online students test scores, with the exception of one test, were
higher, as shown in Figure 2. However, both the online and onsite students were
taking the test online up until test 12 and 13 and the final exam when the onsite
students were required to take test 12, 13 and the final exam in a proctored
classroom using paper tests and pens. The difference in online tests scores and
the paper and pen tests scores for test 12 and 13 and the final exam increased
significantly as shown in table 7. Most of the difference was associated with the
“remember” type questions.
The research results show a correlation between a series of class average
tests scores and how the test was delivered; online or paper and pen. With online
test associated with higher scores. Why higher test scores in the context of the
research environment with online testing? Initially the possible difference in
testing environments and the possible difference of intellectual ability of totally
online students and classroom students seem plausible explanations in test
scores of online and paper and pen tests takers. However, examination of the
question type results, specifically the “remember” type questions make both
environment and ability differences less than convincing explanations. Cheating
remains as an explanation.
Does online testing cause cheating on test? The research results only show
a correlation not a cause. Online testing, depending on the parameters, provides
opportunity to cheat. Opportunity with need/reward and
rationalization/attitude, are the conditions that predicate cheating behavior
Becker et al., (2006); Ramos, M., (2003).
Online tests parameters in this study were the first six opportunity
prevention techniques listed in Figure 1 as computer software settings. They
are: (1) produce a unique test for each student by selecting questions randomly
from a large test bank (2) a limited amount of time from starting to finishing the
test was available, (3) the test could be taken only once, (4) required completion
of the test once started, (5) one question viewable at a time, back tracking to
previous questions not permitted, (6) the test question sequence was shuffled
between students and in addition the computer was locked (unavailable) for
other uses. All of the software settings are recommended by Harmon,
Lambrinos, & Buffolino ( 2010). The course syllabus contained the university’s
student code of conduct and it was discussed the first week for both online and
onsite sections. None of the online tests or final test were proctored in this
study.
In this study the software settings by themselves were not sufficient in
reducing the difference between online and onsite class scores to an insignificant
level. However the results of data analysis found that using fewer questions in
145 | Atlantic Marketing Journal Reducing Cheating Opportunities in Online
Tests
the first category of Bloom’s (1964) levels of learning, the remember category
and more from the understand level would reduce the difference in online and
onsite student scores. Multiple choice questions that were a mixture of levels of
Bloom’s first four levels of learning were used in the tests and final in this study.
The greatest dispersion in the online and onsite student test scores, as shown in
Figure 3, was in Bloom’s first level of learning; remembering information.
Bloom’s learning taxonomy has the most basic level of level of learning at the
first level. Understanding follows in level two and then applying, analyzing,
evaluating and creating. Each successive level requires more complex and
abstract thinking. The results from the data analysis of this study point to the
reduction of cheating by using questions that address learning above Bloom’s
level one. Thus this study reinforces others’ conclusions (Rudner, 2010; Harmon,
Lambrinos, & Buffolino, 2010): Cheating is more difficult when the answer
cannot be easily looked up but has to be developed by using problem solving and
reasoning skills.
The results of this research study indicate for faculty to reduce cheating in
online testing they will need to go deeper into the cheating opportunity
prevention list of techniques in Figure 1 and use prevention techniques in the
other two predicating conditions of cheating as well. The techniques available
beyond those researched in this study depend on more than just instructors for
success. O’Neill and Pfieffer (2012) conclusion from econometric modeling of
700 student responses from three U.S. liberal arts colleges was, “…unless an
honour code is embraced by the college community, the existence of an honour
code by itself will not reduce cheating.” Other groups will need to take an active
role. Faculty that use the first eight items in the “cheating opportunity
reduction” category and the first two items in the other two categories employed
the most direct and least time and cost demanding techniques.
Does the desire exist to reduce cheating in online testing? Harbin and
Humphrey (2012) contented that six groups have conflicts of interest and are
willing to ignore or see online cheating through lenient eyes. The groups are
students, faculty, higher education administration, legislators, parents and
support groups, and for-profit online universities. If, however, online cheating is
to be reduced it will require participation from the groups mentioned.
The difference in online and onsite students’ test 12, 13 and final exam
scores were statistically significant. The significant difference in test scores
maybe evidence of online and onsite students viewing the tests and final from
the perspective of Campbell’s Law. Campbell’s Law states "The more any
quantitative social indicator is used for social decision-making, the more subject
it will be to corruption pressures and the more apt it will be to distort and
corrupt the social processes it is intended to monitor." (Campbell 1976). On the
student level Campbell’s Law might be stated as “The semester grade is more
important than learning and demonstrating achievement of learning therefore I
Reducing Cheating Opportunities in Online Tests Atlantic Marketing Journal | 146
will cheat for the grade if there is an opportunity.” The non-proctored online
student test takers had the opportunity.
The difference in online and onsite students test scores on tests 12, 13 and
the final exam seems to result from one major difference in the test
environments of the two classes. The online test environment was non-proctored
and the onsite test environment was proctored. Future research should focus on
the use of proctoring to maintain the academic integrity in online and onsite
testing environments. For instance, a recommendation concerning proctoring
that should be researched comes from Harmon, Lambrinos, & Buffolino (2010).
Based on the results of their study, they recommend that when proctoring of all
tests is not practical that an alternative to reduce cheating is proctoring of some
tests. Likewise proctoring services, networks and software deserve additional
study and support with resources if they are found to be effective in reducing the
conditions identified as necessary for fraud and cheating. How many techniques
to prevent cheating do faculty use at most colleges? How many do they need to
use to keep cheating in check? How many are they willing to use?
References
Allen, E.I., & Seaman, J. (2013). Changing Course: Ten Years of Tracking Online
Education in {Bibliography}{Bibliography}{Bibliography}the United States,
Babson Survey Research Group, Babson College. Retrieved Jan 10, 2014 from
http://eric.ed.gov/?id=ED541571
Becker, D., Connolly, J., Lentz, P., and Morrison, J. (2006), Using the Business
Fraud Triangle to Predict Academic Dishonesty Among Business Students,
Academy of Educational Leadership Journal, 10(1), 37-52
Black, E. W., Greaser, J., & Dawson, K. (2008). Academic Dishonesty in
Traditional and Online Classrooms: Does the "Media Equation" Hold True?
Journal of Asynchronous Learning Networks, 12(3-4), 23-30.
Bloom, B. S. (1964). Taxonomy of Educational Objectives. New York, : David
McKay.
Campbell, D. (1975). Assessing the Impact of Planned Social Change. New
Hampshire: The Public Affairs Center, Dartmouth College.
Cohen, J. (1988). Statistical power analysis for the behavioral sciences (2nd ed.).
Hillsdale, NJ: Erlbaum.
Colton, G. D. (1997). High-Tech Approaches to Breeching Examination Security.
Espionage 101.
147 | Atlantic Marketing Journal Reducing Cheating Opportunities in Online
Tests
Common Sense Media. (2011). Cheating Goes Hi-Tech. Retrieved from
http://www.commonsensemedia.org/advice-for-parents/cheating-goes-hi-tech
Conner, C. (2009). Accounting Education: A comparative Study of Perception of
Learning Outcomes in Traditional and Online Delivery Systems. University of
the Incarnate, ProQuest LLC, Ph.D. DissertationCohen, J. (1988). Statistical
power analysis for the behavioral sciences (2nd ed.). Hillsdale, NJ: Erlbaum.
Dunn, T. P., Meine, M. F., & McCarley, J. (2010). The Remote Proctor: An
Innovative Technological Solution for Online Course Integrity. [Article].
International Journal of Technology, Knowledge & Society, 6(1), 1-7.
Emerson, L., & MacKay, B. (2011). A Comparison between Paper-Based and
Online Learning in Higher Education. British Journal of Educational
Technology, 42(5), 727-735.
Furnell, S., Evans, M., & Bailey, P. (2000). The Promise of Online Distance
Learning: Addressing Academic and Institutional Concerns. Quarterly Review of
Distance Education, 1(4), 281-291.
Gao, Q. (2012). Biometric Authenitiacation to Prevent e-Cheating, International
Journal of Instructional Technologhy and Distance Learning, 9(2), 3-13.
Gibbons, A., Mize, C. D., & Rogers, K. L., (2002), That’s my story and I’m
sticking to it: Promoting academic integrity in the online environment. (ERIC
No. ED 477016)
Glass-Castle, & Educational Testing Service. (1999). Cheating is a Personal Foul
Retrieved July 27, 2012, from http://www.glass-castle.com/clients/www-
nocheating-org/adcouncil/research/cheatingbackgrounder.html
Gray, S. (1998). Maintaining Academic Integrity in Web-Based Instruction.
Educational Media International, 35(3), 186-188.
Grijalva, T. C., Nowell, C., & Kerkvliet, J., (2006), Academic honesty and online
courses, College Student Journal, 40, 180-185.
Harbin, J., & Humphrey, P., (2012). Online Cheating – the case of the emperor’s
clothing, elephant in the room, and the 800 lb. gorilla, Journal of Academic and
Business Ethics
Reducing Cheating Opportunities in Online Tests Atlantic Marketing Journal | 148
Harmon, O. R., Lambrinos, J., & Buffolino, J. (2010). Assessment Design and
Cheating Risk in Online Instruction. Online Journal of Distance Learning
Administration, 13(3).
Hot Topics in Education. (2011). 75 to 98 Percent of College Students Have
Cheated Retrieved July 27, 2012, from,
http://educationportal.com/articles/75_to_98_Percent_of_College_Students_Have
_Cheated.html
Howell, S. L., Sorensen, D., & Tippets, H. R. (2009). The New (and Old) News
about Cheating for Distance Educators. Online Journal of Distance Learning
Administration, 12(3).
Huberty, C. J., & Olejnik, S. (2006). Applied MANOVA and Discriminant
Analysis. Hoboken, NJ: Wiley.
Jones, I., Blankenship, D. & Hollier, G.(2013). Am I Cheating? An Analysis of
Online Student Perceptions of Their Behaviors and Attitudes. Proceedings of
ASBBS, 20(1).
Kimmel, E. W. (1997). Unintended Consequences or Testing the Integrity of
Teachers and Students. Princeton N. J.: Educational Testing Service.
King, C. G., Guyette, R. W., Jr., & Piotrowski, C. (2009). Online Exams and
Cheating: An Empirical Analysis of Business Students' Views. Journal of
Educators Online, 6(1).
Kolowich, S. (2012). Conflicted: Faculty and Online Education, 2012. Inside
Higher Ed June 21, 2012.
Manzo, K. K. (2009). CHEATING. [Article]. Education Week, 28(36), 4-4.
Nichols, S. L., & Berliner, D. C. (2005). The Inevitable Corruption of Indicators
and Educators through High-Stakes Testing. Arizona State University:
Education Policy Research Unit.
Olt, M. R. (2002). Ethics and Distance Education: Strategies for Minimizing
Academic Dishonesty in Online Assessment. Online Journal of Distance
Learning Administration, 5(3)
O’Neill, H., & Pfeiffer, C. (2012) The Impact of Honour Codes and Perceptions of
Cheating on Academic Cheating Behaviours, Especially for MBA Bound
Undergraduates. Accounting Education, 21(3), 231-245.
149 | Atlantic Marketing Journal Reducing Cheating Opportunities in Online
Tests
Online Education Database. (2012). 8 Astonishing Stats on Academic Cheating:
Online Education Database.
Ramos, M., (2003) Auditors’ responsibility for fraud detection, Journal of
Accountancy, 195 (1), 28-35
Rovai, A. P. (2000). Online and Traditional Assessments: What Is the
Difference? Internet and Higher Education, 3(3), 141-151.
Rudner, L. (2010). Put Learning to the Test. BizEd(March/April 2010), pp 31-33.
Scanlon, P.M. (2004). Student online plagiarism: How do we respond? College
Teaching, 51(4), 161-165
Schmidt, S. M. P., Ralph, D. L., & Buskirk, B. (2009). Utilizing Online Exams: A
Case Study. Journal of College Teaching & Learning, 6(8), 1-8.
Shyles, L. (2002). Authenticating, Identifying, and Monitoring Learners in the
Virtual Classroom: Academic Integrity in Distance Learning.
Tabachnick, B. G., & Fidel, L. S. (2007). Using multivariate statistics (5 ed.).
New York: Pearson Education.
Watson, G., & Sottile, J. (2010). Cheating in the Digital Age: Do Students Cheat
More in Online Courses? Online Journal of Distance Learning Administration,
13(1).