Embed Size (px)
Citation preview

S Xiq IT rd lPOLICY RESEARCH WORKING PAPER 2918
REVISED
Reducing Agricultural Tariffsversus Domestic Support
What's More Important for Developing Countries?
Bernard hloekmaan
Francis Ng
Marcelo Olarreaga
The World BankDevelopment Research GroupTradeMarch 2003
Pub
lic D
iscl
osur
e A
utho
rized
Pub
lic D
iscl
osur
e A
utho
rized
Pub
lic D
iscl
osur
e A
utho
rized
Pub
lic D
iscl
osur
e A
utho
rized
l POLICY RESEARCH WORKING PAPER 2918
Abstract
High levels of protection and domestic support for The authors develop a simple partial equilibriumfarmers in industrial countries significantly affect many model of global trade in commodities that benefit fromdeveloping cotintries, both directly and through the domestic support in at least one WTO member. Theprice-depressing effect of agricultural support policies. simulation results suggest there will be large differencesHigh tariffs-in both rich and poor countries-and between LDCs and other developing economies in termsdomestic support may also lower the world price of of the impact of a 50 percent cut in tariffs as comparedagricultural products, benefiting net importers. to a 50 percent cut in domestic support. Developing
Hoekman, Ng, and Olarreaga assess the impact of countries as a group would suffer a welfare loss from areducing tariffs and domestic support in a sample of 119 cut in support, while LDCs would experience a smallcountries. Least developed countries (LDCs) are gain. For both groups of countries, tariff reductions bydisproportionately affected by agriculttiral support WTO members-including own liberalization-will havepolicies. More than 18 percent of LDC exports are a positive effect on welfare. The results show both thesubject to domestic support in at least one World Trade importance of focusing on tariffs as well as subsidies, andOrganization (WTO) member, as compared to only 9 the need for complementary actions to allow a domesticpercent of their imports. For other developing countries supply response to occur in developing countries if worldthe figures are around 4 percent for both their exports prices rise.and imports. So, the prevailing pattern of trade stiggeststhe world price-reducinig effect of agricultural domesticsupport policies may induce a welfare loss in LDCs.
This paper-a product of Trade, Development Research GrotIp-is part of a larger effort in the group to analyze the effectsof trade-related policies on developing cotintries. Copies of the paper are available free from the World Bank, 1818 H StreetNW, Washington, DC 20433. Please contact Rebecca Martin, room MC3-303, telephone 202-473-9065, fax 202-522-1159, email address rmartinl@(worldbank.org. Policy Research Working Papers are also posted on the Web at http://econ.worldbank.org. The authors may be contacted at [email protected], [email protected], [email protected]. March 2003. (39 pages)
The Policy Research Worktig Paper Series disseoiinates the findings of tvork in progress to encourage the exchanzge of ideas about
development issuies. An objective of the series is to get the findings out quitkly, even if the presentations are less thani fully polished. Thepapers carry the nanies of the authors and should be cited accordingly. The findings, interpretations, and conclusions expressed tn this
paper are entirely those of the authors. They do not necessarily represent the vietw of the World Bank, its Executive Directors, or the
countries they represent.
IProduced by the Research Advisory Staff

Reducing Agricultural Tariffs versus Domestic Support:What's More Important for Developing Countries?*
Bernard Hoekmant $Francis Ngt
Marcelo Olarreagatt
JEL classification: D58, F13, F14,Keywords: Agriculture, WTO, trade negotiations, tariffs, subsidies, developing countries
The views expressed in this paper are those of the authors and should not be attributed to the World Bank.We are grateful to Ataman Aksoy, Gopi Gopinath, Harry de Gorter, Ashok Gulati, Tim Josling, WillMartin and participants at the conference "The Developing Countries, Agricultural Trade and the WTO,"Whistler June 16-17, 2002 for helpful comments and suggestions. Thanks also to Lili Tabada for assistancein constructing the database; to Morvarid Bagherzadeh, Bij it Bora and Wo jciech Stawowy for estimates ofad-valorem equivalents of specific tariffs.t Development Research Group, The World Bank, 1818 H Street, NW, Washington DC, USA.: Centre for Economic Policy Research, London, UK.


1 Introduction
Developing country agricultural exports are limited by high tariffs in many countries. Domestic
support for farmers in high-income economies also hurts developing country exporters to the
extent that it boosts domestic production, depresses world prices, exacerbates the volatility of
world prices and reduces the scope for import competition. High tariffs and domestic support
policies may, however, benefit net importers of agriculture products in developing countries by
providing access to the subsidized commodities at lower prices.' Thus, as is well known, national
interests regarding reform of OECD agricultural trade and support policies will differ. However,
most analyses conclude that the overall gain to developing countries from reforming agricultural
policies greatly outweighs the potential costs to countries that are significant net importers of
subsidized agricultural products.
Starting in 2000, negotiations were launched in the WTO to further reduce intervention in
agricultural markets. These negotiations focus on both subsidy policies and border protection
(tariffs and tariff rate quotas). An important policy question confronting developing countries is
to determine which instruments of agricultural protection are most detrimental to their interests.
In this paper we attempt to shed some light on this issue by assessing the relative impact of
tariffs and domestic support policies on exports and welfare of developing countries.
Specifically, we assess the impact of a 50 percent global reduction in agricultural tariffs and
compare this to a 50 percent cut in domestic support.2 Our objective is to assess where
negotiating efforts in the context of the current WTO negotiations on agriculture might be best
directed.
We find that in welfare terms, tariffs matter significantly mnore than subsidy policies-
tariff reductions generate welfare gains that are substantially greater than reductions in support
policies.3 In large part this is because of high tariff peaks in OECD countries and because
developing countries also use iariffs to protect domestic production. As is almost always the
case, when it comes to trade policy reform, the principle 'what you do determines what you get'
applies. This does not imply that negotiations should therefore emphasize tariffs over domestic
' This potential national welfare benefit is offset by the higher price volatility created by support policies as countryspecific shocks may be transferred to world markets. In this paper we ignore the extent to which price volatility istransmitted to world markets.2 The policy simulation can be motivated by a conservative interpretation of the Doha declaration: "....we commitourselves to comprehensive negotiations aimed at: substantial improvements in market access, reduction of, with aview to phasing out, all forms of export subsidies; and substantial reductions in trade-distorting domestic support"(WTO Doha Ministerial Declaration, para 13, November 2001).
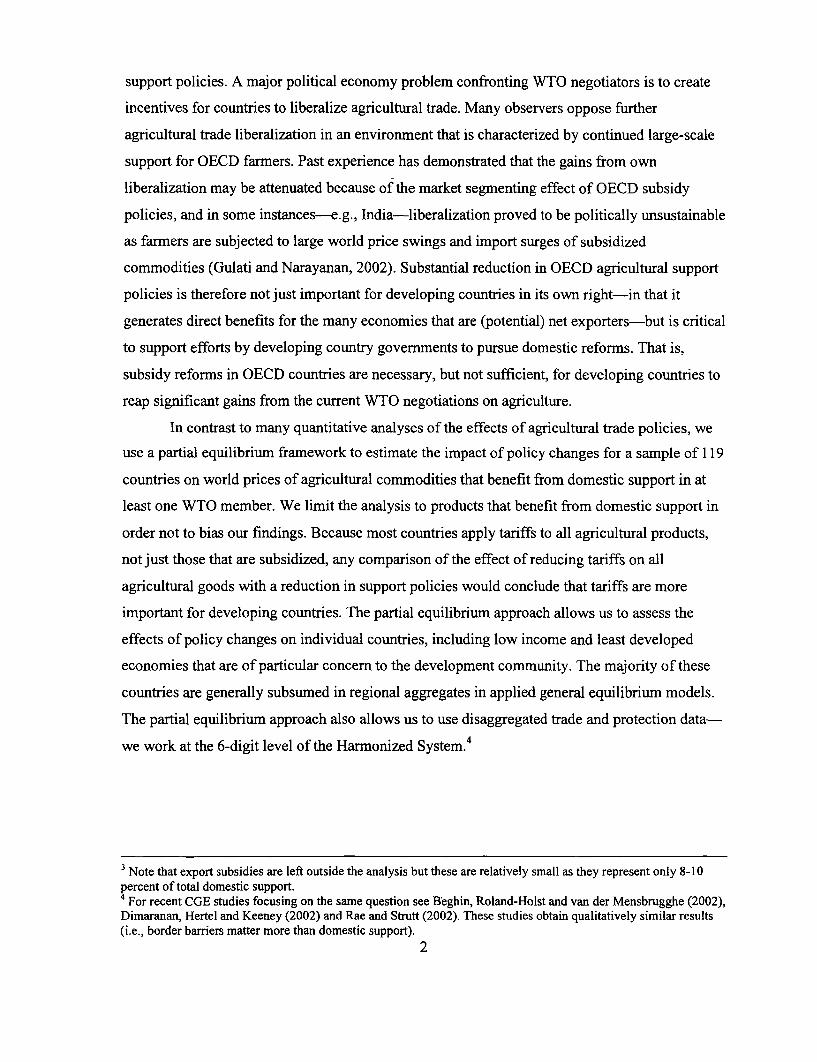
support policies. A major political economy problem confronting WTO negotiators is to create
incentives for countries to liberalize agricultural trade. Many observers oppose further
agricultural trade liberalization in an environment that is characterized by continued large-scale
support for OECD farmers. Past experience has demonstrated that the gains from own
liberalization may be attenuated because of the market segmenting effect of OECD subsidy
policies, and in some instances-e.g., India-liberalization proved to be politically unsustainable
as farmers are subjected to large world price swings and import surges of subsidized
commodities (Gulati and Narayanan, 2002). Substantial reduction in OECD agricultural support
policies is therefore not just important for developing countries in its own right-in that it
generates direct benefits for the many economies that are (potential) net exporters-but is critical
to support efforts by developing country governments to pursue domestic reforms. That is,
subsidy reforms in OECD countries are necessary, but not sufficient, for developing countries to
reap significant gains from the current WTO negotiations on agriculture.
In contrast to many quantitative analyses of the effects of agricultural trade policies, we
use a partial equilibrium framework to estimate the impact of policy changes for a sample of 119
countries on world prices of agricultural commodities that benefit from domestic support in at
least one WTO member. We limit the analysis to products that benefit from domestic support in
order not to bias our findings. Because most countries apply tariffs to all agricultural products,
not just those that are subsidized, any comparison of the effect of reducing tariffs on all
agricultural goods with a reduction in support policies would conclude that tariffs are more
important for developing countries. The partial equilibrium approach allows us to assess the
effects of policy changes on individual countries, including low income and least developed
economies that are of particular concern to the development community. The majority of these
countries are generally subsumed in regional aggregates in applied general equilibrium models.
The partial equilibrium approach also allows us to use disaggregated trade and protection data-
we work at the 6-digit level of the Harmonized System.4
3 Note that export subsidies are left outside the analysis but these are relatively small as they represent only 8-10percent of total domestic support.4 For recent CGE studies focusing on the same question see Beghin, Roland-Hoist and van der Mensbrugghe (2002),Dimaranan, Hertel and Keeney (2002) and Rae and Strutt (2002). These studies obtain qualitatively similar results(i.e., border barriers matter more than domestic support).
2

2 Tariffs and domestic support in agriculture
Agricultural products are often subject to tariff peaks that are 100 percent or higher (Hoekman,
Ng and Olarreaga, 2002). The average MFN tariff that is applied to agricultural products varies
substantially across countries, but in the majority of OECD cowatries is more than double the
average that applies for manufactures. In addition to tariffs, many high-income countries
subsidize domestic agriculture. WTO data indicate that there are 158 commodities at the 6-digit
level of the Harmonized System (HS) that benefit from domestic support in at least one WTO
member. Large-scale use of domestic support is primarily founcl in OECD countries, especially
the EU, Japan and the United States. Industrialized countries account for 88 percent of total
domestic support payments; if South Korea and transition economies such as Poland are
excluded, developing countries account for only 10 percent of total support reported to the WTO
during 1995-6 (Table 1). Major subsidizers among developing countries include Brazil, Thailand
and Venezuela. Not surprisingly, least developed countries (LDCs) report virtually no domestic
support. Meat, dairy, cereals and sugar account for the lion's share of domestic support,
representing almost 75 percent of all reported non-exempt domestic support (WTO categories
DS4-9) (Table 2).
The average tariff on these subsidized products is around 18 percent, -with peaks in the
100-200 percent range for many countries (Table 3). Average tariffs are relatively uniformly
distributed across major product categories, with the highest applying in dairy and sugar (and
alcoholic beverages-a special case given use of tariffs for revenue and cultural purposes) (Table
4). These are also the sectors that have the highest levels of domestic support. A number of
countries make intensive use of specific tariffs for agricultural imports. One consequence of this
is that statutory average ad valorem MFN tariffs understate the level of tariff protection,
especially for the EU and Japan.5 In this paper we use estimates of ad valorein equivalents of
specific tariffs for the 158 tariff lines on which the analysis focuses, drawing on data reported in
Stawowy (2001) and OECD (2000) at the tariff line level. Given that estimates of ad valorem
equivalents for Switzerland are incomplete and unreliable, we have excluded this country from
the analysis (Switzerland relies almost completely on specific tariffs).
The global pattern of protection and support to agriculture will have differential impacts
on countries depending on whether they are net producers or consumers of the commodities
5 Fontagne et al. (2002) report that the EU, Japan and the US have 1,059, 418 and 1,148 six-digit tariff lines that aresubject to specific tariffs.
3

affected. A first cut at identifying the likely implications of protectionist policies for individual
countries is to calculate the relative importance of exports and imports of the products that are
subsidized by at least one WTO member. Such data reveal that LDCs are potentially much more
affected than other countries: 18 percent of their exports on average comprise goods that are
subsidized in at least one WTO member, compared to 3-4 percent for other countries (Table 5).
A similar observation holds for imports-nine percent of LDC imports involve products that are
subsidized, compared to 3-4 percent for other countries. For many LDCs the potential incidence
of subsidies is therefore very high. Indeed, for countries such as Benin, Burkina Faso, Burundi,
Chad, Malawi, Mali, Rwanda, Sudan, Tanzania, Uganda and Zimbabwe, 60 to 80 percent of total
exports comprise goods that are subsidized by one or more WTO members. Given that these are
also countries that tend to have preferential-mostly duty-free-access to the European market
(through the GSP and Everything But Arms initiative), this suggests subsidies are an important
issue for WTO negotiations (as subsidies are not covered by preferential access agreements).6
However, this ignores the depressing effects of tariffs by major WTO members on world prices,
as well as the impact of own tariffs-issues that are explored empirically below.
Table 5 also identifies countries where the ratio of imports of subsidized goods to total
imports is higher than the ratio of "affected" exports to total exports. In such cases it is possible
that global liberalization may have short run negative effects on the terms of trade and/or welfare
insofar as the prices of imports are lowered because of subsidies. Countries where the balance is
tilted towards imports of subsidized commodities comprise countries at very different levels of
per capita incomes. They include Bangladesh, Comoros, Egypt, Gambia, Guinea, Jordan, Korea,
Maldives, Mauritania, Morocco, Nigeria, Oman, Saudi Arabia, Senegal, Taiwan, Tunisia and
Venezuela.
The agricultural domestic support numbers reported to the WTO comprise a mix of
instruments and measures. The major distinction that is made is between measures that are
exempted from WTO reduction commitments under the Uruguay Round Agreement on
Agriculture and those that are not. The former include so-called green box support, measures
whose use is permitted for developing countries and payments under production limiting
6 It is difficult to assess to which extent EBA offers actual preferential access to LDCs as rules of origin and othernon-tariff barriers may actually erode the preferential access granted on paper. In the case of the US initiative forSub-Saharan Africa (AGOA), there is data made publicly available on the actual gains for African countries andthese tend to be small (Mattoo, Roy and Subramanian, 2002). In the case of Europe, Brenton and Manchin (2002)show evidence that EU preferential access schemes have offered limited benefits due to restrictive rules of origin.
4

programs (including the blue box).7 The latter include measures that are deemed to directly
support production. As our interest in this paper is to compare the effect of border protection
(tariffs) with domestic subsidy-type support on a product-by-product basis, we use the WTO
Aggregate Measure of Support (AMS) data, as this does not include the effect of border barriers.
We recognize that there are a number of limitations associated with the AMS data. One problem
is that the time period for which data are available is short and reporting is incomplete, especially
for more recent years. This is discussed further in the data annex. Another problem is that the
economic relevance of the AMS time series is limited given the use of the fixed 1986-88
benchmark for purposes of calculating price support. However, given that the econometric and
simulation work is done for one point in time (the average for 1995-1998), this should be less of
a problem in this paper.
3 Analytical framework
To estimate the impact that a reduction in tariffs and/or domestic support may have on exports
and welfare we use a simple partial equilibrium model. World markets are assumed to be
perfectly competitive and integrated, in the sense that'there-is no further scope for arbitrage
across countries. Products traded in world markets under the same 6-digit F[S classification are
considered to be perfectly homogenous.9 Each 6-digit HS product category represents only a
small share of the economy, so that the effect on other product markets of changes in a particular
category is negligible.'0
Import demand for each HS-6-digit product of country c is given by:
aC ~~~~~~~~~~~~(1)"I+ tC XI +.r r]d
' See Hoekman and Kostecki (2001) for a review of the WTO Agreement on Agriculture.8 See de Gorter (2002) for a careful discussion of problems associated with measurement of the AMS.9 In practice there may be heterogeneity even at the 6-digit level in that imports (or exports) may be of a higherquality than exports (imports). In some developing countries high quality imports may have only a limited degree ofcompetition with low quality domestic production. If so, this will imply that traditional measures of protection suchas the ratio of import to domestic price for the product will overstate the magnitude of protection. In this paper weuse only tariffs, not the nominal rate-of protection.'O The setup is very similar to the one in Zietz and Valdes (1986) and Hoekman, Ng and Olarreaga (2002). The latterdiscuss some of the caveats associated with the use of this type of model. Note that no account is taken of issuessuch as the potential .impact of exchange rate overvaluation, indirect taxes and other factors that may result in anoverall anti-agriculture bias and thus offset the effect of tariff protection and/or subsidy policies. Schiff and Valdes(1998) suggest that in many developing countries anti-agriculture bias due to such policies has declined, implyingthat direct instruments such as tariffs and subsidies are the major determinants of the magnitude of protection.
5

where 8 d is the import demand elasticity, pw is the price in the "world" market; t, is the tariff
in country c; cc is the average transport cost from country c to the "world" market;"I SC is the
producer support in country c;12 Ad is the elasticity of import demand to the producer support;
and ac is a demand parameter in country c that captures size and all other factors influencing
import demand.
Export supply for each HS-6-digit product of country c is given by:
F 16Xc = bc P(l + ) S (2)
where 8s is the export supply elasticity, 2A is the elasticity of export supply with respect to
domestic support;' 3 and bc is a supply parameter that captures size and other determinants of
export supply. The transport cost to world markets is also common among exporters and
importers of the same product. The presence of tariffs and domestic support measures may lead
to both imports and exports of a homogenous product for a given country.
We are forced by data constraints to assume that the import demand and export supply
elasticities for products, as well as the import and export elasticities with respect to domestic
support, are identical for all countries in the sample. This has implications for the implied
domestic supply and demand elasticities of domestic support across the countries in our dataset.
For example, if these were relatively similar across countries, and consumption were to be only
marginally affected by changes in domestic support, then import demand elasticities should vary
across countries depending on the ratio of domestic production to exports. Given that production
and consumption data are not available at the six-digit level of the Harmonized System, we
cannot estimate underlying domestic demand and supply elasticities. In the empirical analysis
below we test to what extent the assumption of identical elasticities across countries has
implications for our results.
This explains differences in import prices across different countries as observed in the data.12 We attribute to countries with no domestic support a $1 value for the import demand function not to beundetermined.13 Again, we attribute to countries with no domestic support a $1 dollar value for the export supply function not tobe undetermined. The same caveat as in the previous footnote applies.
6

The equilibrium world price is obtained by solving for the world price in the world
market clearing condition, i.e.,
l/(g.v+ed)
'7 ~~ac
ew = argslE tc XI +VA = =,3PW ;0 -xc =01= o [( +ti S~] (3)Pw C C ,E bS
Pw c c ~ ~ bcscc (I+vrc)
The change in the world equilibrium price following a reduction in tariffs is obtained by taking
the total differential of (3) with respect to rc . The percentage change in the world price with
respect to a common percentage change in tariffs in all countries is then:
d (+C) [(I + tc 1 4
Pw -d+ 6st ac d
L .J(I + tc Xl + TC )SC
where a "hat" (A) denotes the percentage change in the variable.
Similarly, the percentage change in world prices following a common percentage change
in subsidies, s, is given by:14
E SC -1 ac s -1 bcsK
A d C S (+ .X T,)SC S.C C{I+T)(5
L c [(+ tcXl + Tc )] Sc c (1 + Tc ),
The change in export revenue and import revenue associated with a change in tariffs or domestic
support is given by:
14 Here we do not change the $1 domestic support subsidy attributed to countries with no domestic support.7

Xc (+ )P+ As S SC (6)
(d\~~~d _A t Sclmt =-g -l)pw -g t___c
c I ~~~~+ tC SC
where ix is the percentage change in export revenue in country c, and i4 is the percentage
change in import revenue in country c. Note that if there is no producer support or tariffs in
country c, then there will be no changes in export revenue or import revenue in this country, a
part from those induced by the change in world price after other countries have reduced their
tariffs or producer support.
Finally, one can measure the change in welfare in an importing and exporting country by
taking the integral of the import demand and export supply functions with respect to world prices
and tariffs (it is assumed that domestic support is just a transfer from government revenue to
producers). The change in exporters and importers welfare relative to their initial export and
import revenue is then given by:
C A+,( + Pw 1+ s )
c ~ d' Ad + (7) s
tc t S
tCr +t C
where wvx is the change in welfare in an exporting country relative to the initial export revenue;1 5
wCv is the change in welfare in an importing country relative to the initial import revenue. The
first term on the right-hand-side of i47' is the change in import consumer surplus and the second
term is the change in tariff revenue. Note that changes in welfare in (7) take into account shifts of
domestic import demand and export supply functions following changes in domestic tariffs and
domestic support (when relevant). The overall change in welfare can be obtained by adding up
'5 Note that is exactly equal to the percentage change in world prices if the elasticity of export supply is nil.8

the two expressions in (7) after normalizing the two terms to the same base (either exports,
imports, total trade, or in $ per capita terms).
4 Empirical methodology
The empirical methodology consists of three steps. First we estimate import demand and export
supply elasticities with respect to prices and subsidies (i.e., gd 6 s Ad and As). We then
calibrate the demand and supply parameters (i.e., a, and b, ) for each country and product (at the
HS six-digit level). Finally, we use the elasticities and calibratecl parameters to measure the
changes in world prices, export revenue, import revenue and welfare following a 50 percent
reduction in agriculture tariffs and domestic support in all countries.
To estimate the different elasticities, we could simply estimate the import demand and
export supply functions (1) and (2). However, these are simultaneously determined in any
country c. Moreover, we do not observe "world" prices, but only export and import unit values in
each country, which include transport costs. If traded quantities are measured with error (which
is likely as customs generally are more concerned with value), unit values will also be measured
with error, which may bias our results.'6 To avoid these problems we first choose units so that
the average world price of each product for the period 1995-199 8 is equal to 1. We then estimate,
across countries and products, the net import demand function as the log difference of import
demand and export supply for each country (measured in value terms due to the choice of units)
in each country. Note that the world prices will then drop from this specification as
log(p,) = log(1) = 0.
Using the import demand and export supply functions in equations (1) and (2), we obtain
the following estimating equation:
log(mr )_ log(x' )= log(aj )- log(b, ) _d log(1 + t- )-
(ed _ Es )log(l + r- - (d + X )log(s, (
16 Note that it is not clear what can be use as an instrument for unit values at the six digit level of the harmonizedsystem.
9

As controls for ac and bC we use GDP and population in each country. Product dummies at the
HS six-digit level are also included.17
In the second step, using the elasticities estimated using a stochastic version of (8), we
calibrate ac and bc using (1) and (2). The estimation of changes in world prices, import revenue,
export revenue and welfare is done using equations (4) to (7).
Data on import and export revenue as well as tariffs are available from the World Bank
WITS database at the six digit of the harmonized system. The measure of domestic support that
is used is the WTO Aggregate Measure of Support (AMS), obtained from the WTO, based on
member notifications (WTO document G/AG/NGIS/1, April 13, 2000). The AMS data are based
on an arbitrary product classification and were concorded to the HS classification (see the Data
Annex).
Only 30 WTO members have made domestic support reduction commitments under the
Agreement on Agriculture (AoA), but all members are required to notify domestic support.
Compliance is weak-in 1995 only 75 percent of all WTO members that were required to notify,
did so. In 1996 and 1997 the coverage drops to around 50 percent; for 1998 only 28 percent of
WTO members had notified by March 2000. However, most countries that did not notify in
1997-8 had very little or no support in 1995-6, so the coverage of the data spans the major users.
To address the incomplete reporting problem, we use the average AMS reported for whatever
years are available. The empirical analysis therefore involves an unbalanced panel.
Domestic support notified to the WTO includes exempt and non-exempt measures. There
are nine categories of support, designated DS 1 through DS9. DS 1 covers measures that WTO
members have placed in the "green box", and are therefore exempt from reductions (the green
box categories are defined in Annex 2 of the AoA). DS2 comprises measures that, for developing
countries, are exempt from reduction commitments under Article 6.2 of the AoA relating to
development programs. DS3 is used to signify direct payments under production-limiting
programs under Article 6.5 of the AoA. Categories DS4 to DS9 comprise measures that are not
necessarily exempt from reduction commitments. DS4 refers to non-exempt support that is
below the de minimis level (as set out in Article 6.4 of the AoA). The remaining categories
included in the total AMS of WTO members include market price support (DS5), non-exempt
'1 A justification for the introduction of GDP and population as control variables could be associated with the ideathat import demand for agriculture products is a function of the level of development in each country. Alternatively,the constrained version of (8) using GDP per capita could be interpreted as capturing the capital labor ratio of eachcountry. The constrained specification yields results within one standard deviation of those reported later in Table 6.
10

direct payments (DS6), other product-specific support (DS7), and any support measured via the
Equivalent Measurement of Support methodology (DS8). Finally, where relevant, a total figure
for non-product-specific support is also given (DS9).18
Two problems with the estimation of equation (8) are (i) that transport costs are not
directly observable and (ii) that we cannot retrieve the elasticity of import demand and export
supply with respect to domestic support, but only its sum. Assumrting that transport costs to the
world market are equal for exporters and importers, these costs can be proxied by the ratio of
export and import unit values. As long as the measurement error in unit prices is identical for
exports and imports the problems described above are addressed. As regards the second issue, we
assume that elasticities of import demand and export supply with respect to domestic support are
equal. 19
5 Results
We first focus on the estimation of the price and domestic support elasticity of export supply and
import demand and then turn into the results of the simulation exercise.
Estimating elasticities
Table 6 reports the results of the estimation of equation (8) using different measures of domestic
support. In column 1 results are reported using notifications by WTO members of non-exempt
support (this corresponds to categories DS4 to DS9 according to WTO notification procedures).
These are (generally) product specific and include market price support (calculated according to
the methodology in Annex 3 of the Uruguay Round Agreement on Agriculture) and non-exempt
direct payments (denoted sf5 4 9 ). Column 2 reports results using: notifications on exempt
domestic support (this corresponds to categories DS 1 to DS3 according to WTO notification
procedures). These are non-product specific and include measures which WTO) members have
placed in the "green box", measures that are exempt in developing countries and direct payments
'a CGE analyses are usually based on the PSE data compiled by the OECD, which not only includes price supportmeasures, but, more importantly, does not correspond to the typology of measures that are the focus of WTOnegotiations (e.g., production vs. other (decoupled) support. See Dimaranan (2002) for a noteworthy attempt to mapPSE support data into types of policy measures as a function of the factor of production that is supported.19 Note that if the ratio of production to exports and imports is different, then one should expect different elasticitiesof import demand and export supply for a given elasticity of dornestic supply to domestic support. One way to(partially) reconcile this with our results is to recognize that the change in domestic support will also affect domesticdemand through changes in domestic and world prices. In the estimations, we test the robustness of our results byvarying the elasticities with respect to domestic support on the demand and supply side.
11

under production-limiting programs (the 'blue box'). Such non-product specific support is
allocated for purposes of estimation across products using the distribution of domestic support
commitments by product (the idea being that exempt support is likely to be higher in sectors
where non-exempt support is larger following a political-economy logic). This type of domestic
support is denoted as 5 DS13. Column 3 reports results of the estimation of (8) with the two types
of domestic support entering separately. Finally, Column 4 reports results using the sum of both
types of support.
Given the unbalanced nature of the data set, we work with a between estimator, using as
observations the average across the four year period for which support data are available, rather
than the annual data (i.e., the sample is a cross-section of countries and products). 20 The
elasticities are then identified using the cross-country variation for each product.21 Results across
the four specifications generally yield an elasticity of import demand around 1.36-1.45 and an
elasticity of export supply around 0. 19-0.28. The (sum) of the elasticities of domestic support
varies from almost 0 (in the case of DS 1-3 in column 3) to 0.10 in column 1 (for DS4-9). The
fact that DS 1-3 is insignificant in column 3 may be due to collinearity problems given the
methodology used to construct this variable (i.e., general domestic support is distributed across
products using product specific support commitments). When both types of domestic support are
added up in column 4, the (sum) of the elasticity of domestic support is statistically significant.
To determine whether we should work with the sum of the two types of domestic support,
we run a non-linear specification of equation (8) to test whether the two types of domestic
support can simply be added up. Results are reported below, with standard errors in
parenthesis:2 2
log(mr)-log(xr)= 0.29+ 0.34 log(gdp,)- 0.45 log(popJ)- 0.34 log(1+t )-(0.42) (0.04)** (0.04)** (0.05)**
(9)1.17 log(l +±r- 0.04 log s DS4-9 + 0.00 s DSI-3
(0.08)** (0.02)* (0.00) c
20 This is also due to the fact that ad-valorem equivalents of specific tariffs have only been estimated for 1999 inOECD (2000) and Stawowy (2001).21 Thus, the variation in import and export prices across countries, which is explained by transport cost to the"world" market, allows us to identify the different elasticities.22 A "*" indicates statistical significance at the 5 percent level; "**" indicates significance at the I percent level.
12

Equation (9) suggests that we should drop the general domestic support DS 1-3 from the
estimation, as the coefficient on sDSI3 is not significantly different from zero. In the specification
we employ in the simulations below we therefore only include non-exempt domestic support
s 4 -9 , i.e., we use the results reported in column 1 of Table 6. Thus, the 50 percent reduction in
domestic support used in the simulations pertains only to non-exempt domestic support (as
exempt domestic support does not seem to affect trade flows and therefore should have no-or
little-impact on world prices).2 3
The estimation in column 1 is done across the 158 HS 6 digit commodities. We assume
these elasticities to be common across these different products. This is not necessarily the case of
course, as there may be heterogeneity across products. Table 7 reports results of the estimation in
column 1 of Table 6 letting the elasticity vary across different groups of products (a seemingly
unrelated regression technique was used to provide standard error estimates to control for a
common explanatory variable that is omitted from the regression). The first five! columns in
Table 7 report the results for animal products (HS 01 to 04), vegetables, fruits and nuts (HS 6 to
9), cereals and grains (HS 10 to HS 14), processed food products (HS 15 to HS 24), and cotton
and other textile fibers (HS 50 to 53). While the variations in import demand and export supply
elasticities are quite large, the elasticity with respect to domestic support is similar across sectors
(it varies between -0.07 and -0.16). The product group-specific elasticities are used below as the
base estimates for the simulation exercises. The overall. estimates in column 1 of Table 6 are
used to test for the robustness of the results.2 4
As mentioned, because we use the information on cross-country variation to estimate the
different elasticities, it is assumed that these elasticities do not vary across countries. If we were
to relax this constraint, the solution to the model in Section 3 would be non-linear. To determine
the restrictiveness of this assumption we estimated the equation in column 1 of Table 6 for the
developing countries only. All elasticities are within one standard deviation of the elasticities for
the whole sample (except for the import demand elasticity which is within two standard
deviations). We then estimated it for the three major users of domestic support separately: the
23 Note that exempt domestic support is generally de-linked from production and is more likely to affect theproduction decision rather than the level of production as measured when working with trade flows.
4 Note that for Animal products, Cereals and other grains, and Sillk, Cotton & other fibres, the coefficient capturingthe import demand elasticity is insignificant whereas the difference between the import demand and export supply*price elasticities is significant. In these three cases, we cannot reject the assumption that the export supply elasticityis zero. We therefore set the export supply elasticities to zero in the simulations for these products and calibrate theimport demand elasticities accordingly.
13

EU, Japan and the United States. The results suggest heterogeneity in the price elasticities across
countries, but the imprecision in the parameter estimates did not allow the hypothesis to be
rejected that they are equal across countries. Estimates of elasticities with respect to domestic
support were relatively homogenous (-0.08 for the EU, -0.12 for Japan and -0.10 for the United
States). Thus, the elasticity of net import demand with respect to domestic support seems to be
relatively small (around 0.1) suggesting a reduction in domestic support across WTO members is
likely to have a small impact on world prices.25
Simulation results
In our baseline simulations we use the estimated coefficients in Table 7 to calibrate import
demand and export supply in each country. Then changes in export revenue, import revenue, and
welfare following a 50 percent cut in tariffs and domestic support to farmers across all WTO
members are calculated for each country using (6) and (7). We also calculate the change in terms
of trade by weighting the changes in prices by export and import shares in each country. Recall
that the simulations are done for the 158 tariff lines at the HS 6-digit level for which at least one
country provides domestic support to its farmers. (The overall agricultural universe includes
more than 900 tariff lines at the HS 6-digit level).
Table 8 reports results on the change in export revenue, the import bill, the terms-of-trade
and welfare for the three broad country groups of a 50 percent tariff reduction or a 50 percent
domestic support reduction. Aggregate product specific and individual country results are
reported in Appendix Tables 1 and 2. The increase in trade across all country groups is much
larger for the 50 percent tariff cut than for the reduction in domestic support. Exports of
developing countries (excluding LDCs) increase by $4.2 billion, or 6.7 percent of the initial
export revenue for the 158 product categories (Table 8). LDC exports increase by $116 million
(or 3.7 percent), while industrialized country exports increase by $3.3 billion dollars (4.7
percent). There is also an increase in the import bill following the 50 percent tariff reduction. In
industrial countries the increase in imports is double the increase in exports (due both to an
25 Note that the implicit assumption here is that domestic support only affects the variable cost of farmers receivingthe subsidy, as we move along the export supply and import demand functions. If domestic support affects fixedcosts (or the production decision), as is probably the case with subsidies that are decoupled from production, wewould need to work along the domestic supply function. Data on production is not available for such a large numberof countries at the disaggregated level required. This also suggests that we should be working only with non-exemptsubsidies (which are generally not decoupled from production).
14

expansion in demand and higher world prices). The increase in imports in developing and least
developed countries is roughly equal to the increase in exports.2 6
In relative terms many developing countries see a significant expansion in exports
following a 50 percent cut in tariffs. Figure 1 plots the impact on exports of a 50 percent cut in
tariffs (in the vertical axis) and domestic support (in the horizontal axis) trade for the 121
developing and least developed countries in the sample. The vertical and horizontal lines indicate
a "zero" change in exports due to a cut in tariffs or domestic support, respectively. The highest
percentage increases in exports are found in the Caribbean and Central American region
reflecting the specialization of these countries in commodities such as edible fruits and
vegetables, processed foods and sugar-the categories that see the largest expansion in demand
in percentage terms (Appendix Table 1).27 Mauritius, Philippines and Thailand-all developing
countries that are producers of such commodities--also see increases in exports of over 10
percent. With a few exceptions such as Congo and Malawi, Afirican countries tend to register
only limited increases in exports.
The increase in exports following a 50 percent cut in domestic support is a tenth of what
is generated by cutting tariffs (Table 8). Developing country exports increase by $0.5 billion, or
0.8 percent of the 1995-1998 average level of exports. LDC exports rise by $64 million (2
percent), while industrial countries expand exports by $314 million (0.5 percent). More striking
is the fact that the import bill decreases in developing and least developed countries after a 50
percent cut in domestic support (Figure 2). The reason for this is that world prices increase after
the cut-import demand functions being relatively elastic, the import bill necessarily decreases.
Welfare increases in all groups of countries after multilateral tariff rei.orrns (Table 8). The
increase in welfare for developing countries generated by the 50 percent tariff cut is due not only
to increased exports, but to the liberalization that occurs in these countries (and the absence of
domestic support). In contrast, developing countries as a group would see a small reduction in
welfare following a cut in domestic support. The relatively high tariffs that prevail in many of
these countries explain why the impact in welfare terms is so different. The potential negative
implication of a cut in domestic support illustrates the importance of also cutting tariffs.
26 Note that the increase in exports is not necessarily equal to the increase in imports at the aggregate level for tworeasons. First, increases in export and import revenue are measured at customs and therefore include transport cost.Second, we did not have data for all countries, so it is assumed that the rest-of-the world also adjusts to changes inworld prices.
15

In the case of LDCs the ratio of gains is quite different. Instead of a ten to one ratio of
export gains due to tariff vs. domestic support cuts, it is only two to one. Moreover, the
simulations suggest that LDCs will obtain welfare gains from both types of reform. These
differences between the two country groups reflects both the LDCs greater 'sensitivity' in
relative terms to OECD support policies and the pattern of production and trade in the various
products.
There is substantial heterogeneity across countries, reflecting differences in export and
import bundles. Variations in the levels of tariffs and domestic support across different products
in large trading partners also partly explain this heterogeneity. A cut of 50 percent in tariffs
generates a relatively large increase in developing country exports of edible vegetables, fruits
and nuts (HS07-08), sugar (HS 17) preparations of vegetables and fruits (HS 20-21) and tobacco
(HS24). In the case of LDCs, the largest increases occur in meat (HS02), sugar and
miscellaneous edible preparations (HS2 1) (Appendix Table 1).28
A large number of countries in the sample see their terrns-of-trade deteriorate after a 50
percent tariff cut (Appendix Table 2). This is also the case following a 50 percent cut in domestic
support. Figure 3 plots the change in terms of trade following changes in tariffs and domestic
support. As before, the vertical and horizontal lines indicate a "zero" change in the terms of
trade. Changes in terms of trade seem to be positively correlated across the two types of cuts, i.e.,
countries that see their terms of trade increase after a tariff cut will also see their terms of trade
improve after a domestic support cut.
The fact that the terms-of-trade deteriorates does not necessarily imply a reduction in
welfare, given that countries own reforms will tend to increase welfare. Nonetheless in a number
of instances welfare does decline. This is the case in particular for oil producers and large net
importers such as Algeria, Bahrain, Brunei, Egypt, Gabon, Oman, Russia, Saudi Arabia, and
Venezuela. Any welfare losses are generally much smaller if the experiment is a 50 percent cut
in domestic support. Figure 4 plots the change in welfare per capita under the tariff cut against
the change in welfare per capita under the domestic support cut for the countries in the sample,
with the horizontal and vertical lines again indicating a "zero" change in welfare. Thus, countries
in the North East quadrant of Figure 2 see their welfare increase under both types of reforms.
27 To the extent that these countries enjoy tariff preferences in some products for these products, results mayoverstate their gains. But again, preferential access on paper does not necessarily mean actual preferences granted.Second, these are very small countries that only marginal affect the overall picture for developing countries.28 Note that here we abstract from sanitary or phyto-sanitary barriers, as well as other non-tariff barriers that mayalso be hindering trade.
16

This includes Mauritius, Fiji, Belize, Guyana, Costa Rica, Uruguay, etc. There are no countries
in the South East quadrant, suggesting that there is no case where a country increases its welfare
following a cut in domestic support but sees its welfare reduced under the tariff cut. Losers under
both types of reforms include the large net importers mentioned previously.
Sensitivity analysis
Given the various assumptions made with respect to elasticities, a number of sensitivity analyses
were performed. We first re-estimated the figures in Table 8 using the elasticity estimates
provided for the whole sample in the first column of Table 6 (finstead of the elasticity estimates
by product reported in Table 7). We also re-estimated the numbers of Table 8 using extreme
values (i.e., instead of half the estimated coefficient in Table 8, we use either zero or the total
value of the estimated coefficient) for the elasticities of domestic support on the import and
export side. Finally, we compared results with the case where only OECD members reduce their
tariffs and domestic support.
Using the elasticities estimated for the whole sample, the increase in exports after a 50
percent tariff cut is 25 percent lower for developing countries and 15 percent lower for LDCs.
On the other hand, the increase in exports after a 50 percent cut in domestic support is 25 percent
higher for developing countries, but 20 percent lower in the case of LDCs. T hus the imbalance in
terms of gains is partly reversed. However, the qualitative results remain: the increase in exports
by developing countries is 5 times larger under the 50 percent tariff cut than under the 50 percent
domestic support cut. Similarly, for LDCs the increase in exports under the 50 percent tariff cut
is 2 times larger than under the domestic support cut. The welfare gains for developing countries
are positive in the case of tariffs, whereas they suffer welfare losses when domestic support is
cut. For LDCs the welfare increase is 50 percent higher under the tariff cut.
As noted earlier, we cannot empirically identify the elasticity of domestic support on
import demand and export supply separately, but only its sum. To test the sensitivity of our
assumption that the two are equal, we assume that each in turn is zero and that the coefficient
identifies the other one. The estimated changes in export revenue, imports and welfare of a 50
percent tariff cut are not affected by these modifications (as import demand and export supply
are re-calibrated accordingly). In the case of a 50 percent cut in domestic support, the increase in
exports by developing countries is 30 percent higher when we assume that the domestic support
elasticity of export supply is zero and 80 percent lower when we assume that the domestic
17

support elasticity of import demand is zero. In terms of developing countries' welfare, the loss is
22 percent lower when the elasticity of export supply is zero and 25 percent higher when the
elasticity of import demand is zero. However, the qualitative results remain the same. In the case
of LDCs, the estimated change in exports is only marginally affected under both scenarios.
We also ran a scenario where the 50 percent cut in tariffs and domestic support is
undertaken only by OECD countries. In the case of domestic support, the increase in exports of
developing countries is only 3 percent lower, which suggests that for non-LDC developing
countries almost all the action from the reduction in domestic support comes from actions by the
OECD. However, the increase in exports is 25 percent lower for LDCs. This suggests that
domestic support in other developing countries affect LDC exports to a larger extent than other
developing countries. This is also the case for tariff cuts. When OECD countries cut their tariffs
by 50 percent, the increase in LDC exports is only 30 percent of the increase in exports when all
WTO members reduce their tariffs by 50 percent. For other developing countries, the increase in
exports under an OECD tariff cut is only half of the $4.2 billion generated if all WTO members
reduce their tariffs by 50 percent. These results illustrate the importance of more general
liberalization of trade in the commodities concerned.
6 Conclusions
As is the case for tariff peaks-see Hoekman, Ng and Olarreaga (2002)-we find that LDCs are
disproportionately affected by agricultural support policies. Reducing such support is therefore
important. However, tariffs matter a lot more than subsidies in terms of their impact on world
prices. The positive welfare effect of reducing tariffs onproducts that are also affected by
agricultural support is a multiple of what can be achieved from an equivalent percentage cut in
domestic support only-tariff reductions generate welfare gains that are a multiple of what can
be obtained from reductions in support policies. This not only reflects the high tariff peaks in
OECD countries, but the fact that developing countries use tariffs to protect domestic production.
These countries generally have low levels of domestic support, reflecting both budget constraints
and a more neutral policy stance in terms of supporting this sector of the economy.
Our analysis suggests the primary focus of attention should therefore be on reducing
border protection in both OECD and developing countries. The negotiating challenge is how to
achieve this. For developing countries tariffs are an important-indeed often the only-
instrument of intervention that they have available to respond to the effects of OECD subsidy
18

policies. An important dimension of agricultural support policies that has been ignored in this
paper-the impact on price volatility-plays a major role here (Valdes and Foster, 2002). Tariff
protection can shelter farmers from import surges in periods where world prices drop
significantly. Whatever the source of the exogenous shock that drives prices down, much of the
adjustment may fall disproportionately on residual (non-OECD) markets because support
policies shelter OECD farmers from the shock. Unilateral liberalization of agricultural trade in
countries such as India proved to be politically umsustainable as farmers were subjected to large
world price swings and import surges of subsidized commodities (Gulati and Narayanan, 2002).
Further agricultural trade liberalization in developing countries may be significantly impeded in
an environment that is characterized by continued large-scale support for OECD farmers.
Substantial reduction in OECD agricultural support policies is therefore important not only
because it generates direct benefits for the many developing economies that are net exporters, it
is critical to create the political support to induce (allow) developing country governments to
continue to pursue welfare improving domestic agricultural trade policy reforms. Thus,
reductions in production subsidies in OECD cotntries are necessary, although not sufficient, for
developing countries to reap significant gains from the current WTO negotiations on agriculture.
At the same time, as noted by Anderson (2002), if OECD members were to move on the subsidy
front, it is important that developing countries reduce protection. Without own liberalization the
negative welfare effects for countries that experience terms of trade losses would likely be
greater.
The fact that our simulations suggest that a number of countries are predicted to lose
from reforms suggests liberalization and removal of domestic support should be accompanied by
compensation mechanisms, which could include additional 'aid for trade' (Hoekman, 2002). Any
negotiated reforms will only be implemented gradually, allowing for measures to support
adjustment. Such measures should include actions that improve the functioning of input,
downstream and factor markets to support efforts by farmers to expand output in response to a
rise in prices (Anderson and Hoekman, 2000). Measures to ieduce costs for farmers are
particularly important. Examples include action to improve the efficiency of services-finance,
insurance, transport, storage, packaging, etc. The cost-increasing effect of inefficient services can
be substantial-as illustrated in recent research on transport services (Fink et al. 2002; Francois
and Wooton, 2001). Indeed, if such accompanying measures are taken, the resulting supply
19

response may cause some countries to shift from net importer to net exporter status, attenuating
the magnitude of the negative effects estimated above (Anderson, 2002).
Finally, it is important to bear in mind that our analysis has been limited to only a few-
the subsidized-commodities. The Doha negotiations span all trade, including non-subsidized
agricultural products and manufactures. The overall welfare numbers generated by our analysis
are therefore not particularly relevant, except to indicate that the countries that lose from reforms
that affect the subsidized subr set of agricultural products will need to identify other areas in
which they can generate offsetting gains. In principle this should be feasible given the large
negotiation set that was established in Doha.
20

References
Anderson, Kym. 2002. "Trade Liberalization, Agriculture and Poverty in, Low IncomeCountries," presented at the TIPS Annual Forum (September). See www.tips.org.za.
Anderson, Kym and Bernard Hoekman. 2000. "Developing Country Agriculture and the NewTrade Agenda," Economic Development and Cultural Change 49: 171-90.
Beghin, John, David Roland-Holst and Dominique van dei Mensbrugghe: (2002), "How willAgricultural Trade Reforms in High-Income Countries Affect the Trading Relationshipsof Developing Countries?, World Bank, nmimeo.
Brenton, Paul and Miriam Manchin (2002), "Making EU trade agreements work: the role of rulesof origin", Center for European Policy Studies Discussion Paper 183 (March).
Dimaranan, Betina, Thomas Hertel and Roman Keeney. 2002. "OECD Domestic Support and theDeveloping Countries," Purdue University, mimeo.
Fink, C., A. Mattoo and I. Neagu. 2002. "Trade in International Maritime Services: How DoesPolicy Matter," World Bank Economic Review.
Fontagne, Lional, J.L. Guerin and S. Jean (2002), "Multilateral Trade Liberalization: Scenariosfor the New Round and Assessment," CEPII, Paris, mimeo.
Francois, J. and I. Wooton. 2001. Trade in Intemational Transport Services: The Role ofCompetition," Review of International Economics 9:249-61.
de Gorter, Harry (2002), "The AMS and Domestic Support in WTO Trade Negotiations onAgriculture: issues and suggestions for new rules", The World Bank, mnimeo.
Gulati, Ashok and Sudha Narayanan (2002), "Managing Import Competition When DevelopingCountries Liberalize Trade: The Indian Experience," IFPRI, mimeo.
Hertel, Thomas. 1989. "Negotiating Reductions in Agricultural Support: Implications ofTechnology and Factor Mobility," American Journal ofAgricultural Economics, August,pp. 559-73.
Hoekmnan, Bernard (2002) "Strengthening the Global Trade Architecture for Development: ThePost- Doha Agenda," World Trade Review 1:1, 23-45.
Hoekman, Bernard and Michel Kostecki (2001), The Political Economy of the World TradingSystem: The WTO and Beyond. Oxford: Oxford University Press.
Hoekman, Bernard, Francis Ng and Marcelo Olarreaga (2002), "Eliminating Excessive Tariffs inthe QUAD and Least Developed Country Exports", World Bank Economic Review 16 (1)1-21.
Mattoo, Aaditya, Devesh Roy, and Arvind Subramanian (2002), "The Africa Growth andOpportunity Act and Rules of Origin: Generosity Undermined?," IMF/World Bank,mimeo (http://www.worldbank.org/trade).
OECD (2000), "Post Uruguay Rounds tariff regimes: achievements and outlook," OECD: Paris.Rae, Allan and Anna Strutt. 2002. "The Current Round of Agricultural Trade Negotiations: Why
Bother about Domestic Support?," presented at the 5 th annual conference on globaleconomic analysis, Taipei, 5-7 June.
Schiff, M. and A. Valdes (1998), Agriculture and the Macroeconomy," Policy Research WorkingPaper 1967, World Bank.
Stawowy, Wojciech (2001), "Calculation of ad-valorem equivalents of non-ad-valorem tariffs:methodology notes", UNCTAD, Geneva, mimeo.
21

Valdes, Alberto and William Foster (2002), "On the Management of Price Risk in the Context ofTrade Reform in LDCs," mimeo.
Zietz, Joachim and Alberto Valdes (1986), "The potential benefits to LDCs of TradeLiberalization in Beef and Sugar by Industrialized Countries", WeltwirtschaftlichesArchiv 122 (1), 94-112.
22
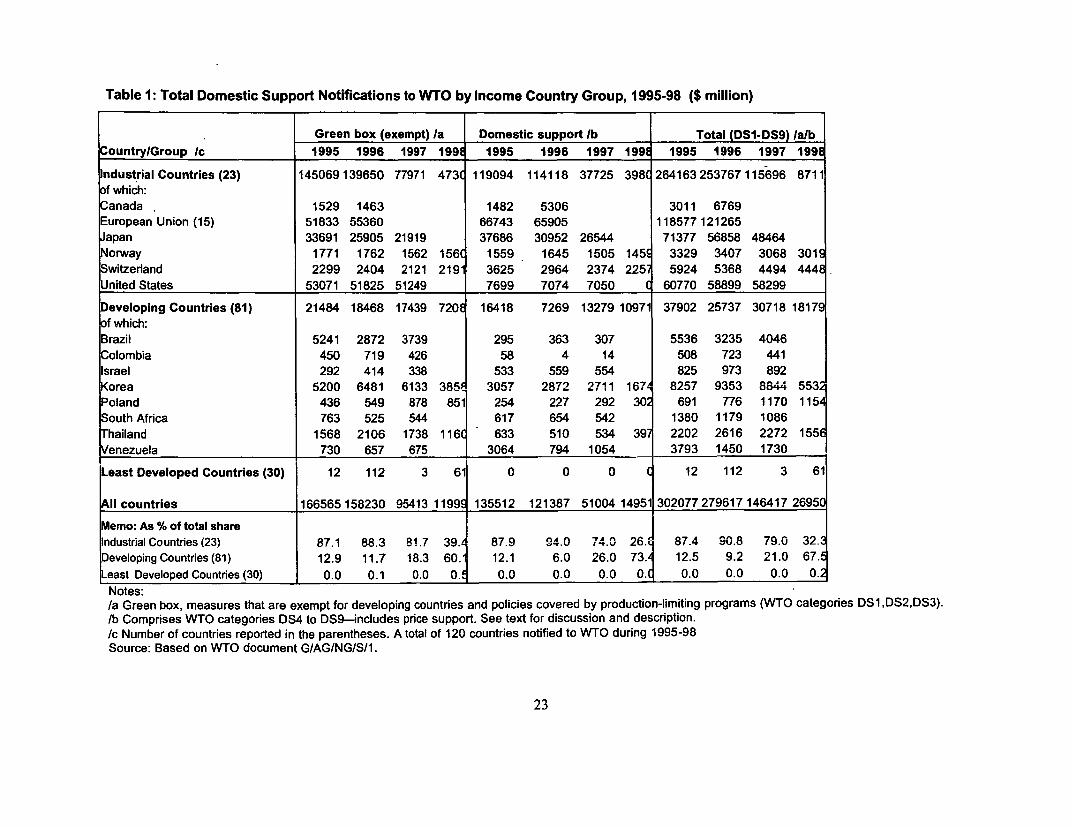
Table 1: Total Domestic Support Notifications to WTO by Income Country Group, 1995-98 ($ million)
Green box (exempt) la Domestic support lb Total (DSI-DS9) lalbCountry/Group /c 1995 1996 1997 199f 1995 1996 1997 1991 1995 1996 1997 1998ndustrial Countries (23) 145069 139650 77971 473 119094 114118 37725 398( 264163253767 115696 8711f which:
Canada 1529 1463 1482 5306 3011 6769European Union (15) 51833 55360 66743 65905 118577 121265apan 33691 25905 21919 37686 30952 26544 71377 56858 48464
Norway 1771 1762 1562 156 1559 1645 1505 145 3329 3407 3068 301Switzerland 2299 2404 2121 219 3625 2964 2374 225 5924 5368 4494 444.United States 53071 51825 51249 7699 7074 7050 ( 60770 58899 58299Developing Countries (81) 21484 18468 17439 720 16418 7269 13279 10971 37902 25737 30718 1817of which:Brazil 5241 2872 3739 295 363 307 5536 3235 4046Colombia 450 719 426 58 4 14 508 723 441Israel 292 414 338 533 559 554 825 973 892Korea 5200 6481 6133 385 3057 2872 2711 167 8257 9353 8844 5532Poland 436 549 878 851 254 227 292 30 691 776 1170 1154South Africa 763 525 544 617 654 542 1380 1179 1086Thailand 1568 2106 1738 116C1 633 510 534 397 2202 2616 2272 1556Venezuela 730 657 675 3064 794 1054 3793 1450 1730Least Developed Countries (30) 12 112 3 61 0 0 0 12 112 3 61
All countries 166565 158230 95413 11999 135512 121387 51004 14951 302077279617 146417 26950Memo: As % of total shareIndustrial Countries (23) 87.1 88.3 81.7 39. 87.9 9A.0 740 26. 87.4 90.8 79.0 32.Developing Countries (81) 12.9 11.7 18.3 60. 12.1 6.0 26.0 73. 12.5 9.2 21.0 67.east Developed Countries (30) 0.0 0.1 0.0 0.' 0.0 0.0 0.0 0. 0.0 0.0 0.0 0. Notes:/a Green box, measures that are exempt for developing countries and policies covered by production-limiting programs (WTO categories DS1,DS2,DS3)./b Comprises WTO categories DS4 to DS9-4ncludes price support. See text for discussion and description./c Number of countries reported in the parentheses. A total of 120 countries notified to WTO during 1995-98Source: Based on WTO document G/AG/NG/S/1.
23

Table 2: Commitments and Average Direct Domestic Support Levels, 1995-98
Direct Support ($ mil) As % of Total (in %)HS-2 Product Commitment 1995-98 ommitment 1995-98
01 Live animals. 250 63 0.1 0.102 Meat and edible meat offal 60155 14907 22.3 18.504 Dairy prod; birds' eggs; honey 39372 11557 14.6 14.306 Live tree & other plant; bulb, cut flowers 0 14 0.0 0.007 Edible vegetables and roots & tubers 10326 397 3.8 4.908 Edible fruit and nuts; melons 7879 3474 2.9 4.309 Coffee, tea, mat and spices 1272 50 0.5 0.110 Cereals. 104109 27953 38.5 34.611 Milled products; malt; starches 421 142 0.2 0.212 Oil seed, oleaginous fruits 8577 447 3.2 0.613 Lac; gums, resins & other vegetables 0 0 0.0 0.015 Animal/vegetable fats & oils & prod 1899 105C 0.7 1.317 Sugars and sugar confectionery 12370 5304 4.6 6.618 Cocoa and cocoa preparations 16 0.0 0.00 Prep of vegetable, fruit, nuts prod 892 52S 0.3 0.7
21 Miscellaneous edible preparations 0 0.0 0.022 Beverages, spirits and vinegar 4306 1172 1.6 1.523 Residues & waste from food industry 382 192 0.1 0.224 Tobacco and manufactured 2662 735 1.0 0.90 Silk. 416 14 0.2 0.0
51 Wool, fine/coarse animal hair nest 124 17 0.0 0.052 Cotton. 3411 655 1.3 0.853 Other vegetable textile fibers & yarns 34 71 0.0 0.198 Non-product specific 11276 8392 4.2 10.4
Total Above Agricultural Products 270151 80714 100.0 100.0
Note: Direct domestic support is defined as the sum of WTO DS4-9 categories. See text.
Source: Based on WTO document G/AG/NG/S/1.
24

Table 3: Average MFN Tariff on Products Benefiting from Domestic Support(including ad valorem equivalent of slpecific tariffs)
MFN Appliedl Tariff Maximum RateCountries Average 1995-98 (%) Average 1995-98 (%)Developed CountriesAustralia 1 7anada 30 1403EC15 22 219
celand 9 61apan 51 865ew Zealand 1 10orway 19 555nited States 14 121
Developing Countries _ _ _ _ _ _ _ _ _ _ _ _ _ _ _ _ _ _ _ _ _ _ _
AIbania 14 30AIgeria 24 45
ntigua and Bar 27 40Argentina 9 21ahrain 7 120arbados 22 40elize 24 40olivia 10 10razil 9 33ameroon 23 30hile 11 1Ihina 28 114olombia 14 20
Congo, Rep. 21 30osta Rica 13 103ote d'lvoire 17 35uba 9 30zech Republic I 1 124
Dominica 22 40Dominican Republic 17 35Ecuador 13 20gypt, Arab Rep 31 1050I Salvador 13 25
Gabon 23 30Ghana 19 25Grenada 20 40Guatemala 12 20
uyana 25 100onduras 14 30Hungary 30 85
ndia 28 185ndonesia 13 104ran, Islamic R 3 15srael 4 22amaica 25 40
Jordan 23 180Kenya 22 50Korea, Rep. 46 284Latvia 10 45ithuania 8 71alaysia 8 257
Malta 3 40Mauritius 20 80Mexico 15 171orocco 45 362
Nicaragua 8 38Nigeria 27 75
25

MF N Applied Tariff Maximum RateCountries Average 1995-98 (%) Average 1995-98 (%)Oman 2 5akistan 36 70
Panama 11 50apua New Guinea 38 85araguay 9 25eru 16 25hilippines 22 58oland 14 44
Romania 21 144Russian Federation 9 25Rwanda 25 100Saudi Arabia I1 65
lovenia 9 49outh Africa 7 55ri Lanka 33 60t. Kitts and N 21 40t. Lucia 22 40
Suriname 22 50Taiwan, China 18 50Thailand 41 65Trinidad and Tobago 20 40Tunisia 33 43Turkey 28 145
ruguay 10 24Venezuela 13 20Zimbabwe 26 68Least Developed CountriesBangladesh 40 300Burkina Faso 21 37Central African 20 30Chad 22 30
\4adagascar 7.5 20Malawi 18 45Maldives 16 50Mali 19 30Mozambique 15 35olomon Islands 40 100
Sudan 8 30Tanzania 29 40Uganda 13 36Zambia 17 25Memo:All Above Countries 18 1403ndustrial Countries 19 1403Developing Countries (non-LDC) 17 1050Least Developed Countries 20 300
Note: Countries with zero tariffs not reported (Brunei, Estonia, Hong Kong, Kyrgyz, Rep. Singapore)Source: UNCTAD TRAINS tariff data (through WITS), OECD (2000) and Stawowy (2001).
26

Table 4: Average MFN Tariff on Products with Domestic Support
Average MaximumHS-2 Product 1995-98 (%) 1995-98 (%)01 Live animals. 11.6 555.002 Meat and edible meat offal 2'1.0 361.504 Dairy prod; birds' eggs; honey 29.4 349.506 Live tree & other plant; bulb, cut flowers 16.2 249.007 Edible vegetables and roots & tubers 24.0 865.408 Edible fruit and nuts; melons 20.0 238.909 Coffee, tea, mat and spices 16.7 559.310 Cereals. 21.8 719.111 Milled products; malt; starches 31.1 1402.812 Oil seed, oleaginous fruits 11.2 686.013 Lac; gums, resins & other vegetables 10.8 65.015 Animal/vegetable fats & oils & prod 15.3 188.017 Sugars and sugar confectionery 26.6 209.018 Cocoa and cocoa preparations 9.0 55.020 Prep of vegetable, fruit, nuts prod 23.0 162.821 Miscellaneous edible preparations 32.1 302.422 Beverages, spirits and vinegar 36.7 1050.023 Residues & waste from food industry 7.1 45.024 Tobacco and manufactured 20.1 257.350 Silk. 23.4 235.851 Wool, fine/coarse animal hair 6.3 54.952 Cotton. 5.2 35.353 Other vegetable textile fibres & yarns 5.9 52.5
Total (all items with positive domestic support) 18.4 1402
Memo:All Agricultural Products 19.8 1772
Source: UNCTAD TRAINS tariff data (through WITS), OECD (2000) and Swawoy (2001).
27

Table 5: Trade in Domestically Supported Agricultural Products by Country, 1995-98
Imports of Exports ofExports of goods goods goods Imports of goods
supported by WTO supported in supported by supported in WTOCountry members WTO WTO members members
($m) members($m) as % of as % of(No. of countries) Ave 1995-98 Ave 1995-98 All Exports All ImportsAlbania 24 74 8.8 8.2Algeria 5 1902 0.0 20.0Angola 12 139 0.3 7.2Antigua and Barbuda 3 9 6.0 2.8
rgentina 6251 603 25.6 2.3Australia 9384 843 17.0 1.4Bahrain 2 71 0.1 3.7Bangladesh 90 805 2.2 12.7Barbados 46 40 21.9 5.9Belize 70 16 46.6 5.9Benin 230 57 84.7 5.9Bolivia 137 95 11.3 5.2Brazil 6494 3968 13.1 6.7Brunei 1 56 0.0 1.8Bulgaria 333 276 6.9 5.4Burkina Faso 130 35 75.5 7.9Burundi 76 19 72.8 10.9Cameroon 422 114 24.7 8.6Canada 7023 3918 3.4 2.1
entral African Rep. 48 5 24.8 4.4Chad 109 5 82.5 3.5
Chile 2225 542 14.2 3.2China 3243 5471 1.9 4.0Colombia 3460 1031 32.0 7.2Comoros 0 13 0.1 24.3Congo, Dem. Rep 147 76 10.6 8.6Congo, Rep. 21 35 1.1 3.9Costa Rica 1361 257 37.5 5.9Cote d'lvoire 1835 299 48.7 11.0Croatia 101 411 2.2 5.0Cuba 745 337 50.7 13.4Cyprus 115 160 24.5 4.2Czech Republic 443 1001 1.9 3.6Djibouti 3 34 9.5 9.9Dominica 21 7 57.7 7.1Dominican Repub. 469 414 10.2 7.4Ecuador 1457 258 31.2 5.7EEC15 17375 38075 2.2 4.9Egypt, Arab Rep 387 2319 11.0 17.1El Salvador 485 236 42.0 8.3Estonia 158 237 6.3 6.3Fiji 222 46 37.9 6.5Gabon 2 43 0.1 4.9Gambia, The 2 41 11.0 17.5Ghana 494 115 32.4 4.7Grenada 4 12 14.5 7.2Guatemala 1081 271 48.6 7.2Guinea 38 99 7.8 19.1Guinea-Bissau 31 4 39.8 4.2
28

Imports of Exports ofExports of goods goods goods, Imports of goods
. supported by WTO supported in supported by supported in WTOCountry members WTO . WTO members members
($m) members($m) as % of as % of(No. of countries) Ave 1995-98 Ave 1995-98 All Exports All ImportsGuyana 182 27 33.1 6.7Haiti 29 127 12.2 14.9Honduras 385 194 43.9 9.0Hong Kong, China 22 2964 0.1 1.5Hungary 955 455 5.6 2.3Iceland 148 54 7.9 2.6India 2782 964 8.4 2.4Indonesia 1394 3396 2.8 8.9Iran, Islamic Rep. 163 1102 1.0 10.3Israel 876 938 4.1 3.3
amaica 229 136 12.1 5.5apan 312 15850 0.1 4.9
Jordan 53 397 6.2 12.3Kazakhstan 0 0 0.0 0.0Kenya 790 210 48.7 8.4Korea, Rep. 400 4727 0.3 3.6Kuwait 4 277 0.0 4.0Kyrgyz Republic 83 24 24.1 4.7Latvia 32 143 2.0 5.7Lithuania 227 244 6.7 5.0Macao 6 51 0.3 2.5Madagascar 77 45 26.6 7.8Malawi 361 17 75.7 4 4Malaysia 354 2457 0.5 3.4Maldives 1 26 2.1 8.3Mali 255 35 84.5 5.8Malta 20 81 1.2 3.0Mauritania 4 72 0.7 13.8Mauritius 401 185 24.6 8.5Mexico 3066 4317 3.0 4.3Mongolia 48 10 12.0 2.2Morocco 481 1204 9.0 13.8Mozambique 0 0 0.0 0.0Myanmar 284 27 23.6 1.0New Zealand 3194 412 24.1 3.0Nicaragua 239 110 40.0 8.7Niger 34 48 17.2 12.9Nigeria 277 431 1.8 7.5Norway 116 980 0.3 2.8Oman 45 281 0.7 5.8Pakistan 536 543 7.0 6.7Panama 244 . 121 38.8 4.1Papua New Guinea 351 36 15.1 2.6Paraguay 568 109 55.1 3.5Peru 1144 778 19.3 9.6Philippines 1468 1388 5.6 4.5Poland 672 1917 2.7 4.9Qatar 1 64 0.0 2.3Romania 403 424 4.9 3.8Russian Federation 931 3227 1.4 6.9Rwanda 42 40 59.0 18.2
29

Imports of Exports ofExports of goods goods goods Imports of goods
supported by WTO supported in supported by supported in WTOCountry members WTO WTO members members
($m) members($m) as % of as % of(No. of countries) Ave 1995-98 Ave 1995-98 All Exports All ImportsSaudi Arabia 77 2045 0.1 6.3Senegal 44 221 7.6 16.1Sierra Leone 12 17 6.6 8.7Singapore 677 1449 0.6 1.2Slovak Republic 197 332 2.1 3.0Slovenia 79 343 0.9 3.6Solomon Islands 20 2 9.1 1.7South Africa 1496 902 6.4 3.2
ri Lanka 81 405 2.1 9.1St. Kitts and Nevis 14 6 77.5 5.6St. Lucia 45 17 63.8 5.3St. Vincent and Grenadines 28 13 57.3 10.5Sudan 290 127 60.1 8.6Suriname 46 23 11.6 5.5Switzerland 398 2496 0.5 3.2
aiwan 247 3820 0.2 3.6Tanzania 448 63 67.8 5.0Thailand 3938 1715 7.0 2.8Togo 103 40 42.5 6.3Trinidad and Tobago 50 160 2.1 6.4Tunisia 223 553 4.0 6.9Turkey 2565 2147 10.5 5.0Uganda 349 73 63.3 7.5United Arab Emirates 225 782 1.0 3.1United States 31450 15475 5.2 1.8Uruguay 575 211 23.0 6.2Venezuela 171 938 0.8 8.0Zambia 76 30 8.1 4.0Zimbabwe 1057 61 59.3 3.0Memo:All above countries (143) 136483 151021 3.6 3.7Industrial Countries (23) 69400 78103 3.1 3.3Developing Countries (90) 63781 70616 4.2 4.2Least Developed Countries (30) 3302 2302 17.8 8.9
Source: Based on UN COMTRADE Statistics.
30

Table 6: Estimates of price and domestic suipport elasticities a
(1) 1 (2) -F (3) (4)log(GDP) 0.26 0.24 0.26 0.24
(0.03)** (0.03)** (0.03)** (0.03)**
log(Pop) -0.35 -0.33 -0.35 -0.33(0.03)** (0.03)** (Cl.03)** (0.04)**
log(1 + t) -1.36 -1.46 -1.37 -1.42
-(d ) (0.27)** (0.31)** (Cl.27)** (0.31)**
log(l + r) -1.17 -1.17 -1.17 -1.17_ (ed _ g s) (0.08)** (0.08)** (Cl.08)** (0.08)**
log(s DS4 9 ) -0.10 -0.10-( 2 d + V) (0.02)** ((1.03)**
log(SDSI 3 ) -0.05 -0.00_(id +,V) (0.02)** (0.03)
og(s DSI-3 + s DS4-9) -0.06-(2d +V) (0.02)**
Product dummies Yes Yes Yes YesR d 0.136 0.135 0.136 0.135#ot observations 7610 7610 7610 7610#HS 6-digit lines 158 158 158 _ 158
Estimation procedure is OLS. Standard errors in parenthesis are White Robust. "**" Significant at the I percentlevel. "*" significant at the 5 percent level.
31

Table 7: Estimates of price and domestic support elasticities by group of products'
(1) (2) (3) (4) (5)HS 01 to 04 HS 06 to 09 HS 10 to 14 HS 15 to 24 HS 50 to 53
Animal Vegetables, Cereals& Food process. Silk, cottonproducts fruits&nuts other grains products &other fibres
log(GDP) -0.21 0.51 0.10 0.18 0.56(0.08)** (0.05)** (0.06) (0.06)** (0.16)**
log(Pop) 0.14 -0.67 -0.18 -0.20 -0.19(0.09) (0.05)** (0.07)* (0.07)** (0.17)
log(1 + t) -0.70 -2.16 0.06 -2.35 -0.44_ (E_d ) (0.51) (0.53)** (0.62) (0.53)** (2.74)
log(l + r) -0.86 -1.12 -1.25 -1.44 -0.98_ (ed _ 6A) (0.18)** (0.13)** (0.14)** (0.20)** (0.42)*
log(s DS 4-9) -0.07 -0.11 -0.07 -0.16 -0.11_ (id +V * )(0.05) (0.04)* (0.04) (0.05)** (0.10)
Product dummies Yes Yes Yes T Yes T YesR2d 0.104 0.164 0.164 0.109 0.09#otobservations 1128 3028 1698 1448 308# HS 6-dig lines 28 55 38 27 10
a Estimation using Seemingly Unrelated Regression procedure. Group specific elasticities estimated using theinformation in the whole sample, letting the elasticities vary by group of products. Standard errors in parenthesis areWhite Robust. "**" significant at the I percent level; "*" significant at the 5 percent level.
32

Table 8: Impact of a 50 percent cut in tariffs and domestic support (DS) (158 products)
Tariff cut Cut in DS Change in welfare
untry group Change in Change in Change in Change in Tariff cut DS cutexports imports exports imports
($ mil) ($ mil) ( mil) ($ mil) ( mil) ($ mil)
lustrial Countries 3,262 7677 314 121 14,464 541veloping Countries 4,146 4136 504 -92 2,293 -273ast Developed Countries 116 118 64 -4 52 36
(percent) (percent) (percent) (percent) ($ per capita) ($per capita)
lustrial Countries 4.7 9.8 0.5 0.2 18.37 0.69veloping Countries 6.7 6.0 0.8 -0.1 0.56 -0.07ast Developed Countries 3.7 5.3 2.0 -0.2 0.12 0.08
33

Figure 1: Changes in Exports by Country(50 % tariff cut vs. 50 % cut in domestic support)
24.2375 Icadma
vctpan
9 _ ~~~~~~~~~~~~~~~~~ecu0to bizi mit
rfl hkg
0 _ tha phi guy0.x tto
LIJ Oaalur.C l~~~~~~~~~~~~~~~Vo tu
ven gmb poi a$>m mwi0.) mys zweC kor zPtur mmrczp svr,ur atg kgz
tC _rcol srnergr Ika I brno bra erk bhR 99us
sly~~~~~~~~~fmdg gab tzca
per E 45- 'gpr5o ben rd
0
-2.21439 3.90456Change in Exports (DS=-50%)
Figure 2: Changes in Imports by Country(50 % tariff cut vs. 50 % cut in domestic support)
18.1081 chn
marIka
__ hun sib
.1 ~~~tza knao atgtO bgdi9 zwe bgd
11 ~ ~~~~phi tuniI$g
t: gab0 rom gha tcd dma mex per
ttr o mn r id c
dam panc st
omn 06 ~~~~~~zaf
-2.82001 - ggikg kgz
- .566081 1.62701Change Imports (DS=-50%)
34

Figure 3: Changes in the Terms of Trade(50% tariff cut vs. 50% cut in domestic support)
7.3641 - oaudma
y.4, r0We
o CaUryL) ja "Inind arg
, Pdh&-Na61 tg.f bfi mi tcdrf ) tgofBcf fa tc
-7279 -b,gd cm
0
-7.27798 3.69431Change in ToT (DS=-50%)
Figure 4: Changes in Welfare by Country ($ per capita)(50% tariff cut vs. 50% cut in domestic support)
34.4165 -r-
Cll
LO nu vct kna
2 ~~~~~~~~~~~~~~~~~surec(U oan. bgp
- e
- ---4-7.79 3
-4.~~~~~~ y 260369 '19 1-3.0016
Change in Te e (DS=-50t)(50%-tariff cutvs. 50% cunoet
d'Wn ~ ~ ~~dmbm~~~~~~~~~~~~~~l
sgp~~~~~~~~~~~g~
Chang in Wlfareb(DS=50aro
C mar~~~~~~~~3

Annex: Data Sources
All trade data are from UN Comtrade Database (both value figures and unit prices). When
countries did not report trade data to Comtrade we mirror their data using notifications by their
trading partners. Tariffs are drawn from the UNCTAD and WTO as provided in
UNCTAD/World Bank World Integrated Trade Solution (WITS) system. This database does not
include the ad-valorem equivalent of specific tariffs. For ad-valorem equivalents of specific
tariffs we rely on Stawowy (2001) for estimates for Canada, the European Union, Japan and the
United States and OECD (2000) for other OECD countries. In cases where tariff quotas are used,
tariff rates generally comprise the average of in and out of quota tariffs is generally taken,
although in some cases only the out of quota tariff is available. The OECD ad-valorem
equivalents of specific tariffs use exclusively out of quota tariffs. We do not have quota
information, this may bias results some estimates as some import prices may be higher if
exporters benefit from in-quota lower tariffs.
As mentioned in the text, the source of domestic support data is the WTO (document
G/AG/NG/S/1). This data comes in national currency and was transformed into US dollars using
the period average exchange rate reported in the IMF IFS. The product classification in each
country notification is arbitrary and therefore we filter the product classification into the
Harmonized System 6 digit classification. In most cases this can be done through a one-to-one
mapping. In some cases, the domestic support reported covers several 6 digit tariff lines, in
which case the subsidy was distributed across the relevant tariff lines using the share of the
reporting country's exports as weights. The concordance file is available from the authors on
request.
As exempt subsidies are not product specific, these were also mapped into a product
specific subsidies using as weights the product-specific commitments that each country made in
the Uruguay Round. Non-product specific support is divided evenly into all products exported by
the country concerned. All products shown in notifications to the WTO are included, whether or
not the support is below the de minimis level for the member concerned. Thus, total AMS may
exceed total WTO commitments for a country. GDP (in US dollars) and population data are
drawn from the World Bank's World Development Indicators database.
36

Appendix Table 1: Impact of tariff and domestic support cuts by group of products
Change in Change in Change in Change in Change in Change in Change in Change inexports imports exports imports exports imiports exports importswith 50 with 50 with 50 with 50 with SO with 50 with 50 with 50percent percent percent percent percent percent percent percent
HS 2 digit tariff cut tariff cut cut in DS cut in DS tariff cut tariffecut cut in DS cut in DSproducts (S'000) (S'000) (S-000) (S'000) (percent) (percent) (percent) (percent)A. Impact on developing countries (non-LDCs):
01 Live animals. 26116 21278 -9165 1035 4.8 2 1 -0 2 0.102 Meat and edible meat offal 31104 40741 4569) 2526 4.7 4.4 0.7 0.304 Dairy prod; birds' eggs; honey 157823 338591 25782 32685 8.5 5.7 1,4 0 506 Live tree &other plant; bulb 28293 26664 24664 -2178 2.1 7.3 1.8 -0.607 Edible vegetables and roots 442019 169647 22424 -3387 10.1 6.3 0.5 -0. 1Og Edible fruit and nuts; melons 1138841 234312 10669 2 -34114 12.3 4.9 1.2 -0.709 Coffee, tea, mat and spices 110458 116167 -32060 -6439 1.2 7.6 -0.3 -0.41 0 Cereals 353031 1739555 126545 -40021 3.9 7.6 1.4 -0.21 1 Milled products; malt; starches 25671 57062 86 511 9.6 5.8 0.0 0.l12 Oil seed, oleaginous flruits; 87943 501554 46149 3421 1.9 7.9 1.0 0.113 Lac; gums, resins & other veg 43 3176 0 1 3.3 4.0 0.0 0 015 Animal/veg fats & oils & prod 195152 122296 6290 -2105 7.3 6.2 0.2 -0 117 Sugars and sugar confectionery 693521 131776 9157 -18079 14.3 4.8 0.2 -0.78 Cocoa and cocoa preparations 15787 22191 93 57 0.6 3.8 0.0 0.0
20 Prep of vegetable, fruit, nuts 196982 72345 25567 -7897 13.8 9.4 1.8 -1.021 Miscellaneous edible prep. 246069 59568 -117) 3008 18.7 2.3 0.0 0.122 Beverages, spirits and vinegar 32659 76229 13423 -5818 4.4 14.0 1.8 -1.123 Residues from food industry 2 61389 -7552, -15189 0.0 4.0 -0.5 -1 024 Tobacco and manufactured 329093 2211ISO 53926 -30836 11.6 10.5 1 9 -1.550 Silk. 6574 503 975 116 23.7 5.3 3.5 1.251 Wool,- fine/coarse animal hair 6425 30319 1954 69 1.6 2.7 0.5 0.052 Cotton. 21523 83998 76658 30440 1.1 1 2 3 8 0.453 Other vegetable textile fibres 409 5330 134 189 1.3 4.4 0.4 0.2
B. Impact on LDCs:
01 Live animals. 3593 204 57 6 4.8 1.7 0.1 0.102 Meat and edible meat offal , 3188 203 26 2 19.2 1.0 0.2 0.004 Dairy prod; birds' eggs; honey 252 11101 47 489 7.5 4.9 1.4 0.206 Live tree & other plant; bulb 432 68 616 -4 2.4 5.0 3.4 -0.307 Edible vegetables and roots 18426 17035 1035 -108 7.4 12.6 0.4 -0. 108 Edible fruit and nuts; melons 1835 8184 417 -191 1.5 24.1 0.3 -0.609 Coffee, tea, mat and spices 7561 973 6809 -61 1.1 2.2 1.0 -0.1I10 Cereals. 3234 31639 1603 -2247 3.4 3.0 1.7 -0.21 1 Milled products; malt; starches . 38 815 0 -1 9.0 1.9 0.1 0 012 Oil seed, oleaginous fruits; 13423 10066 274 -285 6.0 12.4 0.1 -0.413 Lac; gums, resins &other veg 10 30 0 0 3.3 0.9 0.0 0.015 Animal/veg fats &oils &prod 368 1490 8 -46 7.3 3.3 0.2 -0.1II17 Sugars and sugar confectionery 14042 17677 1373 . -652 14.4 12.6 1.4 -0.51 8 Cocoa and cocoa preparations 278 0 3 0 0.6 0.0 0.0 0.020 Prep of vegetable, fruit, nuts 99 302 40 -25 7.1 2.4 2.8 -0.221 Miscellaneous edible prep. 379 1814 4 -28 18.7 3.7 0.2 -0. 122 Beverages, spirits and vinegar 12 .362 5 -18 4.4 3.0 1.8 -0. 123 Residues from food industry 0 114 127 -20 0.0 4.8 1.5 -0.824 Tobacco and manufactured 33855 4485 11518 -559 8.9 8.4 3.0 -1.150OSilk. 2 1 0 0 23.7 0.5 3.5 0.151 Wool, fine/coarse animal hair 0 0 1 0 0.8 0.0 1.0 0.052 Coton. 10712 11036 39801 135 1.1 5.2 3.9 0.153 Other vegetable textile fibres 4223 12 650 0 4.5 1.3 0.7 0.0
37

Appendix Table 2: Impact of a 50 percent cut in tariffs and domestic support (%)
50% tariff cut 50% DS cut Change in terms of trade Change in welfare50% 50%
Change in Change in Change in Change in 50% 50 percent tariff cut cut in DS
Country export rev. import rev, export rev, import rev, tariff cut cut in DS S per capita) ( per capita)Albania 8.5 7.0 1.2 -0 5 -2.8 -0.6 -0.4 -0 1
Algeria 6.5 5.9 1.2 -0.2 -4.5 -1.4 -2.1 -0.9
Angola 1.0 0.0 11 0.0 -44 -0.7 0.0 0.0
Antigua and Barbuda 6.8 12.6 1.8 -0.3 -1.2 0.2 1.3 0.9
Argentina 4.6 4.5 1.5 -0.5 2.4 1.2 4.9 2.4
Australia 4.8 -3.5 1.0 -0.4 3.1 1.2 17.5 6.5
Bahrain 4.3 2.8 1.2 -0. 1 -4.9 -0.6 -4.4 -0.6
Bangladesh 5.0 12.0 08 -0.3 -3.2 -I 7 0.0 -0.1I
Barbados 14.4 6.7 1.2 -0.3 1.5 -0 3 7.1 -0.5
Belize 16.9 5.1 1.6 -0. 1 5.6 0.5 25 5 20
Benin 1.2 0.0 3.4 0.0 -0.2 2.4 04 1 3
Bolivia 2.4 4.2 2.2 -0.4 -1.0 0 7 -0.2 0.2
Brazil 4.7 4.4 -0 5 06 0.0 0 I 0.1 0.1
Brunei 55 -1.7 2.5 -0 3 -4.5 -1.1 -7 0 -1.8
Bulgaria 7.1 0.0 1.4 0.0 03 -0.2 1.8 0.4Burkina Faso 3.8 3.5 3.3 -0.2 0.8 2.3 0.3 0.4
Burundi 14 0.0 1.0 0.0 -1.1 0.2 0 1 0 1
Cameroon 4.3 6.7 1.5 -0 3 0.4 0.7 03 0.3
Canada 3.9 11.3 1.0 -0.5 0.8 0.8 26.9 2.9
Central African Rep. 3.3 4.0 2.3 -0.3 0.8 1.7 0.2 03Chad 1.1 8.1 39 0.0 0.8 3.7 0.1 0.6
Chile 4.7 4.9 1.3 -0.3 12 0.2 26 05
China 5.7 18.1 1 2 -0.4 -0.3 -0.9 0.5 0.0
Colombia 5.7 6.9 -0 9 0.7 1.4 0.2 1.8 0.3
Comoros 6.1 0.0 1.0 0.0 -7 3 -1 2
Congo, Dem. Rep 1.5 0.0 1.0 0.0 -1.1 -0.1I 0.0 0.0Congo, Rep. 9.3 5.6 1.3 -0.3 -1.3 -0 3 -0.1I 0.0
Costa Rica 14 6 3.8 1.7 -0.5 5.8 0.5 28.4 22
Cote dIlvoire 1.9 7.0 0.6 -0.4 0.1 0.2 0.5 0.3
Croatia 7.2 0.0 1.5 0.0 -2.6 -0 6 1.0 0.3
Cuba 13.8 2.3 1.4 -0.2 3.1 0.0 3.4 0.0
Cyprus 7.1 0.0 0.1 0. -0.4 -0 7 5.7 0.4
Czech Republic 7.0 1.7 0.9 -0.4 -0.6 -0.4 -0.3 -0.5
Djibouti 4.9 0.0 0.5 0.0 -3.9 -0.7 0.4 0.0
Dominica 22.6 8.2 2.1 0.1 6.8 05 26.9 1.9
Dominican Rep. 10.0 3.2 1.4 -0.6 0.1 -0.2 0.7 -0.2EECl15 6.9 9.3 -0.3 0.7 -0.8 -0 4 13.9 -0.2
Ecuador 18.5 50 2.1 -0.4 7.4 07 II 5 1.1
Egypt, Arab Rep 4.6 1.3 2.0 -0.4 -2.6 -1 0 -0.9 -0.4El Salvador 3.4 4.5 1.0 -0.2 -0 1 -0.2 0.1 -0.2Estonia 5.9 -1.3 1.2 -0.1I 0.1 -0.3 06 -0 8Fiji 13.8 0.0 1.3 0.0 4.0 0.3 15.4 1.4
Gabon 3.0 9.0 1.3 -0 3 -5.0 -0 8 -1.2 -0.2Gambia, The 8.5 0.0 0.7 00 -2.5 -0.5 0.1 0.0Ghana 1.4 8.1 0.2 -0.4 -0.7 -0.3 -0.1I 0.0
Grenada 5.6 6.6 0.5 -0.2 -3.2 -0.6 -3.4 -0.9
Guatemala 8.4 3.7 1.3 -0.2 2.4 0.3 3.6 0.4
Guinea 1.5 0.0 1.2 0.0 -3.4 -0.7 0 1 0.1
Guinea-Bissau 11 0.0 0.5 0.0 0.0 0.2 0.2 0.1Guyana 13.0 5.0 13 -0. 1 55 05 162 1.3
Haiti 1.2 00 08 00 -5 0 -0.9 0.0 0.0
Honduras 9.8 4.3 1.5 -0.4 1.4 0.2 1.9 0.2
Hungary 5.7 14.3 0.7 -0.3 1.5 0.3 4.0 0.5
Iceland 0.4 3.4 1.4 -0.6 -1.0 0.3 -45 2.3
India 5.0 5 7 1.5 0.1 2.2 08 01 0.0
Indonesia 5.3 0.9 0.8 -0.4 -1.6 -1.4 -0.3 -0 3
Iran, Islamic Rep. 3.6 -1.4 1.6 -0.4 -3 2 -1 1 -0.4 -0.2Israel 6.3 0.0 0.1 -0.4 -0 1 -0.3 0.3 -1.0
Jamaica 14.4 5.9 1.5 -0 3 2.5 00 47 0.0
Japan 96 18.1 0.7 -0. 1 -2.8 -1.4 64.8 -0.5
Jordan 4.9 3.6 0.4 -0.2 -3.8 -1.0 -1.6 -0.4
38
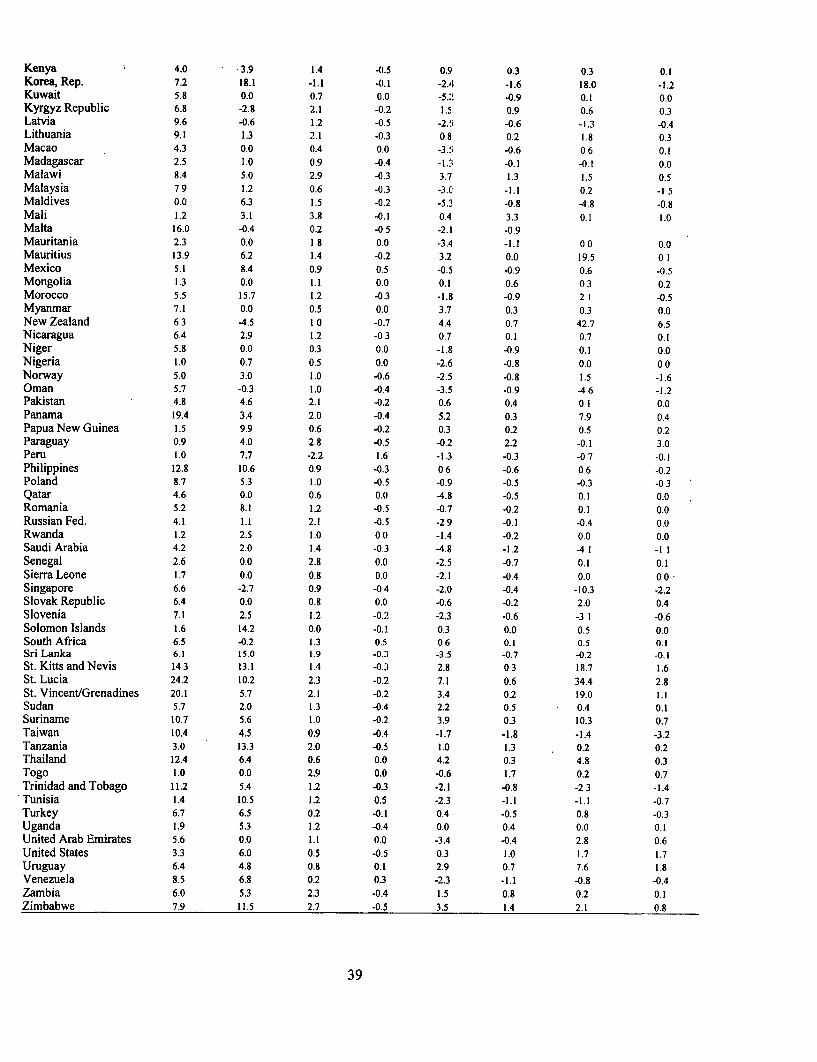
Kenya 4.0 3.9 1.4 -0.5 OS' 0.3 0.3 0.2Korea, Rep. 7.2 18.1 -1.1 -0. 1 -2.4I -1.6 18.0 -1.2Kuwait 5.8 0.0 0.7 0.0 -5.2 -0.9 0.2 0.0Kyrgyz Republic 6.8 -2.8 2.1 -0.2 1.5 0.9 0.6 0.3Latvia 9.6 -0.6 1.2 -0.5 -2.!; -0.6 -1.3 -0.4Lithuania 9.1 1.3 2.1 -0.3 0 8 0.2 2.8 0.3Macao 4.3 0.0 0.4 0.0 -3.5 -0.6 0 6 0.1Madagascar 2.5 1.0 0.9 -0.4 -1J.2: -0.1I -o. I 0.0Malawi 8.4 5.0 2.9 -0.3 3.7 1.3 1.5 0.5Malaysia 7 9 1.2 0.6 -0.3 -3.0 -1.1 0.2 -1 5Maldives 0.0 6.3 2.5 -0.2 -5.3 -0.8 -4.8 -0.8Mali 1.2 3.1 3.8 -0. 1 0.4 3.3 0.1 2.0Malta 26.0 -0.4 0.2 -0 5 -2.1 -0.9Mauritania 2.3 0.0 1 8 0.0 -3.4 -1.1 0 0 0.0Mauritius 13.9 6.2 1.4 -0.2 3.2 0.0 19.5 0 1Mexico 5.2 8.4 0.9 0.5 -0.5 -0.9 0.6 -0.5Mongolia 1.3 0.0 1.1 0.0 0.2 0.6 0 3 0.2Morocco 5.5 15.7 1.2 -0.3 -1.8 -0.9 2 1 -0.5Myanmar 7.1 0.0 0.5 0.0 3.7 0.3 0.3 0.0New Zealand 6.3 -4.5 1 0 -0.7 4.4 0.7 42.7 6.5Nicaragua 6.4 2.9 1.2 -0 3 0.7 0.1 0.7 0.1Niger 5.8 0.0 0.3 0.0 -1.8 -0.9 0.1 0.0Nigeria 2.0 0.7 0.5 0.0 -2.6 -0.8 0.0 0 0Norway 5.0 3.0 2.0 -0.6 -2.5 -0.8 2.5 -2.6Oman 5.7 -0.3 1.0 -0.4 -3.5 -0.9 -4.6 -1.2Pakistan 4.8 4.6 2.1 -0.2 0.6 0.4 0 1 0.0Panaina 19.4 3.4 2.0 -0.4 5.2 0.3 7.9 0.4Papua New Guinea 1.5 9.9 0.6 -0.2 0.3 0.2 0.5 0.2Paraguay 0.9 4.0 2.8 -0.5 -0.2 2.2 -0.1I 3.0Peru 2.0 7.7 -2.2 1.6 -1.3 -0.3 -0 7 -0.1IPhilippines 12.8 10.6 0.9 -0.3 0 6 -0.6 0 6 -0.2Poland 8.7 5.3 2.0 -0.5 -0.9 -0.5 -0.3 -0 3Qatar 4.6 0.0 0.6 0.0 -4.8 -0.5 0.2 0.0Romania 5.2 8.1 1.2 -0.5 -0.7 -0.2 0.1 0.0Russian Fed. 4.1 1.1 2.1 -0.5 -2 9 -0. 1 -0.4 0.0Rwanda 1.2 2.5 1.0 0(2 -1.4 -0.2 0.0 0.0Saudi Arabia 4.2 2.0 1.4 -0.3 -4.8 -1.2 -41 -21ISenegal 2.6 0.0 2.8 0.0 -2.5 -0.7 0.1 0.1Sierra Leone 1.7 0.0 0.8 0.0 -2.1 -0.4 0.0 0 0Singapore 6.6 -2.7 0.9 -04 -2.0 -0.4 -10.3 -2.2Slovak Republic 6.4 0.0 0.8 0.0 -0.6 -0.2 2.0 0.4Slovenia 7.1 2.5 2.2 -0.2 -2.3 -0.6 -3 1 -0.6Solomon Islands 1.6 14.2 0.0 -0.21 0.3 0.0 0.5 0.0South Africa 6.5 -0.2 1.3 0.5 0 6 0.1 0.5 0.2Sri Lanka 6.1 15.0 1.9 -0.3 -3.5 -0.7 -0.2 -0.2ISt. Kitts and Nevis 14 3 13.1 1.4 -0.3 2.8 0 3 18.7 1.6St. Lucia 24.2 10.2 2.3 -0.2 7.1 0.6 34.4 2.8St. Vincent/Grenadines 20.1 5.7 2.1 -0.2 3.4 0.2 29.0 1.1Sudan 5.7 2.0 1.3 -0.4 2.2 0.5 . 0.4 0.1Surinanme 10.7 5.6 1.0 -0.2 3.9 0.3 10.3 0.7Taiwan 10.4 4.5 0.9 -0.4 -1.7 -1.8 -1.4 -3.2Tanzania 3.0 13.3 2.0 -0.5 1.0 1.3 0.2 02Thailand 12.4 6.4 0.6 0.0 4.2 0.3 4.8 0.3Togo 1.0 0.0 2.9 0.0 -0.6 1.7 0.2 0.7Trinidad and Tobago 11.2 5.4 2.2 -0.3 -2.2 -0.8 -2 3 -2.4'Tunisia 1.4 10.5 1.2 0.5 -2.3 -1.1 -1.2 -0.7Turkey 6.7 6.5 0.2 -0.21 0.4 -0.5 0.8 -0.3Uganda 1.9 5.3 1.2 -0.4 0.0 0.4 0.0 0.1United Arab Emirates 5.6 0.0 1.1 0.0 -3.4 -0.4 2.8 0.6United States 3.3 6.0 0.5 -0.5 0.3 1.0 2.7 2.7Uruguay 6.4 4.8 0.8 0.1 2.9 0.7 7.6 2.8Venezuela 8.5 6.8 0.2 0.3 -2.3 -1.1 -0.8 -0.4Zambia 6.0 5.3 2.3 -0.4 2.5 0.8 0.2 0.1Zimbabwe 7.9 1 1.5 2.7 -0.5 3.5 2.4 2.1 0.8
39


Policy Research Working Paper Series
ContactTitle Author Date for paper
WPS2895 Telecommunications Reform in Jean-Jacques Laffont September 2002 P. Sintim-AboagyeC6te d'lvoire Tchetch6 N'Guessan 38526
WPS2896 The Wage Labor Market and John Luke Gallup September 2002 E. KhineInequality in Vietnam in the 1990s 37471
WPS2897 Gender Dimensions of Child Labor Emily Gustafsson-Wright October 2002 M. Correiaand Street Children in Brazil Hnin Hnin Pyne 39394
WPS2898 Relative Returns to Policy Reform: Alexandre Samy de Castro October 2002 R. YazigiEvidence from Controlled Cross- lan Goldin 37176Country Regressions Luiz A. Pereira da Silva
WPS2899 The Political Economy of Fiscal Benn Eifert October 2002 J. SchwartzPolicy and Economic Management Alan Gelb 32250in Oil-Exporting Countries Nils Borje Tallroth
WPS2900 Economic Structure, Productivity, Uwe Deichmann October 2002 Y. D'Souzaand Infrastructure Quality in Marianne Fay 31449Southern Mexico Jun Koo
Somik V. Lall
WPS2901 Decentralized Creditor-Led Marinela E. Dado October 2002 R. VoCorporate Restructuring: Cross- Daniela Klingebiel 33722Country Experience
WPS2902 Aid, Policy, and Growth in Paul Collier October 2002 A. Kitson-WaltersPost-Conflict Societies Anke Hoeffler 33712
WPS2903 Financial Globalization: Unequal Augusto de la Torre October 2002 P. SotoBlessings Eduardo Levy Yeyati 37892
Sergio L. Schmukler
WPS2904 Law and Finance: Why Does Legal Thorsten Beck October 2002 K. LabrieOrigin Matter? Asl1 Demirguc-Kunt 31001
Ross Levine
WPS2905 Financing Patterns Around the World: Thorsten Beck October 2002 K. LabrieThe Role of Institutions Asli Demirgu,-Kunt 31001
Vojislav Maksimovic
WPS2906 Macroeconomic Effects of Private Lourdes Trujillo October 2002 G. Chenet-SmithSector Participation in Latin Noelia Martin 36370America's Infrastructure Anlonio Estache
Javier Campos
WPS2907 The Case for International Antonio Estache October 2002 G. Chenet-SmithCoordination of Electricity Regulation: Martin A. Rossi 36370Evidence from the Measurement of Christian A. RuzzierEfficiency in South America
WPS2908 The Africa Growth and Opportunity Aaditya Mattoo October 2002 P. FlewittAct and its Rules of Origin: Devesh Roy 32724Generosity Undermined? Arvind Subramanian
WPS2909 An Assessment of Carsten Fink October 2002 P. FlewittTelecommunications Reform in Aaditya Mattoo 32724Developing Countries Randeep Rathindran

Policy Research Working Paper Series
ContactTitle Author Date for paper
WPS2910 Boondoggles and Expropriation: Philip Keefer October 2002 P. Sintim-AboagyeRent-Seeking and Policy Distortion Stephen Knack 38526when Property Rights are Insecure
WPS2911 Micro-Level Estimation of Welfare Chris Elbers October 2002 P. SaderJean 0. Lanjouw 33902Peter Lanjouw
WPS2912 Short-Run Pain, Long-Run Gain: Graciela Laura Kaminsky October 2002 E. KhineThe Effects of Financial Sergio L. Schmukler 37471Liberalization
WPS2913 Financial Development and Dynamic Inessa Love October 2002 K. LabrieInvestment Behavior: Evidence from Lea Zicchino 31001Panel Vector Autoregression
WPS2914 The Impact of Cash Budgets on Hinh T. Dinh October 2002 D. SidibePoverty Reduction in Zambia, A Case Abebe Adugna 35074Study of the Conflict between Well- Bernard MyersIntentioned Macroeconomic Policyand Service Delivery to the Poor
WPS2915 Federal Politics and Budget Deficits: Stuti Khemani October 2002 H. SladovichEvidence from the States of India 37698
WPS2916 Ex-ante Evaluation of Conditional Francois Bourguignon October 2002 P. SaderCash Transfer Programs: The Case Francisco H. G. Ferreira 33902of Bolsa Escola Phillippe G. Leite
WPS2917 Economic Development, Competition Bernard Hoekman October 2002 R. MartinPolicy, and the World Trade Petros C. Mavroidis 39065Organization