Embed Size (px)
Citation preview
UPTECW14014
Examensarbete 30 hpApril 2014
Reduced Energy Consumption and Improved Treatment using Intermittent Aeration at
the Ja-Ela/Ekala Wastewater Treatment Plant
in Sri Lanka
Minskad energiförbrukning och förbättrad
rening genom intermittent luftning på Ja-Ela/Ekala
avloppsreningsverk i Sri Lanka
Johanna Berg
I
ABSTRACT
Reduced Energy Consumption and Improved Treatment using Intermittent
Aeration at the Ja-Ela/Ekala Wastewater Treatment Plant in Sri Lanka
Johanna Berg
The Ja-Ela/Ekala wastewater treatment plant in Sri Lanka is running with a load and
incoming flow far below design values. In order to cope with the unnecessary energy
consumption through the aeration system and optimize the treatment results, the plant
was during it’s commissioning period (September 2011 to June 2012) operated with
intermittent control of the aeration system and compared to continuous operation.
Through sampling and recording run-time of the blowers it was found that intermittent
control lowers the energy consumption with 80-90 % and improves the treatment with
respect to all important pollutants.
Keywords: Wastewater Treatment, Intermittent Aeration Control, Activated Sludge
Process, Sri Lanka
Department of Information Technology, Uppsala University
Box 337, SE-751 05, Uppsala, Sweden
II
REFERAT
Minskad energiförbrukning och förbättrad rening genom intermittent luftning på
Ja-Ela/Ekala avloppsreningsverk i Sri Lanka
Johanna Berg
Ja-Ela/Ekala avloppsreningsverk i Sri Lanka har en belastning och ett inkommande
flöde långt under dimensionsvärden. För att hantera den onödiga energiförbrukningen
genom luftarsystemet och optimera reningen drevs anläggningen under dess
idrifttagning (september 2011 till juni 2012) med kontinuerlig respektive intermittent
styrning av luftningen. Provanalyser samt datasamling av luftarnas drifttid visar att man
genom intermittent styrning kan sänka energiförbrukningen med 80-90 % och samtidigt
förbättra reningen med avseende på alla viktiga föroreningsparametrar.
Nyckelord: Avloppsvattenrening, Intermittent Luftning, Aktivslamprocess, Sri Lanka
Institutionen för informationsteknologi, Uppsala universitet
Box 337, 751 05 Uppsala, Sverige
III
PREFACE
This project report, covering 30 credits, is the result of a master thesis work at the Water
and Environmental Engineering Programme at Uppsala University, Sweden. The project
idea was found after a visit to Sri Lanka and the Ratmalana/Moratuwa and Ja-Ela/Ekala
Wastewater Disposal Project during spring 2010 and a re-visit for the commissioning of
the treatment plant in Ja-Ela in the end of 2011.
Acknowledgements
I would like to thank my supervisors Mr Staffan Indebetou, process engineer at Purac
(Läckeby Water Group) and Dr. Stig Morling Senior Process Advisor from SWECO
International and my subject reviewer Prof. Bengt Carlsson from Uppsala University
institute of Information Technology for the assistance and feedback through-out the
project, Purac and Mr Christer Andersson (project manager for the
Ratmalana/Moratuwa and Ja-Ela/Ekala Wastewater Disposal Project) for giving me the
opportunity to participate in the commissioning of the treatment plant and Mr Kjell-
Anker Olsen and Mr Upul Perera, my colleagues, for guidance and good company
during my visit in Sri Lanka.
The Examiner of this Master Thesis is Prof. Allan Rodhe at Uppsala University,
Department of Earth Sciences.
Thanks
Johanna Berg
Copyright © Johanna Berg and The Department of Information Technology, Uppsala
University, Sweden
UPTECW14014
IV
POPULÄRVETENSKAPLIG SAMMANFATTNING
Minskad energiförbrukning och förbättrad rening genom intermittent luftning på
Ja-Ela/Ekala avloppsreningsverk i Sri Lanka Johanna Berg
Sri Lanka är ett land under utveckling. Efter många år av inbördeskrig och
tsunamikatastrofen 2005 börjar landet ta form med ny infrastruktur och
miljömedvetenhet. Tyvärr råder fortfarande orättvisor. Segregering och maktkamp gör
att utvecklingen går väldigt långsamt och ofta i fel riktning. Mycket av det som byggs
kommer från internationella investerare och bistånd.
När det kommer till vatten- och avloppsvattenrening drivs ett antal, både små- och
storskaliga projekt runt om på ön. 2007 påbörjades ett Sida-finansierat
avloppsvattenreningsprojekt för rening av industriellt processvatten och hushållsvatten
från förorterna Ja-Ela och Ratmalana till huvudstaden Colombo. Båda dessa områden
har i dagsläget vattendrag, vilka p.g.a. dålig avloppsvattenrening är högt kontaminerade.
Projektet, Ratmalana/Moratuwa and Ja-Ela/Ekala Wastewater Disposal Project, vilket
består av två reningsverk för 36 000 (med möjlighet till utbyggnad för 73 000 p.e)
respektive 100 000 (med möjlighet till utbyggnad för 178 000 p.e) personekvivalenter är
ett samarbete mellan den statliga VA-myndigheten vilken är uppdragsgivare, SWECO
(Swedish Consultants), som övervakar projektet och det danska företaget Pihl som är
entrepenörer med svenska Purac AB som underentrepenör.
Under ett besök till projektplatsen i Ja-Ela under våren 2010 och ett återbesök för
idriftsättningen av reningsverket i september 2011 lades grunden för detta
examensarbete. Ja-Ela är ett stort industriområde med bl.a. textilfabriker, ett av Sri
Lankas största slakterier och andra livsmedelsfabriker samt ett större bostadsområde
vilka alla kommer att koppla på sig till det nya nätet. Under idriftsättningen märktes
dock snart att endast några få av de planerade kunderna av olika skäl är tänkta att
ansluta sig till nätet, samt att de enskilda fabrikerna generellt bidrog med mindre
belastning än förväntat. Flödet och belastningen in till verket är idag långt under vad det
är dimensionerat för och detta har medfört att onödigt mycket energi går åt för att
behandla det inkommande vattnet.
Då vattnet kommer in till verket genomgår det mekanisk rening och biologisk rening.
Den mekaniska reningen består av ett mekaniskt rensgaller och ett sandfång. Den
biologiska reningen består av tre bassänger med olika biologiska miljöer och processer
för att rena vattnet från fosfor, kväve och organiskt material. De olika förhållandena i
bassängerna skapas på grund av olika syrehalt. Mängden lättåtkomligt syre gynnar olika
sorters bakterier vilka i sin tur skapar sitt eget reningssteg och medverkar i reningen
genom nedbrytning av organiskt material och filtrering av vattnet.
Den första biologiska bassängen är anoxisk, vilket innebär att där finns syre, men inte i
löst form. Här sker sista steget i reningen av kväve. Den andra bassängen är anaerob
V
(helt syrefri) och är designad för att rena fosfor. I den sista bassängen, vilken benämns
aerob, tillsätts syre genom ett luftningssystem och här sker första steget i
kvävereningen. För att reningen ska fungera är det viktigt att bassängerna bibehåller
dessa miljöer så att alla steg fullföljs.
Problemet som påträffats vid reningsverket i Ja-Ela är att det är designat för större flöde
med högre belastning än vad som i dagsläget kommer in. Överdimensioneringen medför
att mycket energi går till spillo då verket drivs.
Den mest energikrävande delen av driften är luftningssystem. I detta examensarbete har
en optimering av luftningssystemet studerats. Optimeringen skulle vara sådan att
energianvändningen hos verket minimeras men att reningsnivån hos vattnet bibehålls
eller förbättras samt att luftningssystemet ej tar skada.
För att får ner energiförbrukningen infördes intermittent luftning, dvs. att luftningen
styrs med paus/drift-styrning. Prover togs kontinuerligt och analyserades på utgående
vatten. Olika på/av-tider hos luftarna studerades och jämfördes med initialfallet utan
uppehåll.
Resultaten visar att man med intermittent luftning kan minska energiförbrukningen med
80-90 % och att reningen av vattnet dessutom förbättras. Idag används intermittent
luftning på avloppsreningsverket i Ja-Ela och verket kommer att fortsätta med denna
drift tills flödet och belastningen på verket är tillräcklig.
VI
TABLE OF CONTENTS
1. INTRODUCTION 1
1.2 AIM ............................................................................................................................ 1
2. BACKGROUND 2
2.1 SRI LANKA AND THE “RATMALANA/MORATUWA AND JA-
ELA/EKALA WASTEWATER DISPOSAL PROJECT” ......................................... 2 2.1.1 History of Sri Lanka and the present Environmental Situation ........................... 2
2.1.2 Ja-Ela/Ekala Wastewater Treatment Project ....................................................... 2
2.2 FUNDAMENTALS OF WASTEWATER AND WASTEWATER
TREATMENT ................................................................................................................ 3 2.2.1 Wastewater Characteristics.................................................................................. 3
2.2.2 Sludge characteristics .......................................................................................... 6
2.2.3 Nitrogen cycle...................................................................................................... 7
2.2.4 The activated sludge process ............................................................................... 8
2.2.5 Biological phosphorous removal ....................................................................... 11
2.3 PROCESS DESCRIPTION FOR JE-WWTP ..................................................... 11 2.3.1 Primary treatment .............................................................................................. 12
2.3.2 Secondary treatment .......................................................................................... 12
2.4 COMMISSIONING THE JE-WWTP .................................................................. 15 2.4.1 Oxygen content .................................................................................................. 15
2.4.2 Sludge age ......................................................................................................... 15
2.5 INTERMITTENT CONTROL OF THE AERATION SYSTEM ..................... 17 2.5.1 The process background to the introduction of intermittent control at JE-WWTP
.................................................................................................................................... 18
3. METHOD 20
3.1 LITERATURE STUDY ......................................................................................... 20
3.2 WASTEWATER ANALYSIS AND RECORDING OF DATA COLLECTED
ON SITE ........................................................................................................................ 20
3.3 EVALUATION AND ADJUSTMENTS THROUGH THE AUTOMATIC
CONTROL SYSTEM .................................................................................................. 21
VII
4. RESULTS AND OBSERVATIONS 22
4.1 CONSEQUENCES OF LOW FLOW .................................................................. 23
4.2 TREATMENT RESULTS AND ENERGY CONSUMPTION WITH
CONTINUOUS AERATION ...................................................................................... 24
4.3 TREATMENT RESULTS AND ENERGY CONSUMPTION WITH
INTERMITTENT AERATION .................................................................................. 25
5. DISCUSSION AND CONCLUSIONS 29
5.1 EVALUATION OF THE INTRODUCTION OF INTERMITTENT
AERATION AT JE-WWTP ........................................................................................ 29
5.2 MANAGING ADVANCED WASTEWATER TREATMENT PLANTS IN
DEVOLOPING COUNTRIES .................................................................................... 30
6. REFERENCES 32
7. APPENDIX i-viii
1
1. INTRODUCTION
In September 2011, the JE-WWTP (JE-WWTP) in Sri Lanka started to receive process
water from factories in the Ekala Industrial Area and municipal wastewater from the
adjacent Nivasipura Housing Scheme. The treatment includes biological removal of
organic material, nitrogen and phosphorus. Today, the incoming load is still far below
the design capacity and the evident drawback is that the plant is operated with average
results and poor energy efficiency, due to ”over-aeration”.
This study investigates the way to solve this problem and how to most appropriately
operate over dimensioned biological wastewater treatment plants with regards to energy
efficiency and treatment results.
Intermittent aeration, a method with history of improving treatment and decreasing
energy consumption when implemented in wastewater treatment plants similar to JE-
WWTP, was tested during a period and compared to the conventional continuous
aeration.
1.2 AIM
The objective of this thesis was to study the effect of intermittent controlled aeration on
treatment and power consumption and to compare it with the effects of continuous
aeration. Further, laboratory data was evaluated toghether with on-site measurements, in
order to optimize the aeration time intervals with the main objective of minimizing
power consumption.
The hypothesis was that intermittent aeration will lower the energy consumption,
without exceeding restricted values of effluent concentrations.
2
2. BACKGROUND
2.1 SRI LANKA AND THE “RATMALANA/MORATUWA AND JA-
ELA/EKALA WASTEWATER DISPOSAL PROJECT”
This chapter summarizes facts about Sri Lanka and the on-going wastewater disposal
project in the suburbs of their capital Colombo, as well as the background of this final
thesis work that was implemented in Sri Lanka, February to August 2012.
2.1.1 History of Sri Lanka and the present Environmental Situation
In 1948 Sri Lanka obtained political independence, leaving behind over a century of
British rule. The independence movement was soon followed by conflicts between the
Sinhalese majority and the Tamil population, an ethnic, religious and political
independence struggle, which lasted over 25 years.
In 1983 war broke out between the Sri Lankan government and the Tamil separatist
militant organization LTTE. The on-and-off war did not end until 2009 and the many
years of political riots have prevented the island’s environmental development, both
technically and in terms of knowledge about environmental impacts (CBC, 2012).
At present the Sri Lankan government has an overall policy of improving the living
conditions of the citizens and has implemented several development programs around
the island, including urban and rural water supply projects and urban sewerage projects.
Sri Lanka is now slowly making progress towards being a more developed country. In
the fields of water supply and sanitation, this involves keeping water reserves clean
from toxics and pathogens and putting less stress on the environment, which in turn
results in increased environmental and public health (Ministry of Urban Development
and Water Supply, 2005).
The National Water Supply and Drainage Board (NWSDB) of Sri Lanka has since their
establishment in 1975, worked towards serving the nation with sustainable water and
sanitation solutions. The NWSDB plays a significant role in achieving the Millennium
Development Goal, partly by increasing their investments in sewerage facilities.
(Ministry of Urban Development and Water Supply, 2005).
2.1.2 Ja-Ela/Ekala Wastewater Treatment Project
One of NWSDB’s on-going programs is the Ratmalana/Moratuwa and Ja-Ela/Ekala
Wastewater Disposal Project, which started in 2007. Both the Ja-Ela/Ekala area (Figure
1) in the northern suburbs of Colombo, the commercial capital of Sri Lanka, and the
Ratmalana/Moratuwa area in the southern part of the greater Colombo, have water
bodies which, due to lack of sewage facilities, are heavily contaminated. The project,
which includes two activated sludge based treatment plants for treating 36 000 (73 000
in final stage) and 100 000 (178 000 in final stage) person equivalents, is financed by
the Swedish International Development Agency (Sida) and the project is monitored by
Swedish consultants SWECO, with the Danish company Pihl as contractors and
Swedish Purac as sub-contractors (NWSDB, 2007).
3
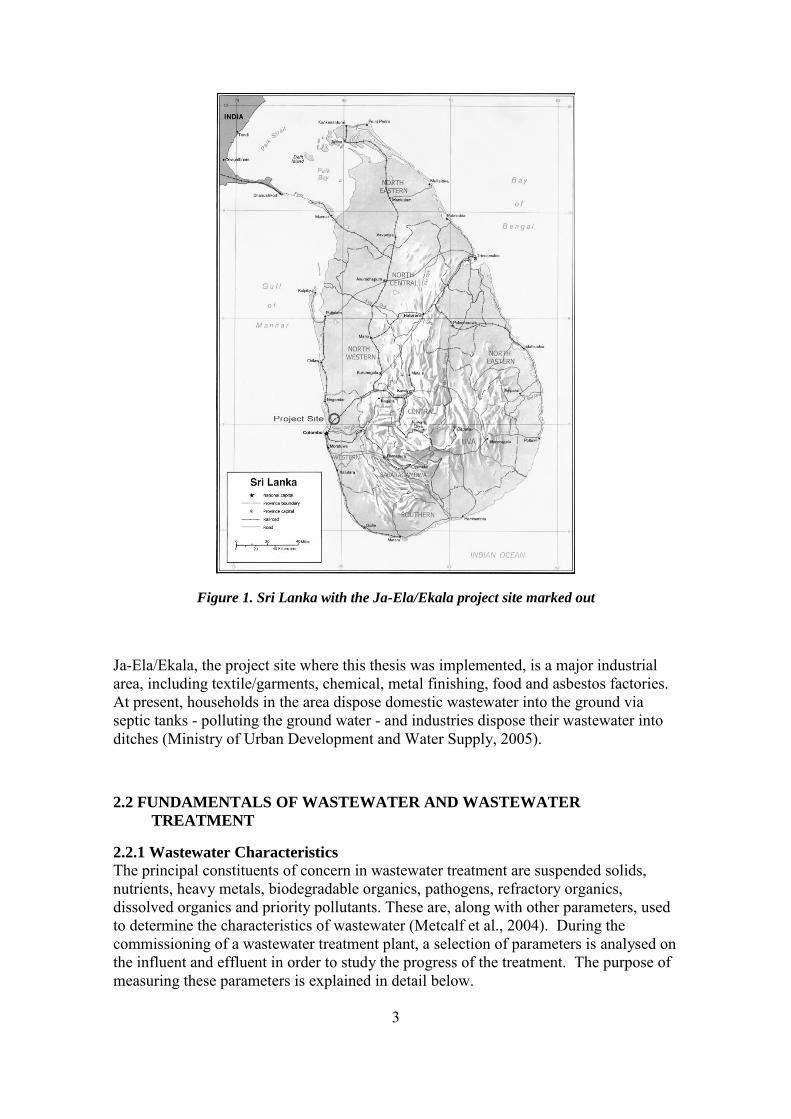
Figure 1. Sri Lanka with the Ja-Ela/Ekala project site marked out
Ja-Ela/Ekala, the project site where this thesis was implemented, is a major industrial
area, including textile/garments, chemical, metal finishing, food and asbestos factories.
At present, households in the area dispose domestic wastewater into the ground via
septic tanks - polluting the ground water - and industries dispose their wastewater into
ditches (Ministry of Urban Development and Water Supply, 2005).
2.2 FUNDAMENTALS OF WASTEWATER AND WASTEWATER
TREATMENT
2.2.1 Wastewater Characteristics
The principal constituents of concern in wastewater treatment are suspended solids,
nutrients, heavy metals, biodegradable organics, pathogens, refractory organics,
dissolved organics and priority pollutants. These are, along with other parameters, used
to determine the characteristics of wastewater (Metcalf et al., 2004). During the
commissioning of a wastewater treatment plant, a selection of parameters is analysed on
the influent and effluent in order to study the progress of the treatment. The purpose of
measuring these parameters is explained in detail below.
4
Physical Characteristics
The total solid material found in wastewater is composed of settleable matter, colloidal
matter, floating matter and dissolved matter, all of which can be arranged into two main
groups depending whether they are suspended or dissolved. For further analysis the
solids are classified as volatile or fixed (Metcalf et al., 2004).
Other physical characteristics of wastewater are turbidity, particle size distribution,
colour, absorption, temperature, conductivity and density. These are, for example, used
when characterising the freshness of the wastewater and its biological activity. Many of
the characteristics are in some way interrelated and rarely do all of them need to be
measured (Metcalf et al., 2004).
Chemical Characteristics
The chemical characteristics of wastewater can be analysed by studying a wide range of
inorganic and organic parameters. Here the inorganic non-metallic constituents are
distinguished from the metallic constituents and the organic compounds of interest are
categorized as either individual or aggregate (Metcalf et al., 2004).
Inorganic non-metallic constituents
Among the inorganic non-metallic constituents, pH (hydrogen-ion concentration) is an
important quality parameter. For the biological treatment to be optimal, pH should be
(6-9). Lower or higher hydrogen-ion concentrations will render the biological treatment
process less effective (Metcalf et al., 2004).
Alkalinity is the sum of the concentrations of hydroxides, carbonates and bicarbonates.
Wastewater is normally alkaline, which helps buffering against pH changes; therefore
alkalinity level is very important where chemical and biological treatment is applied
(Metcalf et al., 2004).
Nitrogen, phosphorus and sulphur are the three most essential nutrients for growth of
micro-organisms. Regulating the concentration of each element in combination with
soluble oxygen and organic matter is a way to control bacterial and algal growth
(Metcalf et al., 2004).
Nitrogen is present in wastewater as ammonia, nitrate and organic nitrogen and is
during the process converted between these forms (Metcalf et al., 2004). Within this
project, the total of these, tot-N is measured along with nitrate and ammonia.
Also phosphorous appears in different forms and is measured as tot-P (org and
inorganic) and orthophosphate. Orthophosphate is an inorganic compound, which
appears dissolved in wastewater and represents the largest fraction of the influent
(Metcalf et al., 2004).
Inorganic metallic constituents
There is a delicate boundary for metals being either essential or toxic. Many metals,
such as copper, iron and zinc are in trace quantities necessary for biological life. Other
for example mercury and cadmium should be avoided even in small doses, since they
are highly bio accumulating and will, if they reach an eco-system, accumulate through-
out the food chain, disrupting the productivity of living organisms. Some metals are
5
found naturally in the ground and can add into the wastewater through pipe-leakages.
To avoid high levels of metals in the wastewater it is important to work upstream, that is
to communicate with the industries and help them come up with supplements (Metcalf
et al., 2004).
Aggregate organic constituents
Organic compounds in fresh wastewater typically contain proteins, carbohydrates, oil,
grease and urea along with a large number of different synthetic compounds in small
quantities (Metcalf et al., 2004).
A common laboratorial method to determine the aggregate organic content in
wastewater is the 5-day biochemical oxygen demand (BOD5), a measure of the amount
of oxygen used in the biochemical oxidation of organic matter (Metcalf et al., 2004).
Another method used to determine the organic content is the chemical oxygen demand
(COD) test, where the oxygen equivalent of the organic material that can be chemically
oxidized is measured (Metcalf et al., 2004). The main advantage with the COD-test
compared to the BOD-test is the time required to analyse the result, which is
approximately 2 h compared to the 5 days of a complete BOD test.
Individual organic compounds
Priority pollutants, which are established by the government, are known or suspected to
be carcinogenic, mutagenic or very toxic. Examples of these can be volatile organic
compounds, which have boiling points less than 100oC, disinfection by-products,
agricultural chemicals such as pesticides and herbicides, and a variety of new
compounds (antibiotics, drugs, hormones etc.) (Metcalf et al., 2004).
Biological Characteristics
To be able to prevent pathogenic organisms from spreading diseases and to control the
decomposition of organic matter, it is of great importance to know how microbes
interact with wastewater when designing a treatment plant. There are huge numbers of
micro-organisms found in wastewater, including bacteria, fungi, algae and viruses.
Some of them are responsible for treating the water, as for example the nitrifying
bacteria and phosphorus accumulating bacteria mentioned in the next section, while
others such as Ascaris or Vibrio Cholerae can be the cause of escalating epidemics
(Metcalf et al., 2004).
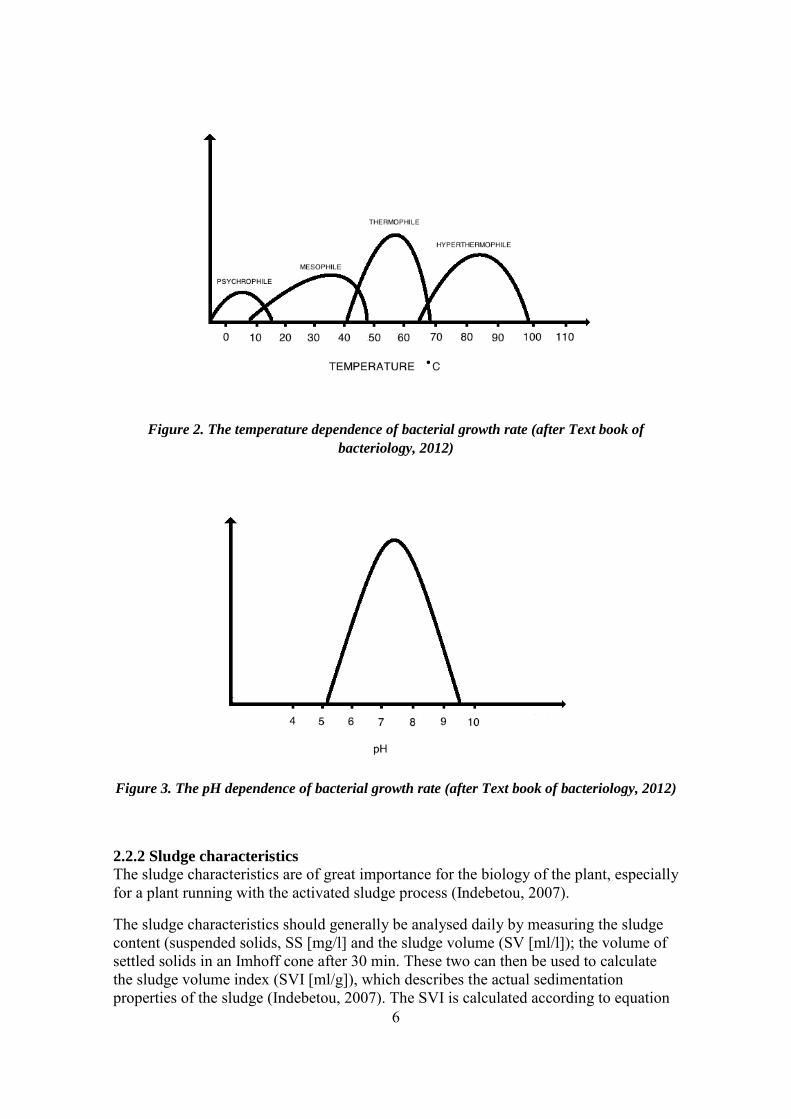
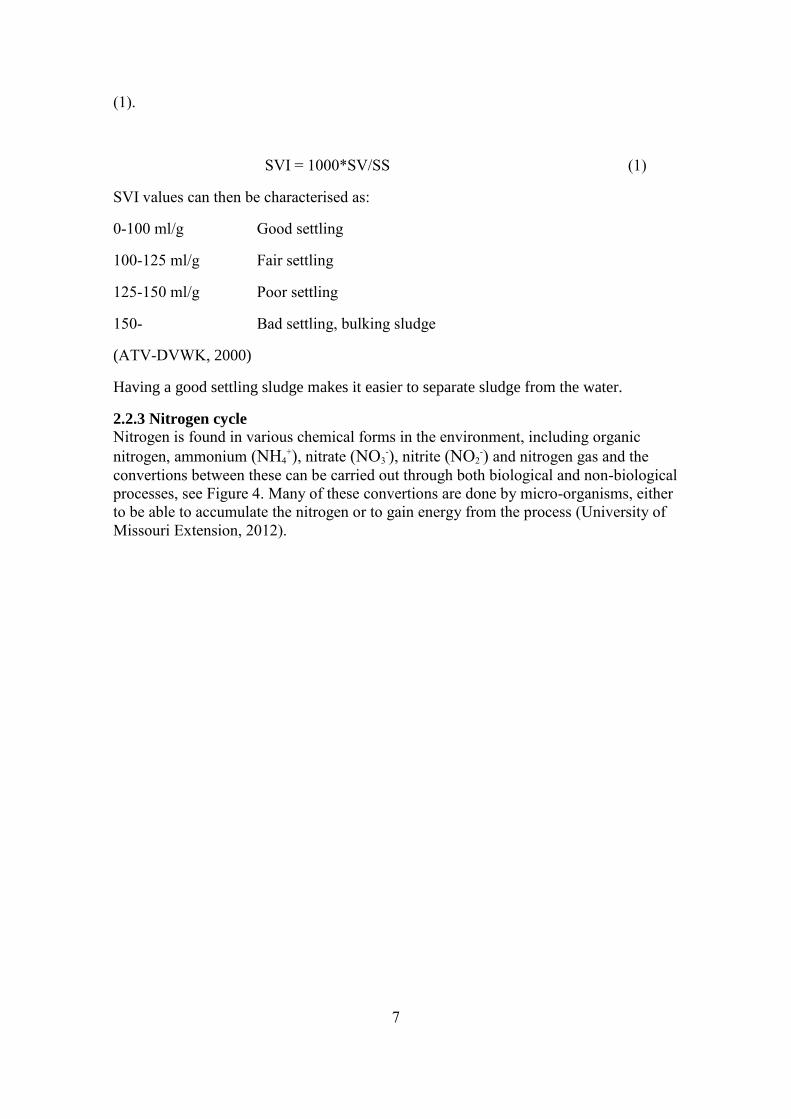
Micro-organisms grow only if the environment is suitable. Growth conditions vary from
species to species and can be optimized by regulating the main growth factors; water,
elementary nutrients, energy source, temperature (see Figure 2), oxygen and pH (see
Figure 3). The growth is also dependent of the presence/absence of inhibitors such as:
pesticides, heavy metals, tensides etc (Metcalf et al., 2004).
6
Figure 2. The temperature dependence of bacterial growth rate (after Text book of
bacteriology, 2012)
Figure 3. The pH dependence of bacterial growth rate (after Text book of bacteriology, 2012)
2.2.2 Sludge characteristics
The sludge characteristics are of great importance for the biology of the plant, especially
for a plant running with the activated sludge process (Indebetou, 2007).
The sludge characteristics should generally be analysed daily by measuring the sludge
content (suspended solids, SS [mg/l] and the sludge volume (SV [ml/l]); the volume of
settled solids in an Imhoff cone after 30 min. These two can then be used to calculate
the sludge volume index (SVI [ml/g]), which describes the actual sedimentation
properties of the sludge (Indebetou, 2007). The SVI is calculated according to equation
7
(1).
SVI = 1000*SV/SS (1)
SVI values can then be characterised as:
0-100 ml/g Good settling
100-125 ml/g Fair settling
125-150 ml/g Poor settling
150- Bad settling, bulking sludge
(ATV-DVWK, 2000)
Having a good settling sludge makes it easier to separate sludge from the water.
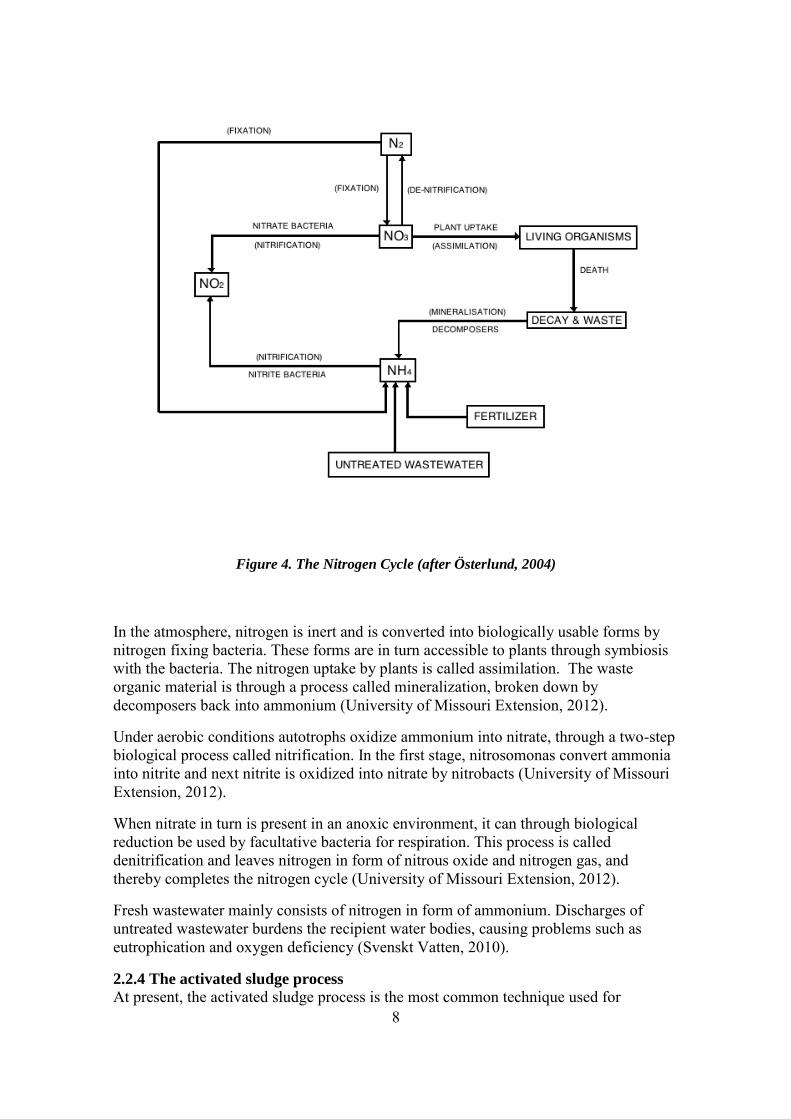
2.2.3 Nitrogen cycle
Nitrogen is found in various chemical forms in the environment, including organic
nitrogen, ammonium (NH4+), nitrate (NO3
-), nitrite (NO2-) and nitrogen gas and the
convertions between these can be carried out through both biological and non-biological
processes, see Figure 4. Many of these convertions are done by micro-organisms, either
to be able to accumulate the nitrogen or to gain energy from the process (University of
Missouri Extension, 2012).
8
Figure 4. The Nitrogen Cycle (after Österlund, 2004)
In the atmosphere, nitrogen is inert and is converted into biologically usable forms by
nitrogen fixing bacteria. These forms are in turn accessible to plants through symbiosis
with the bacteria. The nitrogen uptake by plants is called assimilation. The waste
organic material is through a process called mineralization, broken down by
decomposers back into ammonium (University of Missouri Extension, 2012).
Under aerobic conditions autotrophs oxidize ammonium into nitrate, through a two-step
biological process called nitrification. In the first stage, nitrosomonas convert ammonia
into nitrite and next nitrite is oxidized into nitrate by nitrobacts (University of Missouri
Extension, 2012).
When nitrate in turn is present in an anoxic environment, it can through biological
reduction be used by facultative bacteria for respiration. This process is called
denitrification and leaves nitrogen in form of nitrous oxide and nitrogen gas, and
thereby completes the nitrogen cycle (University of Missouri Extension, 2012).
Fresh wastewater mainly consists of nitrogen in form of ammonium. Discharges of
untreated wastewater burdens the recipient water bodies, causing problems such as
eutrophication and oxygen deficiency (Svenskt Vatten, 2010).
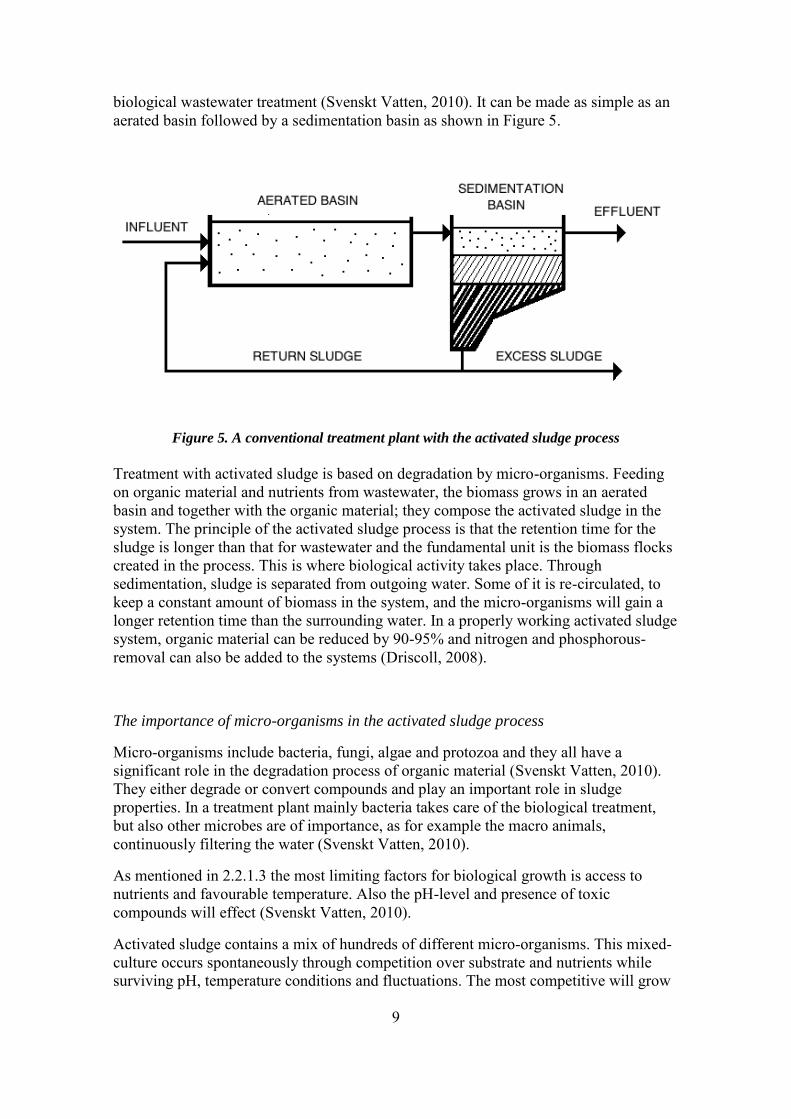
2.2.4 The activated sludge process
At present, the activated sludge process is the most common technique used for
9
biological wastewater treatment (Svenskt Vatten, 2010). It can be made as simple as an
aerated basin followed by a sedimentation basin as shown in Figure 5.
Figure 5. A conventional treatment plant with the activated sludge process
Treatment with activated sludge is based on degradation by micro-organisms. Feeding
on organic material and nutrients from wastewater, the biomass grows in an aerated
basin and together with the organic material; they compose the activated sludge in the
system. The principle of the activated sludge process is that the retention time for the
sludge is longer than that for wastewater and the fundamental unit is the biomass flocks
created in the process. This is where biological activity takes place. Through
sedimentation, sludge is separated from outgoing water. Some of it is re-circulated, to
keep a constant amount of biomass in the system, and the micro-organisms will gain a
longer retention time than the surrounding water. In a properly working activated sludge
system, organic material can be reduced by 90-95% and nitrogen and phosphorous-
removal can also be added to the systems (Driscoll, 2008).
The importance of micro-organisms in the activated sludge process
Micro-organisms include bacteria, fungi, algae and protozoa and they all have a
significant role in the degradation process of organic material (Svenskt Vatten, 2010).
They either degrade or convert compounds and play an important role in sludge
properties. In a treatment plant mainly bacteria takes care of the biological treatment,
but also other microbes are of importance, as for example the macro animals,
continuously filtering the water (Svenskt Vatten, 2010).
As mentioned in 2.2.1.3 the most limiting factors for biological growth is access to
nutrients and favourable temperature. Also the pH-level and presence of toxic
compounds will effect (Svenskt Vatten, 2010).
Activated sludge contains a mix of hundreds of different micro-organisms. This mixed-
culture occurs spontaneously through competition over substrate and nutrients while
surviving pH, temperature conditions and fluctuations. The most competitive will grow
10
and form activated sludge (Driscoll, 2008).
The sedimentation basin is the most critical step in the activated sludge process. This is
where the sludge should be separated from the treated wastewater and re-circulated back
into the system, i.e. flock building and sinking bacteria will be favoured while the rest is
flushed out of the system. It is favourable to have an activated sludge with good
sedimentation properties; high sedimentation rate and which leaves a dense sludge
(Driscoll, 2008).
Micro-organisms are associated with both fine and poor sludge quality. The
sedimentation depends on the flock characteristics that in turn largely depend on micro-
organisms. An example is flocks with too much filamentous bacteria, which may result
in foaming and sludge swelling. On the other hand, too little filamentous bacteria in a
flock will give small flocks that are difficult to separate from outgoing water
(Indebetou, 2007).
Around 10-30 % of the incoming nitrogen is assimilated in the sludge, since the bacteria
use nitrate and ammonium for growth. The rest will leave the system as nitrogen gas
(Svenskt Vatten, 2010).
The nitrification bacteria extract energy from ammonium and nitrite. Nitrification is the
sum of two processes that occurs in sequence. Nitrifiers are autotrophs, which is why
they grow and reproduce slowly. Fixing carbon from the atmosphere is energy
consuming and only a small fraction of the gained energy can be used for growth. Their
generation time can vary from 8 h to several days. This makes the nitrification the
limiting step in the nitrogen cycle (Svenskt Vatten, 2010).
De-nitrification bacteria are heterotrophs and are favoured by simple, easily degradable
organic compounds (Svenskt Vatten, 2010).
When applying pre-denitrification in wastewater treatment, the anoxic part of the
biological step is executed before the aerobic, which implies that the water/sludge from
the aerated basin has to be recycled to the anoxic zone to complete the nitrogen cycle.
An advantage with this kind of solution is that no external carbon needs to be added,
since the carbon in the influent can be used as an energy source in the denitrification.
The nitrogen reduction in a pre-denitrification process will be between 50-80% (Svenskt
Vatten, 2010).
When biological nitrogen reduction is introduced to a treatment plant, the design is
often based on the required volume for the nitrification. The sludge age is the most
critical factor in the activated sludge process and it is vital that the reproduction time of
the nitrifying bacteria is always below the sludge age, since the nitrifying bacteria
(autotrophs) grow slower than the bacteria degrading the organic material (heterotrophs)
in the activated sludge process (Svenskt Vatten, 2010).
About 30 % of the incoming phosphorous is separated through biological growth. Also
in the clarifier there are on-going biological processes. If the sedimentation becomes
anaerobic one has to be aware of possible phosphorous release and periodically the
phosphorous concentration will be larger in outgoing water than in incoming (Svenskt
Vatten, 2010).
11
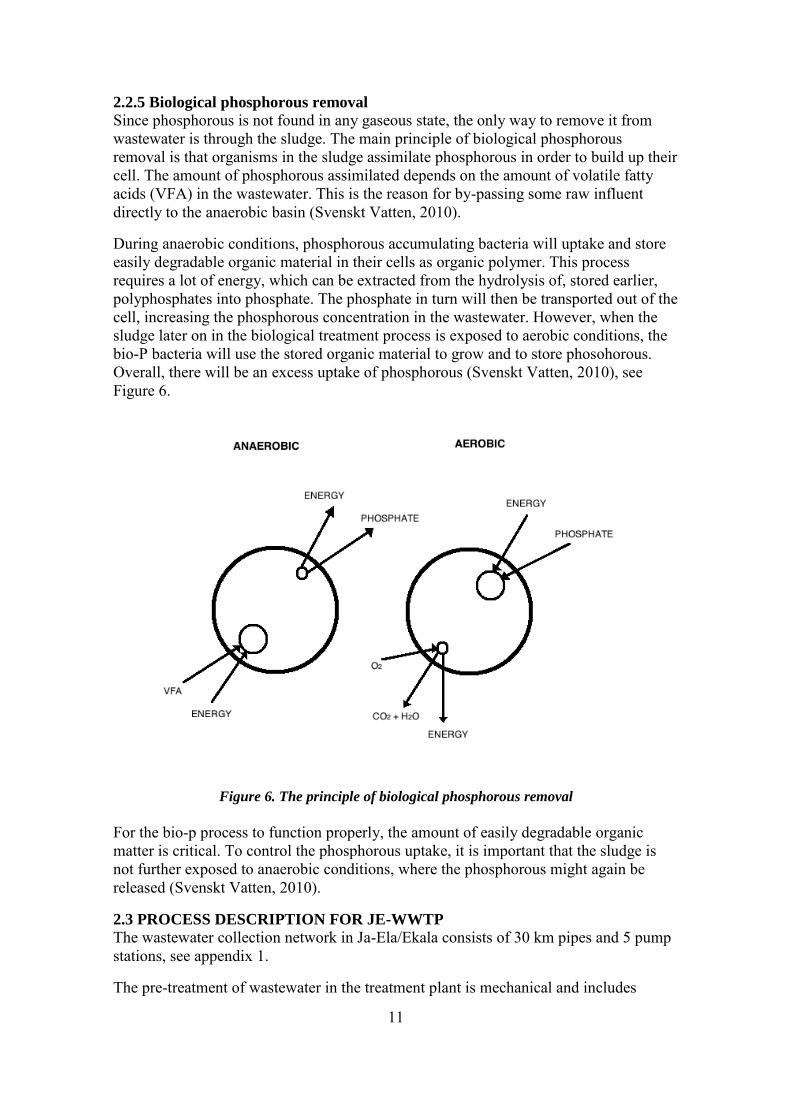
2.2.5 Biological phosphorous removal
Since phosphorous is not found in any gaseous state, the only way to remove it from
wastewater is through the sludge. The main principle of biological phosphorous
removal is that organisms in the sludge assimilate phosphorous in order to build up their
cell. The amount of phosphorous assimilated depends on the amount of volatile fatty
acids (VFA) in the wastewater. This is the reason for by-passing some raw influent
directly to the anaerobic basin (Svenskt Vatten, 2010).
During anaerobic conditions, phosphorous accumulating bacteria will uptake and store
easily degradable organic material in their cells as organic polymer. This process
requires a lot of energy, which can be extracted from the hydrolysis of, stored earlier,
polyphosphates into phosphate. The phosphate in turn will then be transported out of the
cell, increasing the phosphorous concentration in the wastewater. However, when the
sludge later on in the biological treatment process is exposed to aerobic conditions, the
bio-P bacteria will use the stored organic material to grow and to store phosohorous.
Overall, there will be an excess uptake of phosphorous (Svenskt Vatten, 2010), see
Figure 6.
Figure 6. The principle of biological phosphorous removal
For the bio-p process to function properly, the amount of easily degradable organic
matter is critical. To control the phosphorous uptake, it is important that the sludge is
not further exposed to anaerobic conditions, where the phosphorous might again be
released (Svenskt Vatten, 2010).
2.3 PROCESS DESCRIPTION FOR JE-WWTP
The wastewater collection network in Ja-Ela/Ekala consists of 30 km pipes and 5 pump
stations, see appendix 1.
The pre-treatment of wastewater in the treatment plant is mechanical and includes
12
screening and grit removal. The second part of the treatment is biological and is
followed by a clarifier. From there water flows to an outlet pump station in which
chlorination is possible. The effluent is finally discharged into the river Dandugam Oya.
Excess sludge (from the activated sludge process) is pumped to a belt filter press for
dewatering and is, after being stored in a container, transported away for final disposal.
See Appendix 2 for a scheme over the process design.
2.3.1 Primary treatment
Wastewater is led by gravity to the treatment plant. It first enters the reception chamber,
which is equipped with a bypass filter that enables the bypass of incoming flow directly
to the outlet pumping station. This can be used in situations when incoming flow is
greater than the capacity of the treatment, for example after a heavy rain.
The first step in treatment is to remove larger particles such as paper, rags etc. This is
done by two automatic fine screens, which will catch any matter above 3 mm in size.
The screenings, before they are rinsed off, will themselves act as screens and thereby
increase the efficiency of the mechanical treatment. A level switch automatically
controls the rinsing of the screens. Removed screenings are transported away by a screw
conveyor for further treatment and disposal.
The water from the fine screens is led into a distribution chamber where it is divided
into two streams leading to the grit traps. In the distribution chamber pH is measured
and will give alarm at low and high values. The grit removal involves removal of sand
and other heavy particles. A submerged mixer controls that only heavy particles will
settle while suspended organic matter is kept in suspension for secondary treatment. The
mixer is frequency controlled, enabling optimization of the separation. Settled grit is
removed by a submerged pump and transported away with a screw conveyor for further
treatment before disposal.
A bypass controls the flow so that the biological treatment is fed with maximum flow of
Q-design, which is the flow designed for the maximum pressure the pipes can manage
as well as the maximum flow that the biological processes can keep up with. It is also of
importance that the flow doesn’t fall too low below this value, since this can cause
corrosion on the pipes and problems in the biological treatment process (Indebetou,
2012).
2.3.2 Secondary treatment
From the grit traps the water is led to the biological step, which consists of three
different basins with conditions that favour specific biological processes. The water
enters the biological treatment through a split box, dividing it into two streams. The
main stream is leading to the first biological step and sthe econd stream of 0-50% of the
flow is leading directly to the second biological basin.
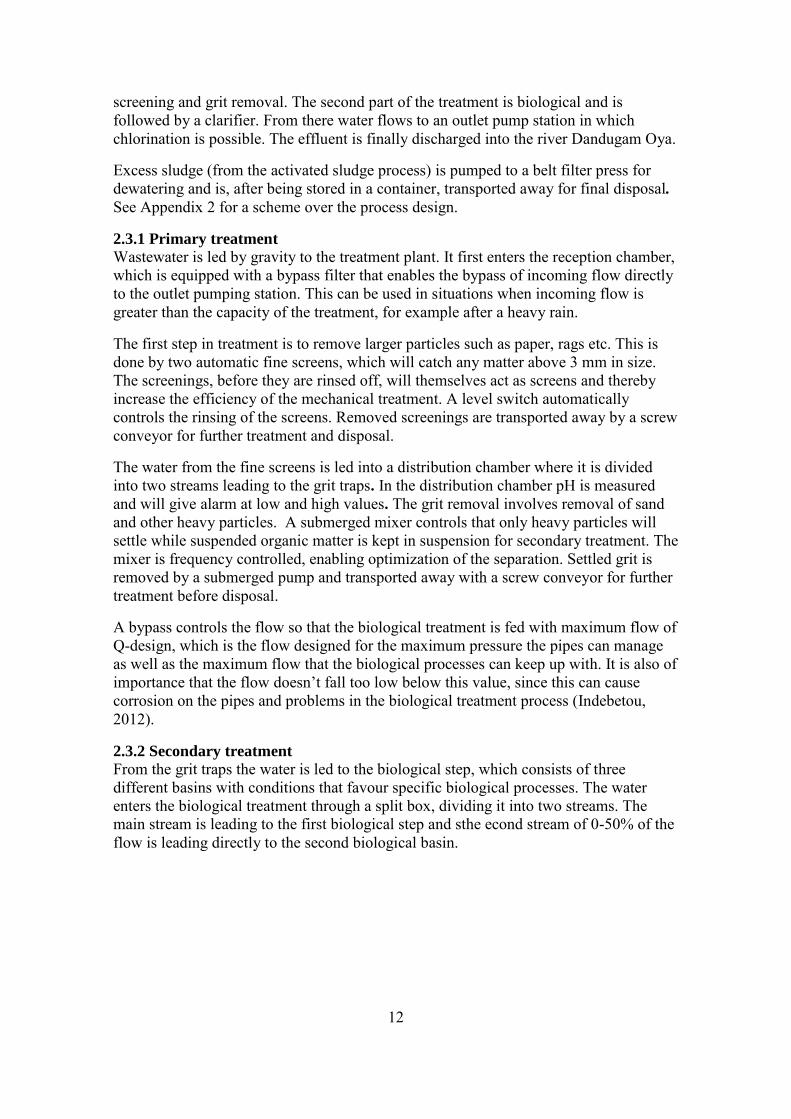
13
Figure 7. The biological treatment chain at JE-WWTP
The biological treatment is based on the activated sludge process (see 2.2.4), which
involves re-cycling of sludge to give the micro-organisms the optimal conditions and
time for growth and digestion (see Figure 7).
1) Anoxic Basin
The anoxic basin is first in order of the three biological basins. It has an inlet both for
fresh wastewater and for re-circulated activated sludge (return sludge).
Entering water is mixed with the recycled sludge, containing nitrate. Since the basin is
anoxic (no dissolved oxygen) this enables de-nitrification to occur according to (2).
Org. material + NO3 N2 + CO2 + H2O (2)
Nitrogen is released from the wastewater as nitrogen gas.
The anoxic basin is equipped with submerged agitators to maintain a good contact
between substrate and microbes as well as for keeping the sludge in suspension.
2) Anaerobic Basin
The second biological basin is anaerobic and is designed to remove phosphorus (see
2.2.4.1).
3) Aerobic Basin
In the last basin of the biological treatment, nitrification will occur. That is, ammonia
14
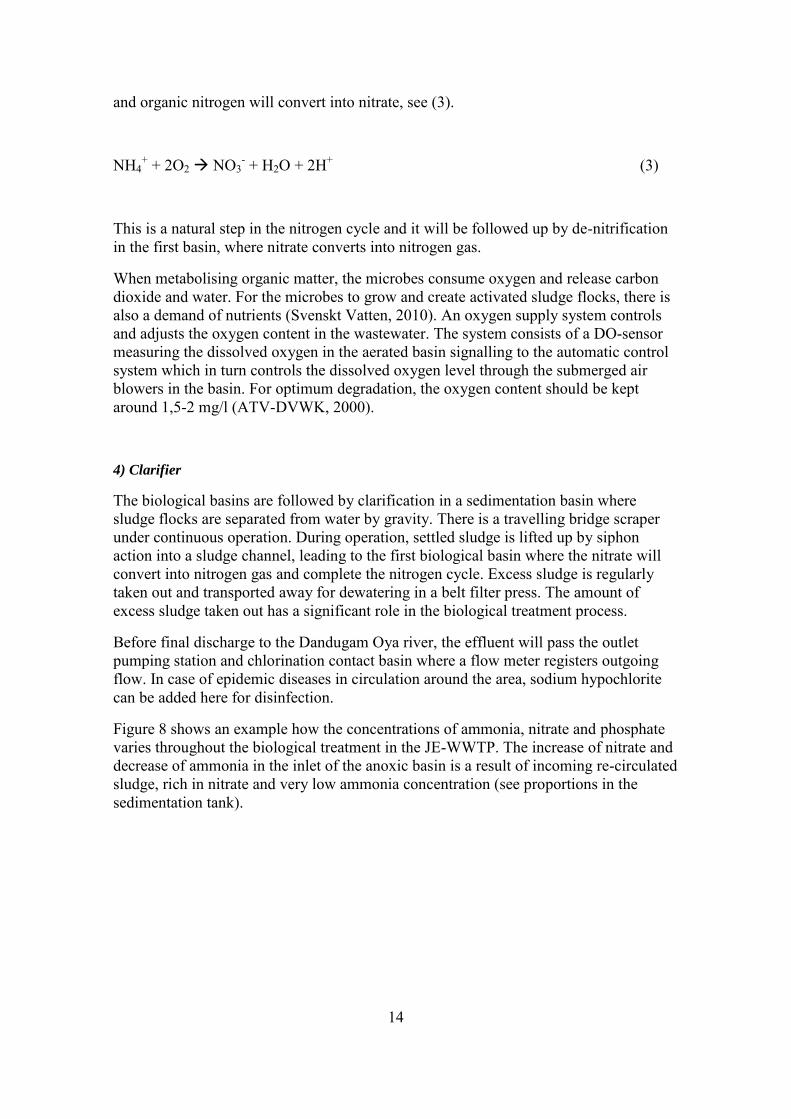
and organic nitrogen will convert into nitrate, see (3).
NH4+ + 2O2 NO3
- + H2O + 2H
+ (3)
This is a natural step in the nitrogen cycle and it will be followed up by de-nitrification
in the first basin, where nitrate converts into nitrogen gas.
When metabolising organic matter, the microbes consume oxygen and release carbon
dioxide and water. For the microbes to grow and create activated sludge flocks, there is
also a demand of nutrients (Svenskt Vatten, 2010). An oxygen supply system controls
and adjusts the oxygen content in the wastewater. The system consists of a DO-sensor
measuring the dissolved oxygen in the aerated basin signalling to the automatic control
system which in turn controls the dissolved oxygen level through the submerged air
blowers in the basin. For optimum degradation, the oxygen content should be kept
around 1,5-2 mg/l (ATV-DVWK, 2000).
4) Clarifier
The biological basins are followed by clarification in a sedimentation basin where
sludge flocks are separated from water by gravity. There is a travelling bridge scraper
under continuous operation. During operation, settled sludge is lifted up by siphon
action into a sludge channel, leading to the first biological basin where the nitrate will
convert into nitrogen gas and complete the nitrogen cycle. Excess sludge is regularly
taken out and transported away for dewatering in a belt filter press. The amount of
excess sludge taken out has a significant role in the biological treatment process.
Before final discharge to the Dandugam Oya river, the effluent will pass the outlet
pumping station and chlorination contact basin where a flow meter registers outgoing
flow. In case of epidemic diseases in circulation around the area, sodium hypochlorite
can be added here for disinfection.
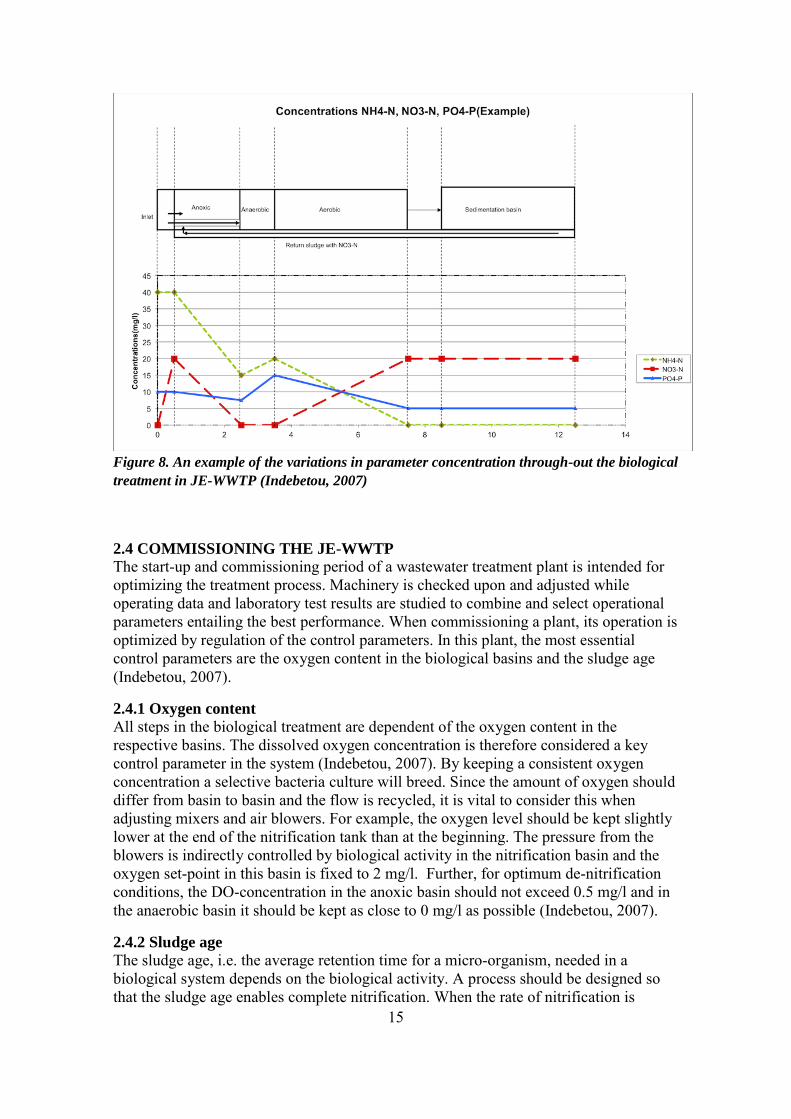
Figure 8 shows an example how the concentrations of ammonia, nitrate and phosphate
varies throughout the biological treatment in the JE-WWTP. The increase of nitrate and
decrease of ammonia in the inlet of the anoxic basin is a result of incoming re-circulated
sludge, rich in nitrate and very low ammonia concentration (see proportions in the
sedimentation tank).
15
Figure 8. An example of the variations in parameter concentration through-out the biological
treatment in JE-WWTP (Indebetou, 2007)
2.4 COMMISSIONING THE JE-WWTP
The start-up and commissioning period of a wastewater treatment plant is intended for
optimizing the treatment process. Machinery is checked upon and adjusted while
operating data and laboratory test results are studied to combine and select operational
parameters entailing the best performance. When commissioning a plant, its operation is
optimized by regulation of the control parameters. In this plant, the most essential
control parameters are the oxygen content in the biological basins and the sludge age
(Indebetou, 2007).
2.4.1 Oxygen content
All steps in the biological treatment are dependent of the oxygen content in the
respective basins. The dissolved oxygen concentration is therefore considered a key
control parameter in the system (Indebetou, 2007). By keeping a consistent oxygen
concentration a selective bacteria culture will breed. Since the amount of oxygen should
differ from basin to basin and the flow is recycled, it is vital to consider this when
adjusting mixers and air blowers. For example, the oxygen level should be kept slightly
lower at the end of the nitrification tank than at the beginning. The pressure from the
blowers is indirectly controlled by biological activity in the nitrification basin and the
oxygen set-point in this basin is fixed to 2 mg/l. Further, for optimum de-nitrification
conditions, the DO-concentration in the anoxic basin should not exceed 0.5 mg/l and in
the anaerobic basin it should be kept as close to 0 mg/l as possible (Indebetou, 2007).
2.4.2 Sludge age
The sludge age, i.e. the average retention time for a micro-organism, needed in a
biological system depends on the biological activity. A process should be designed so
that the sludge age enables complete nitrification. When the rate of nitrification is
16
known, and thereby the required sludge age, the nitrification can be maximized by
adjusting suspended solids and dissolved oxygen concentrations in the basin. To
maintain a good BOD reduction the sludge age should be at least 3 days.
The process in the JE-WWTP is designed for a total sludge age of 8 days (Indebetou,
2007). The total sludge retention time (SRT) is calculated according to (4).
SRT = (Va*SSa) / (Qes*SSes) (4)
SRT = Solids Retention Time (sludge age), days
Va = Volume of activated sludge basin, m3
SSa = the amount of sludge in the activated sludge basin, kg TSS/m3
SSes = the amount of sludge in the excess sludge, kg TSS/m3
Qes = flow of waste sludge, m3/days
(ATV-DVWK, 2000)
Waste activated sludge
By regulating the amount of excess sludge taken out of the system one can control the
growth and amount of active bio-mass in the process and thereby maintain a stable
sludge age and suspended solids-concentration in the activated sludge basins
(Indebetou, 2007).
F/M-ratio
The food to micro-organism ratio (kg BOD/kg SS, d) is inverse proportional to the
sludge age and describes the daily amount of organic matter the micro-organisms in the
system are fed. Thus, the longer sludge age, the lower F/M-ratio (ATV-DVWK, 2000).
The relationship can be calculated from (5)
F:M = (BOD*Qin) / (SS*Va) (5)
Where, BOD and SS are given as concentrations, Qin is the incoming flow and Va is the
activated sludge volume.
To obtain full nitrification, the ratio should be around 0,1-0,2 kg BOD/kg SS,d (ATV-
DVWK, 2000).
The control parameters mentioned above are studied through a number of laboratory
wastewater and sludge analyses. The frequency of the tests and parameters to be tested
were chosen so that they do not overlap, though still give a clear understanding of the
state of the process.
17
2.5 INTERMITTENT CONTROL OF THE AERATION SYSTEM
Control of the aeration system in a biological treatment plant is of great importance
since the concentration of dissolved oxygen is directly related to the treatment and its
efficiency (biological growth and activity).
Intermittent operation can be applied when there is an excess of dissolved oxygen in the
biological system. As insufficient amounts of dissolved oxygen render nitrification, an
excess of dissolved oxygen in the aerated basin, will in turn, through the return sludge
interrupt the denitrification and the phosphorous reduction in the anoxic and anaerobic
basins.. The aeration system is also often the most energy consuming department in a
wastewater treatment plant (Dotro, 2011) i.e an optimization can both improve the
treatment and keep down the maintenance costs. The aeration can be either time set or
controlled by online measurement of parameters like DO, NH4+
or SS in the aerated
basin (Dotro, 2011).
Intermittent aeration has through out the years been studied in different applications and
successfully applied in many treatment plants with different configuration. It was
introduced and developed in the 1950’s (applied in oxidation ditches) and became
popular in the 1980s when many plants were built to operate in this mode to promote
biological nitrogen removal and to save energy (Stig Morling).
Today, intermittent aeration in WWTP's in order to save energy and improve the
treatment exists in several plants in for example Sweden and Denmark where this
operation mode has been implemented in full scale facilities, for example
Nykvarnsverket in Linköping (Tekniska Verken, 2012) and Stadskvarn in Skövde
(Skövde Kommun, 2009).
The main difference between these plants and the JE-WWTP is that they are equipped
with mixers in the aerated basins in order to obtain better contact between water and
sludge and thereby allows a faster process.
There are also more simple examples of successful intermittently aerated plants. For
example the Songjiang municipal wastewater treatment plant in China (Xia, 2002) with
a single biological reactor (sequencing batch reactor) where anaerobic, anoxic and
aerobic conditions are created in the same tank by regulating the airflow.
The approach at JE-WWTP, having a continuously fed, intermittently aerated activated
sludge plant, can be seen as a combination of sequencing batch reactor and a
conventional activated sludge plant (Dotro, 2011).
Several studies have been devoted to intermittent aeration. In “Intermittent aeration in
Biological Treatment of Wastewater” the operational optimum of the aeration time was
determined from the BOD5 removal after a certain period of treatment. Finding that an
optimization of the air-liquid contact time can give a 27 -58 % saving on the unit energy
consumption, the study concludes that an appropriate intermittent aeration cycle can
give a substantial energy saving while also an adequate treatment is maintained (Doan
et.al,2009).
In the full scale bioreactor Sant Celoni WWTP (Barcelona, Spain), a similar study
(Optimization of intermittent aeration in full scale wastewater treatment plant biological
reactor for nitrogen removal) was done, where the optimal configuration of aeration
control was based on COD and nitrogen removal. Also here it was found that
18
intermittent aeration favors the treatment of both COD and Nitrogen and gives a major
reduction of the energy consumption (Habermeyer et.al, 2005)
In many of the WWTP’s where related strategies have been applied, the results have
been similar; intermittent aeration has been energy saving and treatment effective,
especially regarding nitrogen and phosphorous removal (Dotro, 2011).
In 1992 the Danish company Kruger, successfully introduced STAR, an online control
system, which combined with the SCADA system, can be tailored to adjust control of
biological treatment processes (VA-Ingenjörerna, 2009).
There are different applications of the STAR control, but they all include intermittent
aeration and insures 10-20 % energy reduction for aeration and 20-30 % reduction of
effluent nitrogen. STAR is considered suitable for flexible operation, i.e very high or
very low loads compared to design (Kruger, 2009).
In April 2009, there were over 30 plants operating with STAR (Kruger, 2009), amongst
which the following improvement of treatment and operation results has been presented:
- Ede WWTP, Netherlands: Tot -N reduction of 50 % and improved P-treatment
(Jörgensen, 2011)
- Eksjö WWTP, Sweden: 10 % energy reduction and improved N-treatment (VA-
Ingenjörerna, 2009)
- Nykvarnsverket, Sweden: Tot-N reduction of 36 % (Sehlén, 2013)
2.5.1 The process background to the introduction of intermittent control at JE-
WWTP
Another major consequence of having low incoming flow is that the return sludge flow
has to be kept high in relation to the incoming flow, in order to avoid that the syphon
action in the sedimentation basin does not get interrupted. If the syphon pipes clogg,
eventually anaerobic conditions will develop in the sedimentation basin and problems
like floating sludge might occur. However, keeping a high return sludge flow brings up
the concentrations of dissolved oxygen in the anaerobic and anoxic basins and in turn
interrupts the biological processes here. By using intermittent aeration (i.e. over time
introducing less oxygen to the system) the return sludge flow can be kept at the same
rate without risking too high dissolved oxygen concentrations in the anoxic and
anaerobic basins.
Moreover, implementing intermittent control of the aeration system does allow lower
return sludge flow since more sludge is kept in the aeration basin (the sludge settles in
the basin when blowers are paused) and the syphon pipes thereby will need less
pressure.
To sum up: intermittent aeration introduces less oxygen (but still enough) to the system
and allows a lower return sludge flow, keeping down the dissolved oxygen
concentrations in the anoxic and anaerobic basins.
When introducing intermittent aeration to JE-WWTP constraints on aeration and non-
aeration time have to be taken into consideration to prevent the blowers from damage

19
and to keep good contact between the sludge and wastewater so that nutrients and
bacteria can interact. Favouring the blowers would be to keep long non-aeration periods,
but with regards to the biological activity these can not be kept too long. Since there are
not any mixers, already within a couple of minutes the sludge settles to the bottom of
the basin and will not be able to interact with the wastewater. Keeping a too long non-
aeration period is also a risk for too low oxygen concentrations in effluent.
A manufacturing constraint from the blowers installed at the JE-WWTP is that they can
start maximum 6 times/hour. Through the automatic control system another constraint
has been set so that the non-aeration period can not exceed 99 minutes. This is a
question of system security, to avoid that any operator might set longer periods.
20
3. METHOD
3.1 LITERATURE STUDY
This master thesis was initiated through a background study of biological wastewater
treatment through the activated sludge process and its control parameters, problems that
might occur during commissioning and how to avoid/prevent these.
3.2 WASTEWATER ANALYSIS AND RECORDING OF DATA COLLECTED
ON SITE
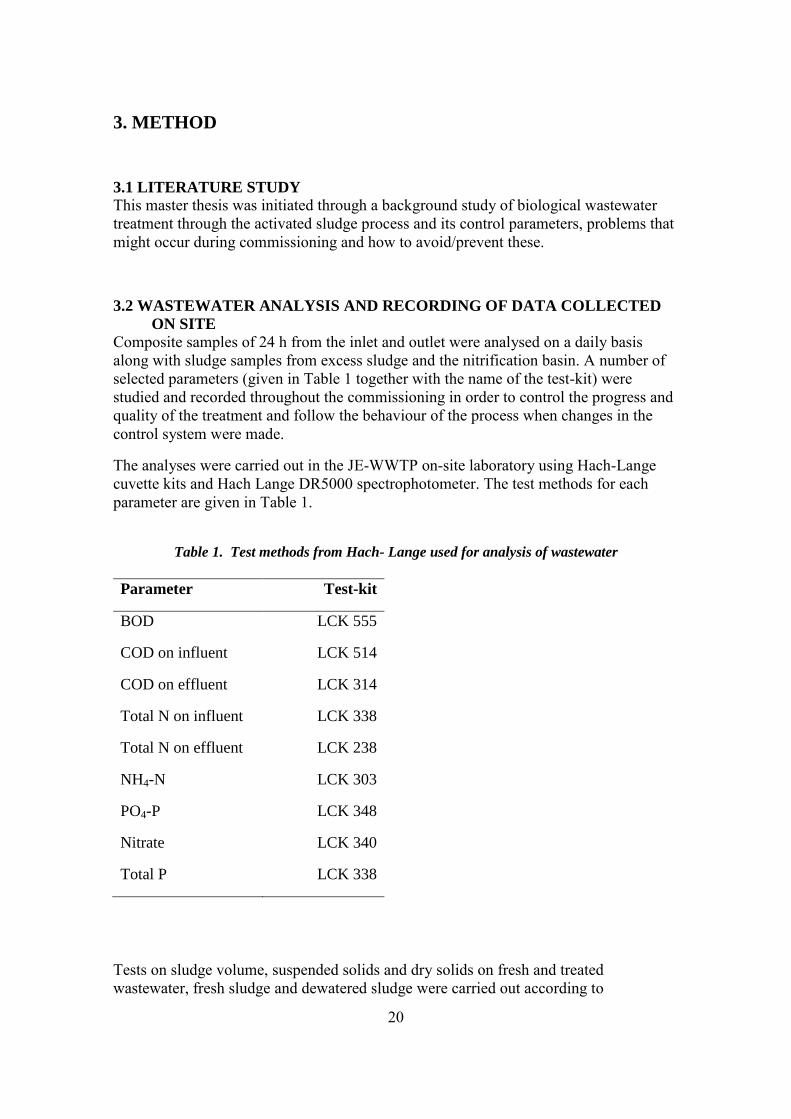
Composite samples of 24 h from the inlet and outlet were analysed on a daily basis
along with sludge samples from excess sludge and the nitrification basin. A number of
selected parameters (given in Table 1 together with the name of the test-kit) were
studied and recorded throughout the commissioning in order to control the progress and
quality of the treatment and follow the behaviour of the process when changes in the
control system were made.
The analyses were carried out in the JE-WWTP on-site laboratory using Hach-Lange
cuvette kits and Hach Lange DR5000 spectrophotometer. The test methods for each
parameter are given in Table 1.
Table 1. Test methods from Hach- Lange used for analysis of wastewater
Parameter Test-kit
BOD LCK 555
COD on influent LCK 514
COD on effluent LCK 314
Total N on influent LCK 338
Total N on effluent LCK 238
NH4-N LCK 303
PO4-P LCK 348
Nitrate LCK 340
Total P LCK 338
Tests on sludge volume, suspended solids and dry solids on fresh and treated
wastewater, fresh sludge and dewatered sludge were carried out according to
21
international standards (Metcalf et al., 2004).
The results were presented as a comparison of energy consumption and treatment results
during continuous and intermittent operation mode of the aeration system.
3.3 EVALUATION AND ADJUSTMENTS THROUGH THE AUTOMATIC
CONTROL SYSTEM
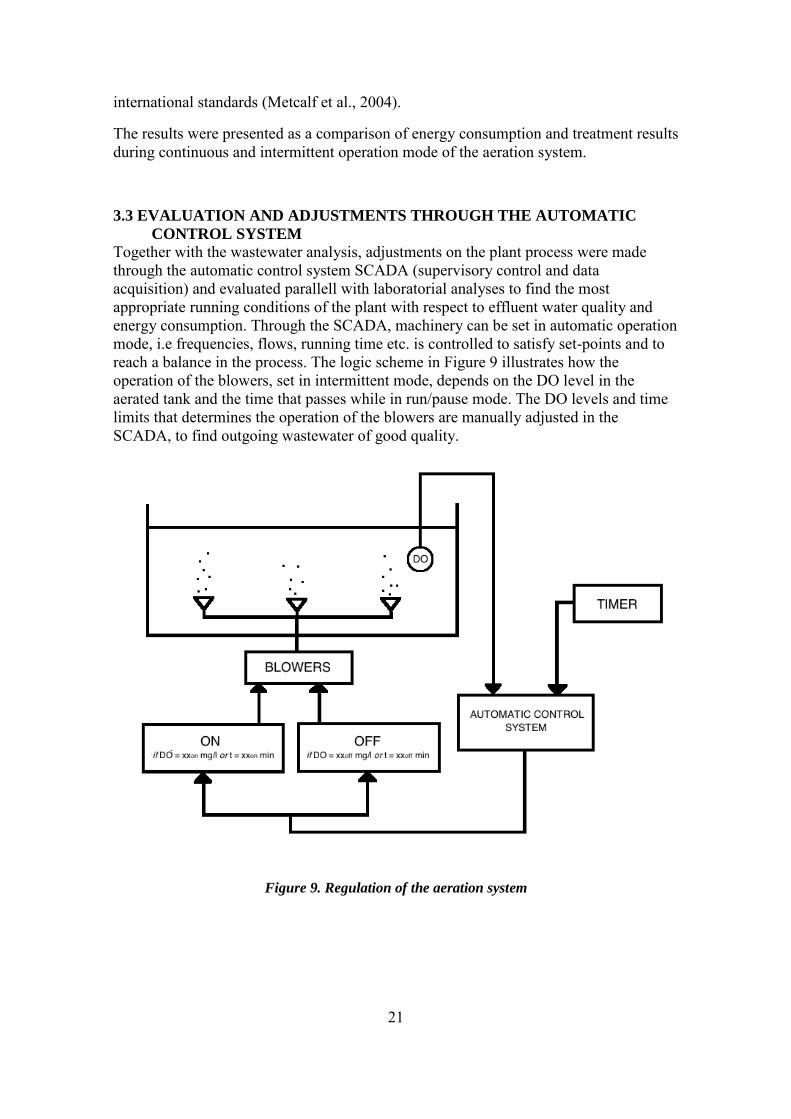
Together with the wastewater analysis, adjustments on the plant process were made
through the automatic control system SCADA (supervisory control and data
acquisition) and evaluated parallell with laboratorial analyses to find the most
appropriate running conditions of the plant with respect to effluent water quality and
energy consumption. Through the SCADA, machinery can be set in automatic operation
mode, i.e frequencies, flows, running time etc. is controlled to satisfy set-points and to
reach a balance in the process. The logic scheme in Figure 9 illustrates how the
operation of the blowers, set in intermittent mode, depends on the DO level in the
aerated tank and the time that passes while in run/pause mode. The DO levels and time
limits that determines the operation of the blowers are manually adjusted in the
SCADA, to find outgoing wastewater of good quality.
Figure 9. Regulation of the aeration system
22
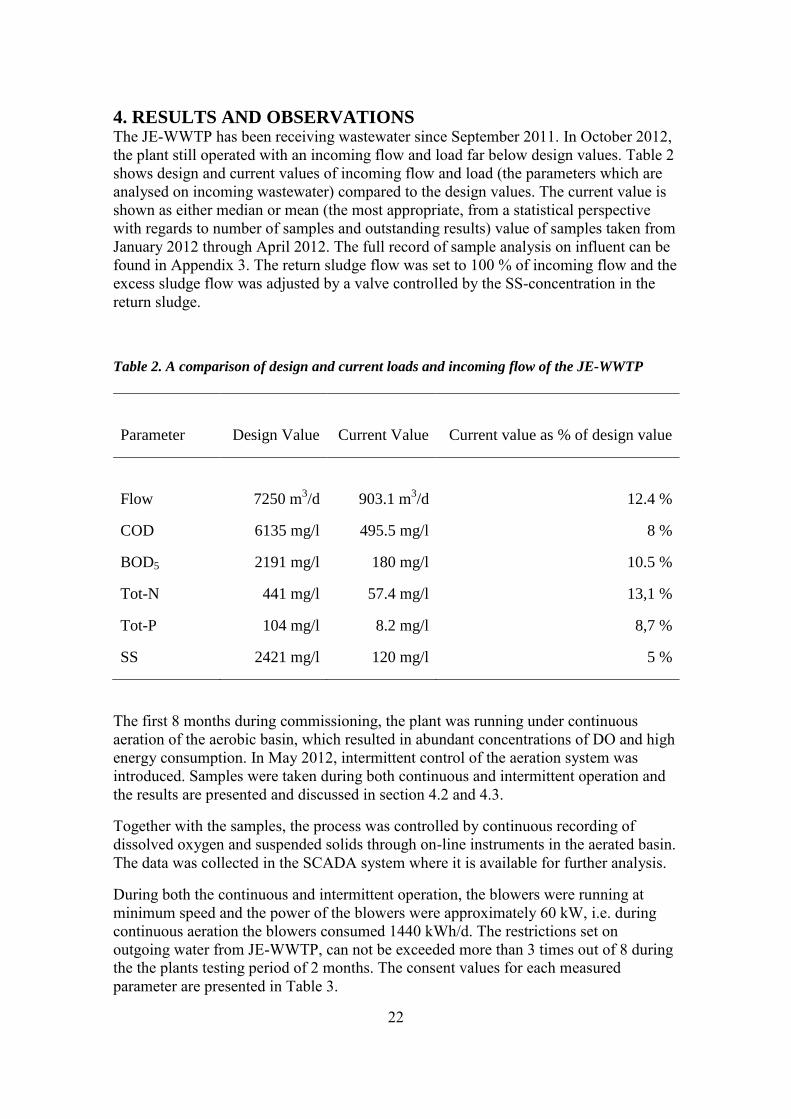
4. RESULTS AND OBSERVATIONS The JE-WWTP has been receiving wastewater since September 2011. In October 2012,
the plant still operated with an incoming flow and load far below design values. Table 2
shows design and current values of incoming flow and load (the parameters which are
analysed on incoming wastewater) compared to the design values. The current value is
shown as either median or mean (the most appropriate, from a statistical perspective
with regards to number of samples and outstanding results) value of samples taken from
January 2012 through April 2012. The full record of sample analysis on influent can be
found in Appendix 3. The return sludge flow was set to 100 % of incoming flow and the
excess sludge flow was adjusted by a valve controlled by the SS-concentration in the
return sludge.
Table 2. A comparison of design and current loads and incoming flow of the JE-WWTP
Parameter
Design Value
Current Value
Current value as % of design value
Flow
7250 m3/d
903.1 m3/d
12.4 %
COD 6135 mg/l 495.5 mg/l 8 %
BOD5 2191 mg/l 180 mg/l 10.5 %
Tot-N 441 mg/l 57.4 mg/l 13,1 %
Tot-P 104 mg/l 8.2 mg/l 8,7 %
SS 2421 mg/l 120 mg/l 5 %
The first 8 months during commissioning, the plant was running under continuous
aeration of the aerobic basin, which resulted in abundant concentrations of DO and high
energy consumption. In May 2012, intermittent control of the aeration system was
introduced. Samples were taken during both continuous and intermittent operation and
the results are presented and discussed in section 4.2 and 4.3.
Together with the samples, the process was controlled by continuous recording of
dissolved oxygen and suspended solids through on-line instruments in the aerated basin.
The data was collected in the SCADA system where it is available for further analysis.
During both the continuous and intermittent operation, the blowers were running at
minimum speed and the power of the blowers were approximately 60 kW, i.e. during
continuous aeration the blowers consumed 1440 kWh/d. The restrictions set on
outgoing water from JE-WWTP, can not be exceeded more than 3 times out of 8 during
the the plants testing period of 2 months. The consent values for each measured
parameter are presented in Table 3.
23
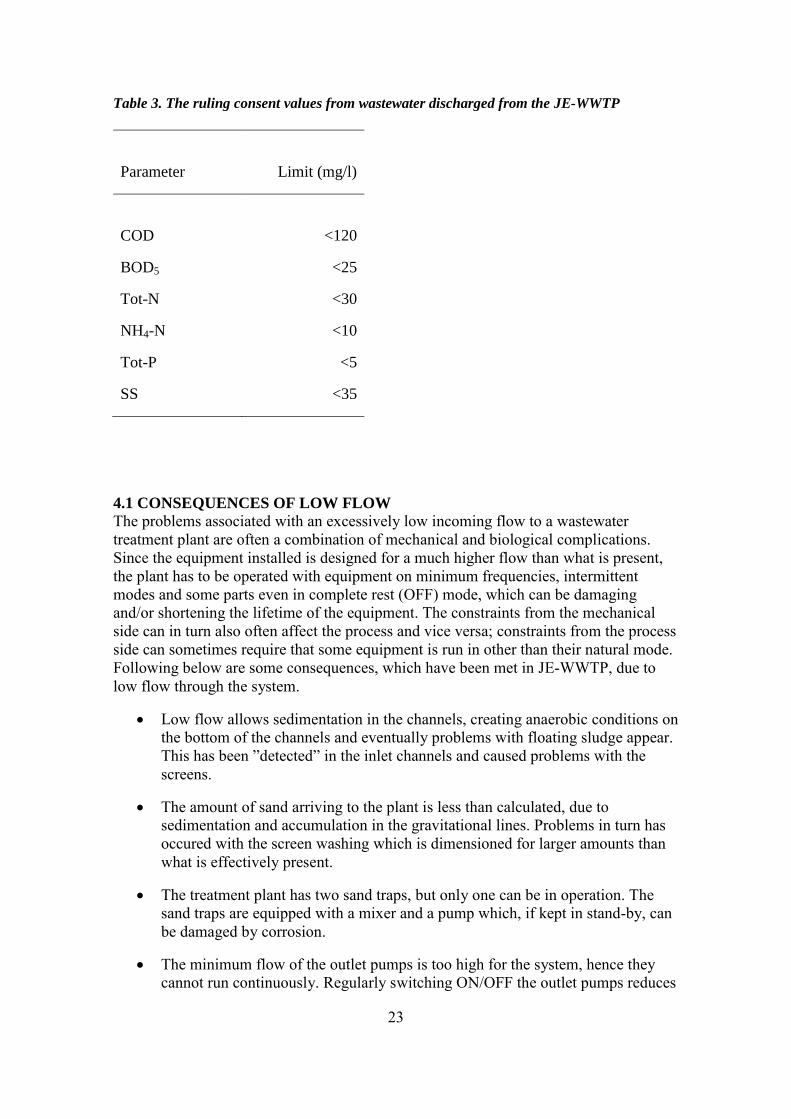
Table 3. The ruling consent values from wastewater discharged from the JE-WWTP
Parameter
Limit (mg/l)
COD
<120
BOD5 <25
Tot-N <30
NH4-N <10
Tot-P <5
SS <35
4.1 CONSEQUENCES OF LOW FLOW
The problems associated with an excessively low incoming flow to a wastewater
treatment plant are often a combination of mechanical and biological complications.
Since the equipment installed is designed for a much higher flow than what is present,
the plant has to be operated with equipment on minimum frequencies, intermittent
modes and some parts even in complete rest (OFF) mode, which can be damaging
and/or shortening the lifetime of the equipment. The constraints from the mechanical
side can in turn also often affect the process and vice versa; constraints from the process
side can sometimes require that some equipment is run in other than their natural mode.
Following below are some consequences, which have been met in JE-WWTP, due to
low flow through the system.
Low flow allows sedimentation in the channels, creating anaerobic conditions on
the bottom of the channels and eventually problems with floating sludge appear.
This has been ”detected” in the inlet channels and caused problems with the
screens.
The amount of sand arriving to the plant is less than calculated, due to
sedimentation and accumulation in the gravitational lines. Problems in turn has
occured with the screen washing which is dimensioned for larger amounts than
what is effectively present.
The treatment plant has two sand traps, but only one can be in operation. The
sand traps are equipped with a mixer and a pump which, if kept in stand-by, can
be damaged by corrosion.
The minimum flow of the outlet pumps is too high for the system, hence they
cannot run continuously. Regularly switching ON/OFF the outlet pumps reduces
24
their lifetime.
The sludge is thin and excess sludge can not be taken out continuously. The
outtake has to be done manually, which requires more work and good process
understanding from the operators.
4.2 TREATMENT RESULTS AND ENERGY CONSUMPTION WITH
CONTINUOUS AERATION
The plant was operated with continuous aeration from the first days of commissioning
in September 2011 until April 2012. Samples were taken through-out the period,
however in this evaluation only samples taken from January 2012 through April 2012
were considered. The statistical figures from these test results were calculated from the
full analysis report given in Appendix 4 and are presented in Table 4.
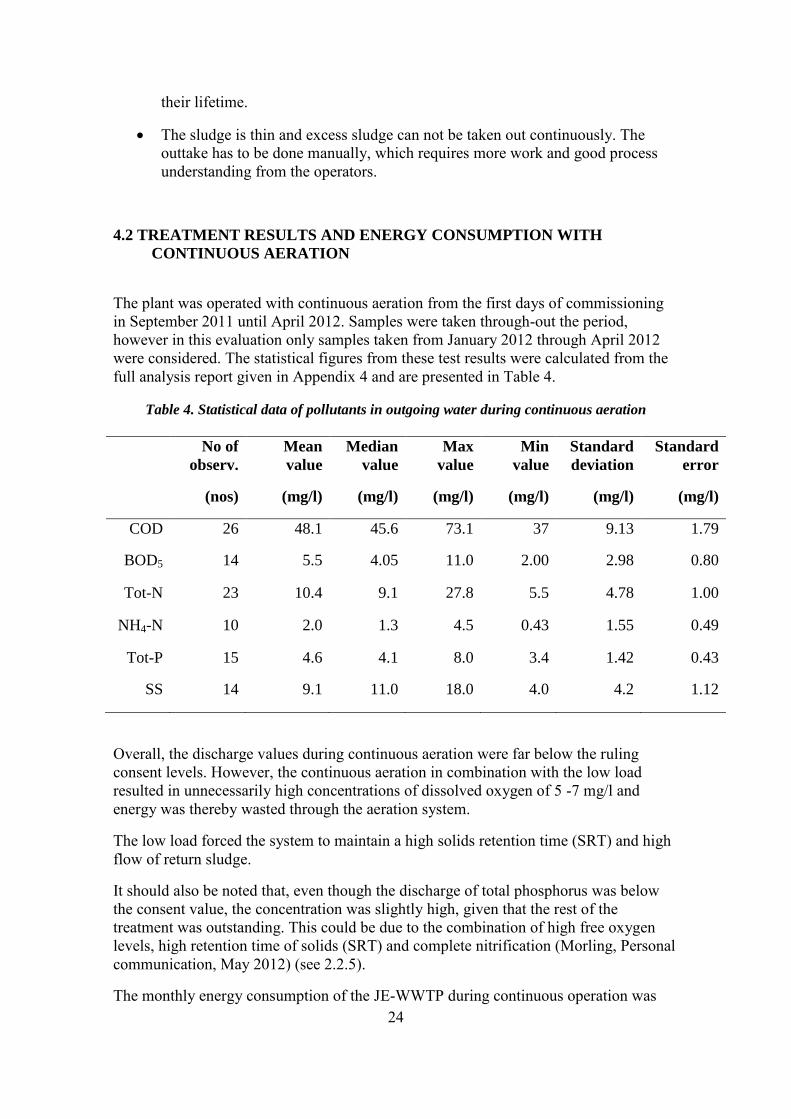
Table 4. Statistical data of pollutants in outgoing water during continuous aeration
No of
observ.
(nos)
Mean
value
(mg/l)
Median
value
(mg/l)
Max
value
(mg/l)
Min
value
(mg/l)
Standard
deviation
(mg/l)
Standard
error
(mg/l)
COD 26 48.1 45.6 73.1 37 9.13 1.79
BOD5 14 5.5 4.05 11.0 2.00 2.98 0.80
Tot-N 23 10.4 9.1 27.8 5.5 4.78 1.00
NH4-N 10 2.0 1.3 4.5 0.43 1.55 0.49
Tot-P 15 4.6 4.1 8.0 3.4 1.42 0.43
SS 14 9.1 11.0 18.0 4.0 4.2 1.12
Overall, the discharge values during continuous aeration were far below the ruling
consent levels. However, the continuous aeration in combination with the low load
resulted in unnecessarily high concentrations of dissolved oxygen of 5 -7 mg/l and
energy was thereby wasted through the aeration system.
The low load forced the system to maintain a high solids retention time (SRT) and high
flow of return sludge.
It should also be noted that, even though the discharge of total phosphorus was below
the consent value, the concentration was slightly high, given that the rest of the
treatment was outstanding. This could be due to the combination of high free oxygen
levels, high retention time of solids (SRT) and complete nitrification (Morling, Personal
communication, May 2012) (see 2.2.5).
The monthly energy consumption of the JE-WWTP during continuous operation was
25
found to be around 42 000 kWh.
4.3 TREATMENT RESULTS AND ENERGY CONSUMPTION WITH
INTERMITTENT AERATION
In May 2012, the plant was operated in intermittent aeration mode and samples were
taken during the whole commissioning period. The statistical figures were calculated
from the test results (see Appendix 6) and are presented in Table 5. The composition of
the incoming wastewater was similar during the periods continuous and intermittent
aeration.
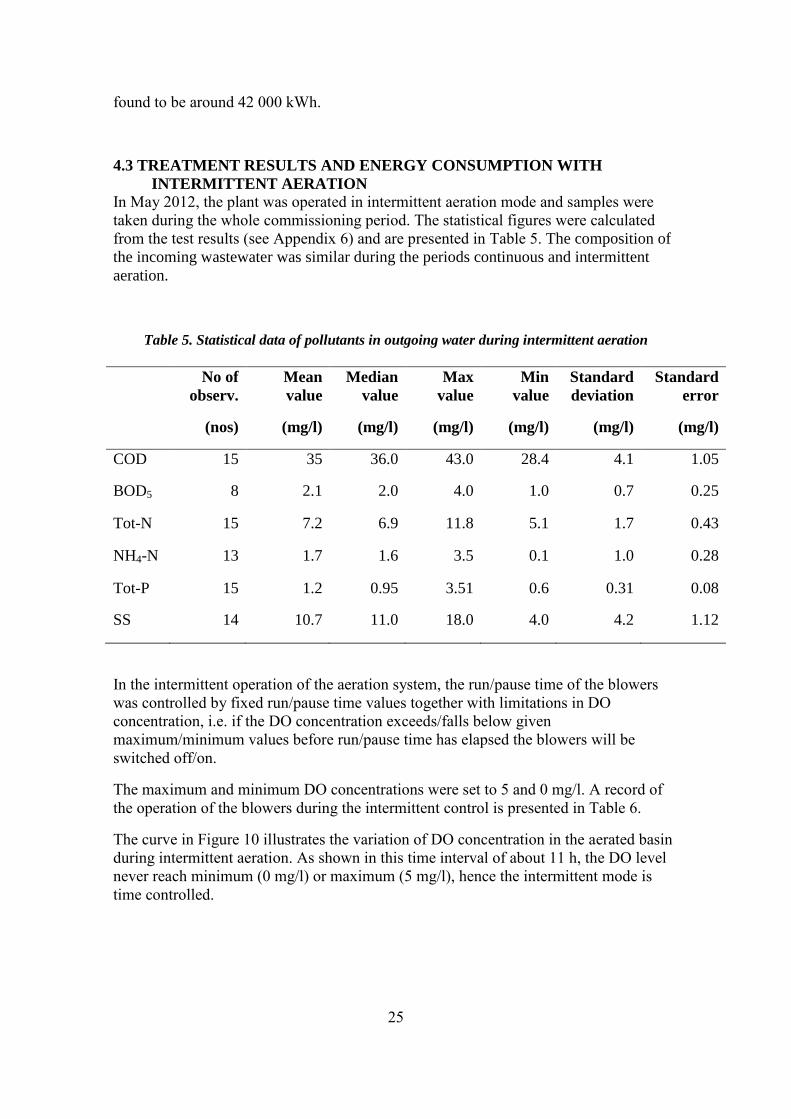
Table 5. Statistical data of pollutants in outgoing water during intermittent aeration
No of
observ.
(nos)
Mean
value
(mg/l)
Median
value
(mg/l)
Max
value
(mg/l)
Min
value
(mg/l)
Standard
deviation
(mg/l)
Standard
error
(mg/l)
COD 15 35 36.0 43.0 28.4 4.1 1.05
BOD5 8 2.1 2.0 4.0 1.0 0.7 0.25
Tot-N 15 7.2 6.9 11.8 5.1 1.7 0.43
NH4-N 13 1.7 1.6 3.5 0.1 1.0 0.28
Tot-P 15 1.2 0.95 3.51 0.6 0.31 0.08
SS 14 10.7 11.0 18.0 4.0 4.2 1.12
In the intermittent operation of the aeration system, the run/pause time of the blowers
was controlled by fixed run/pause time values together with limitations in DO
concentration, i.e. if the DO concentration exceeds/falls below given
maximum/minimum values before run/pause time has elapsed the blowers will be
switched off/on.
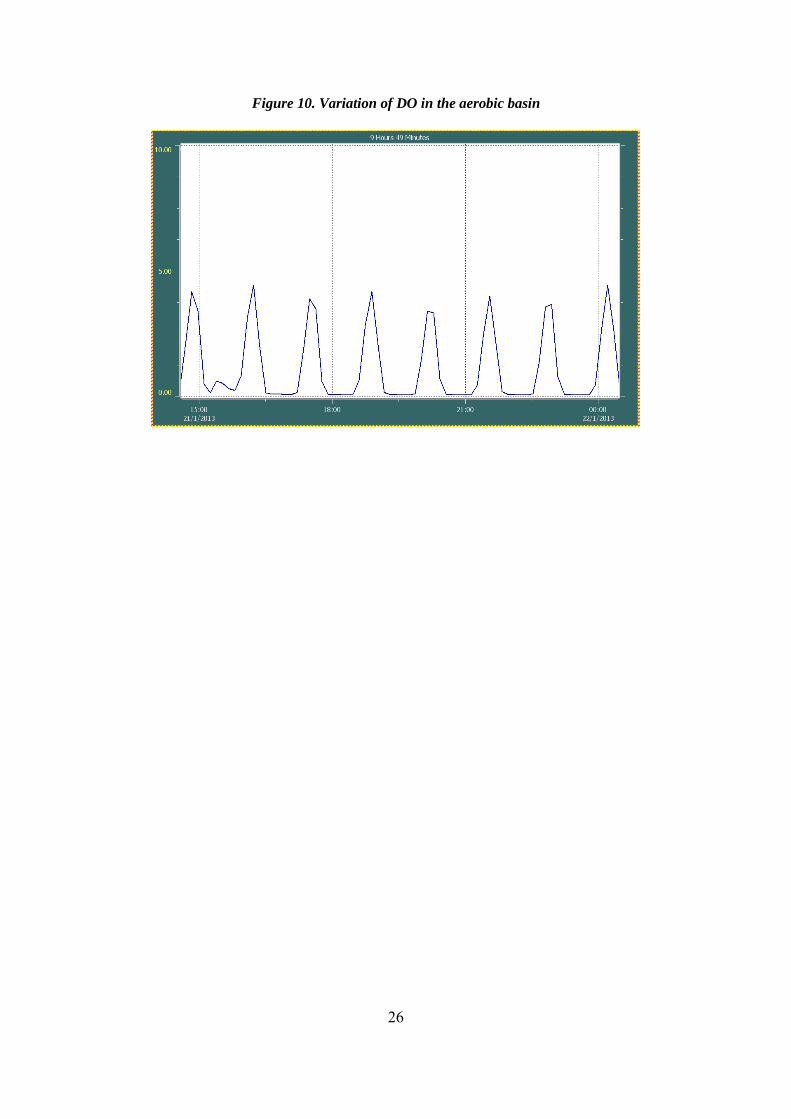
The maximum and minimum DO concentrations were set to 5 and 0 mg/l. A record of
the operation of the blowers during the intermittent control is presented in Table 6.
The curve in Figure 10 illustrates the variation of DO concentration in the aerated basin
during intermittent aeration. As shown in this time interval of about 11 h, the DO level
never reach minimum (0 mg/l) or maximum (5 mg/l), hence the intermittent mode is
time controlled.
26
Figure 10. Variation of DO in the aerobic basin
27
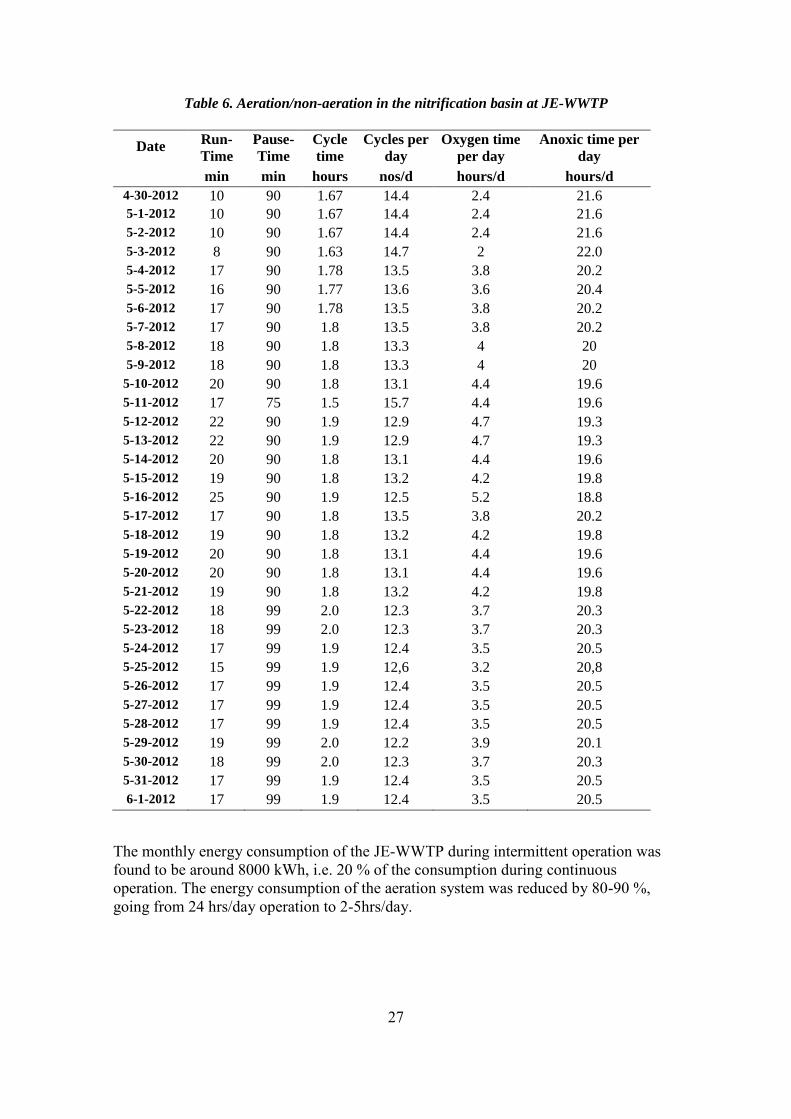
Table 6. Aeration/non-aeration in the nitrification basin at JE-WWTP
Date Run-
Time
Pause-
Time
Cycle
time
Cycles per
day
Oxygen time
per day
Anoxic time per
day
min min hours nos/d hours/d hours/d
4-30-2012 10 90 1.67 14.4 2.4 21.6
5-1-2012 10 90 1.67 14.4 2.4 21.6
5-2-2012 10 90 1.67 14.4 2.4 21.6
5-3-2012 8 90 1.63 14.7 2 22.0
5-4-2012 17 90 1.78 13.5 3.8 20.2
5-5-2012 16 90 1.77 13.6 3.6 20.4
5-6-2012 17 90 1.78 13.5 3.8 20.2
5-7-2012 17 90 1.8 13.5 3.8 20.2
5-8-2012 18 90 1.8 13.3 4 20
5-9-2012 18 90 1.8 13.3 4 20
5-10-2012 20 90 1.8 13.1 4.4 19.6
5-11-2012 17 75 1.5 15.7 4.4 19.6
5-12-2012 22 90 1.9 12.9 4.7 19.3
5-13-2012 22 90 1.9 12.9 4.7 19.3
5-14-2012 20 90 1.8 13.1 4.4 19.6
5-15-2012 19 90 1.8 13.2 4.2 19.8
5-16-2012 25 90 1.9 12.5 5.2 18.8
5-17-2012 17 90 1.8 13.5 3.8 20.2
5-18-2012 19 90 1.8 13.2 4.2 19.8
5-19-2012 20 90 1.8 13.1 4.4 19.6
5-20-2012 20 90 1.8 13.1 4.4 19.6
5-21-2012 19 90 1.8 13.2 4.2 19.8
5-22-2012 18 99 2.0 12.3 3.7 20.3
5-23-2012 18 99 2.0 12.3 3.7 20.3
5-24-2012 17 99 1.9 12.4 3.5 20.5
5-25-2012 15 99 1.9 12,6 3.2 20,8
5-26-2012 17 99 1.9 12.4 3.5 20.5
5-27-2012 17 99 1.9 12.4 3.5 20.5
5-28-2012 17 99 1.9 12.4 3.5 20.5
5-29-2012 19 99 2.0 12.2 3.9 20.1
5-30-2012 18 99 2.0 12.3 3.7 20.3
5-31-2012 17 99 1.9 12.4 3.5 20.5
6-1-2012 17 99 1.9 12.4 3.5 20.5
The monthly energy consumption of the JE-WWTP during intermittent operation was
found to be around 8000 kWh, i.e. 20 % of the consumption during continuous
operation. The energy consumption of the aeration system was reduced by 80-90 %,
going from 24 hrs/day operation to 2-5hrs/day.
28
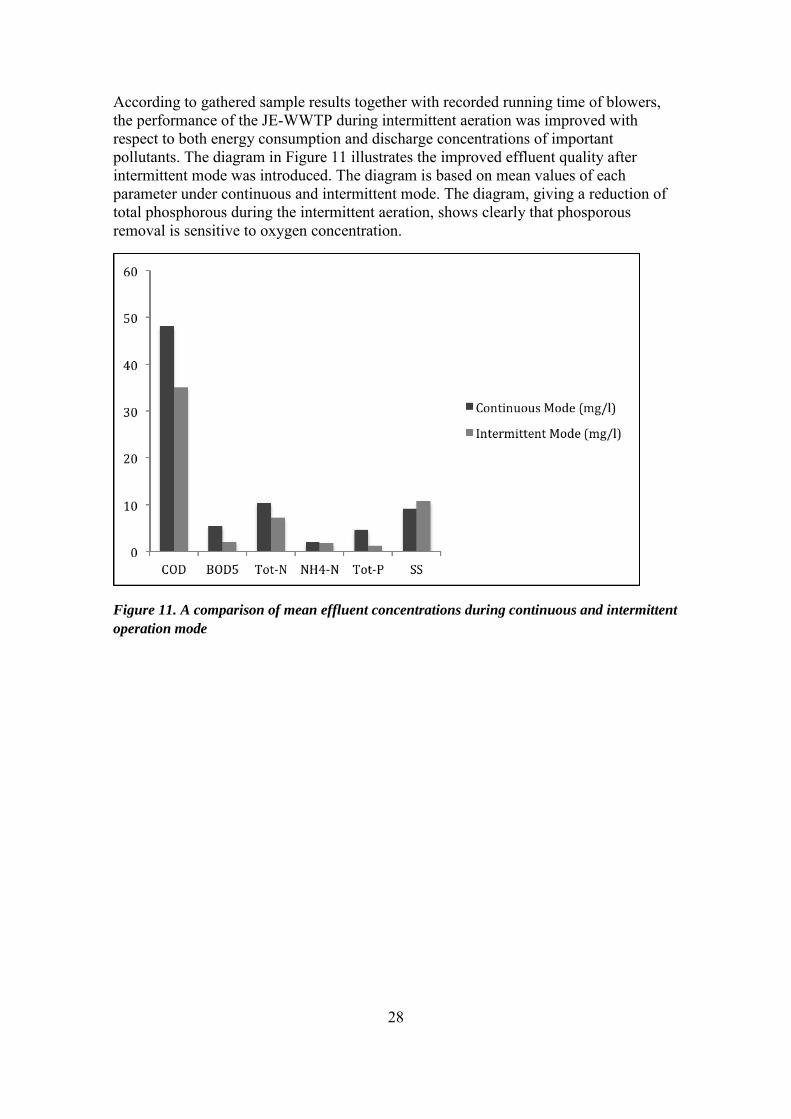
According to gathered sample results together with recorded running time of blowers,
the performance of the JE-WWTP during intermittent aeration was improved with
respect to both energy consumption and discharge concentrations of important
pollutants. The diagram in Figure 11 illustrates the improved effluent quality after
intermittent mode was introduced. The diagram is based on mean values of each
parameter under continuous and intermittent mode. The diagram, giving a reduction of
total phosphorous during the intermittent aeration, shows clearly that phosporous
removal is sensitive to oxygen concentration.
Figure 11. A comparison of mean effluent concentrations during continuous and intermittent
operation mode
29
5. DISCUSSION AND CONCLUSIONS That intermittent aeration will save energy (due to less operation time of the aeration
system), compared to continuous, is a fact in all plants where it is applied. However, the
amount of energy that can be saved and how the biological process will be affected is
individual for each plant, depending on restrictions from machinery, load and flow into
the plant together with pH, temperature and other factors which directly affects the
biological growth, sludge stabilization and nutrient removal.
Environmental Technology has published a review paper that critically assesses positive
and negative implications of interrupting aeration in nitrifying activated sludge plants
designed for continuous aeration (Dotro, 2011). The conclusion drawn regarding
treatment and energy efficiency is however positive, suggesting potential savings in
terms of aeration to 33-45%.
The complications that have aroused at the JE-WWTP are mostly due to the fact that the
biological reactors in the plant were not designed to run in intermittent mode. For
example, since the plant has been in intermittent operation, the aeration basin has acted
as a sludge storage, with SS concentrations around 7000 mg/l. This due to the fact that
the basin is not equipped with mixers, hence when blowers are turned off, mixed liquor
suspended solids settle within a short time. This same negative impact has been met in
other similar plants (Dotro, 2011). A solution that could be attended to in JE-WWTP, if
not installing mixers, is to pump sludge directly from the aeration basin to the sludge
storage. The absence of mixers, resulting in less frequent contact between the biomass
and water, also slows the nitrification rate. However, due to the high retention time kept
in the basins, JE-WWTP still has been able to keep good results.
In general, the change of operation mode from continuous to intermittent has been
successful with regards to both treatment and energy efficiency. The plant will continue
to run with intermittent control until there is a major increase of the load and flow into
the plant.
5.1 EVALUATION OF THE INTRODUCTION OF INTERMITTENT
AERATION AT JE-WWTP
Optimization of the intermittent control was done under consideration of energy
consumption, effluent quality and restrictions from SCADA and the machinery. Out of
security reasons the SCADA limits the maximum pause time to 99 minutes. In late 2012
the plant was running with a pause time of 99 minutes and runtime of 20 minutes.
Initially, the run time of the blowers was mostly controlled by the pre-set maximum
oxygen level and usually reached maximum value (5 mg O2/l) before the programmed
run time of 20 min. However, as the SS in the aeration basin has increased during the
months of intermittent operation, the aeration is now completely time controlled.
Since there are many factors affecting the process, it is not possible to evaluate small
changes in run/pause time of the blowers with regard to treatment results. To be able to
make a fair evaluation, one should run the plant for (minimum) one sludge age between
every change.The reason for this is that the whole biomass should be exchanged at least
once, so that the new biomass can adjust to the new living conditions. One sludge age is
therefore used as a rule of thumb before evaluating a new operation mode.
30
Theoretically, in a total-mixed system like at JE-WWTP, the complete biomass will not
be exchanged in one sludge age. Still, this approximation can be made since a majority
of the bacteria will grow under the new conditions.
For example, there is an hourly and diurnal variation in the incoming load (including pH
and temperature) and flow due to factory working hours and variations in processes,
daily household routines, heavy rains and load variations due to low flow and anaerobic
circumstances in the lines. If these variations have a substantial impact on the biological
process, even if it is recorded, the variations in the incoming flow together with the
process adjustments made on the plant, create too many variables to conclude a
relationship between incoming load, flow and treatment result. However, the whole
period of intermittent aeration mode has demonstrated improved treatment results
compared to the previous continuous operation mode.
Why does the intermittent mode favour the treatment performance? With continuous
airflow into the system in combination with the low load and relatively high return
sludge flow, there is an excess of oxygen in the whole system, including the anoxic and
anaerobic basins, inhibiting the biological processes which the basins are designed for.
Introducing intermittent airflow, with carefully chosen on/off intervals, reduces the
oxygen level in the anoxic and anaerobic basins. Still this operation mode allows
nitrification to occur in the aerobic basin.
With respect to the mechanical parts of the plant and to the biology, implementing
intermittent control does require some additional understanding of the treatment process
and surveillance by plant operators.
Energy consumption through the aeration system when the plant is run in intermittent
aeration mode, can be decreased by 80-90 %, going from a 24 h/d operation time during
continuous mode to 2-5 h/d operation time in the intermittent mode. In late 2012 the
energy consumption of the whole plant was around 8000 kWh per month.
5.2 MANAGING ADVANCED WASTEWATER TREATMENT PLANTS IN
DEVOLOPING COUNTRIES
The wastewater treatment plant in Ja-Ela is the first high-tech plant in operation in Sri
Lanka. Even though it is operated by local staff after the formal take-over procedure, the
management must have good understanding of the process, the automatic control
system and the machinery. The main parts of the plant have been imported from Europe
and for the majority of the management, this is the first acquaintance. In order to have a
smooth handover of the plant from contractors to employers, the commissioning and
trial period was overlapped by on-site training of future personnel and management.
During 6 months, the staff (with different educational background) from the employer
has followed on-site training together with personnel from the contractor and
representatives from the suppliers of equipment and technology. The training has
covered the everyday procedures of the plant, repairs and adjustments in machinery,
laboratorial work and monitoring of the automatic control system. Over all, on
maintenance basis, the hand-over of the plant has been smooth. The complications
found in the treatment process due to low incoming flow, can even be seen as positive
side-factor with respect to the improved knowledge it has brought to the future
personnel.
31
The Ja-Ela/Ekala sewerage system is distributed around the big industrial area in Ekala
and the treatment plant is situated next to Nivasipura, a housing scheme accommodating
approximately 3600 people. The industrial area includes a mix of factories, small to
large scale, more or less spread out over a large area also including small households.
The choice of location has had its complications. Complaints and protests from
Nivasipura, from the smaller households and business enterprises neighbouring the
pump stations and from fishermen residing in the disposal area have been received since
the start of the project. Some have been formal and somehow easier to respond to.
Others have been directly violent, reflecting the lack of environmental understanding
among the people. However, in my opinion, the complaints, appropriate or not, have
been rightfully placed. During the planning of the project, the government has not taken
enough consideration of the residents and their exposure to odour coming from the
sewerage system. Respecting the complaints, finding solutions and going through
lawful procedures in order to appease the plaintiffs and continue with the project has
been time (=money) consuming and could have been avoided with better planning and
more understanding from both the government and the people.
After agreement with the employer, the JE-WWTP was designed in 2007 for 36 000 p.e.
Having the plant ready to receive water in September 2011, there was approximately 4
500 p.e connected to the network, due to incorrect information about flows from
individual clients and bad approximation. Also many of the clients had in an early stage
expressed interest in connecting to the network, but no agreement was formalised and
up to October 5, 2012 the employer is still having problems to get more connections to
the network.
As a summary, building a high-tech wastewater treatment plant in a developing country
like Sri Lanka requires precise planning and time scheduling, including the period
during and after commissioning and a non-optimistic time span left for the unexpected.
32
6. REFERENCES ATV-DVWK Specialist Committees KA 5 and KA6, 2000, Standard ATV-DVWK 131E
Dimensioning of Single-Stage Activated Sludge Plants, GFA Publishing Company of
ATV-DVWK Water, May 2000, Wastewater and Waste, Germany CBD NEWS,
2009,The history of Sri Lanka,http://www.cbc.ca/news/world/story/2009/02/04/f-sri-
lanka.html, accessed 2012-12-23
Doan, H. and A. Lohi, 2009, Intermittent Aeration in Biological Treatment of
Wastewater, Vol. 01 No. 02 American Journal of Engineering and Applied Sciences,
USA
Dotro, D., Jefferson, B., Jones, M., Vale, P., Cartmell, E. and Stephenson, T., 2011, A
review of the impact and potential of intermittent aeration on continuous flow nitrifying
activated sludge, Vol. 33 No. 15 Environmental Technology
Driscoll,T.P., Barber, J.B. And Chandran, K., 2008, Industrial Wastewater
Management, Treatment and Disposal, Water Environment Federation Press, McGraw-
Hill, USA
Habermeyer, P. and Sanchez, A., 2005, Optimization of the Intermittent Aeration in a
Full-Scale Wastewater Treatment Plant Biological Reactor for Nitrogen Removal, Vol.
77 No. 3 Water Environment Research, Water Environment Federation, USA
Indebetou, 2007, Operation Instruction JE-WWTP, Purac, Sweden
Jörgensen, D., Onnerth, T. and Verkuijlen, J., 2011, Advanced Process Control by STAR
Control Reduces Effluent Quality to the Safe Side of Limit Values, Kruger A/S,
Denmark
Kruger, 2009, STAR Control,
http://www.kruger.dk/krugeras/ressources/files/1/8176,STAR_control-UK.pdf, accessed
2012-12-27
Metcalf & Eddy, 2004, Wastewater Engineering – Treatment and Reuse, The McGraw-
Hill Series in Civil and Environmental Engineering, McGraw-Hill, Singapore
Ministry of urban development and water supply, 2005, Supplementary environmental
impact assessment report, Democratic socialist republic of Sri Lanka, Sri Lanka
National Water Sanitary and Drainage Board, 2007, Terms of Reference for Supervisory
Services of Ratmalana/Moratuwa and Ja-Ela/Ekala Wastewater Disposal Project In Sri
Lanka, Sri Lanka
National Water Sanitary and Drainage Board, 2007, Tender Notice, Sri Lanka
Skövde Kommun, 2009, Planprogram för Stadskvarn – Aspelund,
http://www.skovde.se/upload/ByggaBo/BilderPBLK/Planutstallningar/Stadskvarn_Asp
elund/Programbeskrivning%20Stadskvarn%20Aspelund%20godkännande.pdf, accessed
2012-12-25
33
Svenskt Vatten, 2010, Avloppsteknik 2- Reningsprocessen, Sweden
Tekniska Verken, 2012, Nykvarnsverket, http://www.tekniskaverken.se/om-
oss/anlaggningar/nykvarnsverket/index.xml, accessed 2012-12-25
Todar’s online textbook of bacteriology, 2009, Nutrition and growth of bacteria,
http://textbookofbacteriology.net/themicrobialworld/nutgro.html, accessed 2012-12-23
US Environmental Protection Agency, 2010, Wastewater Technology Fact Sheet,
www.epa.gov, accessed 2010-05-20
University of Missouri Extension, 2012, Nitrogen Cycle, http://extension.missouri.edu,
accessed 2012-05-26
VA-Ingenjörerna, 2009, Nyhetsbrev Nr 1,
http://www.vaing.se/vaengineers/ressources/documents/1/4252,STAR_2009_lite.pdf,
accessed 2012-12-27
Xia, S., Gao, TY. And Zhou, ZY., 2002, Nitrogen and phosphorous removal under
intermittent aeration conditions, Vol. 14 No. 4 Journal of environmental sciences
Österlund, R., Vogel, K. and Fjallstrom, M., 2004, Växters kvävefixering och
kvävemetabolism, BMC, Sweden
PERSONAL COMMUNICATIONS
Staffan Indebetou, Purac AB, May 2012
Stefan Sehlén, Tekniska Verken, February 2013
Stig Morling, Sweco, May 2012
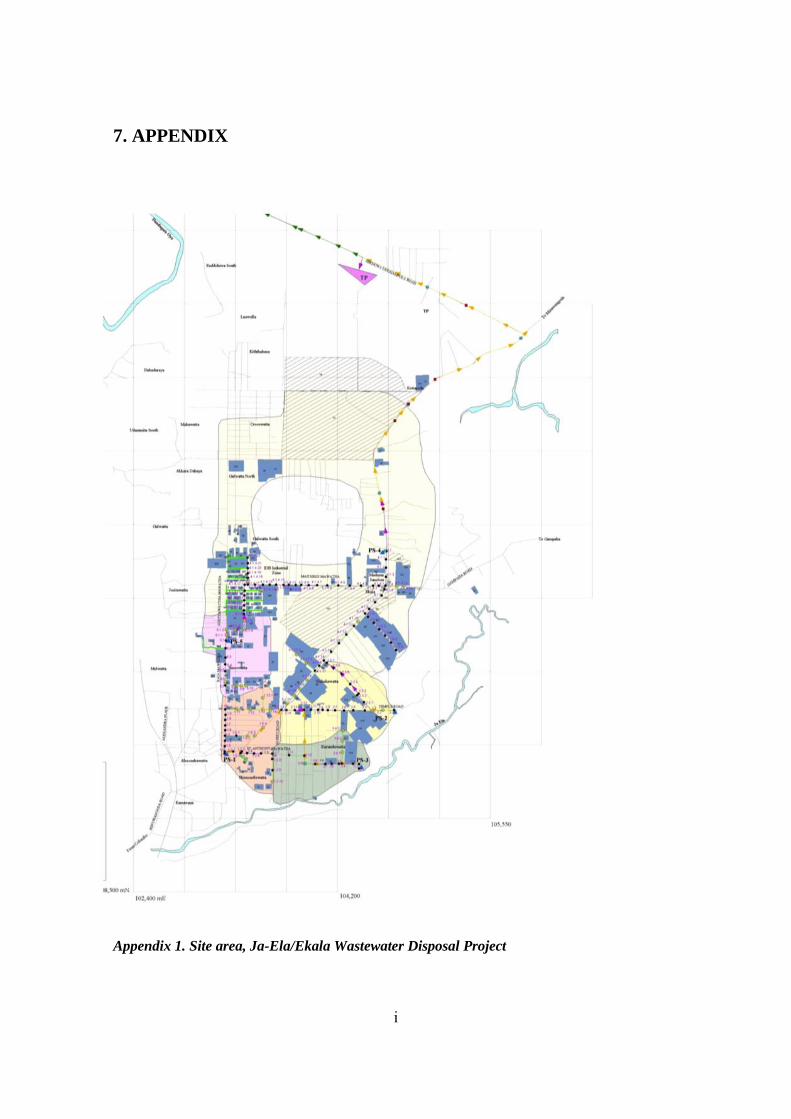
i
7. APPENDIX
Appendix 1. Site area, Ja-Ela/Ekala Wastewater Disposal Project
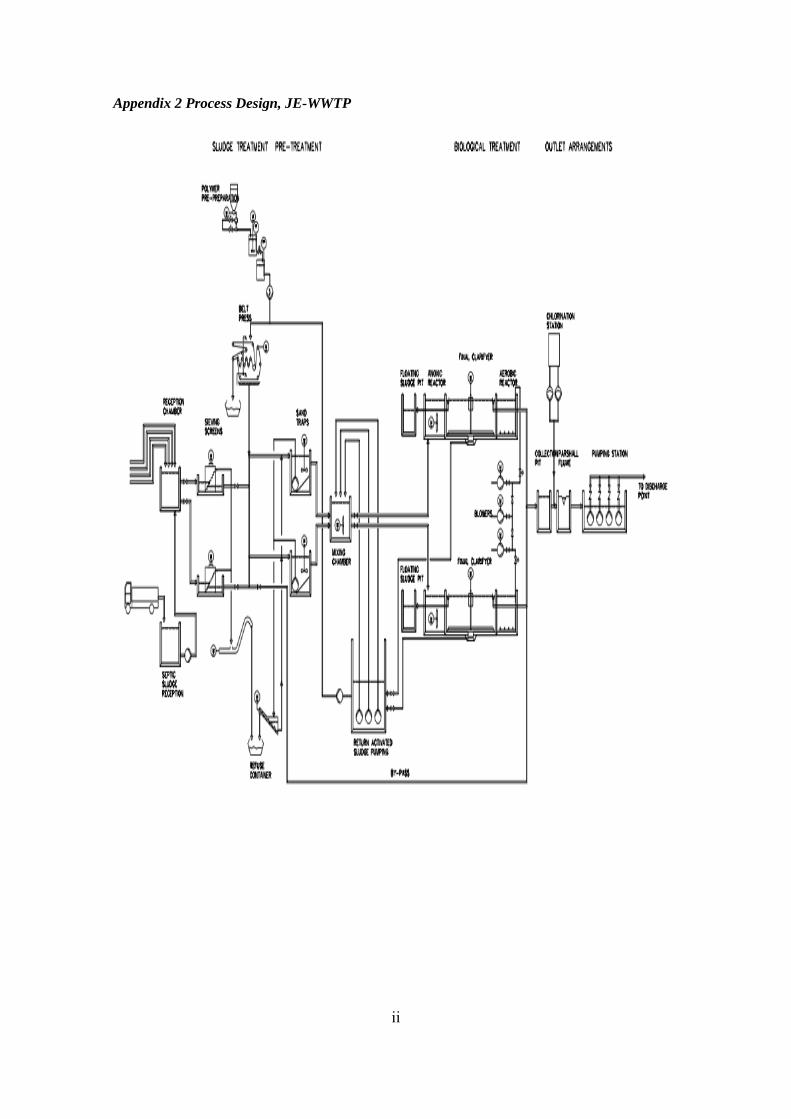
ii
Appendix 2 Process Design, JE-WWTP
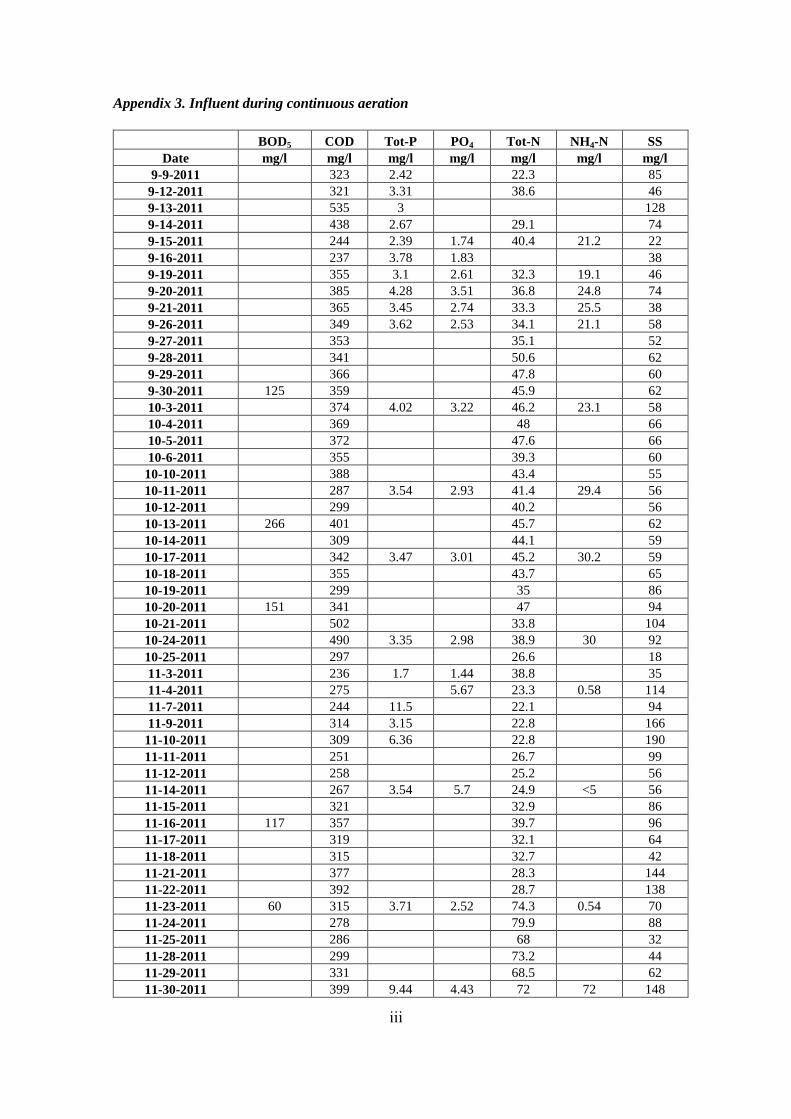
iii
Appendix 3. Influent during continuous aeration
BOD5 COD Tot-P PO4 Tot-N NH4-N SS
Date mg/l mg/l mg/l mg/l mg/l mg/l mg/l
9-9-2011 323 2.42 22.3 85
9-12-2011 321 3.31 38.6 46
9-13-2011 535 3 128
9-14-2011 438 2.67 29.1 74
9-15-2011 244 2.39 1.74 40.4 21.2 22
9-16-2011 237 3.78 1.83 38
9-19-2011 355 3.1 2.61 32.3 19.1 46
9-20-2011 385 4.28 3.51 36.8 24.8 74
9-21-2011 365 3.45 2.74 33.3 25.5 38
9-26-2011 349 3.62 2.53 34.1 21.1 58
9-27-2011 353 35.1 52
9-28-2011 341 50.6 62
9-29-2011 366 47.8 60
9-30-2011 125 359 45.9 62
10-3-2011 374 4.02 3.22 46.2 23.1 58
10-4-2011 369 48 66
10-5-2011 372 47.6 66
10-6-2011 355 39.3 60
10-10-2011 388 43.4 55
10-11-2011 287 3.54 2.93 41.4 29.4 56
10-12-2011 299 40.2 56
10-13-2011 266 401 45.7 62
10-14-2011 309 44.1 59
10-17-2011 342 3.47 3.01 45.2 30.2 59
10-18-2011 355 43.7 65
10-19-2011 299 35 86
10-20-2011 151 341 47 94
10-21-2011 502 33.8 104
10-24-2011 490 3.35 2.98 38.9 30 92
10-25-2011 297 26.6 18
11-3-2011 236 1.7 1.44 38.8 35
11-4-2011 275 5.67 23.3 0.58 114
11-7-2011 244 11.5 22.1 94
11-9-2011 314 3.15 22.8 166
11-10-2011 309 6.36 22.8 190
11-11-2011 251 26.7 99
11-12-2011 258 25.2 56
11-14-2011 267 3.54 5.7 24.9 <5 56
11-15-2011 321 32.9 86
11-16-2011 117 357 39.7 96
11-17-2011 319 32.1 64
11-18-2011 315 32.7 42
11-21-2011 377 28.3 144
11-22-2011 392 28.7 138
11-23-2011 60 315 3.71 2.52 74.3 0.54 70
11-24-2011 278 79.9 88
11-25-2011 286 68 32
11-28-2011 299 73.2 44
11-29-2011 331 68.5 62
11-30-2011 399 9.44 4.43 72 72 148
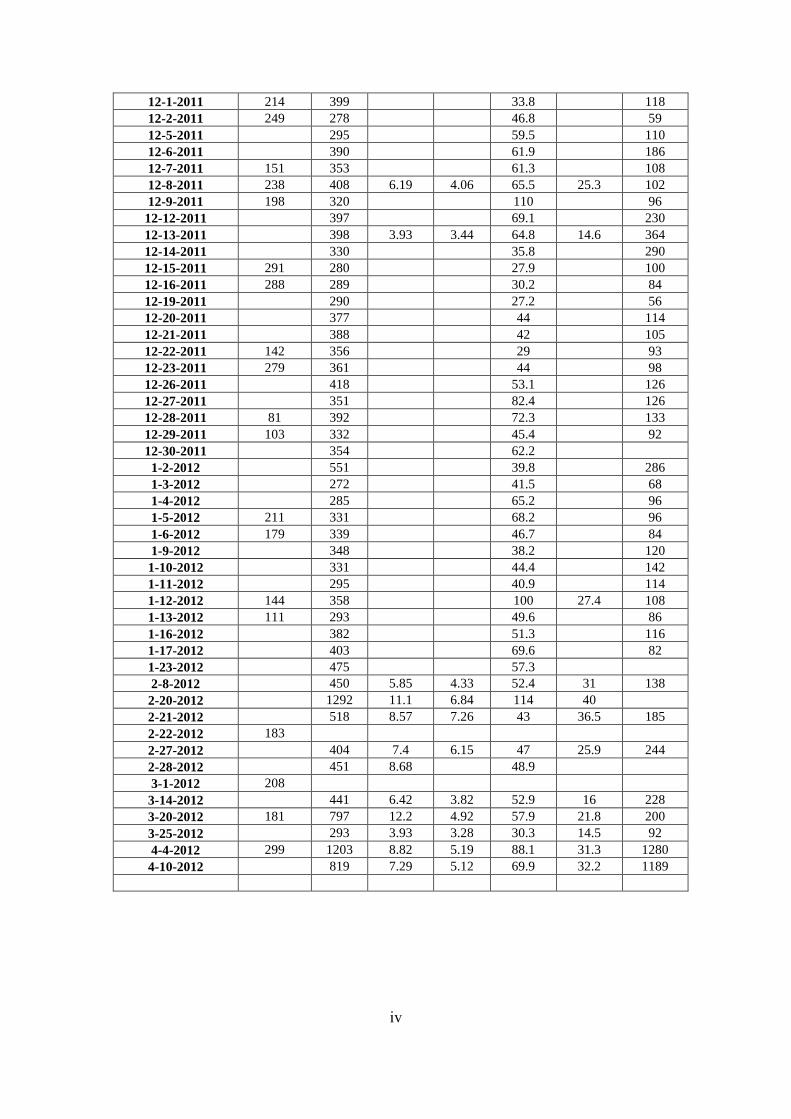
iv
12-1-2011 214 399 33.8 118
12-2-2011 249 278 46.8 59
12-5-2011 295 59.5 110
12-6-2011 390 61.9 186
12-7-2011 151 353 61.3 108
12-8-2011 238 408 6.19 4.06 65.5 25.3 102
12-9-2011 198 320 110 96
12-12-2011 397 69.1 230
12-13-2011 398 3.93 3.44 64.8 14.6 364
12-14-2011 330 35.8 290
12-15-2011 291 280 27.9 100
12-16-2011 288 289 30.2 84
12-19-2011 290 27.2 56
12-20-2011 377 44 114
12-21-2011 388 42 105
12-22-2011 142 356 29 93
12-23-2011 279 361 44 98
12-26-2011 418 53.1 126
12-27-2011 351 82.4 126
12-28-2011 81 392 72.3 133
12-29-2011 103 332 45.4 92
12-30-2011 354 62.2
1-2-2012 551 39.8 286
1-3-2012 272 41.5 68
1-4-2012 285 65.2 96
1-5-2012 211 331 68.2 96
1-6-2012 179 339 46.7 84
1-9-2012 348 38.2 120
1-10-2012 331 44.4 142
1-11-2012 295 40.9 114
1-12-2012 144 358 100 27.4 108
1-13-2012 111 293 49.6 86
1-16-2012 382 51.3 116
1-17-2012 403 69.6 82
1-23-2012 475 57.3
2-8-2012 450 5.85 4.33 52.4 31 138
2-20-2012 1292 11.1 6.84 114 40
2-21-2012 518 8.57 7.26 43 36.5 185
2-22-2012 183
2-27-2012 404 7.4 6.15 47 25.9 244
2-28-2012 451 8.68 48.9
3-1-2012 208
3-14-2012 441 6.42 3.82 52.9 16 228
3-20-2012 181 797 12.2 4.92 57.9 21.8 200
3-25-2012 293 3.93 3.28 30.3 14.5 92
4-4-2012 299 1203 8.82 5.19 88.1 31.3 1280
4-10-2012 819 7.29 5.12 69.9 32.2 1189
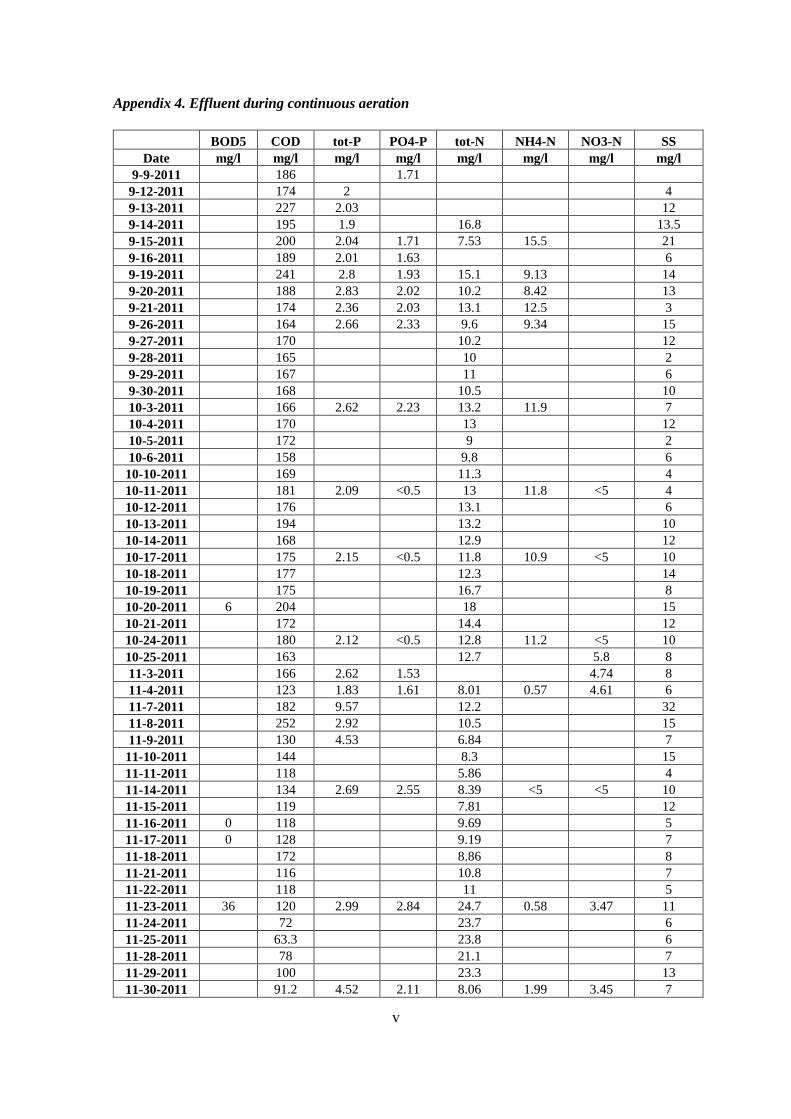
v
Appendix 4. Effluent during continuous aeration
BOD5 COD tot-P PO4-P tot-N NH4-N NO3-N SS
Date mg/l mg/l mg/l mg/l mg/l mg/l mg/l mg/l
9-9-2011 186 1.71
9-12-2011 174 2 4
9-13-2011 227 2.03 12
9-14-2011 195 1.9 16.8 13.5
9-15-2011 200 2.04 1.71 7.53 15.5 21
9-16-2011 189 2.01 1.63 6
9-19-2011 241 2.8 1.93 15.1 9.13 14
9-20-2011 188 2.83 2.02 10.2 8.42 13
9-21-2011 174 2.36 2.03 13.1 12.5 3
9-26-2011 164 2.66 2.33 9.6 9.34 15
9-27-2011 170 10.2 12
9-28-2011 165 10 2
9-29-2011 167 11 6
9-30-2011 168 10.5 10
10-3-2011 166 2.62 2.23 13.2 11.9 7
10-4-2011 170 13 12
10-5-2011 172 9 2
10-6-2011 158 9.8 6
10-10-2011 169 11.3 4
10-11-2011 181 2.09 <0.5 13 11.8 <5 4
10-12-2011 176 13.1 6
10-13-2011 194 13.2 10
10-14-2011 168 12.9 12
10-17-2011 175 2.15 <0.5 11.8 10.9 <5 10
10-18-2011 177 12.3 14
10-19-2011 175 16.7 8
10-20-2011 6 204 18 15
10-21-2011 172 14.4 12
10-24-2011 180 2.12 <0.5 12.8 11.2 <5 10
10-25-2011 163 12.7 5.8 8
11-3-2011 166 2.62 1.53 4.74 8
11-4-2011 123 1.83 1.61 8.01 0.57 4.61 6
11-7-2011 182 9.57 12.2 32
11-8-2011 252 2.92 10.5 15
11-9-2011 130 4.53 6.84 7
11-10-2011 144 8.3 15
11-11-2011 118 5.86 4
11-14-2011 134 2.69 2.55 8.39 <5 <5 10
11-15-2011 119 7.81 12
11-16-2011 0 118 9.69 5
11-17-2011 0 128 9.19 7
11-18-2011 172 8.86 8
11-21-2011 116 10.8 7
11-22-2011 118 11 5
11-23-2011 36 120 2.99 2.84 24.7 0.58 3.47 11
11-24-2011 72 23.7 6
11-25-2011 63.3 23.8 6
11-28-2011 78 21.1 7
11-29-2011 100 23.3 13
11-30-2011 91.2 4.52 2.11 8.06 1.99 3.45 7
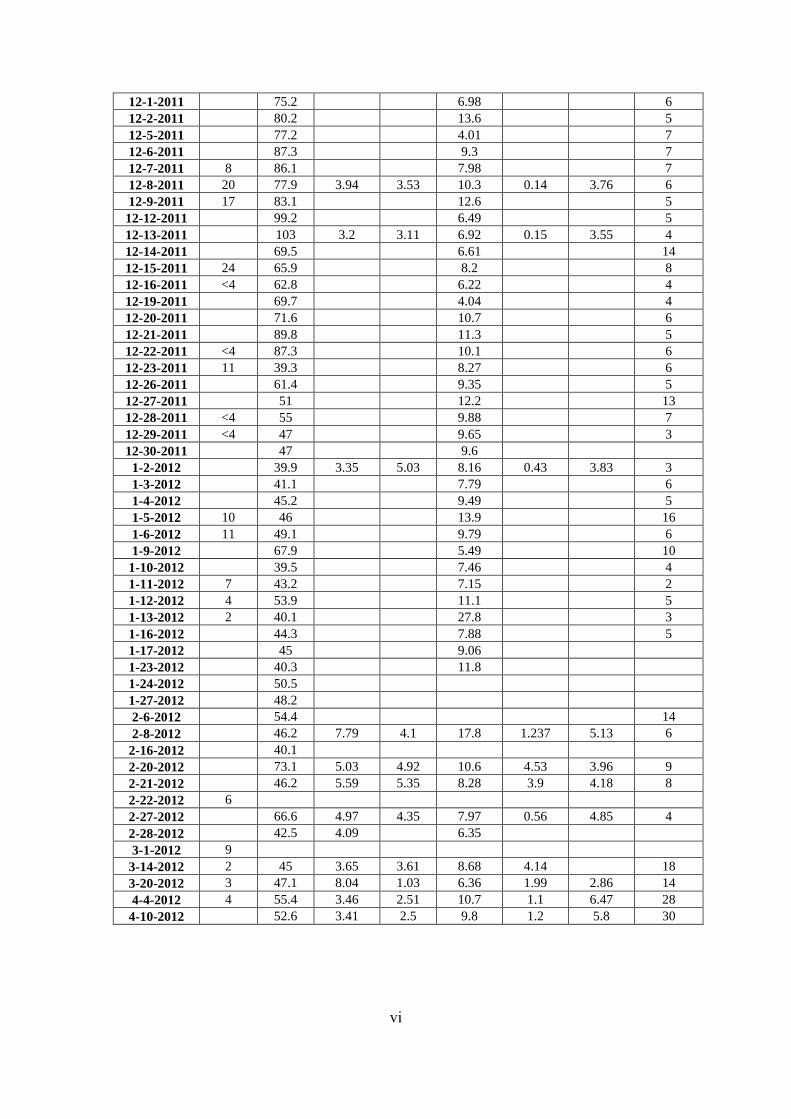
vi
12-1-2011 75.2 6.98 6
12-2-2011 80.2 13.6 5
12-5-2011 77.2 4.01 7
12-6-2011 87.3 9.3 7
12-7-2011 8 86.1 7.98 7
12-8-2011 20 77.9 3.94 3.53 10.3 0.14 3.76 6
12-9-2011 17 83.1 12.6 5
12-12-2011 99.2 6.49 5
12-13-2011 103 3.2 3.11 6.92 0.15 3.55 4
12-14-2011 69.5 6.61 14
12-15-2011 24 65.9 8.2 8
12-16-2011 <4 62.8 6.22 4
12-19-2011 69.7 4.04 4
12-20-2011 71.6 10.7 6
12-21-2011 89.8 11.3 5
12-22-2011 <4 87.3 10.1 6
12-23-2011 11 39.3 8.27 6
12-26-2011 61.4 9.35 5
12-27-2011 51 12.2 13
12-28-2011 <4 55 9.88 7
12-29-2011 <4 47 9.65 3
12-30-2011 47 9.6
1-2-2012 39.9 3.35 5.03 8.16 0.43 3.83 3
1-3-2012 41.1 7.79 6
1-4-2012 45.2 9.49 5
1-5-2012 10 46 13.9 16
1-6-2012 11 49.1 9.79 6
1-9-2012 67.9 5.49 10
1-10-2012 39.5 7.46 4
1-11-2012 7 43.2 7.15 2
1-12-2012 4 53.9 11.1 5
1-13-2012 2 40.1 27.8 3
1-16-2012 44.3 7.88 5
1-17-2012 45 9.06
1-23-2012 40.3 11.8
1-24-2012 50.5
1-27-2012 48.2
2-6-2012 54.4 14
2-8-2012 46.2 7.79 4.1 17.8 1.237 5.13 6
2-16-2012 40.1
2-20-2012 73.1 5.03 4.92 10.6 4.53 3.96 9
2-21-2012 46.2 5.59 5.35 8.28 3.9 4.18 8
2-22-2012 6
2-27-2012 66.6 4.97 4.35 7.97 0.56 4.85 4
2-28-2012 42.5 4.09 6.35
3-1-2012 9
3-14-2012 2 45 3.65 3.61 8.68 4.14 18
3-20-2012 3 47.1 8.04 1.03 6.36 1.99 2.86 14
4-4-2012 4 55.4 3.46 2.51 10.7 1.1 6.47 28
4-10-2012 52.6 3.41 2.5 9.8 1.2 5.8 30
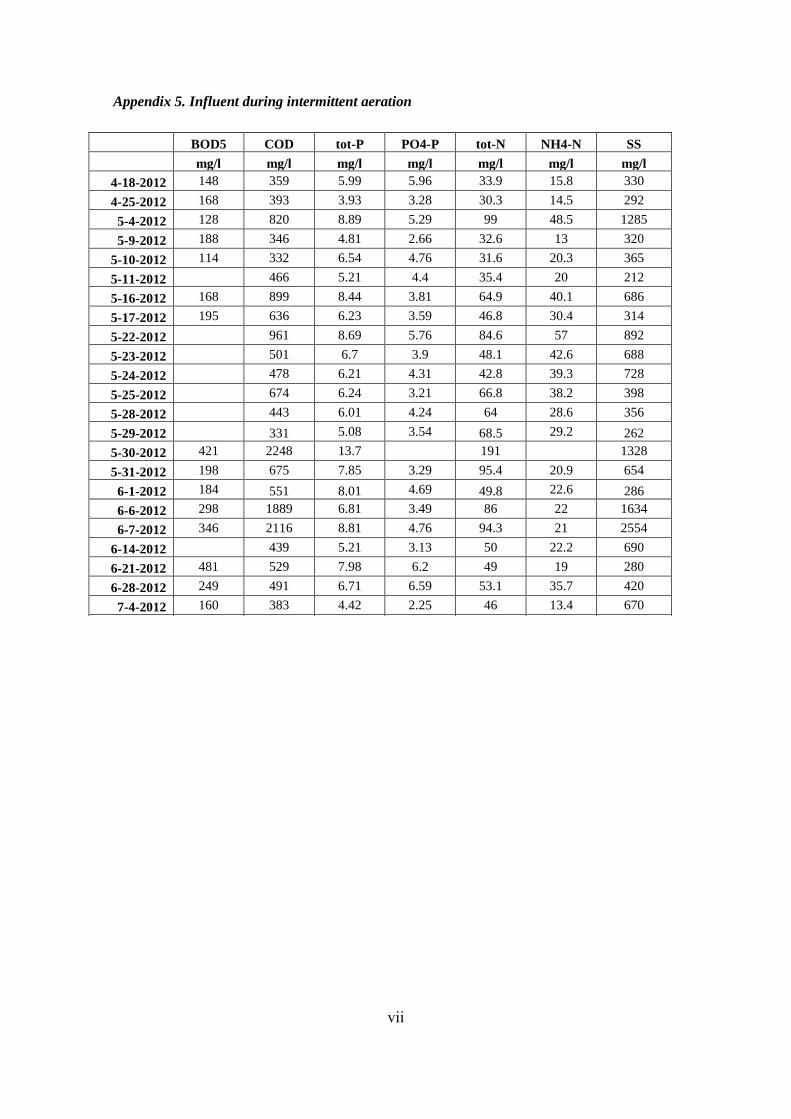
vii
Appendix 5. Influent during intermittent aeration
BOD5 COD tot-P PO4-P tot-N NH4-N SS
mg/l mg/l mg/l mg/l mg/l mg/l mg/l
4-18-2012 148 359 5.99 5.96 33.9 15.8 330
4-25-2012 168 393 3.93 3.28 30.3 14.5 292
5-4-2012 128 820 8.89 5.29 99 48.5 1285
5-9-2012 188 346 4.81 2.66 32.6 13 320
5-10-2012 114 332 6.54 4.76 31.6 20.3 365
5-11-2012 466 5.21 4.4 35.4 20 212
5-16-2012 168 899 8.44 3.81 64.9 40.1 686
5-17-2012 195 636 6.23 3.59 46.8 30.4 314
5-22-2012 961 8.69 5.76 84.6 57 892
5-23-2012 501 6.7 3.9 48.1 42.6 688
5-24-2012 478 6.21 4.31 42.8 39.3 728
5-25-2012 674 6.24 3.21 66.8 38.2 398
5-28-2012 443 6.01 4.24 64 28.6 356
5-29-2012 331 5.08 3.54 68.5 29.2 262
5-30-2012 421 2248 13.7 191 1328
5-31-2012 198 675 7.85 3.29 95.4 20.9 654
6-1-2012 184 551 8.01 4.69 49.8 22.6 286
6-6-2012 298 1889 6.81 3.49 86 22 1634
6-7-2012 346 2116 8.81 4.76 94.3 21 2554
6-14-2012 439 5.21 3.13 50 22.2 690
6-21-2012 481 529 7.98 6.2 49 19 280
6-28-2012 249 491 6.71 6.59 53.1 35.7 420
7-4-2012 160 383 4.42 2.25 46 13.4 670
7-12-2012 421 8.3 6.99 45.3 26.2 390
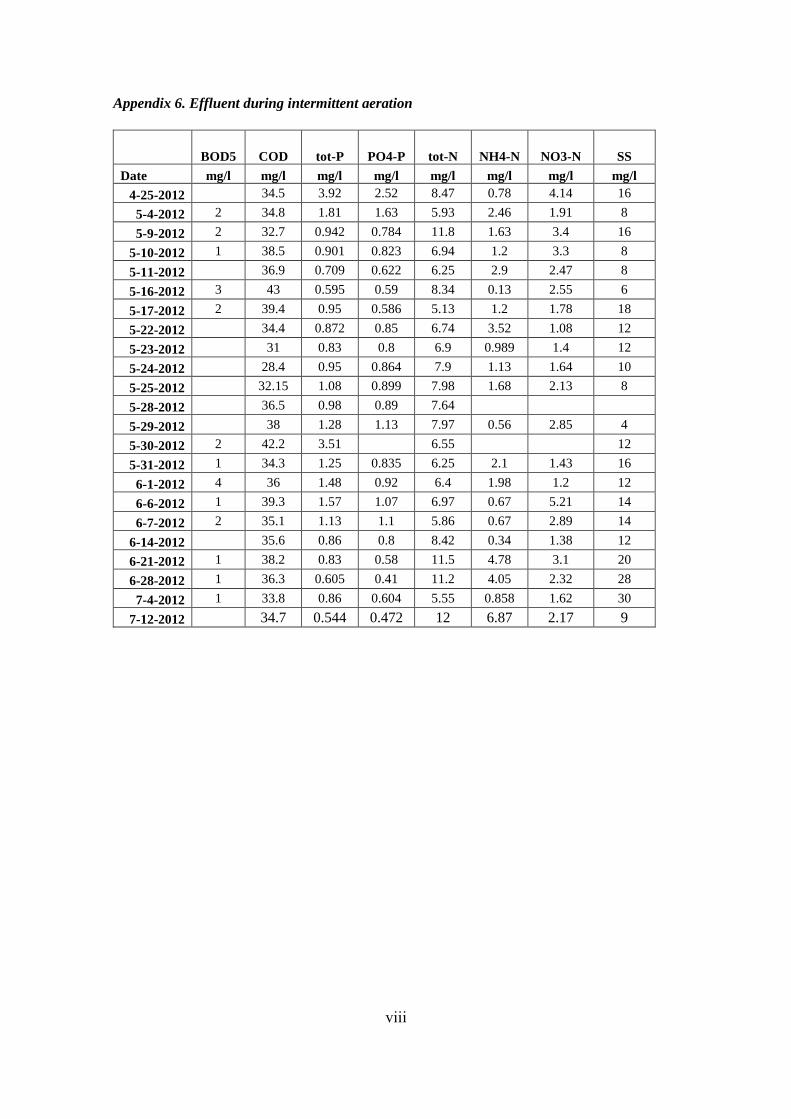
viii
Appendix 6. Effluent during intermittent aeration
BOD5 COD tot-P PO4-P tot-N NH4-N NO3-N SS
Date mg/l mg/l mg/l mg/l mg/l mg/l mg/l mg/l
4-25-2012 34.5 3.92 2.52 8.47 0.78 4.14 16
5-4-2012 2 34.8 1.81 1.63 5.93 2.46 1.91 8
5-9-2012 2 32.7 0.942 0.784 11.8 1.63 3.4 16
5-10-2012 1 38.5 0.901 0.823 6.94 1.2 3.3 8
5-11-2012 36.9 0.709 0.622 6.25 2.9 2.47 8
5-16-2012 3 43 0.595 0.59 8.34 0.13 2.55 6
5-17-2012 2 39.4 0.95 0.586 5.13 1.2 1.78 18
5-22-2012 34.4 0.872 0.85 6.74 3.52 1.08 12
5-23-2012 31 0.83 0.8 6.9 0.989 1.4 12
5-24-2012 28.4 0.95 0.864 7.9 1.13 1.64 10
5-25-2012 32.15 1.08 0.899 7.98 1.68 2.13 8
5-28-2012 36.5 0.98 0.89 7.64
5-29-2012 38 1.28 1.13 7.97 0.56 2.85 4
5-30-2012 2 42.2 3.51 6.55 12
5-31-2012 1 34.3 1.25 0.835 6.25 2.1 1.43 16
6-1-2012 4 36 1.48 0.92 6.4 1.98 1.2 12
6-6-2012 1 39.3 1.57 1.07 6.97 0.67 5.21 14
6-7-2012 2 35.1 1.13 1.1 5.86 0.67 2.89 14
6-14-2012 35.6 0.86 0.8 8.42 0.34 1.38 12
6-21-2012 1 38.2 0.83 0.58 11.5 4.78 3.1 20
6-28-2012 1 36.3 0.605 0.41 11.2 4.05 2.32 28
7-4-2012 1 33.8 0.86 0.604 5.55 0.858 1.62 30
7-12-2012 34.7 0.544 0.472 12 6.87 2.17 9