Embed Size (px)
Citation preview
____________________________________________________________________________________ Excerpt from PNSQC 2012 Proceedings PNSQC.ORG Copies may not be made or distributed for commercial use Page 1
Reduce QA Cost by Improving Productivity & Test Optimization
Author(s)
Rajesh Kumar ([email protected]) and Ajay K Chhokra ([email protected])
UnitedHealth Group Information Systems, Unitech Cyber Park, Tower C ,Floors 1-4
Haryana, 122001, India
Abstract
“Reducing QA Cost” is the buzzword in IT industry. Testing Costs can be reduced by two ways – by using Test Optimization techniques, and by increasing productivity. Test Optimization focuses on efficient Test methodologies, and reducing redundancy and waste, by developing and executing optimized Test suite. Test productivity focuses on increasing the productivity of the Testing process. In this paper, we are doing a deep dive on Testing Optimization & Productivity Improvement techniques and their impact on QA cost reduction. To reduce QA Cost, an organization needs to establish the QA cost baseline and processes to capture and track the QA cost on regular basis. Organizations also should establish the goals to reduce the same on a year to year basis. In this paper, we have shown effective methods which help the organization to reduce QA costs by implementing various Test Optimization techniques and Productivity Improvement techniques.
Biography
Ajay K Chhokra - Ajay is part of UnitedHealth Group, India IT Leadership Team and is responsible for driving Testing Competency and for establishing Global Testing Center of Excellence in Global Sourcing and Delivery center. His initiatives around Delivery Excellence, Maturity Assessment, Test Governance and Test Regression Automation of Legacy Systems have brought about productivity, predictability and Quality improvements in UnitedHealth Group IT deliveries. Ajay has been a Key-note speaker and presenter in many national and international Testing Forums. He has authored a book titled "Excellence in Software Quality". During his rich and diverse professional career span of 25 years, he has gained vast experience in Quality Assurance, Process Improvements and Testing across leading product and service companies of the IT Industry.
Rajesh Kumar - is working as a Project Manager in United Health Group IT and is responsible for Project delivery of Web Portals department, driving Structured Quality Improvement Plan, and Reducing QA cost initiatives. He has extensive experience in Web Portals Testing, Regression Optimization, Test Automation, Test Optimization techniques implementations include OATS, RBT, DTT etc, Test Automation of Mobile and Cross Browser Testing. His initiatives around reducing QA cost, Improving Productivity, Resource Optimization, and Test Optimization techniques implementations has helped a lot for Quality improvements in UnitedHealth Group IT deliveries.
____________________________________________________________________________________ Excerpt from PNSQC 2012 Proceedings PNSQC.ORG Copies may not be made or distributed for commercial use Page 2
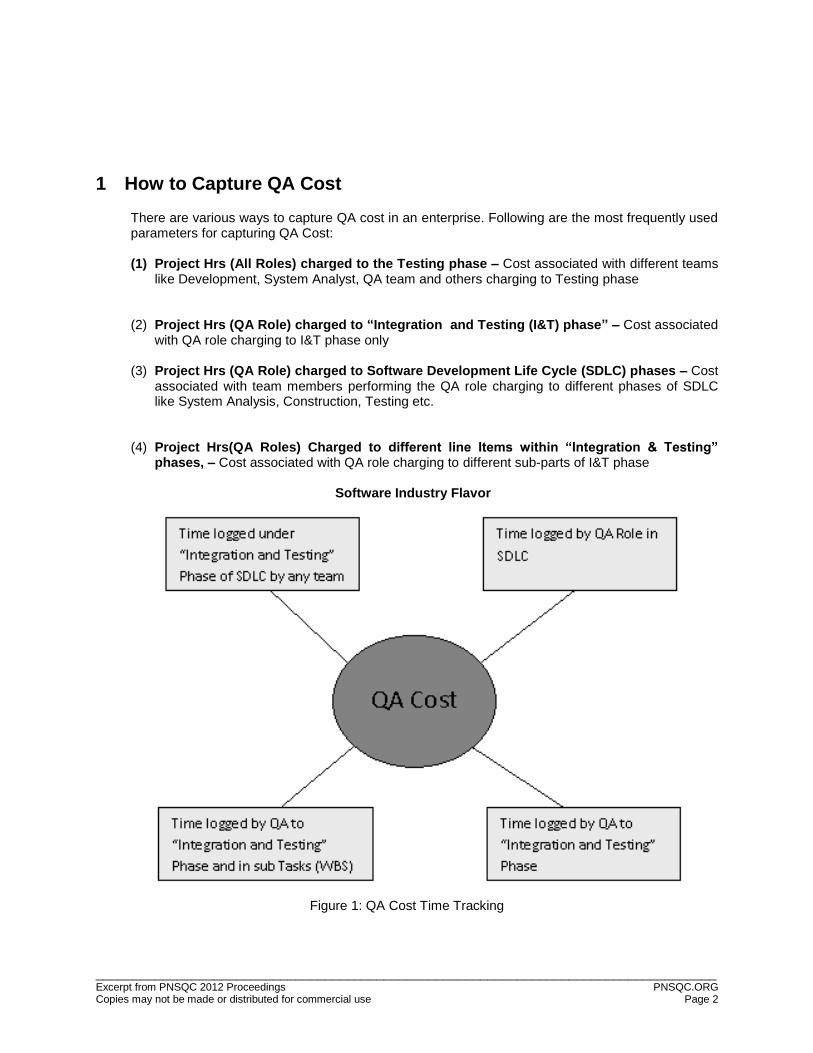
1 How to Capture QA Cost
There are various ways to capture QA cost in an enterprise. Following are the most frequently used parameters for capturing QA Cost: (1) Project Hrs (All Roles) charged to the Testing phase – Cost associated with different teams
like Development, System Analyst, QA team and others charging to Testing phase
(2) Project Hrs (QA Role) charged to “Integration and Testing (I&T) phase” – Cost associated
with QA role charging to I&T phase only
(3) Project Hrs (QA Role) charged to Software Development Life Cycle (SDLC) phases – Cost associated with team members performing the QA role charging to different phases of SDLC like System Analysis, Construction, Testing etc.
(4) Project Hrs(QA Roles) Charged to different line Items within “Integration & Testing”
phases, – Cost associated with QA role charging to different sub-parts of I&T phase
Software Industry Flavor
Figure 1: QA Cost Time Tracking
____________________________________________________________________________________ Excerpt from PNSQC 2012 Proceedings PNSQC.ORG Copies may not be made or distributed for commercial use Page 3
2 Tracking QA Cost
To improve anything, one needs to establish the baseline. Similarly, to track QA Cost, one needs to establish the baseline and then publish the QA cost on regular intervals (could be monthly or quarterly). Tracking QA cost on a regular basis is a tedious task; one needs to capture all the charges (hrs.) information in different phases of SDLC.
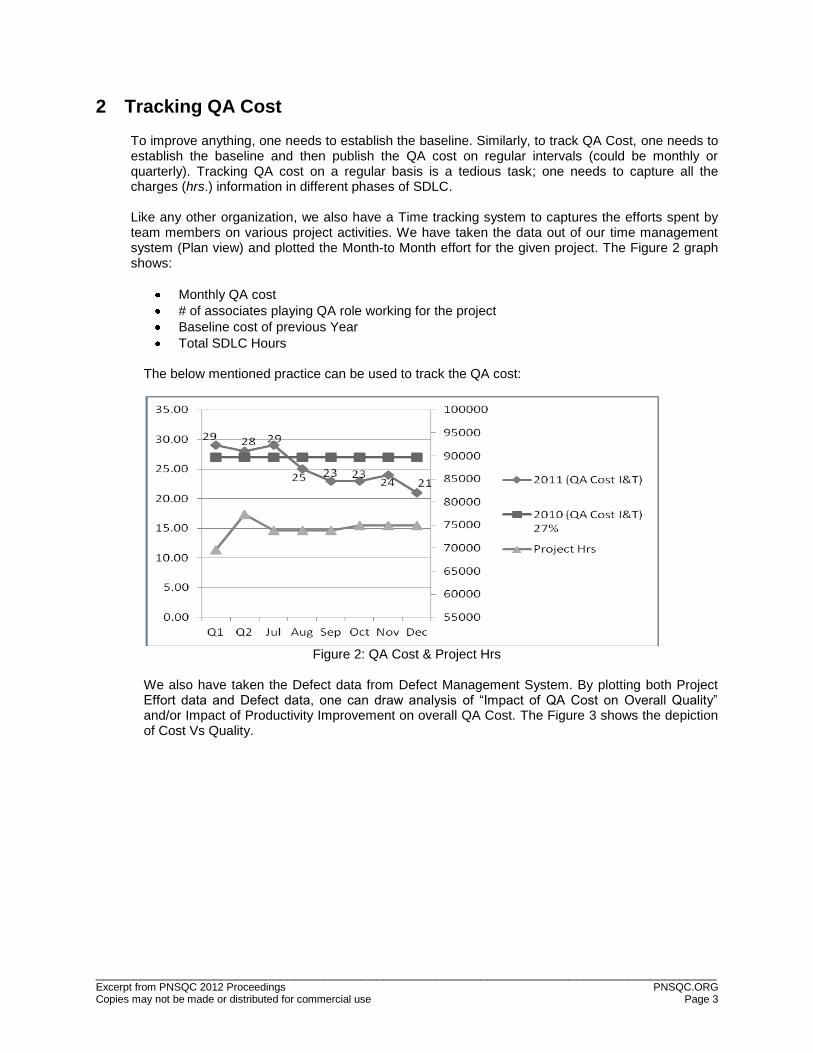
Like any other organization, we also have a Time tracking system to captures the efforts spent by team members on various project activities. We have taken the data out of our time management system (Plan view) and plotted the Month-to Month effort for the given project. The Figure 2 graph shows:
Monthly QA cost
# of associates playing QA role working for the project
Baseline cost of previous Year
Total SDLC Hours
The below mentioned practice can be used to track the QA cost:
Figure 2: QA Cost & Project Hrs
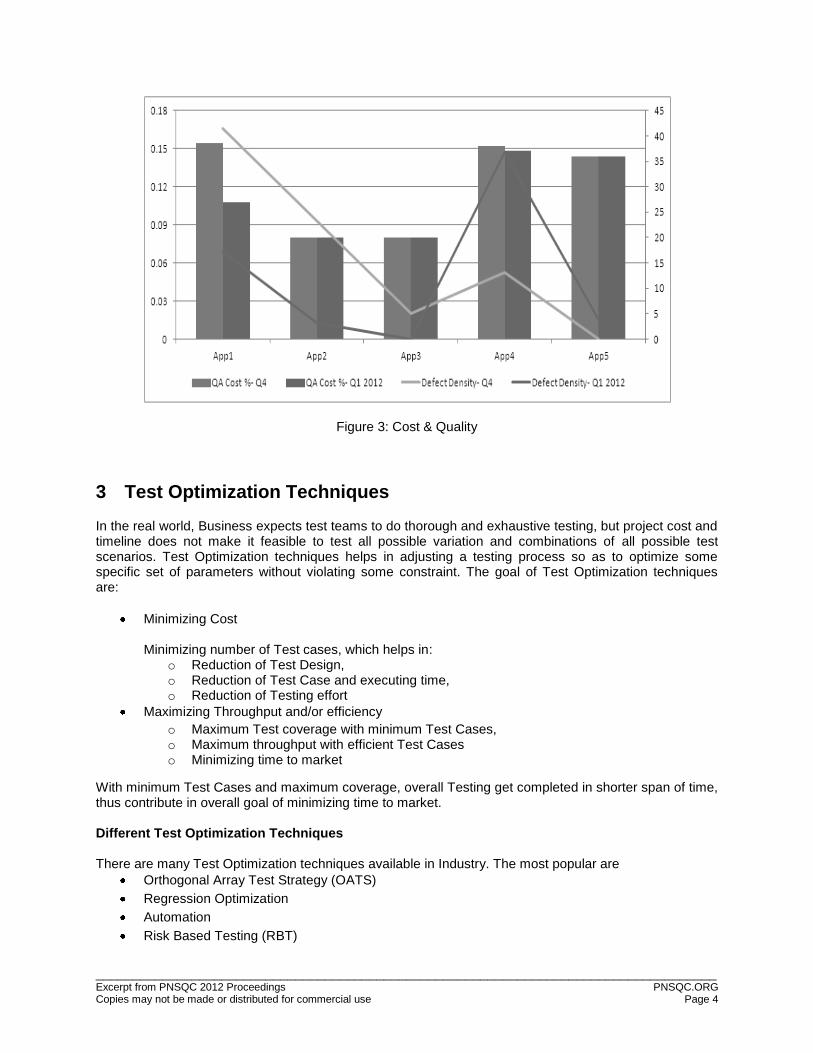
We also have taken the Defect data from Defect Management System. By plotting both Project Effort data and Defect data, one can draw analysis of “Impact of QA Cost on Overall Quality” and/or Impact of Productivity Improvement on overall QA Cost. The Figure 3 shows the depiction of Cost Vs Quality.
____________________________________________________________________________________ Excerpt from PNSQC 2012 Proceedings PNSQC.ORG Copies may not be made or distributed for commercial use Page 4
Figure 3: Cost & Quality
3 Test Optimization Techniques
In the real world, Business expects test teams to do thorough and exhaustive testing, but project cost and timeline does not make it feasible to test all possible variation and combinations of all possible test scenarios. Test Optimization techniques helps in adjusting a testing process so as to optimize some specific set of parameters without violating some constraint. The goal of Test Optimization techniques are:
Minimizing Cost
Minimizing number of Test cases, which helps in: o Reduction of Test Design, o Reduction of Test Case and executing time, o Reduction of Testing effort
Maximizing Throughput and/or efficiency
o Maximum Test coverage with minimum Test Cases, o Maximum throughput with efficient Test Cases o Minimizing time to market
With minimum Test Cases and maximum coverage, overall Testing get completed in shorter span of time, thus contribute in overall goal of minimizing time to market.
Different Test Optimization Techniques There are many Test Optimization techniques available in Industry. The most popular are
Orthogonal Array Test Strategy (OATS)
Regression Optimization
Automation
Risk Based Testing (RBT)
____________________________________________________________________________________ Excerpt from PNSQC 2012 Proceedings PNSQC.ORG Copies may not be made or distributed for commercial use Page 5
3.1 OATS
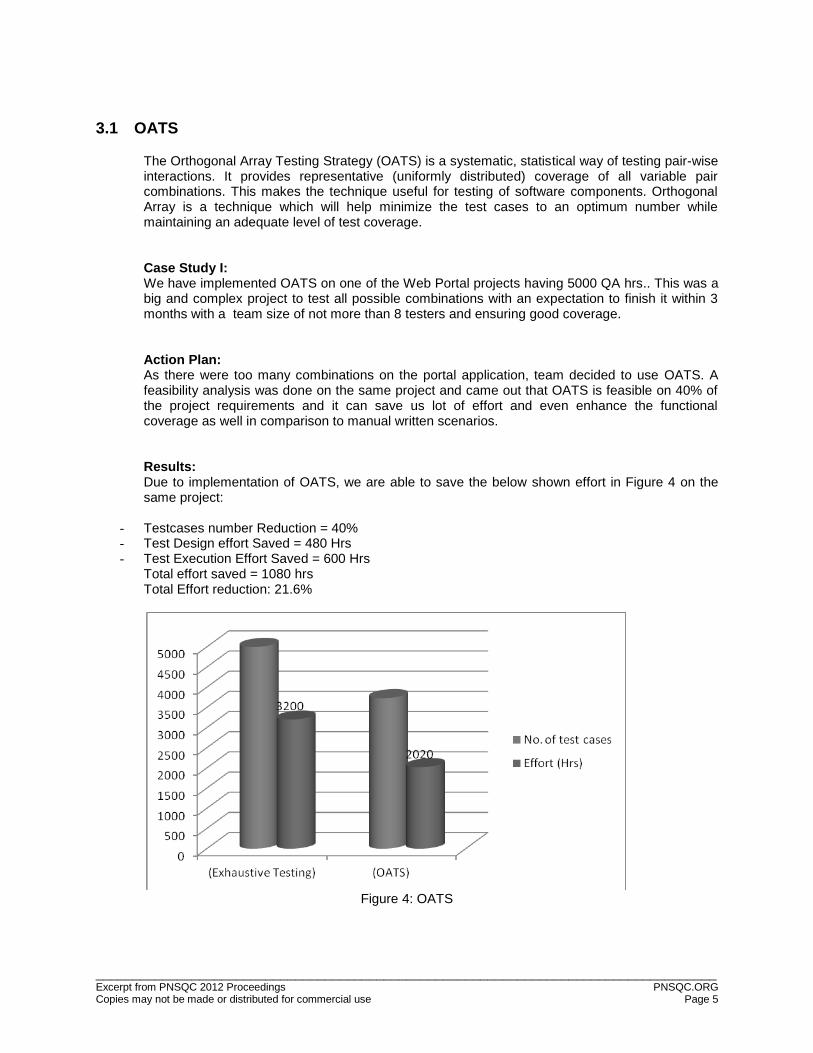
The Orthogonal Array Testing Strategy (OATS) is a systematic, statistical way of testing pair-wise interactions. It provides representative (uniformly distributed) coverage of all variable pair combinations. This makes the technique useful for testing of software components. Orthogonal Array is a technique which will help minimize the test cases to an optimum number while maintaining an adequate level of test coverage. Case Study I: We have implemented OATS on one of the Web Portal projects having 5000 QA hrs.. This was a big and complex project to test all possible combinations with an expectation to finish it within 3 months with a team size of not more than 8 testers and ensuring good coverage. Action Plan: As there were too many combinations on the portal application, team decided to use OATS. A feasibility analysis was done on the same project and came out that OATS is feasible on 40% of the project requirements and it can save us lot of effort and even enhance the functional coverage as well in comparison to manual written scenarios. Results: Due to implementation of OATS, we are able to save the below shown effort in Figure 4 on the same project:
- Testcases number Reduction = 40% - Test Design effort Saved = 480 Hrs - Test Execution Effort Saved = 600 Hrs
Total effort saved = 1080 hrs Total Effort reduction: 21.6%
Figure 4: OATS
____________________________________________________________________________________ Excerpt from PNSQC 2012 Proceedings PNSQC.ORG Copies may not be made or distributed for commercial use Page 6
3.2 Regression Optimization
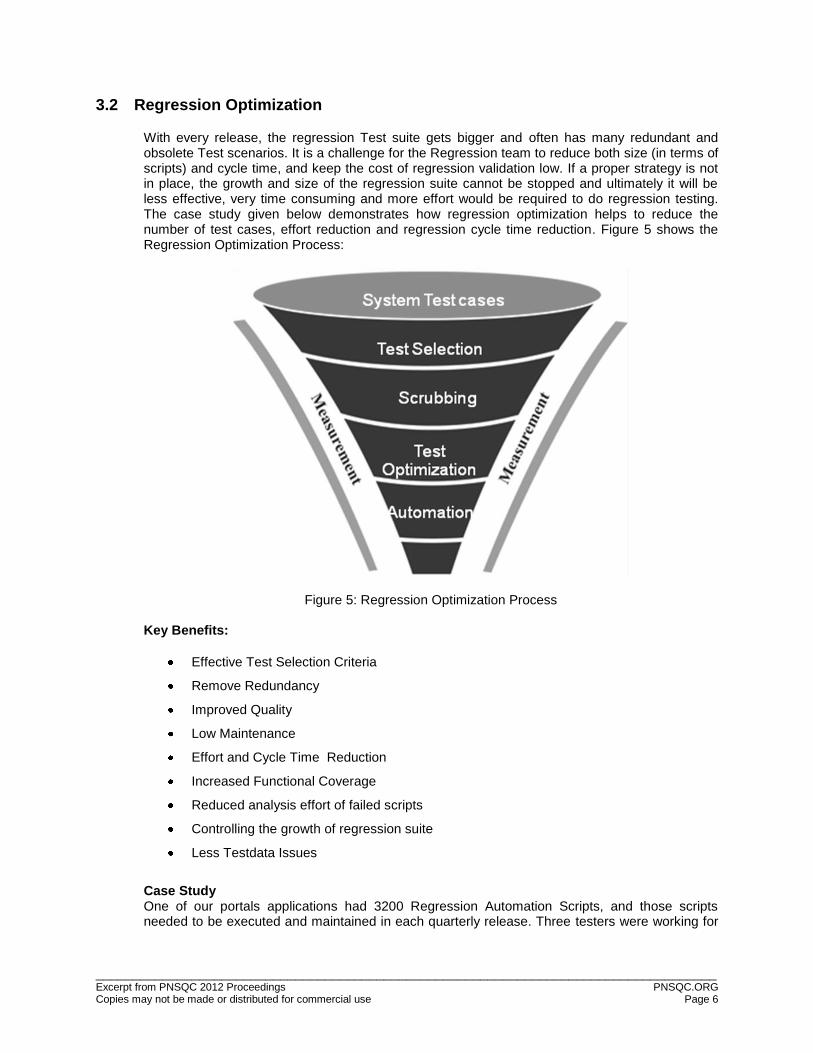
With every release, the regression Test suite gets bigger and often has many redundant and obsolete Test scenarios. It is a challenge for the Regression team to reduce both size (in terms of scripts) and cycle time, and keep the cost of regression validation low. If a proper strategy is not in place, the growth and size of the regression suite cannot be stopped and ultimately it will be less effective, very time consuming and more effort would be required to do regression testing. The case study given below demonstrates how regression optimization helps to reduce the number of test cases, effort reduction and regression cycle time reduction. Figure 5 shows the Regression Optimization Process:
Figure 5: Regression Optimization Process Key Benefits:
Effective Test Selection Criteria
Remove Redundancy
Improved Quality
Low Maintenance
Effort and Cycle Time Reduction
Increased Functional Coverage
Reduced analysis effort of failed scripts
Controlling the growth of regression suite
Less Testdata Issues
Case Study One of our portals applications had 3200 Regression Automation Scripts, and those scripts needed to be executed and maintained in each quarterly release. Three testers were working for
____________________________________________________________________________________ Excerpt from PNSQC 2012 Proceedings PNSQC.ORG Copies may not be made or distributed for commercial use Page 7
2 weeks to execute one regression cycle i.e. 240 Hrs. Two cycles need to run for each release, for a total of 480 hours each release.. Goals:
Reduce the regression cycle time by 50%
Reduce QA cost by 50%
Increase the functional Coverage
Remove the redundant scripts
Run More number of regression cycles in one release
Migration of Regression suite from QTP 6.5 to QTP 9.0 Actions Taken:
Decided to Re-design the regression suite in two Phases
Framework Architecture changed, data driven framework implemented
All the scripts analyzed and merged the same modules scripts with each other.
Brainstorm sessions arranged to analyze the existing scripts and created new testcases.
Number of scripts steps increased from 6 steps to 20 steps.
Removed the redundant scripts
New functionalities added to the scripts and new Functions to the framework
Effective Reporting module implemented.
Virtual Environment is used for test execution
Scripts Migrated from QTP 6.5 to QTP 9.0 Results:
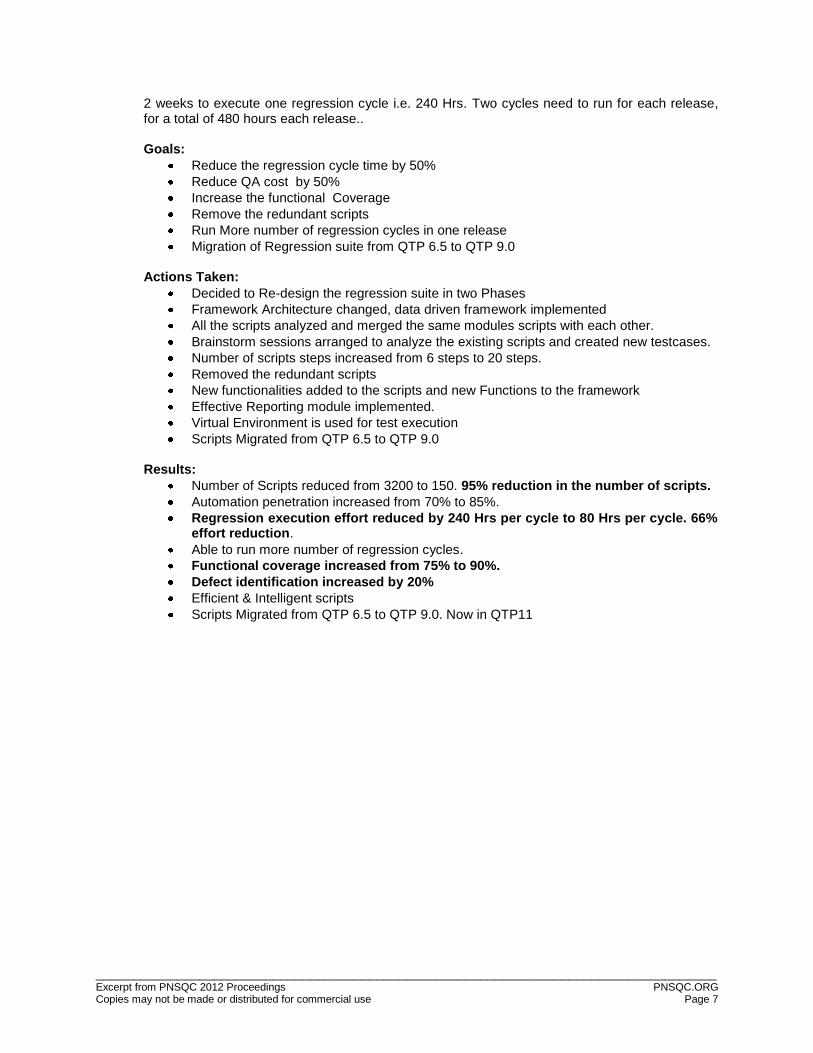
Number of Scripts reduced from 3200 to 150. 95% reduction in the number of scripts.
Automation penetration increased from 70% to 85%.
Regression execution effort reduced by 240 Hrs per cycle to 80 Hrs per cycle. 66% effort reduction.
Able to run more number of regression cycles.
Functional coverage increased from 75% to 90%.
Defect identification increased by 20%
Efficient & Intelligent scripts
Scripts Migrated from QTP 6.5 to QTP 9.0. Now in QTP11
____________________________________________________________________________________ Excerpt from PNSQC 2012 Proceedings PNSQC.ORG Copies may not be made or distributed for commercial use Page 8
Figure 6: Regression Optimization Results
3.3 Automation
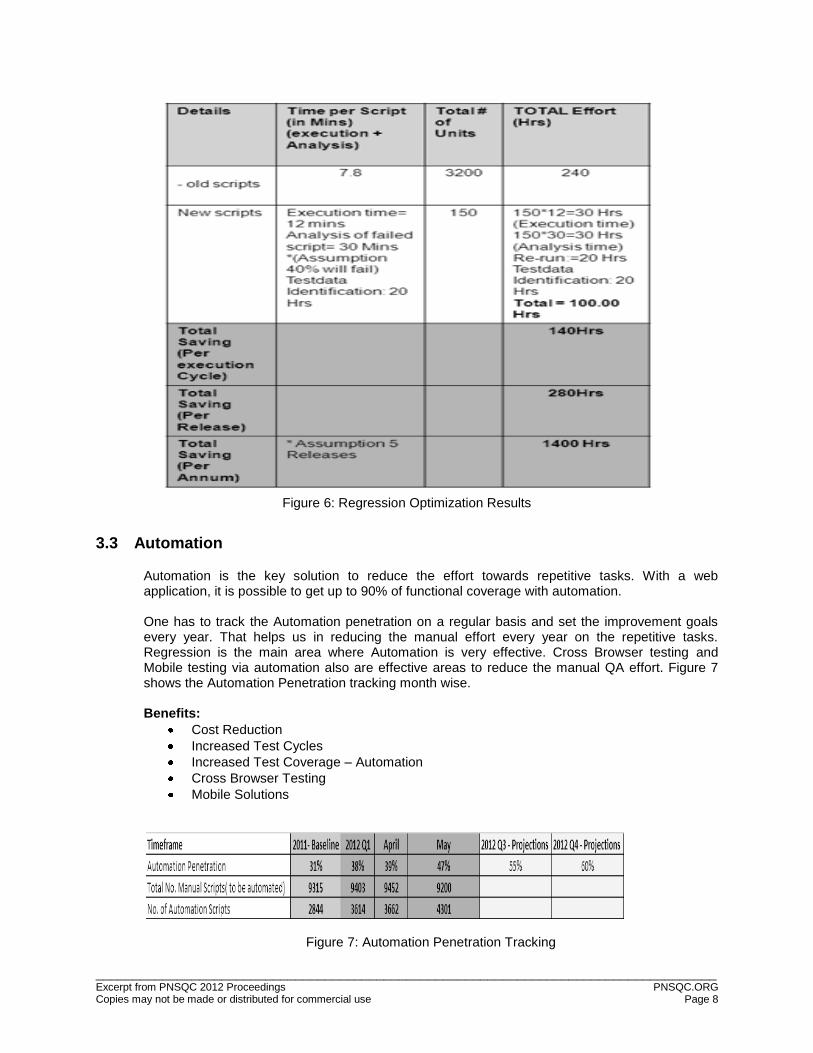
Automation is the key solution to reduce the effort towards repetitive tasks. With a web application, it is possible to get up to 90% of functional coverage with automation. One has to track the Automation penetration on a regular basis and set the improvement goals every year. That helps us in reducing the manual effort every year on the repetitive tasks. Regression is the main area where Automation is very effective. Cross Browser testing and Mobile testing via automation also are effective areas to reduce the manual QA effort. Figure 7 shows the Automation Penetration tracking month wise. Benefits:
Cost Reduction
Increased Test Cycles
Increased Test Coverage – Automation
Cross Browser Testing
Mobile Solutions
Figure 7: Automation Penetration Tracking
____________________________________________________________________________________ Excerpt from PNSQC 2012 Proceedings PNSQC.ORG Copies may not be made or distributed for commercial use Page 9
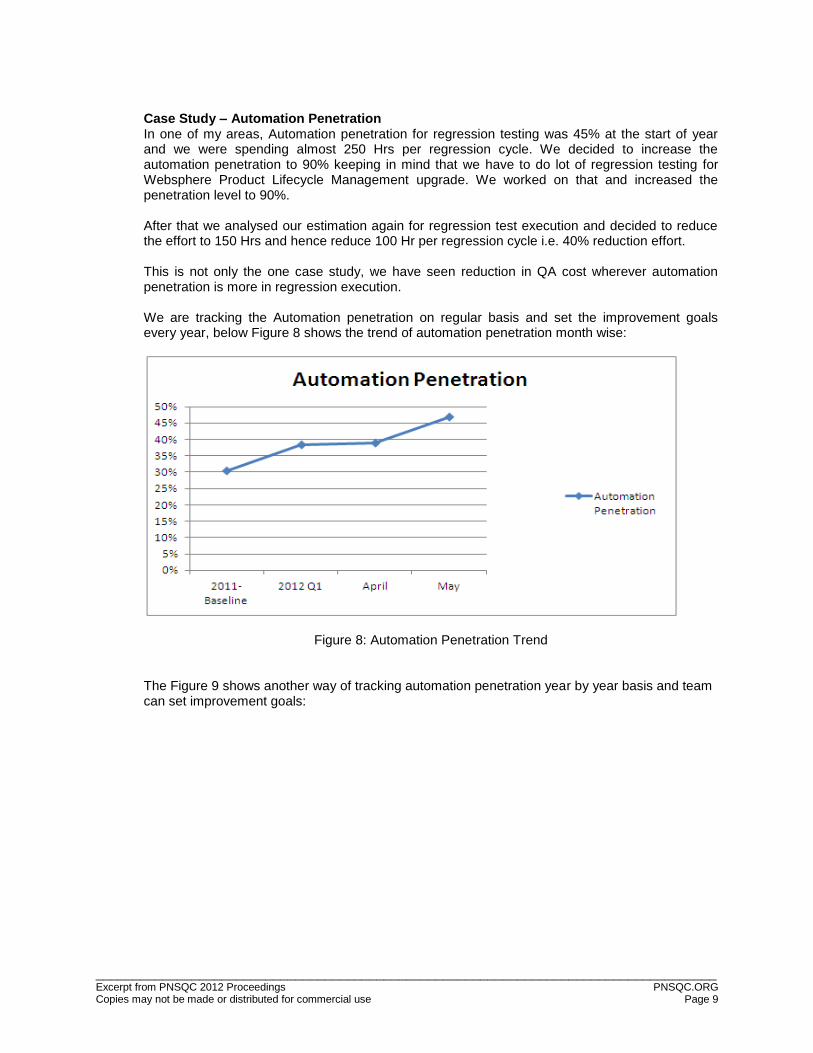
Case Study – Automation Penetration In one of my areas, Automation penetration for regression testing was 45% at the start of year and we were spending almost 250 Hrs per regression cycle. We decided to increase the automation penetration to 90% keeping in mind that we have to do lot of regression testing for Websphere Product Lifecycle Management upgrade. We worked on that and increased the penetration level to 90%. After that we analysed our estimation again for regression test execution and decided to reduce the effort to 150 Hrs and hence reduce 100 Hr per regression cycle i.e. 40% reduction effort. This is not only the one case study, we have seen reduction in QA cost wherever automation penetration is more in regression execution. We are tracking the Automation penetration on regular basis and set the improvement goals every year, below Figure 8 shows the trend of automation penetration month wise:
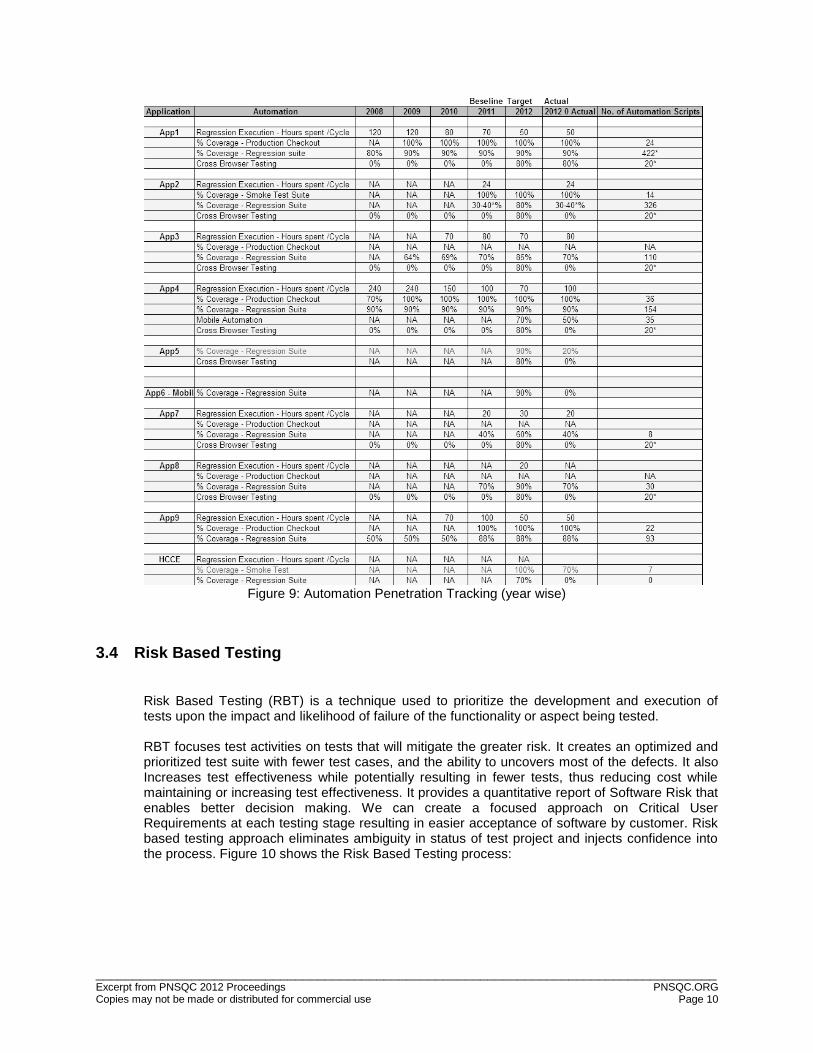
Figure 8: Automation Penetration Trend The Figure 9 shows another way of tracking automation penetration year by year basis and team can set improvement goals:
____________________________________________________________________________________ Excerpt from PNSQC 2012 Proceedings PNSQC.ORG Copies may not be made or distributed for commercial use Page 10
Figure 9: Automation Penetration Tracking (year wise)
3.4 Risk Based Testing
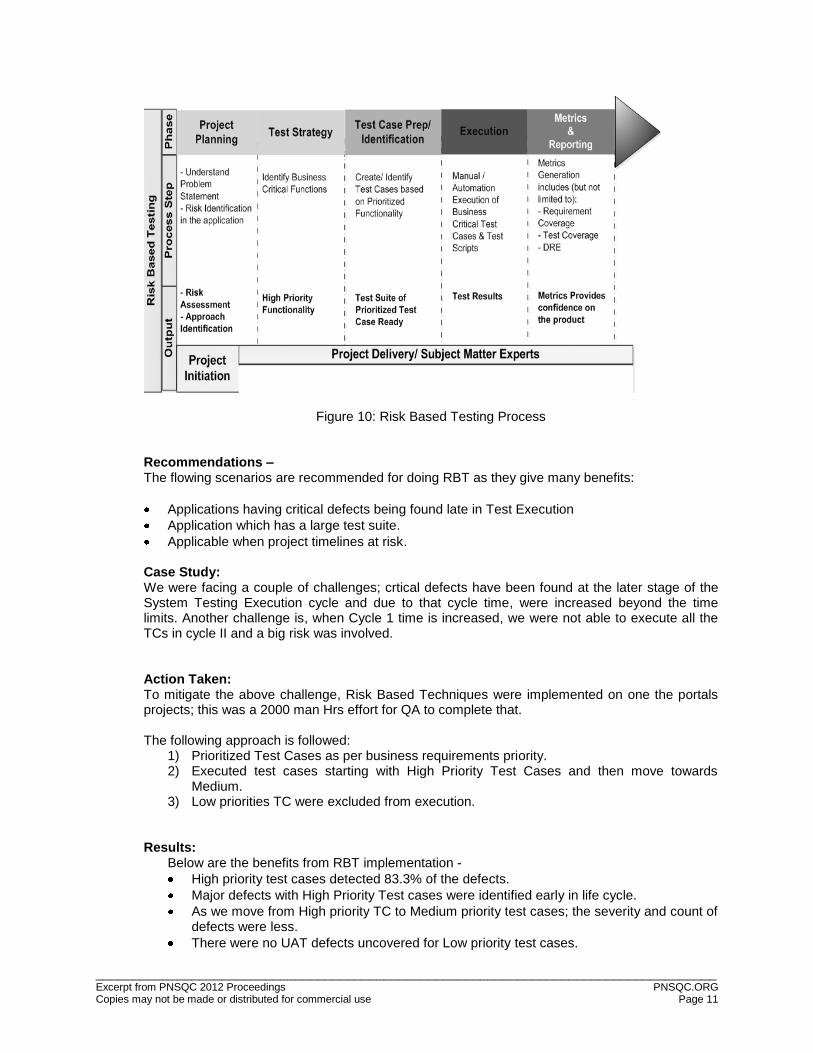
Risk Based Testing (RBT) is a technique used to prioritize the development and execution of tests upon the impact and likelihood of failure of the functionality or aspect being tested. RBT focuses test activities on tests that will mitigate the greater risk. It creates an optimized and prioritized test suite with fewer test cases, and the ability to uncovers most of the defects. It also Increases test effectiveness while potentially resulting in fewer tests, thus reducing cost while maintaining or increasing test effectiveness. It provides a quantitative report of Software Risk that enables better decision making. We can create a focused approach on Critical User Requirements at each testing stage resulting in easier acceptance of software by customer. Risk based testing approach eliminates ambiguity in status of test project and injects confidence into the process. Figure 10 shows the Risk Based Testing process:
____________________________________________________________________________________ Excerpt from PNSQC 2012 Proceedings PNSQC.ORG Copies may not be made or distributed for commercial use Page 11
Figure 10: Risk Based Testing Process Recommendations – The flowing scenarios are recommended for doing RBT as they give many benefits:
Applications having critical defects being found late in Test Execution
Application which has a large test suite.
Applicable when project timelines at risk. Case Study: We were facing a couple of challenges; crtical defects have been found at the later stage of the System Testing Execution cycle and due to that cycle time, were increased beyond the time limits. Another challenge is, when Cycle 1 time is increased, we were not able to execute all the TCs in cycle II and a big risk was involved. Action Taken: To mitigate the above challenge, Risk Based Techniques were implemented on one the portals projects; this was a 2000 man Hrs effort for QA to complete that. The following approach is followed:
1) Prioritized Test Cases as per business requirements priority. 2) Executed test cases starting with High Priority Test Cases and then move towards
Medium. 3) Low priorities TC were excluded from execution.
Results:
Below are the benefits from RBT implementation -
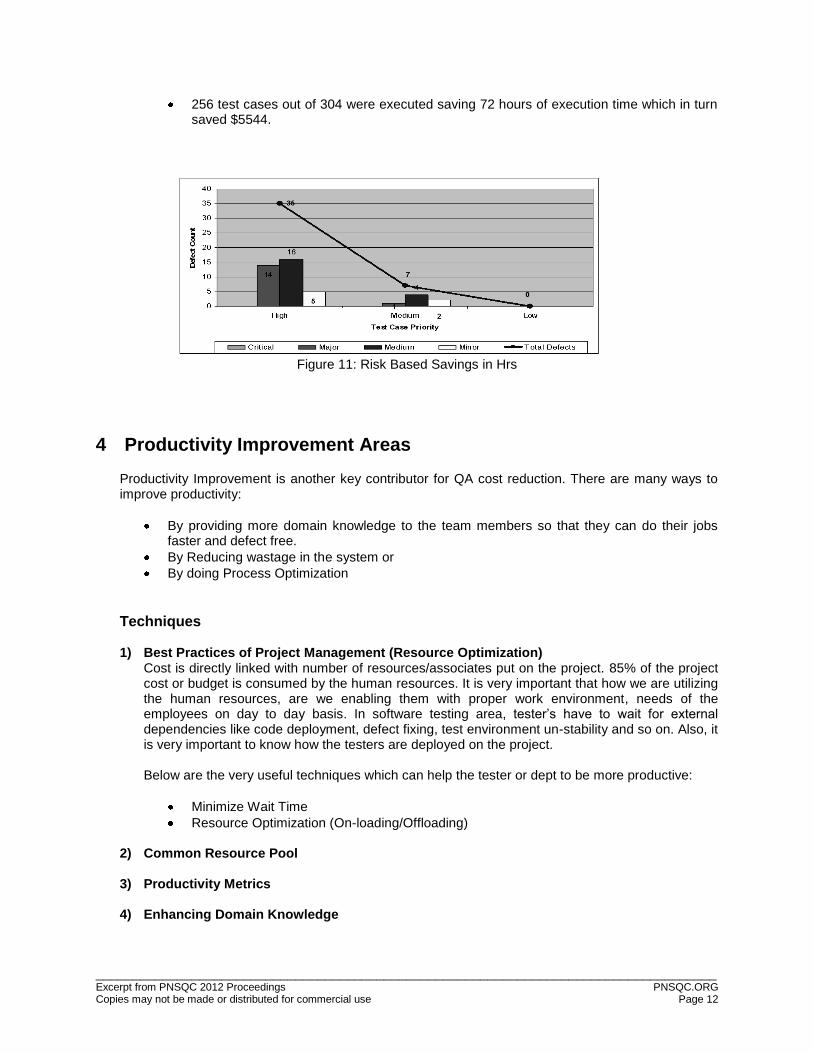
High priority test cases detected 83.3% of the defects.
Major defects with High Priority Test cases were identified early in life cycle.
As we move from High priority TC to Medium priority test cases; the severity and count of defects were less.
There were no UAT defects uncovered for Low priority test cases.
____________________________________________________________________________________ Excerpt from PNSQC 2012 Proceedings PNSQC.ORG Copies may not be made or distributed for commercial use Page 12
256 test cases out of 304 were executed saving 72 hours of execution time which in turn saved $5544.
Figure 11: Risk Based Savings in Hrs
4 Productivity Improvement Areas
Productivity Improvement is another key contributor for QA cost reduction. There are many ways to improve productivity:
By providing more domain knowledge to the team members so that they can do their jobs faster and defect free.
By Reducing wastage in the system or
By doing Process Optimization
Techniques
1) Best Practices of Project Management (Resource Optimization)
Cost is directly linked with number of resources/associates put on the project. 85% of the project cost or budget is consumed by the human resources. It is very important that how we are utilizing the human resources, are we enabling them with proper work environment, needs of the employees on day to day basis. In software testing area, tester’s have to wait for external dependencies like code deployment, defect fixing, test environment un-stability and so on. Also, it is very important to know how the testers are deployed on the project. Below are the very useful techniques which can help the tester or dept to be more productive:
Minimize Wait Time
Resource Optimization (On-loading/Offloading)
2) Common Resource Pool
3) Productivity Metrics
4) Enhancing Domain Knowledge
____________________________________________________________________________________ Excerpt from PNSQC 2012 Proceedings PNSQC.ORG Copies may not be made or distributed for commercial use Page 13
4.1 Best Practices of Project Management (Resource Optimization)
4.1.1 Minimizing Wait Time
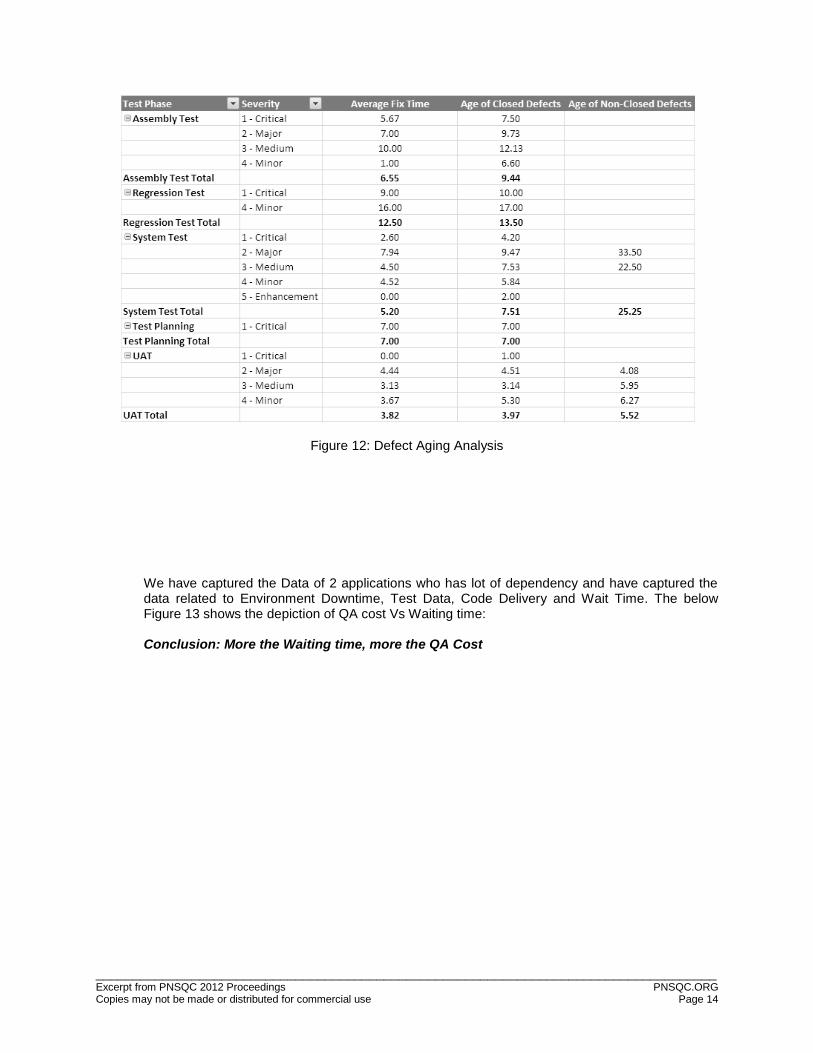
As a QA organization, we often deal with down time. QA have to wait on day to day basis for different external reasons such as waiting for new code for testing, defect fixing, issue resolution, requirements clarification, environment availability, database down, test data availability and feed from upstream applications, and so on. This list is endless and delays from any of the above puts lot of pressure to complete Test execution in allotted time. In real world, it is not possible to eliminate Wait Time totally, but by using few best practices this can be reduced substantially, thus helping in overall productivity. The main reason for QA downtimes are: Environment Unavailability: This is due to daily build deployments in regular hours when the whole team is working and it goes on for approx. 30 mins or more, sometime deployment fail, Code Merge issue, and so on. Also, scheduled downtimes of the back-end systems resulted in approx. 6-7% of waiting time for these activities. Incorrect or Unavailable Test data: Especially in the case of upstream applications, they have to depend on the test data on the downstream applications. They send their test data request on time but data is not delivered on time and, most important, test data is not setup properly or correctly. That resulted into more re-work to correct the data and increase the waiting time for the upstream applications. Incorrect test data leads to more defects and Dev/QA/SA teams to put more effort to triage the issue. Delayed Code Delivery: This is not new to IT Industry; in Waterfall or V model, most of the time code delivery is delayed and if it is on time, then code quality is very poor. Testers have to wait at least 3-4 days until code/application has stabilized for smoother testing. It has been observed that in the first week of major project code delivery, most of an application’s new major functionalities are not working and the tester ends up doing Smoke testing in the initial few days. Defect Management: This is another major area where testers have to wait for the resolution of the defects, and block them to do further testing. Most of the time critical defects are resolved in 48-72 hrs. Major defects can block a tester for a week and so on.
The Figure 12 shows the snapshot of defect aging analysis:
____________________________________________________________________________________ Excerpt from PNSQC 2012 Proceedings PNSQC.ORG Copies may not be made or distributed for commercial use Page 14
Figure 12: Defect Aging Analysis
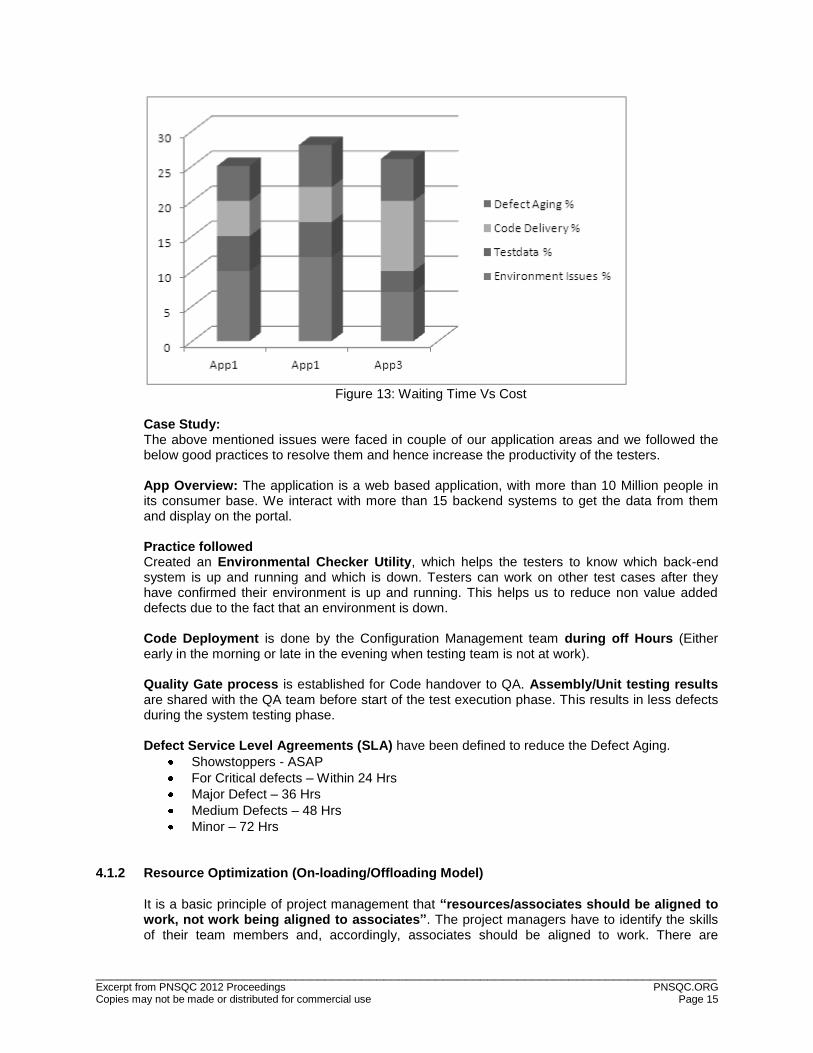
We have captured the Data of 2 applications who has lot of dependency and have captured the data related to Environment Downtime, Test Data, Code Delivery and Wait Time. The below Figure 13 shows the depiction of QA cost Vs Waiting time: Conclusion: More the Waiting time, more the QA Cost
____________________________________________________________________________________ Excerpt from PNSQC 2012 Proceedings PNSQC.ORG Copies may not be made or distributed for commercial use Page 15
Figure 13: Waiting Time Vs Cost
Case Study: The above mentioned issues were faced in couple of our application areas and we followed the below good practices to resolve them and hence increase the productivity of the testers. App Overview: The application is a web based application, with more than 10 Million people in its consumer base. We interact with more than 15 backend systems to get the data from them and display on the portal. Practice followed Created an Environmental Checker Utility, which helps the testers to know which back-end system is up and running and which is down. Testers can work on other test cases after they have confirmed their environment is up and running. This helps us to reduce non value added defects due to the fact that an environment is down. Code Deployment is done by the Configuration Management team during off Hours (Either early in the morning or late in the evening when testing team is not at work). Quality Gate process is established for Code handover to QA. Assembly/Unit testing results are shared with the QA team before start of the test execution phase. This results in less defects during the system testing phase. Defect Service Level Agreements (SLA) have been defined to reduce the Defect Aging.
Showstoppers - ASAP
For Critical defects – Within 24 Hrs
Major Defect – 36 Hrs
Medium Defects – 48 Hrs
Minor – 72 Hrs
4.1.2 Resource Optimization (On-loading/Offloading Model)
It is a basic principle of project management that “resources/associates should be aligned to work, not work being aligned to associates”. The project managers have to identify the skills of their team members and, accordingly, associates should be aligned to work. There are

____________________________________________________________________________________ Excerpt from PNSQC 2012 Proceedings PNSQC.ORG Copies may not be made or distributed for commercial use Page 16
different phases in the STLC (Software Test Life Cycle) and we know that in each phase we do not have the same amount of work, so it is imperative that the Project Manager perform due diligence in assigning the tasks to the associates. Suppose we get a 100 Man hours project that needs to be completed in 100 days. Does it make sense to put a single associate on the project at day 1? Does it make sense to do this if we know that during the initial and end phases there will be little, if any, work to be done? So, effective resource deployment is the key on project to reduce the QA cost down. Task allocation is very important. If we start allocating one project/task to an associate, we will see a challenge when the task is blocked. The associate will sit idle and it will add up to Testing Cost. As a best practice, one needs to assign more than one task to one associate so that, if they find themselves blocked due to issues or instability, the associate can work on alternate tasks. By doing this, we can use resources/team members to maximum capacity. With one task, the associate may have work of 35 hours per week against a capacity of 40 hours, but with multiple tasks, we can achieve even 100% capacity utilization. Another good practice is to have some low priority OPEN tasks already available so that in case of available bandwidth, we can start allocating those to associates. Regression suite creation, automation, and process improvement are good examples of such task. It is also seen that Project Managers try to block the associates; when things do not happen as planned, often the idle time increases. It is a good practice to load the resource plan so that we have less people during design and development, and get full strength during execution. It’s especially important to have extra hands during the last couple of weeks before release. We should free resources and team members if we see delays in requirements, design and code turn over stages.
Resource On-loading/Off-loading Model (Resource/Associate hiring/engagement as per actual schedule)
Figure 14: Onload/offload Model
4.2 Common Resource Pool
Generally, in case of big projects, the project team hiring gets started on the basis of the Order of Magnitude (OOM) estimates and associates are onboard when we have less work on the project
____________________________________________________________________________________ Excerpt from PNSQC 2012 Proceedings PNSQC.ORG Copies may not be made or distributed for commercial use Page 17
but have fully funded project hrs to burn. Managers/leads believe that, according to the resource plan and task alignment, associates are quite occupied in the work. That’s not the reality. Associates being charged to the project and capacity utilization is also very good, but at the same time no one looks at the productivity. Even in normal Test Design or Test Execution, even for scheduled down time, attending meetings or other activities, the Hrs are charged to the project that increase the QA cost.
The solution here is to encourage the associates to enter the actual time in the timesheet or Daily Tracking Sheet, which will help the Leads and Managers to know which associate is occupied or not and start building or capturing the Productivity metrics. Also, Leads/Managers can assign some additional tasks, engage them into new initiatives in case associates have some bandwidth.
Case Study
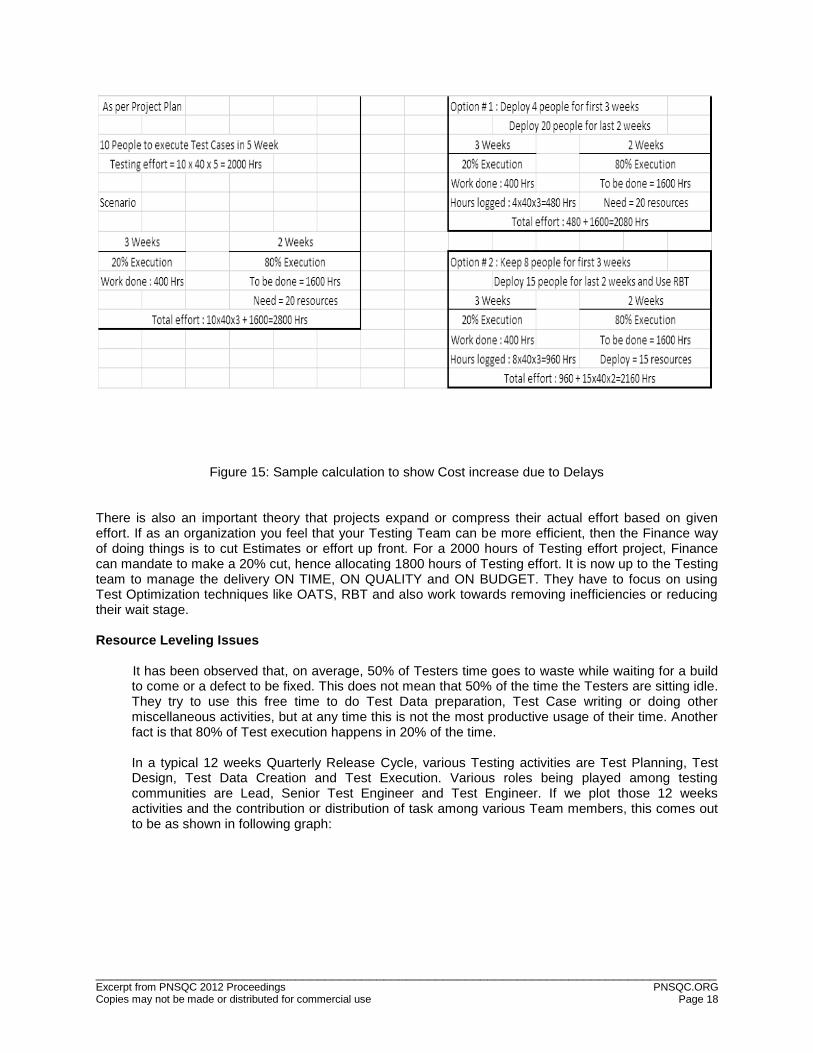
Let us take a look at another real world scenario, where a Code Turnover delay for Testing increases the Project cost exponentially and how this can be minimized. For the sake of simplification, we have taken 2000 hours of Testing effort during our project, in which 10 Team members are required for 5 weeks. In the first scenario, 20% of progress has been made in the first 3 weeks of the project due to changing business requirements and/or ambiguous business requirements. To finish the balance of 1600 hours of Testing effort, the project will need 20 testers which will make overall Testing Cost 40% more than initial estimates.
There are 2 options available to manage this effectively. The first one is, instead of deploying all 10 people in the initial weeks, why not deploy 4 people to project and when the things come in shape during last 2 weeks, and deploy the full battery of 20 people to the remaining 80% of Testing effort? This will bring down the cost marginally more than estimated. The Question is “How will you know that first 3 weeks of project will be able to give you only 20% of effort?” This can be judged based on the maturity of the organization, past experiences and early signs of the project.
The other option is to use Test Optimization techniques like Risk based Testing and OATS – Orthogonal Array Test Strategy Techniques to reduce number of Test Scenarios/Test Cases to reduce scope of Testing so that with limited number of associates one can manage MOST OF THE COVERAGE and NOT FULL COVERAGE.
____________________________________________________________________________________ Excerpt from PNSQC 2012 Proceedings PNSQC.ORG Copies may not be made or distributed for commercial use Page 18
Figure 15: Sample calculation to show Cost increase due to Delays
There is also an important theory that projects expand or compress their actual effort based on given effort. If as an organization you feel that your Testing Team can be more efficient, then the Finance way of doing things is to cut Estimates or effort up front. For a 2000 hours of Testing effort project, Finance can mandate to make a 20% cut, hence allocating 1800 hours of Testing effort. It is now up to the Testing team to manage the delivery ON TIME, ON QUALITY and ON BUDGET. They have to focus on using Test Optimization techniques like OATS, RBT and also work towards removing inefficiencies or reducing their wait stage. Resource Leveling Issues It has been observed that, on average, 50% of Testers time goes to waste while waiting for a build
to come or a defect to be fixed. This does not mean that 50% of the time the Testers are sitting idle. They try to use this free time to do Test Data preparation, Test Case writing or doing other miscellaneous activities, but at any time this is not the most productive usage of their time. Another fact is that 80% of Test execution happens in 20% of the time.
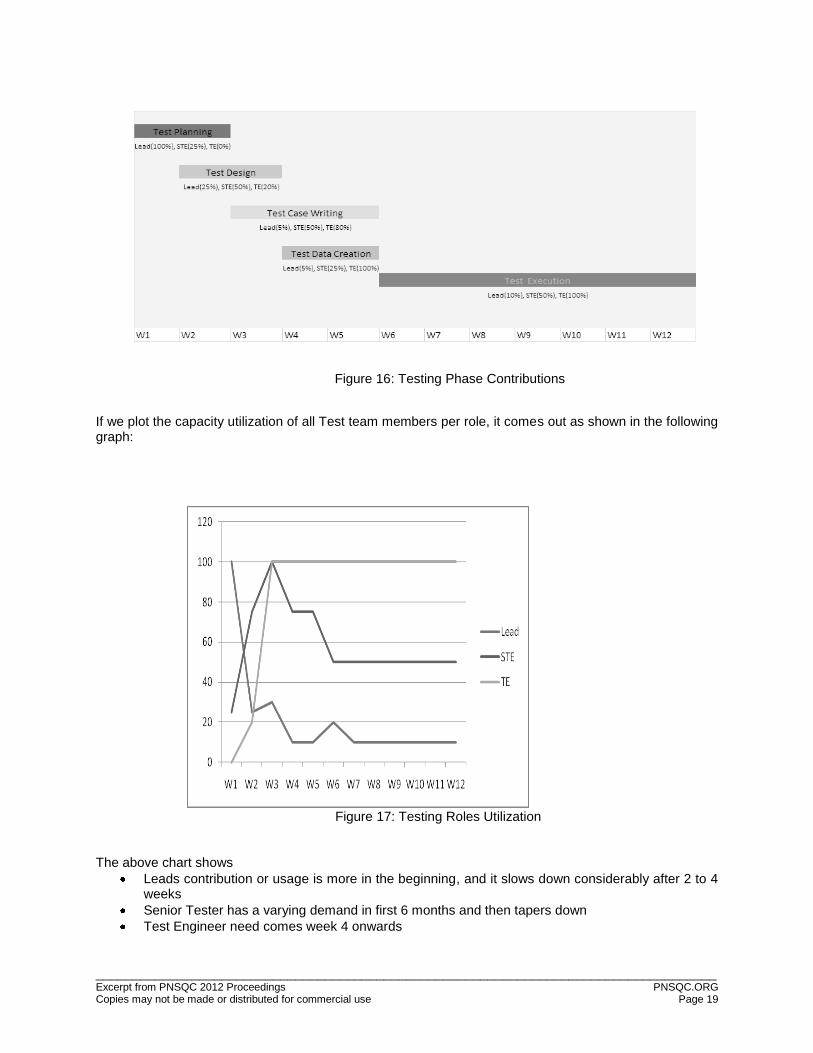
In a typical 12 weeks Quarterly Release Cycle, various Testing activities are Test Planning, Test Design, Test Data Creation and Test Execution. Various roles being played among testing communities are Lead, Senior Test Engineer and Test Engineer. If we plot those 12 weeks activities and the contribution or distribution of task among various Team members, this comes out to be as shown in following graph:
____________________________________________________________________________________ Excerpt from PNSQC 2012 Proceedings PNSQC.ORG Copies may not be made or distributed for commercial use Page 19
Figure 16: Testing Phase Contributions
If we plot the capacity utilization of all Test team members per role, it comes out as shown in the following graph:
Figure 17: Testing Roles Utilization
The above chart shows
Leads contribution or usage is more in the beginning, and it slows down considerably after 2 to 4 weeks
Senior Tester has a varying demand in first 6 months and then tapers down
Test Engineer need comes week 4 onwards
____________________________________________________________________________________ Excerpt from PNSQC 2012 Proceedings PNSQC.ORG Copies may not be made or distributed for commercial use Page 20
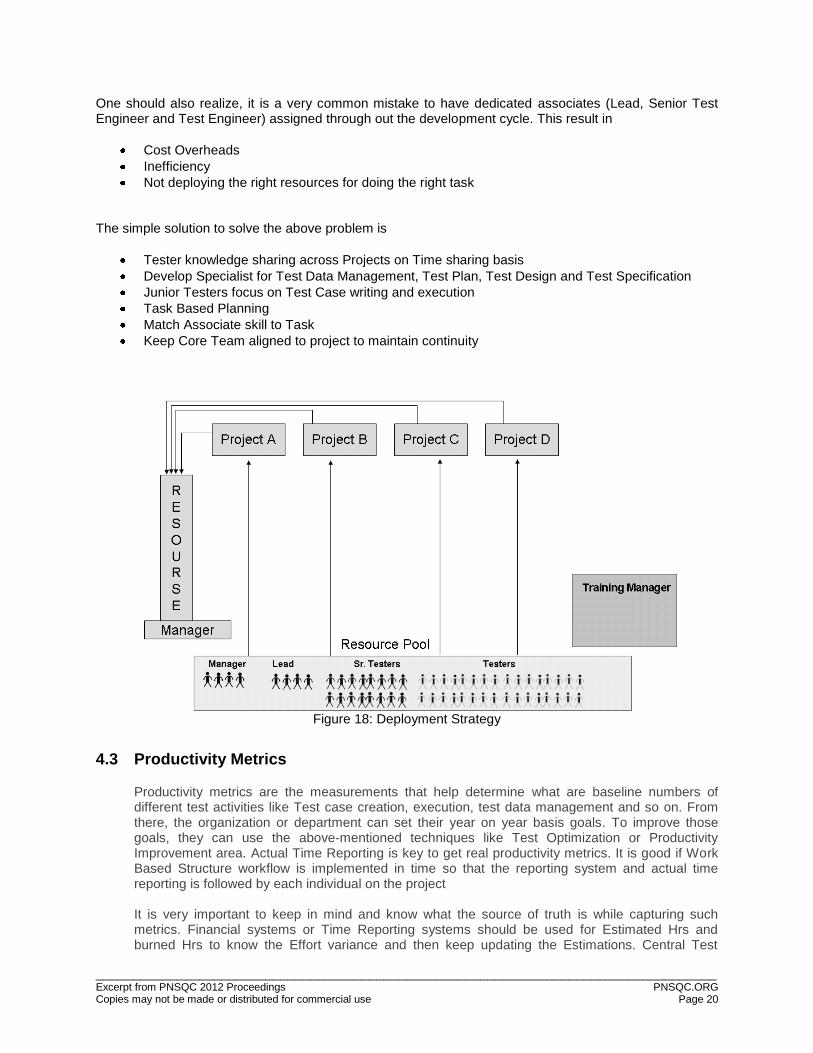
One should also realize, it is a very common mistake to have dedicated associates (Lead, Senior Test Engineer and Test Engineer) assigned through out the development cycle. This result in
Cost Overheads
Inefficiency
Not deploying the right resources for doing the right task The simple solution to solve the above problem is
Tester knowledge sharing across Projects on Time sharing basis
Develop Specialist for Test Data Management, Test Plan, Test Design and Test Specification
Junior Testers focus on Test Case writing and execution
Task Based Planning
Match Associate skill to Task
Keep Core Team aligned to project to maintain continuity
Figure 18: Deployment Strategy
4.3 Productivity Metrics
Productivity metrics are the measurements that help determine what are baseline numbers of different test activities like Test case creation, execution, test data management and so on. From there, the organization or department can set their year on year basis goals. To improve those goals, they can use the above-mentioned techniques like Test Optimization or Productivity Improvement area. Actual Time Reporting is key to get real productivity metrics. It is good if Work Based Structure workflow is implemented in time so that the reporting system and actual time reporting is followed by each individual on the project It is very important to keep in mind and know what the source of truth is while capturing such metrics. Financial systems or Time Reporting systems should be used for Estimated Hrs and burned Hrs to know the Effort variance and then keep updating the Estimations. Central Test
____________________________________________________________________________________ Excerpt from PNSQC 2012 Proceedings PNSQC.ORG Copies may not be made or distributed for commercial use Page 21
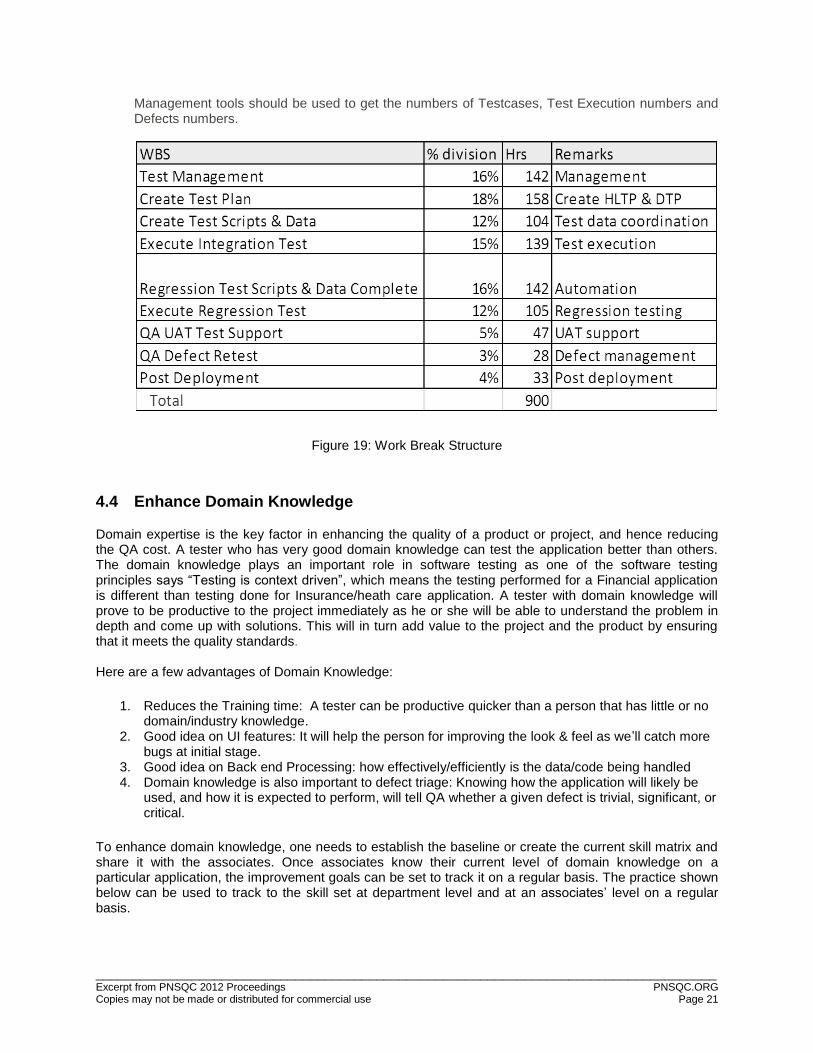
Management tools should be used to get the numbers of Testcases, Test Execution numbers and Defects numbers.
Figure 19: Work Break Structure
4.4 Enhance Domain Knowledge
Domain expertise is the key factor in enhancing the quality of a product or project, and hence reducing the QA cost. A tester who has very good domain knowledge can test the application better than others. The domain knowledge plays an important role in software testing as one of the software testing principles says “Testing is context driven”, which means the testing performed for a Financial application is different than testing done for Insurance/heath care application. A tester with domain knowledge will prove to be productive to the project immediately as he or she will be able to understand the problem in depth and come up with solutions. This will in turn add value to the project and the product by ensuring that it meets the quality standards.
Here are a few advantages of Domain Knowledge:
1. Reduces the Training time: A tester can be productive quicker than a person that has little or no domain/industry knowledge.
2. Good idea on UI features: It will help the person for improving the look & feel as we’ll catch more bugs at initial stage.
3. Good idea on Back end Processing: how effectively/efficiently is the data/code being handled 4. Domain knowledge is also important to defect triage: Knowing how the application will likely be
used, and how it is expected to perform, will tell QA whether a given defect is trivial, significant, or critical.
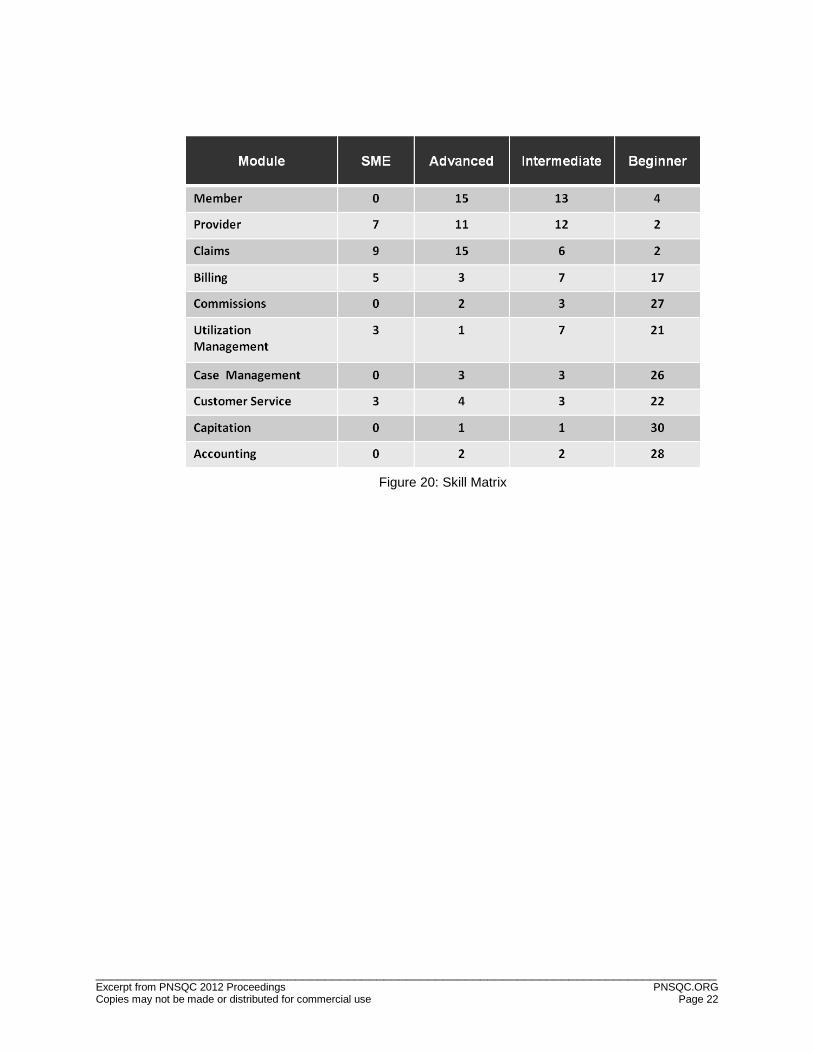
To enhance domain knowledge, one needs to establish the baseline or create the current skill matrix and share it with the associates. Once associates know their current level of domain knowledge on a particular application, the improvement goals can be set to track it on a regular basis. The practice shown below can be used to track to the skill set at department level and at an associates’ level on a regular basis.
____________________________________________________________________________________ Excerpt from PNSQC 2012 Proceedings PNSQC.ORG Copies may not be made or distributed for commercial use Page 22
Figure 20: Skill Matrix