Embed Size (px)
Citation preview
Redox behavior of Li-S cell with PP14-TFSI ionic liquid electrolyte Spectroscopic study on speciation of polysulfides during charge/discharge processes
Master of Science Thesis in the Master Degree Programme, Applied Physics ERIK BLOMBERG Department of Applied Physics Division of Condensed Matter Physics CHALMERS UNIVERSITY OF TECHNOLOGY Gothenburg, Sweden, 2012

Thesis for the Degree of Master of Applied Physics
Redox behavior of Li-S cell withPP14-TFSI ionic liquid electrolyte
Spectroscopic study on speciation of polysulfides duringcharge/discharge processes
ERIK BLOMBERG
Department of Applied PhysicsCHALMERS UNIVERSITY OF TECHNOLOGY
Göteborg, Sweden 2012
Redox behavior of Li-S cell with PP14-TFSI ionic liquid electrolyteSpectroscopic study on speciation of polysulfides during charge/dischargeprocessesErik Blomberg
Thesis for the Degree of Master of Applied Physics
c©Erik Blomberg, 2012
Condensed Matter PhysicsDepartment of Applied PhysicsCHALMERS UNIVERSITY OF TECHNOLOGYSE-412 96 GöteborgSweden www.chalmers.se Tel. +46-(0)31 772 1000
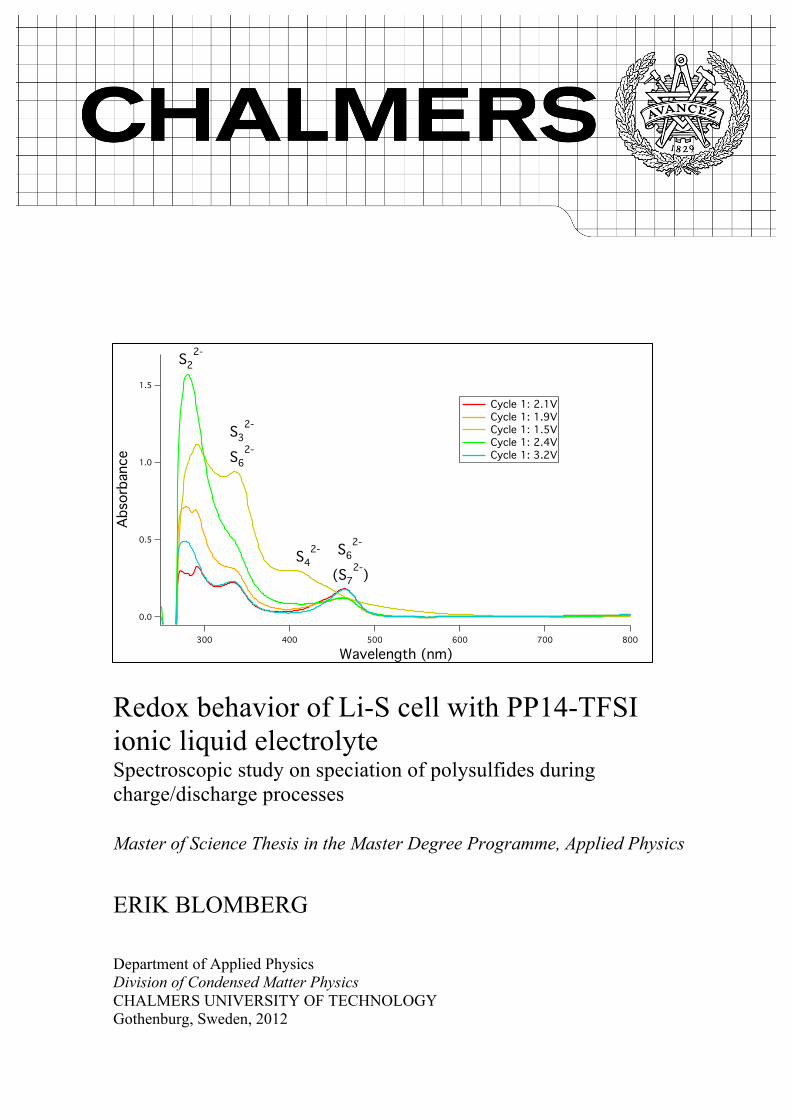
Cover: UV-Vis spectra indicating the polysufides present in the PP14-TFSIelectrolyte of a Li-S cell during the first discharge and charge.Printed by Chalmers ReproserviceGöteborg, Sweden 2012
Redox behavior of Li-S cell with PP14-TFSI ionic liquidelectrolyteSpectroscopic study on speciation of polysulfides during charge/discharge pro-cesses
Erik BlombergDepartment of Applied Physics, Chalmers University of Technology
Abstract
Li-S batteries, having one of highest theoretical energy densities possible, havebeen suggested as a way to improve on the current state of the art. However, thedissolution of intermediate polysulfide species in the electrolyte has so far greatlyreduced the cycleabilty of these batteries. One proposed solution is to use an ionicliquid electrolyte to decrease the solubility of the polysulfides.
This work investigates the polysulfide speciation in Li-S cells with an ionicliquid electrolyte during charge and discharge. Four different room temperatureionic liquids were studied and found to dissolve polysulfides in small concentra-tions. One of the ionic liquids, PP14-TFSI, was examined further using UV-Visspectroscopy to identify the polysulfide ions present in the electrolyte at differentpoints of the charge/discharge cycle.
It was found that the first step of the reaction during discharge produces S2−6
with only small amounts of other polysulfides. Most of the S2−6 was then reduced
to S2−3 and S2−
4 in a second reaction step. These reactions showed good reversibil-ity during charge, however a rapid decline in capacity was observed with con-tinued cycling. This led to the conclusion that the ionic liquid did not by itselfprevent the loss of active material associated with the dissolution of polysulfides.
Keywords: Lithium sulfur batteries, Li-S, ionic liquid electrolytes, polysulfides,UV-Vis spectroscopy.
i

ii

Acknowledgements
This thesis would not have been possible without my supervisor Young Jin Choi,who never hesitated to answer the barrage of questions, give suggestions or showme how it’s done. Thank you for your help and your support.I would like to thank Aleksandar Matic for pushing me forward and, together withPer Jacobsson, providing excellent feedback and guidance. I also wish to thankthe KMF group, some of you for being excellent office mates, others for keepingthe labs and instruments running or enlisting my help in various projects, and allof you for creating a wonderful working environment.Last but not least I thank my family and friends who I know I can rely on for loveand support in all my endeavors.
Göteborg, June 2012Erik Blomberg
iii

iv

Contents
Abstract . . . . . . . . . . . . . . . . . . . . . . . . . . . . . . . . . . iAcknowledgements . . . . . . . . . . . . . . . . . . . . . . . . . . . . iii
1 Introduction 1
2 Background 32.1 The battery . . . . . . . . . . . . . . . . . . . . . . . . . . . . . 4
2.1.1 Lithium-ion batteries . . . . . . . . . . . . . . . . . . . . 62.1.2 Lithium sulfur batteries . . . . . . . . . . . . . . . . . . . 82.1.3 Ionic liquid electrolytes . . . . . . . . . . . . . . . . . . . 10
2.2 Characterizing batteries . . . . . . . . . . . . . . . . . . . . . . . 12
3 Materials & Procedures 143.1 Ionic liquids . . . . . . . . . . . . . . . . . . . . . . . . . . . . . 143.2 Reference sample preparation . . . . . . . . . . . . . . . . . . . . 153.3 UV-Vis spectroscopy . . . . . . . . . . . . . . . . . . . . . . . . 153.4 Cyclic Voltametry . . . . . . . . . . . . . . . . . . . . . . . . . . 173.5 Cell assembly and CV testing . . . . . . . . . . . . . . . . . . . . 18
4 Results & Discussion 214.1 Reference samples . . . . . . . . . . . . . . . . . . . . . . . . . 21
4.1.1 Raman spectroscopy . . . . . . . . . . . . . . . . . . . . 234.1.2 UV-Vis spectroscopy . . . . . . . . . . . . . . . . . . . . 24
4.2 Tested cells . . . . . . . . . . . . . . . . . . . . . . . . . . . . . 27
5 Conclusion 32
6 Future Work 33
Bibliography 34
v

List of Figures
2.1 The galvanic cell . . . . . . . . . . . . . . . . . . . . . . . . . . 32.2 The structure of PP14 . . . . . . . . . . . . . . . . . . . . . . . . 112.3 The discharge curve . . . . . . . . . . . . . . . . . . . . . . . . . 12
3.1 BRANDTTM
UV cuvettes . . . . . . . . . . . . . . . . . . . . . . 16(a) Cuvettes . . . . . . . . . . . . . . . . . . . . . . . . . . . 16(b) Absorption spectrum . . . . . . . . . . . . . . . . . . . . . 16
3.2 The cyclic voltammogram . . . . . . . . . . . . . . . . . . . . . 183.3 The Swagelok cell electrodes . . . . . . . . . . . . . . . . . . . . 193.4 The Swagelok cell . . . . . . . . . . . . . . . . . . . . . . . . . . 19
4.1 PP14-TFSI reference samples . . . . . . . . . . . . . . . . . . . . 214.2 PYR14-TFSI reference samples . . . . . . . . . . . . . . . . . . 224.3 BMIM-TFSI reference samples . . . . . . . . . . . . . . . . . . . 224.4 BMIM-SCN reference samples . . . . . . . . . . . . . . . . . . . 234.5 Raman spectra . . . . . . . . . . . . . . . . . . . . . . . . . . . . 244.6 PP14-TFSI UV-Vis spectra . . . . . . . . . . . . . . . . . . . . . 244.7 Reference sample UV-Vis spectra . . . . . . . . . . . . . . . . . 254.8 Peak intensity for the reference samples . . . . . . . . . . . . . . 264.9 Reference sample UV-Vis spectra after 28 d . . . . . . . . . . . . 274.10 A typical CV trace . . . . . . . . . . . . . . . . . . . . . . . . . 284.11 UV-Vis spectra from cycle 1 . . . . . . . . . . . . . . . . . . . . 294.12 UV-Vis spectra at 1.5 V . . . . . . . . . . . . . . . . . . . . . . . 304.13 UV-Vis spectra at 3.2 V . . . . . . . . . . . . . . . . . . . . . . . 314.14 UV-Vis spectrum from self-discharge test . . . . . . . . . . . . . 31
vi

Chapter 1
Introduction
Modern technology, and our use of it, is changing rapidly in many different andoften unexpected ways. This evolution is often driven by advancements in keyareas that enable a cascade of further improvements in various other fields. Onegood example is energy storage, which represent the second part of a problemas old as technology itself: how do we create the energy to power our machinesand devices and how do we get it to the location and at the time where it is needed?
Efficient storage of electrical energy using rechargeable batteries, especiallylithium ion (Li-ion) batteries, has proven to be the best solution for a range of ap-plications. Their increasing use and rapid improvement have led to a multitude ofdramatic changes, the most obvious being portable consumer electronics, and theyare an important enabler for the development of electrified transportation and re-newable energy distribution [1]. However, the desire for better performance (andlower cost) is driving todays batteries towards the theoretical energy density of thebasic Li-ion chemistry. An increasing amount of R&D is therefore being directedtowards alternative configurations and chemistries [1, 2]. One such candidate isto base the battery on the reaction between lithium and sulfur.
The specifics of the reaction between lithium and sulfur (Li-S) result in batter-ies with much higher specific energy than Li-ion batteries - in theory. The theoret-ical value for the specific energy, calculated using the capacity and voltages of theactive materials, is a common way to compare different battery chemistries. Theproperties of elemental lithium and sulfur gives a specific energy of 2,567 Wh/kgwhile the current Li-ion materials are limited to 387 Wh/kg [1]. In practice, thatpotential has been hard to realize because of multiple problems that degrade theperformance and limit the life of the cells. The common approach to improve Li-Scells is the same as that which has been successfully applied to Li-ion:
2 CHAPTER 1. INTRODUCTION
changing the materials, especially the electrolyte, and the structure of the elec-trodes [1, 2, 3].
Ionic liquid electrolytes have been considered for use in batteries due to anumber of beneficial properties, such as good ion conductivity, high electrochem-ical and thermal stability and low vapor pressure [4, 5, 6]. However, the specificapplication to Li-S batteries has only been studied quite recently [5, 7]. The aimof this thesis is to find another small piece of the puzzle by investigating the dis-solution, transport and reactions of lithium polysulfide species in ionic liquid (IL)based electrolytes during charge and discharge of Li-S cells.

Chapter 2
Background
A battery is a device that stores electrochemical energy. The fundamental princi-ples behind are the chemical reduction and oxidation (redox) reactions betweentwo compounds. Such reactions occurs when the molecules or atoms of the tworeactants exchange electrons in order to equilibrate their electrochemical poten-tial µ , the energy released usually being in the form of heat and/or light. Greatercontrol can be obtained by keeping the reactants separated and instead connect-ing them indirectly, resulting in an electrochemical reaction which can generateelectrical currents and voltages in an external circuit. This also makes it possibleto use an external power source to drive the reaction away from the spontaneousequilibrium.
Zn Cu
LOAD
Porous separator
e- e-
ZnSO4 (Aq)
Zn2+ Cu2+
SO42-
CuSO4 (Aq)
Figure 2.1: An example of a galvanic cell with one zinc and one copper electrodeduring discharge. The electrodes are immersed in separate aqueous electrolytesthat are in ionic contact through a separator.
The galvanic cell, an example of which is shown in figure 2.1, is the most
4 CHAPTER 2. BACKGROUND
common such arrangement. It consists of two electrodes containing the activematerials that are in ionic, but not electric, contact through an electrolyte. Thechemical reaction is thus split into two half reactions between each electrode andthe electrolyte. These will proceed until they are suppressed by the increasing po-tential difference between the electrode and the electrolyte. When the electrodesare connected through an external electrical circuit a current will flow in order toneutralize the potential. This allows the reactions to continue, with an ionic cur-rent in the electrolyte and a corresponding external electric current, until all of theactive material has been consumed. The energy released by the chemical reaction,∆G, is given by
∆G =−nFE (2.1)
and is in this arrangement mostly in the form of useful electrical power in theconnected load. The energy is related to the number of electrons exchanged, n (permol reactants), and E = ∆µ , the difference in the electrochemical potential of thereactants [8]. F , Faradays constant, is simply the molar charge of the electron (≈96485 C mol−1). This relationship is obtained by examining the thermodynamicsof a reversible chemical reaction, i.e. that it strives to minimize Gibbs free energyG.
Each half reaction can be analyzed separately with different values of E ascompared to a common reference material. This is usually the Standard Hydro-gen Electrode (SHE), measured at 25◦C and 1 atm in a 1 M solution, which resultsin the Standard Electrode Potential E◦ [9]. The total electromotive force (emf, thepotential due to the charge separation) of the cell is then simply the difference be-tween the values for the active materials. An element with a high (more positive)E◦ is readily reduced and therefore an oxidizer and an element with a lower (morenegative) value is correspondingly easily oxidized and a reducer. During the spon-taneous reaction of the cell the electrode with the lowest electrode potential willbe oxidized, releasing electrons into the external circuit, and this electrode is re-ferred to as the negative electrode. The electrode with the more positive electrodepotential will be reduced, accepting electrons, and is thus called the positive elec-trode. They are also often named the anode and the cathode which can lead toconfusion as their roles are reversed during charging with the positive electrode,now technically an anode, supplying electrons and the negative electrode, actingas a cathode, accepting electrons.
2.1 The batteryThe term battery is, although often used that way, not synonymous with an elec-trochemical cell. The battery is the actual device, consisting of one or multiple
2.1. THE BATTERY 5
connected cells, and includes packaging and structural materials and often safetyfeatures and control electronics. Modern batteries often use a separator, a thinporous membrane soaked in an electrolyte, or an electrolyte gelled with a poly-mer, in order to have only a minimal separation between the electrodes. Thisincreases the current that can be drawn from the battery by enabling faster iontransport and also minimizes the amount of electrolyte needed. Metal current col-lectors and conductive additives to the active electrode materials such as carbonpowder are often necessary since many of the active materials or their reactionproducts are poor electric conductors.
Batteries are typically divided into two main categories: Primary batteries areusually assembled in their charged state and are discarded (and hopefully recy-cled) after use. The first useful batteries were of this type and today they span awide range of sizes, chemistries and applications. A widely recognized exampleof a primary battery are the common household 1.5 V "alkaline" batteries used topower flashlights, toys, clocks etc. They rely on the reaction between zinc andmanganese oxide using an alkaline electrolyte and are easy to produce and use,safe and have the best performance for their price range, especially for applica-tions requiring somewhat larger currents [9].
Secondary batteries use reactions and layouts that enable reversible operation,meaning that when the battery has been drained it can be recharged and usedagain. They are therefore commonly known as rechargeable batteries or some-times, mostly for lead-acid batteries, accumulators. These batteries are calledsecondary since they store electrical energy supplied from some other energysource, returning it in a secondary operation (discharge). The different require-ments means that primary and secondary batteries normally have different elec-trode combinations, although there are some that are used in both types such asrechargeable alkaline batteries. Tradeoffs in design and material utilization meanthat the secondary versions have a higher cost and lower capacity.
There are a number of different parameters for evaluating the performance ofbatteries, some important ones being: the specific energy [Wh/kg] and energydensity [Wh/L], the specific power [W/kg] and power density [W/L], efficiency,temperature range, useful lifetime and of course cost. In this case lifetime does notrefer to capacity as in "battery life" but to durability: how long in both time and,for secondary batteries, number of charge/discharge cycles the battery can deliveruseful performance. Related factors are the storage life and self-discharge rate- all batteries will leak some of their stored charge over time, but some versionsused for special applications can deliver according to specifications after sitting ona shelf for decades [8]. When evaluating secondary batteries it is also importantto consider the efficiency of the energy storage which for most batteries is around70-80%, with the cheaper nickel-metal hydride and alkali variants being as low as55-60% and the more expensive Li-ion getting as high as 95% [9].

6 CHAPTER 2. BACKGROUND
The relative importance of the various characteristics depends heavily on theapplication - a cellphone or laptop battery would optimize the specific energy andenergy density to make it as light and small as possible while grid energy storageusing large scale batteries is likely to focus on low total cost as a function of unitcost and lifetime fare more than any weight or volume considerations. Electricvehicles fall in between these two extremes (with rather different priorities fora high end sports car compared to a delivery van) while also needing sufficientpower to accelerate quickly and recover energy while braking [9].
While the theoretical performance of a cell or a battery can be calculated fromthe properties of the active materials such as capacity [Ah/kg], electrode potential,conductivity, molar mass and density the obtained values are mostly useful forcomparison. The actual performance figures are usually much worse due to thecompromises made to obtain a practical battery. One example is the practicalenergy storage, which usually is at most 1/3 of the theoretical value [1] due toall the materials that do not store energy (casing, current collectors, separators,electrolyte and so on) and the fact that it is impossible to use all of the activematerial. For secondary batteries the depth of discharge (DOD) is never 100%and deep cycling usually leads to shorter lifetime. The voltage of the battery alsoshows important deviations from the ideal. The open circuit voltage (OCV), thepotential between the electrodes when there is no current, is often quite close to thetheoretical emf, but the voltage will drop as soon as there is a current drawn due tothe internal resistance of the battery and polarization at the electrolyte-electrodeinterfaces. The resistance increases as the battery is discharged as a result of theincreasing concentration of reaction products and the decreasing concentration ofunreacted material leading to a sloping discharge curve instead of the ideal flatvoltage.
2.1.1 Lithium-ion batteriesEquation (2.1) can be used as the starting point when analyzing the performance ofa battery based on specific materials. It is easy to see that an increased differencein the electrode potential of the positive and negative electrode, i.e. a larger E,gives an increased energy storage. Maximum specific energy and energy densityare therefore achieved using electrode materials with large (negative or positive)electrode potentials and low molecular weight. This explains why lithium can beconsidered more or less the perfect choice for the negative electrode: the combi-nation of one of the lowest electrode potentials, E◦ =−3.05 V, a high theoreticalcapacity of 3860 mAh/g and the lowest atomic weight of any solid material meansthat it has the best theoretical specific energy of all negative electrode materials[9]. The low density of lithium means that the theoretical energy density is lowerthan for some other systems, but it is still very good.

2.1. THE BATTERY 7
Lithium, combined with various positive electrodes, started to be commercial-ized in primary batteries during the 1970s but they were confined to niche appli-cations due to high cost and problems with safety and reliability [9]. Progresswith secondary batteries based on lithium was even slower until research beganto focus on using intercalation compounds in the electrodes. These are materi-als with a layered structure that do not follow the ordinary reaction path wheninteracting with lithium but instead intercalate the atoms or ions, i.e. bind themweakly in between layers in the structure. The first commercial secondary lithiumbattery based on intercalation was introduced in 1991 by Sony and started thedevelopment that lead to the high performance Li-ion cells of today [8, 9].
The most common Li-ion rechargeable battery today uses a graphite nega-tive anode that stores lithium, which on discharge is further oxidized to lithiumcations Li+ that travel through the electrolyte to the positive cathode where theyare inserted into a lithium metal oxide, such as LiCoO2 (LCO). The total reactionbecomes
LiMO2 + y CDischarge←−−→
ChargeLixCy + Li1−xMO2 (2.2)
where M is a metal such as cobalt or manganese, x≈ 0.5 and y = 6 [1, 9, 10].
The cells use a nonaqueous electrolyte, which is required when using lithiumdue to its reactivity towards water. They have a voltage around 4 V, a wide temper-ature range and a flat discharge curve, a specific energy typically around 100 - 150Wh/kg (up to 240 Wh/kg), an energy density up to 640 Wh/L and excellent cy-cleability. They are also free from memory effects, where the capacity of the celldepends on the DOD of previous cycles, that has been a large problem for someother secondary battery chemistries such as nickel-cadmium. Drawbacks are thehigh price and sensitivity to excessive charging and discharging - the chemistrydoes not have any built in limitations preventing damage when the operating rangeis exceeded. Li-ion batteries can also suffer from thermal runaway and even catchfire or explode. Newer batteries mitigate these problems through control electron-ics, better design and changed chemistry [9, 10].
The storage capacity of Li-ion batteries has roughly doubled since their intro-duction, enabling a firm grip on the high performance/high cost segment. The the-oretical limit for the graphite and LCO chemistry is 387 Wh/kg and 1015 Wh/L,but current and future innovations are expected to be able to once again double to-days already impressive performance. This work is mostly focused on improvingthe storage of lithium in the negative electrode, perhaps using spinels and/or tinalloys [9, 10].

8 CHAPTER 2. BACKGROUND
2.1.2 Lithium sulfur batteriesIncreasing the energy content by choosing different electrodes to further increasethe voltage is difficult: even the combination of Li and F, found at the respec-tive extreme ends of the E◦ range, would only produce a voltage of around 6 V.This would still only be a minor improvement over Li-ion batteries which alreadyachieve > 4 V and may even reach more than 5 V with future improvements [2].This route would also come with a huge increase in complexity because of theincreasing reactivity of materials with higher electrode potentials.
Returning to equation (2.1) one can see that here is another way to improvethe theoretical energy stored: by increasing n, the number of electrons exchangedin the reaction. This is a reason to study the reaction between lithium and sulfurwhich, during discharge, can be written as :
2Li+S→ Li2S (2.3)
which can be split into the two half reactions:
Negative electrode: 2Li→ 2Li++2e− (2.4a)Positive electrode: S+2e−→ S2− (2.4b)
with the reactions being driven in the reverse direction during charge. Each sulfuratom will accept 2 electrons when fully reacted, immediately doubling the capac-ity compared to an element that only uses 1 electron. This, when combined withthe low atomic mass of sulfur, is why the Li-S battery has the second highest the-oretical specific energy of all Li battery chemistries at 2,567 Wh/kg, only beatenby the related lithium-air (Li-O2) battery [1]. The low densities of lithium andsulfur means that, as previously seen when considering lithium alone, the energydensity is not as exceptional, but it is still much better then current technology at2,199 Wh/L [1]. Other large advantages are the abundance, low toxicity and en-vironmental impact and very low cost of sulfur, implying that the batteries shouldhave inherent low price compared to current technologies.
There are however several serious problems with Li-S batteries, as can be in-ferred from their lack of commercial success despite having been the subject ofresearch since the 1940s. It is only in the last few years that real progress has beenmade and today there are some prototypes available, such as those made by SionPower that deliver 350 Wh/kg with claimed near future improvement to around600 Wh/kg [1]. One historic drawback is the low voltage, 2.2 V, especially com-pared to Li-ion [1]. This has become less of a concern as electronics has becomesmaller and more efficient meaning that higher voltages are only important forhigh power applications that already need large battery packs with multiple cells.The second most obvious problem is that both sulfur and the resulting lithium sul-fide are insulating. The positive cathode must therefore contain a large fraction of
2.1. THE BATTERY 9
conductive additives such as carbon in addition to sulfur and care must be takento minimize the buildup of Li2S films during discharge.
The multiple electron reaction shown in (2.3) is deceptively simplified - sulfurnaturally forms ring shaped molecules of 8 sulfur atoms, meaning that the reactionat least should be written as:
16Li+S8→ 8Li2S (2.5)
although this equation still manages to hide one of the largest sources of problemsfor Li-S cells: the polysulfides. The reduction of S8 to S2−
8 goes through a wholezoo of intermediate polysulfide species Sx−
n with 2 ≤ n ≤ 8. These reductionsoccur at different voltages and usually result in two reduction peaks in a cyclicvoltammetry (CV) trace, instead of one peak as for simpler systems. The firstpeak is attributed to the reduction of S8 to S2−
8 accompanied by four reactionsinvolving the resultant species shown in (2.6) [11].
S8 +2e−→ 2S2−8 (2.6a)
4S2−8 → 4S2−
6 +S8 (2.6b)
S2−6 → 2S·−3 (2.6c)
2S2−8 → 2S2−
4 +S8 (2.6d)
S2−8 +S2−
6 → 2S2−3 +S8 (2.6e)
For the second reduction peak the reactions in (2.7) have been suggested, aswell as further reactions resulting in S2−
2 , S2−, S2−7 and S2−
5 [11].
S2−8 +2e−→ S4−
8 (2.7a)
S4−8 → 2S2−
4 (2.7b)
S2−6 +2e−→ 2S2−
3 (2.7c)
S·−3 + e−→ 2S2−3 (2.7d)
2S2−3 +S2−
6 → 3S2−4 (2.7e)
3S4−8 → 2S2−
6 +4S2−3 (2.7f)
The nature of these reactions changes with solvent, electrolyte salt and elec-trode materials. Even for the same system the equilibria depend on temperatureand concentration as well as the potential of the cell. There is still much debateon the exact behavior of the polysulfides, but there is no question about their im-portance.
10 CHAPTER 2. BACKGROUND
The polysufides are generally capable of dissolving into the electrolyte, withthe longer chained polysufides displaying better solubility, and will diffuse awayfrom the positive electrode. They can then be reduced further to insoluble Li2S2 orLi2S at other locations in the battery, forming deposits that increase the resistanceand represent material loss. This is especially damaging when it occurs at the Li-metal electrode. The diffusing polysulfides cause current leakage and are involvedin parasitic "shuttle" reactions where they are repeatedly shuttling back and forthbetween being reduced at the negative electrode and then oxidized at the positiveelectrode. This greatly accelerates the material loss and leads to lifetimes of atmost a few cycles.
There are two main approaches to limit the problems caused by the polysul-fides. The first is to use various microstructured cathode materials like meso-porous carbon that inhibit the diffusion of the polysulfides so that most are con-fined to the positive electrode until they have been sufficiently reduced [2, 12, 13].This has improved the cycleability considerably, the price being added complex-ity. The other approach is to limit the dissolution and/or diffusion of polysulfidesin the electrolyte by changing the solvent, using additives or even switching to asolid electrolyte [7, 14]. These approaches can in many cases be combined [5].
2.1.3 Ionic liquid electrolytesThe role of the electrolyte is to enable the exchange of ions between the electrodesof the cell while keeping them otherwise separated. It consists of a solvent, whichcan be aqueous, organic or inorganic, liquid or solid, and a salt providing mobileions. It is even possible to have different electrolytes, separated by a membranethat is permeable to the ions only, in different parts of the battery [9]. The choiceof electrolyte can have a large impact on the performance and one needs to takemany different factors into account.
The components of the electrolyte should be chemically compatible with theother materials in the battery for the whole potential range, which can be deter-mined through a simple CV measurement - a lack of reactions gives a flat curvewithout peaks. This means that it would not be possible to use an aqueous elec-trolyte in a battery containing lithium even if the lithium did not spontaneouslyreact with water. The potential window of water is about 1.2 V which, being lessthan the voltage of most lithium batteries, would lead to the water being elec-trolyzed [9]. That the electrolyte is compatible does not necessarily require that itis totally passive with regard to the electrode materials. This is the case for manybatteries using metallic lithium as the negative electrode where a solid electrodeinterface, SEI, will form on the surface. This is usually desirable, even though itlowers the conductivity, because it helps combat dendrite growth. When Li+ ionsare deposited on metallic lithium they tend to form dendrites which leads to loss
2.1. THE BATTERY 11
of active material and short circuits.High ion conductivity is of course desirable, but many other physical prop-
erties are also important when constructing the battery. Good stability and awide temperature range, low vapor pressure, non-flammability and nontoxicitywill result in a battery with better performance and higher safety [9]. Most of theproblems that have been reported with Li-ion batteries are caused by the organicelectrolytes suffering thermal runaway: they start to decompose at elevated tem-peratures, increasing the resistance of the cell leading to further heating and soon. This led to battery packs catching fire and sometimes, when combined withpoorly designed casing, even explosions.
One large class of solvents that has been receiving increased attention for usein battery electrolytes are ionic liquids (ILs). An ionic liquid is a salt that hasa melting point below the operating temperature of the application. Room tem-perature ionic liquids (RTILs) are thus liquid at room temperature, with someremaining liquid far below the freezing point of water, making them particularlyinteresting for applications. All ionic liquids in this work are RTILs, and the termswill from now on be used interchangeably.
Ionic liquids generally have a high ion conductivity, high electrochemical andthermal stability, a wide liquid temperature range, large potential windows andvery low vapor pressure. This provides potentially increased safety compared tocurrent organic electrolytes, however the main reason for applying them to Li-Sbatteries is the hope that lower solubility of the polysulfides will solve some ofthe problems [7, 15].
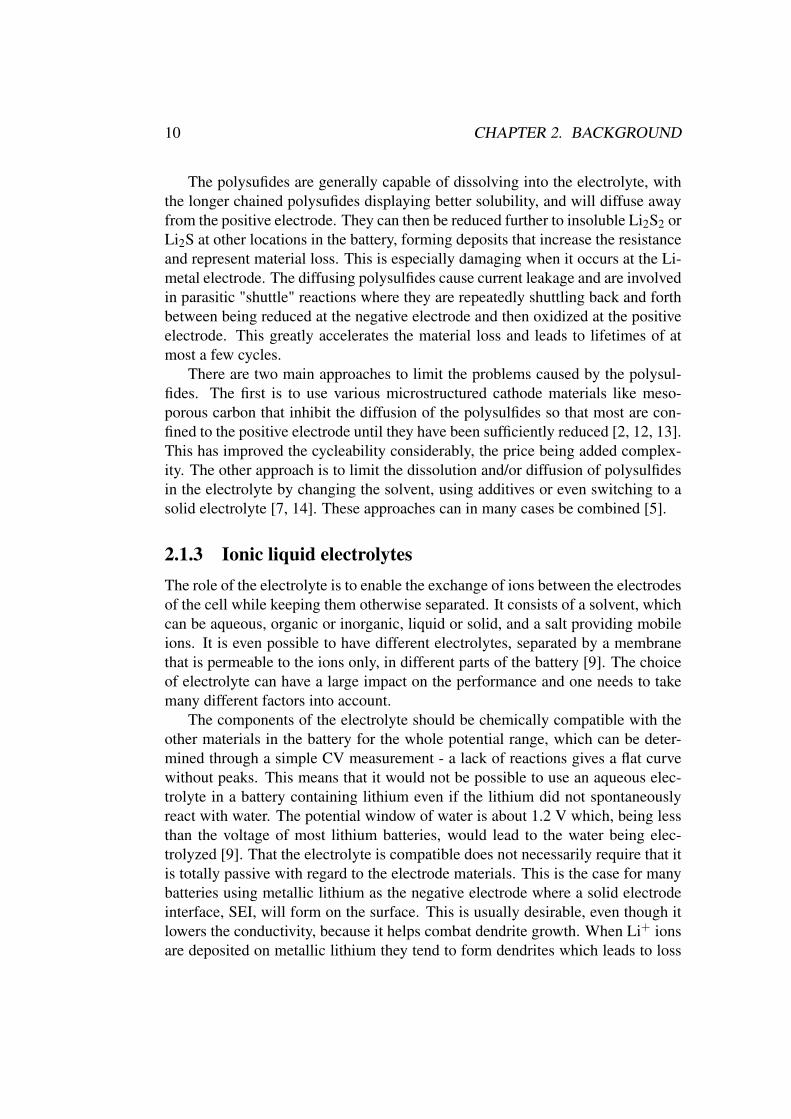
An electrolyte could in theory consist of an IL alone, if it contained the cor-rect ions. However the extremely low melting temperature compared with morestandard salts like NaCl (∼ 800◦C) is due to using large and asymmetric cat- andanions. The structures of the PP14-TFSI pair, one of four ILs used in this thesis,are shown in figure 2.2 as an example. This means that the active ions, Li+ in thecase of lithium batteries, still have to be added as an extra salt. A convenient wayto minimize the number of ion species is to use the salt combining lithium withthe anion in the IL resulting in a mixture of two cations and one anion.
Figure 2.2: The structure of the PP14 cation (left) and the TFSI anion (right).
12 CHAPTER 2. BACKGROUND
2.2 Characterizing batteries
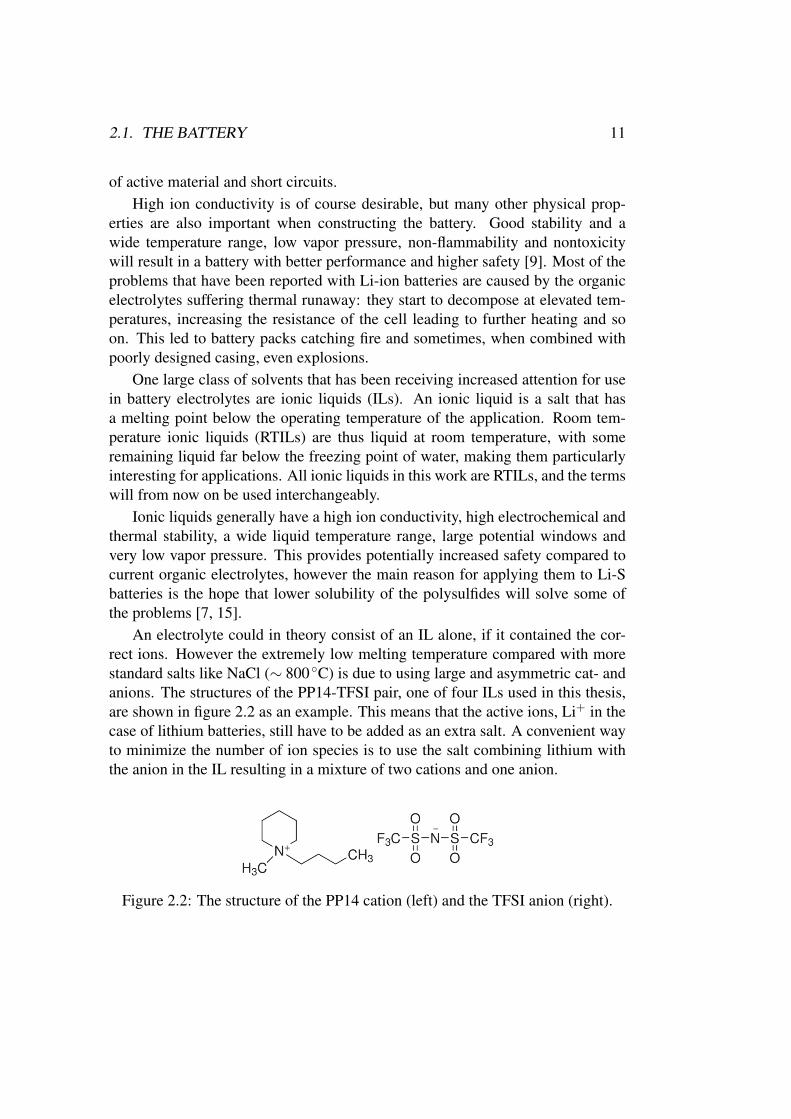
A large amount of very useful information about the operation of a battery canbe gained by relatively simple means due to the way they work: the most rele-vant facts are often the voltage, current and resistance, and how they change withtime. These quantities are easy to measure with high precision and resolutionwith automated acquisition and even analysis by a computer. One of the mostbasic measurements is the discharge curve shown in figure 2.3 where the voltageas a function of time has been measured. The testing equipment ensures that aconstant current flows during the discharge so that the x-axis is easily changedfrom time to capacity.
Ideal curve
Curve 1 Curve 2
Time
Volta
ge
Figure 2.3: Cell voltage as a function of time (capacity) during discharge, showingboth the ideal case and a general representation of a real battery.
For an ideal battery the discharge curve would show a constant potential equalto the OCV until the total capacity has been depleted and the voltage drops tozero. A real battery may start at OCV but will then show a sloping behavior,Curve 1 in figure 2.3, due to polarization and increasing internal resistance. Therelatively flat section of the curve is called the plateau and defines the nominalvoltage and is usually the voltage given for a battery, i.e. 1.5 V for alkali batter-ies. There may be multiple plateaus at consecutively lower voltages if there areseveral different reactions occurring during discharge. If the discharge current ishigher (larger load) the resistive voltage drop and losses increase giving a lowerand more sloped curve (Curve 2). The discharge is stopped at the cutoff voltagewhich is set as the point where most of the useful capacity has been used (primarybatteries) or beyond which the battery would suffer loss of reversibility and/ordamage (secondary batteries) [9].

2.2. CHARACTERIZING BATTERIES 13
The corresponding charge curve will show a similar, but reversed, behav-ior. The voltage during charging is always higher then during discharge and thehysteresis, due to losses, demonstrates the efficiency of the process. Multiplecharge/discharge cycles are done in order to determine the cycleability or lifetimeof the cell, with the end normally defined as a capacity of 80% of original capac-ity. In order to be commercially viable a battery is considered to need to withstandat least 300 cycles [8].

Chapter 3
Materials & Procedures
All materials and samples were handled in a glove box with a protective argonatmosphere in order to avoid contamination with water or oxygen. Samples con-taining sulfur species were stored wrapped in aluminum foil since some of themmight be photosensitive [16]. When samples were removed for testing the vialsand cuvettes were further sealed using Parafilm R© M.
3.1 Ionic liquidsThe following IL were used in the work presented in this thesis:
PP14-TFSI: 1-butyl-1-methylpiperidinium bis(triflouromethylsulfonyl)imide
PYR14-TFSI: 1-butyl-1-methylpyrrolidinium bis(triflouromethylsulfonyl)imide
BMIM-TFSI: 1-butyl-3-methylimidazolium bis(triflouromethylsulfonyl)imide
BMIM-SCN: 1-butyl-3-methylimidazolium thiocyanate
The first two were obtained from Sigma-Aldrich and the two imidazoliumbased ones from IOLITEC. Some of their basic properties can be seen in table 3.1with the data provided by the suppliers.
These are all clear liquids at room temperature with PP14-TFSI being slightlyyellow and BMIM-SCN having a strong yellow color. All electrolytes were madeusing lithium bis(triflouromethylsulfonyl)imide salt (LiTFSI), 99.95%, from Sigma-Aldrich in a 0.9:0.1 molar fraction. The electrolytes were stirred at 400 rpm and60 ◦C for at least 12 h using a magnetic stirrer with a hot plate and temperaturecontrol. This was done to ensure homogeneity and complete dissolution of thesalt. They were then stored at room temperature and stirred again before use.

3.2. REFERENCE SAMPLE PREPARATION 15
Table 3.1: Properties of the ionic liquids.
IL Formula MW (g/mol) ρ (g/cm3) PurityPP14-TFSI C12H22F6N2O4S2 436.43 1.34 97%
PYR14-TFSI C11H20F6N2O4S2 422.41 1.40 98.5%BMIM-TFSI C10H15F6N3O4S2 419.36 1.43 99%BMIM-SCN C9H15N3S 197.30 1.07 98%
3.2 Reference sample preparation
The reference samples were prepared using reagent grade sulfur powder and lithiumsulfide powder (99%), both from Sigma-Aldrich, in stoichiometric proportionscorresponding to Li2S4, Li2S6 and Li2S8 as well as pure S and pure Li2S. Theamount of powder was chosen so that the ratio of polysulfide to ionic liquid was0.02 mol/mol (which corresponds to an molar fraction of ∼ 0.0177). This con-centration was based on the accuracy of the analytic balance used (±0.1 mg) andthe wish to minimize the amount of expensive IL. The powders were measured ina plastic weighing boat and then put in a vial with the corresponding amount ofelectrolyte and stirred at 400 rpm and 60 ◦C.
More dilute samples, with concentrations of 0.002, 0.001 and 0.0001 mol/mol(polysulfide/IL), were also prepared using the PP14-TFSI based electrolyte. Thesewere made by first creating separate suspensions of S and Li2S powders and thenadding small amounts of the suspensions to a vial of electrolyte. These were thenstirred and heated as before.
3.3 UV-Vis spectroscopy
The main experimental method used to investigate the polysulfide species presentin the electrolytes was absorption spectroscopy with ultraviolet (UV) and visiblelight. This part of the electromagnetic spectrum has an energy that corresponds toelectronic transitions of the valence electrons in atoms and molecules. In order forthese electrons to interact with a photon its energy must closely match the energydifference between two of the electronic levels. This means that every elementand compound will absorb or emit an unique set of wavelengths which thereforecan be used as an "fingerprint" to identify the species present in a sample.
Absorption spectra are obtained by sending light of an known intensity throughthe sample and recording the resulting decrease in intensity as a function of wave-length. In the ideal case, a single element in a gaseous form, the spectra willconsist of a collection of well-defined narrow lines. However, the chemical bonds

16 CHAPTER 3. MATERIALS & PROCEDURES
Table 3.2: Literature values for the wavelengths (in nm) of absorption peak max-ima and their assigned polysulfide spices.
System S−2 S2−2 S2−
3 S2−4 S2−
5 S2−6 S2−
7 S2−8 S−3 S−4 Ref
DMF 250 280 344 420 435 340, 450 470 490 (S2−8l ), 355 (S2−
8c ) 600 ∼700 [18][C4mim][DCA] 440 ∼350, 460 620 [11]
of molecules mean that their absorption wavelengths are changed by the pres-ence of vibrational and rotational modes, turning single lines into collections ofclosely spaced lines which are themselves divided even further. The motion ofthe molecules combined with the limit of resolution of the instruments result inspectra with broad and often overlapping bands, especially in the case of liquidsamples.
Absorption spectroscopy is a versatile, common, quick and easy to use methodand has been used in much of the previous work on identifying polysulfides insolutions [11, 16, 17, 18, 19]. Many of the different peaks found in literature andtheir assigned species are shown in table 3.2.
(a) Front and side view with a cap.
2.0
1.5
1.0
0.5
0.0
Abso
rbance
800700600500400300200
Wavelength (nm)
BRANDT UV Cuvette PS Cuvette Quartz Cuvette
(b) The absorbance of the BRANDTM
UV cuvettes.
Figure 3.1: The BRANDTM
UV cuvettes used for the UV-Vis absorption spec-troscopy measurements.
The instrument used in this work is a Cary 5000 UV-Vis-NIR Spectropho-tometer from Varian Inc. It uses a monochromator to select a specific wavelengthfrom one of its broad-spectrum light sources, 175−3300 nm. It has an exchange-able sample holder to enable many different kinds of samples and the light pathis split to provide a reference beam if needed - this signal is subtracted from the
3.4. CYCLIC VOLTAMETRY 17
measurement.The samples were put in disposable BRAND
TMUV micro cuvettes (figure 3.1)
which can hold samples of 70−550 µL and have a path length of 10 mm. Plasticdisposable cuvettes (usually made from PS or PMMA) are not transparent to UVlight but these have a special composition that enable measurements from 220 to900 nm, which is confirmed by a comparison of the spectra shown in figure 3.1b.Cuvettes made of quartz have superior optical properties and represent the idealcase, but they are orders of magnitude more expensive and require cleaning andreuse.
All spectra were taken using the default settings - a range from 800 down to200 nm (with the data corresponding to the shortest wavelengths being discarded)and a scan speed of 3 nm/s using either air, an empty cuvette or an electrolytesample as a reference.
3.4 Cyclic VoltametryAn other important tool was cyclic voltammetry, CV, the main electrochemicalanalysis method employed in this thesis. It can be seen as an inverse to the amper-ostatic discharge measurement - the voltage between the two electrodes is closelycontrolled and scanned at a constant rate while the resulting current is measured.The experimental setup for CV measurements uses three electrodes: the workingelectrode is the one being investigated, the counter electrode provides the currentand the reference electrode is the reference point for the voltage. The counterelectrode and the reference electrode can be the same physical electrode if thematerial is a convenient reference and has a good interface with the electrolyte.
The current produced depends on the charge transfer reactions that occur at theelectrode. If no reactions are taking place at a certain voltage the correspondingcurrent is only due to capacitive effects an can be neglected for low scan rates (∼1mV/s). The current will start to increase when the potential approaches that ofthe reaction, rapidly reaching a peak limited by the diffusion of the active speciesin the electrolyte. As these are depleted the current will decrease. When the po-tential sweep changes direction the reaction reverses and produces a second peak,see figure 3.2a. The current direction is defined so that the reduction peak is nega-tive and the corresponding oxidation peak is positive. For instantaneous reactionswith unlimited diffusion the result would be two sharp peaks at the same voltage,but even a very fast and highly reversible reaction will have a small potential dif-ference between the two peaks (figure 3.2b). For systems with slow kinetics thepeaks will be quite separated and broad, figure 3.2c, while an irreversible reactiononly shows one peak as in figure 3.2d [9].
A single CV trace is an easy way to determine the voltages at which the dif-

18 CHAPTER 3. MATERIALS & PROCEDURES
Cur
rent
I Potential E
a
ΔE
Potential E
d
Cur
rent
I Potential E
c
ΔE Cur
rent
I Potential E
b
ΔE Cur
rent
I
Figure 3.2: a) shows a generalized cyclic voltammogram for a reversible reactionwith one reduction peak and one oxidation peak; b) is a very reversible system likea thin film deposited on the electrode while c) shows a quasi-reversible reaction.The result of an irreversible reaction is displayed in d).
ferent reactions in the cell occur, their reversibility and kinetics as well as whetherthere are several different reactions involved. More advanced measurements canprovide further details by varying the scan speed and range and using differentelectrode materials and configurations.
3.5 Cell assembly and CV testing
The CV testing was performed using computer controlled Ivium-n-Stat batterytester with 8 channels. It can do both potentiostatic and galvanostatic measure-ments as well as frequency impedance analysis. For the CV traces the potentialwas set to the OCV of the cell and then scanned with 0.1 mV/s between 1.5 Vand 3.2 V and the resulting current was measured.
The performance of the Li-S system with 0.9 PP14-TFSI + 0.1 LiTFSI elec-trolyte was tested using reusable Swagelok type cells. The design of these stain-less steel cells is shown in figures 3.3 and 3.4: the bottom electrode is a cylinderwith a round opening into which the piston shaped top electrode fits snuggly us-
3.5. CELL ASSEMBLY AND CV TESTING 19
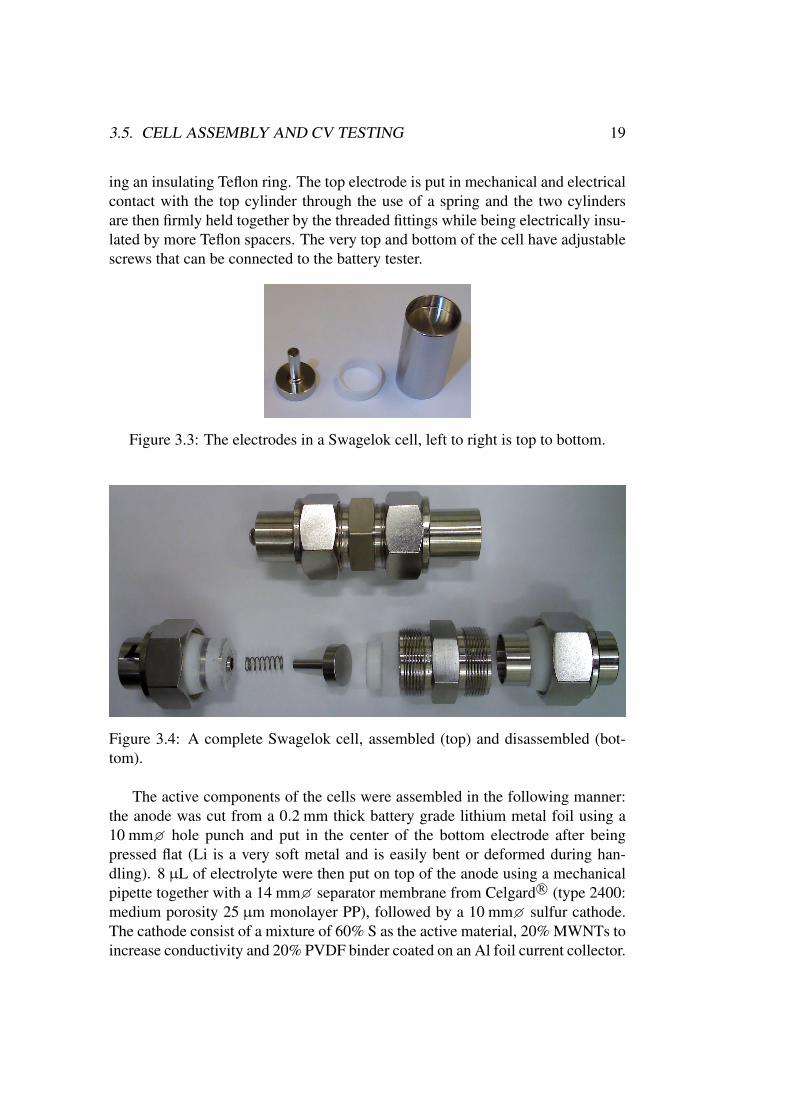
ing an insulating Teflon ring. The top electrode is put in mechanical and electricalcontact with the top cylinder through the use of a spring and the two cylindersare then firmly held together by the threaded fittings while being electrically insu-lated by more Teflon spacers. The very top and bottom of the cell have adjustablescrews that can be connected to the battery tester.
Figure 3.3: The electrodes in a Swagelok cell, left to right is top to bottom.
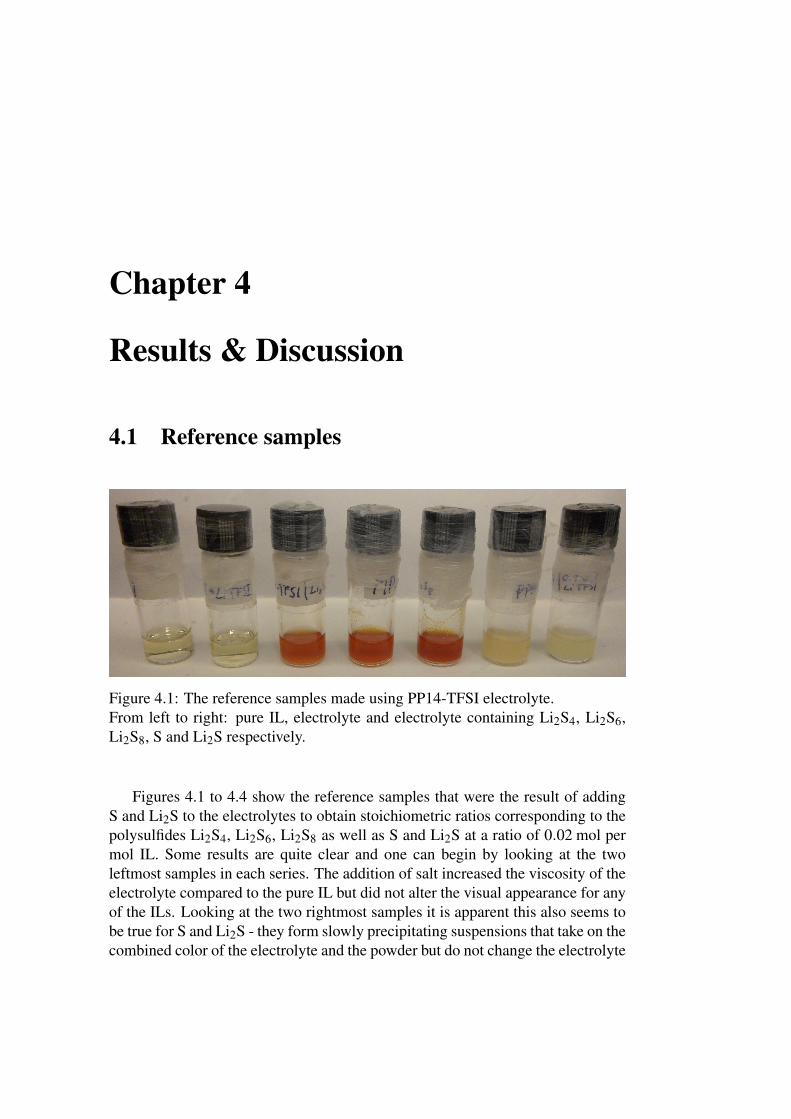
Figure 3.4: A complete Swagelok cell, assembled (top) and disassembled (bot-tom).
The active components of the cells were assembled in the following manner:the anode was cut from a 0.2 mm thick battery grade lithium metal foil using a10 mm� hole punch and put in the center of the bottom electrode after beingpressed flat (Li is a very soft metal and is easily bent or deformed during han-dling). 8 µL of electrolyte were then put on top of the anode using a mechanicalpipette together with a 14 mm� separator membrane from Celgard R© (type 2400:medium porosity 25 µm monolayer PP), followed by a 10 mm� sulfur cathode.The cathode consist of a mixture of 60% S as the active material, 20% MWNTs toincrease conductivity and 20% PVDF binder coated on an Al foil current collector.

20 CHAPTER 3. MATERIALS & PROCEDURES
The top electrode was then used to gently compress the anode-separator-cathodestack and the rest of the cell assembled. The spring ensured that there is a lightcompression providing good electrical contact and the Teflon seals makes the cellairtight so that it can be removed from the glove box and tested.
After testing the cell was disassembled and the separator, containing the ma-jority of the electrolyte and the polysulfides of interest, was removed and put intoa vial. 700 mg of electrolyte, approximately corresponding to a full cuvette, wasthen added to the vial and stirred together with the separator for 30 min @ 400rpm. A sample was then extracted using a glass pipette, put into a cuvette andmeasured in the spectrophotometer.
Chapter 4
Results & Discussion
4.1 Reference samples
Figure 4.1: The reference samples made using PP14-TFSI electrolyte.From left to right: pure IL, electrolyte and electrolyte containing Li2S4, Li2S6,Li2S8, S and Li2S respectively.
Figures 4.1 to 4.4 show the reference samples that were the result of addingS and Li2S to the electrolytes to obtain stoichiometric ratios corresponding to thepolysulfides Li2S4, Li2S6, Li2S8 as well as S and Li2S at a ratio of 0.02 mol permol IL. Some results are quite clear and one can begin by looking at the twoleftmost samples in each series. The addition of salt increased the viscosity of theelectrolyte compared to the pure IL but did not alter the visual appearance for anyof the ILs. Looking at the two rightmost samples it is apparent this also seems tobe true for S and Li2S - they form slowly precipitating suspensions that take on thecombined color of the electrolyte and the powder but do not change the electrolyte
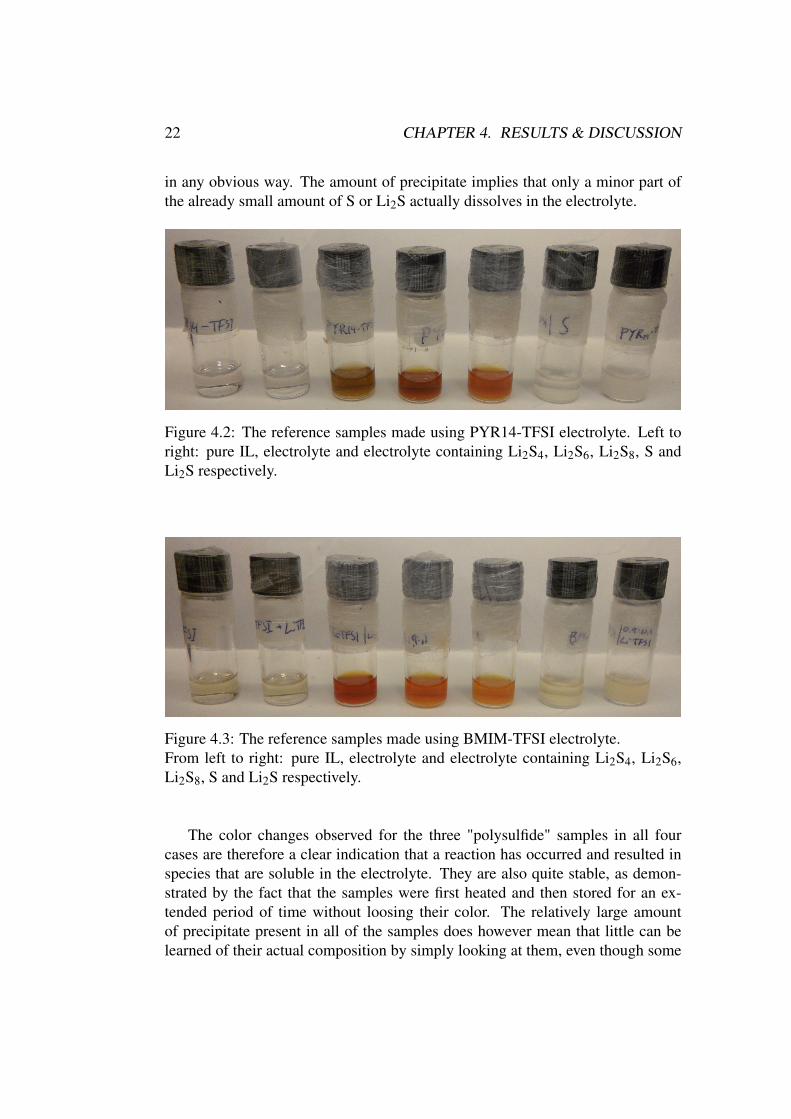
22 CHAPTER 4. RESULTS & DISCUSSION
in any obvious way. The amount of precipitate implies that only a minor part ofthe already small amount of S or Li2S actually dissolves in the electrolyte.
Figure 4.2: The reference samples made using PYR14-TFSI electrolyte. Left toright: pure IL, electrolyte and electrolyte containing Li2S4, Li2S6, Li2S8, S andLi2S respectively.
Figure 4.3: The reference samples made using BMIM-TFSI electrolyte.From left to right: pure IL, electrolyte and electrolyte containing Li2S4, Li2S6,Li2S8, S and Li2S respectively.
The color changes observed for the three "polysulfide" samples in all fourcases are therefore a clear indication that a reaction has occurred and resulted inspecies that are soluble in the electrolyte. They are also quite stable, as demon-strated by the fact that the samples were first heated and then stored for an ex-tended period of time without loosing their color. The relatively large amountof precipitate present in all of the samples does however mean that little can belearned of their actual composition by simply looking at them, even though some

4.1. REFERENCE SAMPLES 23
small differences between some of the samples using the same electrolyte can beseen.
Figure 4.4: The reference samples made using BMIM-SCN electrolyte.From left to right: pure IL, electrolyte and electrolyte containing Li2S4, Li2S6,Li2S8, S and Li2S respectively. The Li2S8 sample, identical in appearance to theother two, was being tested.
4.1.1 Raman spectroscopy
It was originally planned that Raman spectroscopy would be one of the majortechniques used. Raman scattering occurs when a photon scatters inelastically ofan electron and interacts with a vibrational or rotational mode. It is therefore verysensitive to the finer details of bonds between atoms and molecules and their sur-roundings. This combined with the extensive experience of Raman spectroscopyin the group made it a logical starting point. There are also many examples ofusing Raman spectroscopy to investigate polysulfides in solution in the literature.
The method focuses monochromatic light from a laser on the sample and de-tect the very small shifts in wavelength that are the result of the interaction. Theresulting spectra is often plotted as intensity as a function of the difference in in-verse wavelength, which is proportional to the k-vector and measured in /cm, ofthe scattered light compared to the original laser wavelength.
One of the drawbacks of Raman spectroscopy is that the probability of a pho-ton scattering inelasticity is low which results in a low signal to noise ratio. Thiscombined with the low concentration of polysulfides in the samples resulted inspectra that were almost indistinguishable to those of the IL electrolyte. The lackof usable results, as demonstrated by figure 4.5, led to the decision to changemethod and use UV-Vis spectroscopy instead.

24 CHAPTER 4. RESULTS & DISCUSSION
0.4
0.3
0.2
0.1
0.0
Inte
nsi
ty
16001400120010008006004002000
Wavenumber (cm-1
)
PP14-TFSI electrolyte containing Li2S4
PP14-TFSI electrolyte
Figure 4.5: Raman spectra of the PP14-TFSI electrolyte with and without Li2S4.
4.1.2 UV-Vis spectroscopy
UV-Vis spectroscopy is capable of detecting very small concentrations of absorb-ing species. In this work the use of cuvettes with the standard 1 cm path lengthled to the opposite problem compared to Raman spectroscopy, i.e. too much sig-nal, even though the Cary 5000 is capable of measuring up to an absorbance of 8.Only the pure PP14-TFSI and electrolyte samples produced useful spectra, shownin figure 4.6.
2.0
1.5
1.0
0.5
0.0
Abso
rbance
800700600500400300
Wavelength (nm)
Pure PP14-TFSI 0.9PP14-TFSI + 0.1LiTFSI
Figure 4.6: UV-Vis spectra of pure PP14-TFSI and 0.9 PP14-TFSI + 0.1 LiTFSIelectrolyte.
4.1. REFERENCE SAMPLES 25
The first thing to note is that the addition of LiTFSI salt does not affect theabsorbance in the wavelength range covered. This was to be expected, since thesalt and the IL share the TFSI anion and the electrolyte corresponds to exchanging10% of the PP14 cations for Li+ (which apparently does not have any discernibleabsorption lines in this range). The most important result, however, is that theelectrolyte by itself does not absorb too strongly in the region of interest. It istherefore possible to use an electrolyte reference sample to compensate for theelectrolyte signal and obtain the extra absorbance caused any polysulfides present.
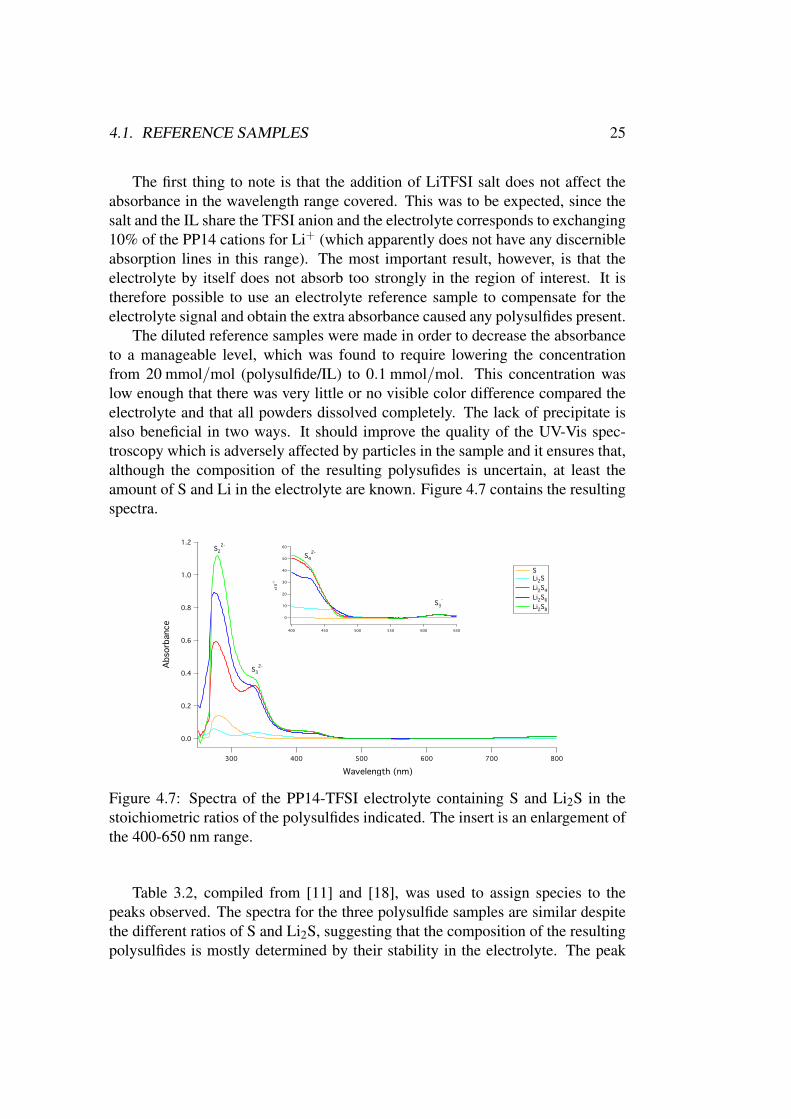
The diluted reference samples were made in order to decrease the absorbanceto a manageable level, which was found to require lowering the concentrationfrom 20 mmol/mol (polysulfide/IL) to 0.1 mmol/mol. This concentration waslow enough that there was very little or no visible color difference compared theelectrolyte and that all powders dissolved completely. The lack of precipitate isalso beneficial in two ways. It should improve the quality of the UV-Vis spec-troscopy which is adversely affected by particles in the sample and it ensures that,although the composition of the resulting polysufides is uncertain, at least theamount of S and Li in the electrolyte are known. Figure 4.7 contains the resultingspectra.
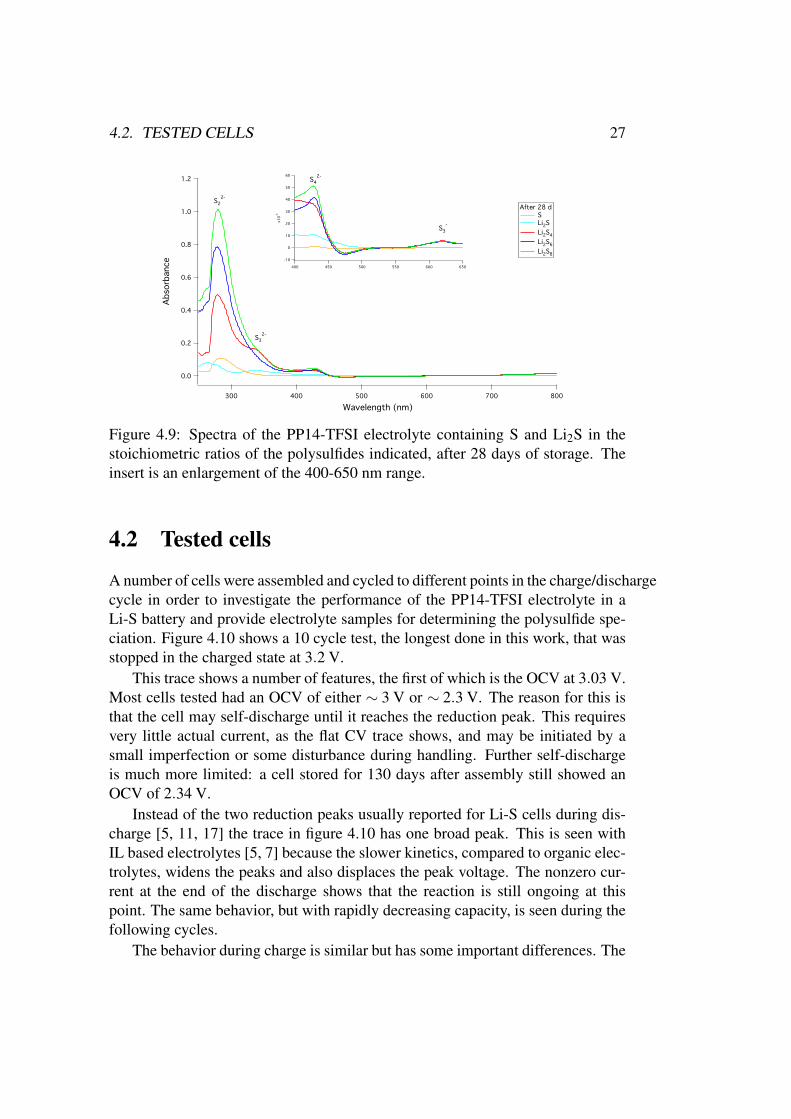
Figure 4.7: Spectra of the PP14-TFSI electrolyte containing S and Li2S in thestoichiometric ratios of the polysulfides indicated. The insert is an enlargement ofthe 400-650 nm range.
Table 3.2, compiled from [11] and [18], was used to assign species to thepeaks observed. The spectra for the three polysulfide samples are similar despitethe different ratios of S and Li2S, suggesting that the composition of the resultingpolysulfides is mostly determined by their stability in the electrolyte. The peak

26 CHAPTER 4. RESULTS & DISCUSSION
at 280 nm is due to S2−2 according to [18] and is present in all samples, being the
only clear peak in the pure S sample. The other three peaks easily identified in thespectra are two for S2−
3 and S2−4 and a small one due to S·−3 . The intensity of the
peaks for S2−3 and S2−
4 , normalized by the signal for S2−2 , are displayed in figure
4.8. It is clear from these two figures that higher ratios of Li to S results in a largertotal amount of polysulfides, except when corresponding to the more stable Li2S,and to more of the polysulfides being S2−
3 or S2−4 .
0.6
0.5
0.4
0.3
0.2
0.1
0.0
Rati
o o
f S
3
2- p
eak t
o S
2
2- p
eak
2.01.51.00.50.0
Ratio of Li to S
S Li2SLi2S4Li2S6Li2S8
S3
2-
S4
2-
Figure 4.8: The height of the S2−3 peak (black) and the S2−
4 peak (red) comparedto the S2−
2 peak for the different ratios of lithium to sulfur.
The species present in these samples must result from the disproportion reac-tions of the polysulfides, as they were simply the result of mixing S and Li2S - thetwo compounds containing sulfur and lithium that are stable outside of solutions.The weak absorbance for the radical S·−3 is noteworthy: dilute solutions of S insome ILs produces enough of these species to turn the solution bright blue [19],while other ILs have been reported to strongly inhibit the formation of S·−3 duringdischarge [11].
Multiple test of the same samples during one measurement session gave iden-tical results, which demonstrates that the they are not degraded by the measure-ment itself. Redoing the measurements in figure 4.7 after storing the samples for28 days gave the slightly different results shown in figure 4.9. These spectra im-ply that the S2−
3 is somewhat less stable in the PP14-TFSI electrolyte than S2−4
and S·−3 .
4.2. TESTED CELLS 27
Figure 4.9: Spectra of the PP14-TFSI electrolyte containing S and Li2S in thestoichiometric ratios of the polysulfides indicated, after 28 days of storage. Theinsert is an enlargement of the 400-650 nm range.
4.2 Tested cells
A number of cells were assembled and cycled to different points in the charge/dischargecycle in order to investigate the performance of the PP14-TFSI electrolyte in aLi-S battery and provide electrolyte samples for determining the polysulfide spe-ciation. Figure 4.10 shows a 10 cycle test, the longest done in this work, that wasstopped in the charged state at 3.2 V.
This trace shows a number of features, the first of which is the OCV at 3.03 V.Most cells tested had an OCV of either ∼ 3 V or ∼ 2.3 V. The reason for this isthat the cell may self-discharge until it reaches the reduction peak. This requiresvery little actual current, as the flat CV trace shows, and may be initiated by asmall imperfection or some disturbance during handling. Further self-dischargeis much more limited: a cell stored for 130 days after assembly still showed anOCV of 2.34 V.
Instead of the two reduction peaks usually reported for Li-S cells during dis-charge [5, 11, 17] the trace in figure 4.10 has one broad peak. This is seen withIL based electrolytes [5, 7] because the slower kinetics, compared to organic elec-trolytes, widens the peaks and also displaces the peak voltage. The nonzero cur-rent at the end of the discharge shows that the reaction is still ongoing at thispoint. The same behavior, but with rapidly decreasing capacity, is seen during thefollowing cycles.
The behavior during charge is similar but has some important differences. The

28 CHAPTER 4. RESULTS & DISCUSSION
-60
-40
-20
0
20
40
Curr
ent
(µA
)
3.23.02.82.62.42.22.01.81.6
Voltage (V)
Cycle 1 (OCV to 3.2V) Cycle 2 to 10
Figure 4.10: A typical CV trace over 10 cycles. The vertical line at 3.2 V is dueto a slight pause in the measurement which allows charge to build up.
oxidation peak is a single peak with a large shoulder, demonstrating that the oxi-dation of the polysulfides continues throughout the charge with the easily oxidizedspecies being consumed first and then progressively moving on to the long chainpolysulfides. However, the shoulder rapidly disappears with continued cyclingleading to the conclusion that these species are being lost, likely due to the forma-tion of insoluble deposits.
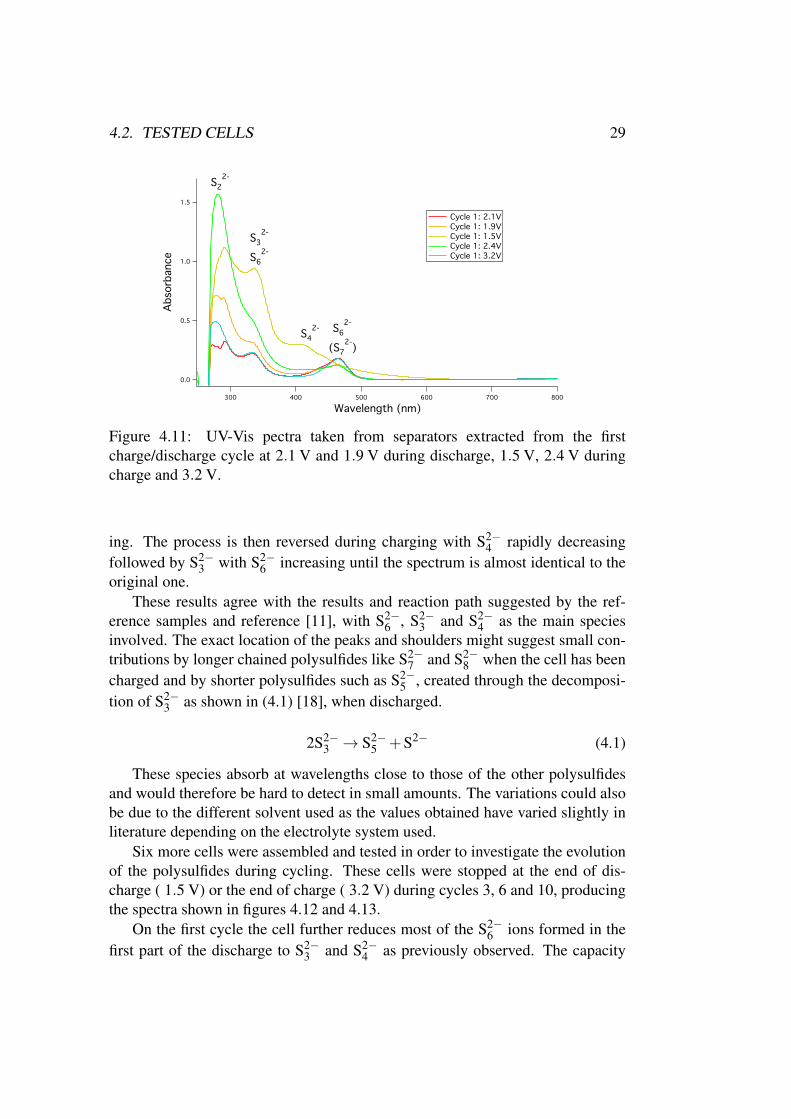
Figure 4.10 suggests that there are five points during the cycle that should beof interests when doing UV-Vis spectroscopy to examine the polysulfide specia-tion. These are the first and the second part of the reduction peak at ∼ 2.1 V and∼ 1.9 V, the discharged state at 1.5 V, the oxidation peak at ∼ 2.4 V and finallythe charged state at 3.2 V. The spectra corresponding to these points during thefirst charge/discharge cycle are shown in figure 4.11.
When analyzing these spectra it is important to remember that the absoluteintensity of the peaks is dependent on the concentration of polysulfides. Eventhough the samples were all prepared in the same way there is no guarantee thatthe resulting concentrations are the same. The conclusions drawn can thereforeonly be based on the relative height of the peaks for each individual spectrum.
During the beginning of the reduction peak at 2.1 V during discharge the spec-trum has a large contribution from S2−
6 , possibly combined with contributionsfrom S2−
3 and S2−7 . The concentration of S2−
3 increases and S2−6 decreases toward
the second part of the reduction peak at 1.9 V and when 1.5 V is reached thereare large amounts of S2−
3 as well as S2−4 with only a small amount of S2−
6 remain-
4.2. TESTED CELLS 29
1.5
1.0
0.5
0.0
Abso
rbance
800700600500400300
Wavelength (nm)
Cycle 1: 2.1V Cycle 1: 1.9V Cycle 1: 1.5V Cycle 1: 2.4V Cycle 1: 3.2V
S4
2- S6
2-
(S7
2-)
S3
2-
S6
2-
S2
2-
Figure 4.11: UV-Vis pectra taken from separators extracted from the firstcharge/discharge cycle at 2.1 V and 1.9 V during discharge, 1.5 V, 2.4 V duringcharge and 3.2 V.
ing. The process is then reversed during charging with S2−4 rapidly decreasing
followed by S2−3 with S2−
6 increasing until the spectrum is almost identical to theoriginal one.
These results agree with the results and reaction path suggested by the ref-erence samples and reference [11], with S2−
6 , S2−3 and S2−
4 as the main speciesinvolved. The exact location of the peaks and shoulders might suggest small con-tributions by longer chained polysulfides like S2−
7 and S2−8 when the cell has been
charged and by shorter polysulfides such as S2−5 , created through the decomposi-
tion of S2−3 as shown in (4.1) [18], when discharged.
2S2−3 → S2−
5 +S2− (4.1)
These species absorb at wavelengths close to those of the other polysulfidesand would therefore be hard to detect in small amounts. The variations could alsobe due to the different solvent used as the values obtained have varied slightly inliterature depending on the electrolyte system used.
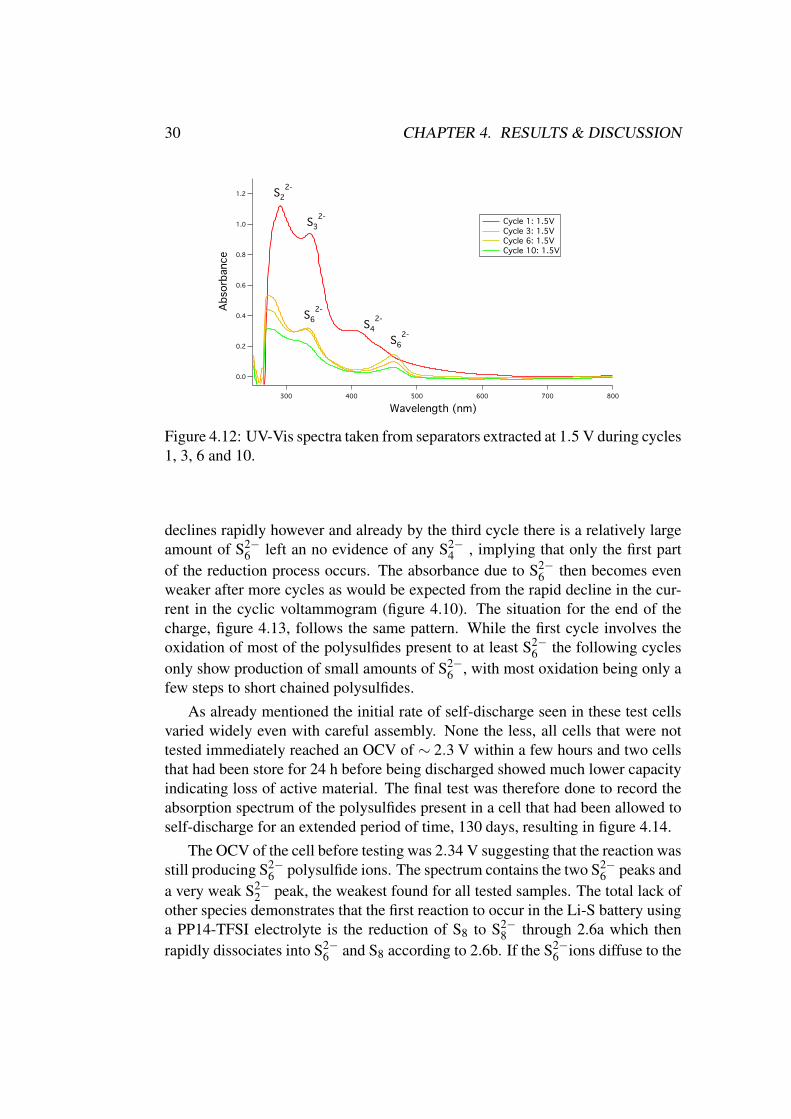
Six more cells were assembled and tested in order to investigate the evolutionof the polysulfides during cycling. These cells were stopped at the end of dis-charge ( 1.5 V) or the end of charge ( 3.2 V) during cycles 3, 6 and 10, producingthe spectra shown in figures 4.12 and 4.13.
On the first cycle the cell further reduces most of the S2−6 ions formed in the
first part of the discharge to S2−3 and S2−
4 as previously observed. The capacity
30 CHAPTER 4. RESULTS & DISCUSSION
1.2
1.0
0.8
0.6
0.4
0.2
0.0
Abso
rbance
800700600500400300
Wavelength (nm)
Cycle 1: 1.5V Cycle 3: 1.5V Cycle 6: 1.5V Cycle 10: 1.5V
S4
2-
S3
2-
S2
2-
S6
2-
S6
2-
Figure 4.12: UV-Vis spectra taken from separators extracted at 1.5 V during cycles1, 3, 6 and 10.
declines rapidly however and already by the third cycle there is a relatively largeamount of S2−
6 left an no evidence of any S2−4 , implying that only the first part
of the reduction process occurs. The absorbance due to S2−6 then becomes even
weaker after more cycles as would be expected from the rapid decline in the cur-rent in the cyclic voltammogram (figure 4.10). The situation for the end of thecharge, figure 4.13, follows the same pattern. While the first cycle involves theoxidation of most of the polysulfides present to at least S2−
6 the following cyclesonly show production of small amounts of S2−
6 , with most oxidation being only afew steps to short chained polysulfides.
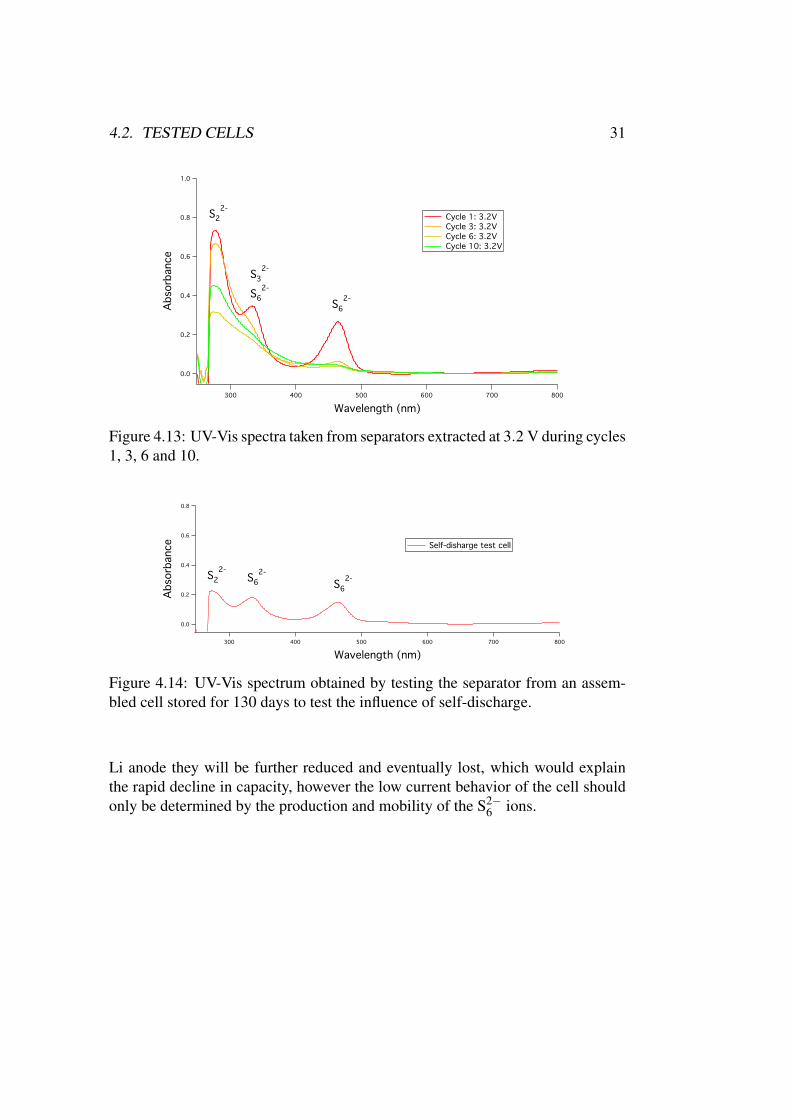
As already mentioned the initial rate of self-discharge seen in these test cellsvaried widely even with careful assembly. None the less, all cells that were nottested immediately reached an OCV of ∼ 2.3 V within a few hours and two cellsthat had been store for 24 h before being discharged showed much lower capacityindicating loss of active material. The final test was therefore done to record theabsorption spectrum of the polysulfides present in a cell that had been allowed toself-discharge for an extended period of time, 130 days, resulting in figure 4.14.
The OCV of the cell before testing was 2.34 V suggesting that the reaction wasstill producing S2−
6 polysulfide ions. The spectrum contains the two S2−6 peaks and
a very weak S2−2 peak, the weakest found for all tested samples. The total lack of
other species demonstrates that the first reaction to occur in the Li-S battery usinga PP14-TFSI electrolyte is the reduction of S8 to S2−
8 through 2.6a which thenrapidly dissociates into S2−
6 and S8 according to 2.6b. If the S2−6 ions diffuse to the
4.2. TESTED CELLS 31
1.0
0.8
0.6
0.4
0.2
0.0
Abso
rbance
800700600500400300
Wavelength (nm)
Cycle 1: 3.2V Cycle 3: 3.2V Cycle 6: 3.2V Cycle 10: 3.2V
S6
2-
S3
2-
S6
2-
S2
2-
Figure 4.13: UV-Vis spectra taken from separators extracted at 3.2 V during cycles1, 3, 6 and 10.
0.8
0.6
0.4
0.2
0.0
Abso
rbance
800700600500400300
Wavelength (nm)
Self-disharge test cell
S6
2-
S6
2-
S2
2-
Figure 4.14: UV-Vis spectrum obtained by testing the separator from an assem-bled cell stored for 130 days to test the influence of self-discharge.
Li anode they will be further reduced and eventually lost, which would explainthe rapid decline in capacity, however the low current behavior of the cell shouldonly be determined by the production and mobility of the S2−
6 ions.
Chapter 5
Conclusion
The four RTIL investigated in this thesis, PP14-TFSI, PYR14-TFSI, BMIM-TFSIand BMIM-SCN, all made electrolytes that dissolved some polysulfide ions whenS and Li2S powders where added. This was evident due to strong changes in colorwhen the electrolytes contained both S and Li2S but not when mixed with eithercompound alone. The solubility, somewhat higher for BMIM-SCN compared tothe other three ILs, was much lower than for most organic electrolytes and all butthe lowest concentrations led to precipitation.
Deeper investigation of the 0.9 PP14-TFSI + 0.1 LiTFSI system using cyclicvoltammetry, combined with absorption spectroscopy in the region 200−800 nmon electrolyte samples taken from test cells, suggest the same reaction mecha-nisms in the IL electrolyte as found previously for organic electrolytes [11]. TheIL electrolyte gives a CV trace that has one broad reduction peak instead of thetwo separate peaks observed for conventional electrolytes. The first reaction tooccur during the discharge is the reduction of S8 to S2−
6 , with the disassociationinto S−3 which often follows being strongly inhibited. The S2−
6 ions are then fur-ther reduced to S2−
3 and S2−4 as the discharge proceeds. S2−
2 is present at all timesbut the reduction taking place in the electrolyte appears to be limited to S2−
3 andS2−
4 .The reactions follow the opposite path during charging and shows good re-
versibility in that most of the shorter polysulfides are oxidized. There is howevera large loss of the active species resulting in a rapidly declining capacity withcycling. This disagrees with [7] where it is claimed the lower solubility of poly-sulfides in PP14-TFSI electrolyte is enough to suppress the dissolution of the in-termediate species and ensure good cycle ability. It should however be noted thatthe electrolyte used in that work had slightly more than three times the concentra-tion of LiTFSI salt compared to the 0.9:0.1 molar ratio used for this thesis.

Chapter 6
Future Work
As is so often the case, the scope of this thesis had do be limited due to time con-strains. However, research on this topic is still highly relevant and is continuing.Work has already been started/is being done i parallel/has been done in parallel toinvestigate the behavior of polysulfides in another ionic liquid using the methodsdeveloped here. This effort could be expanded even further to include the otherionic liquid electrolytes discussed earlier, other similar electrolyte systems of in-terest or differently structured sulfur cathodes.
Another possibility is to use an in situ cell to gain an even deeper understand-ing of the reactions during discharge and charge. Such work has been describedin [17, 18] and enabled the continuous measuring of spectra for any point on thedischarge/charge curve for the same cell. This setup could minimize many ofthe current sources of errors and might also enable measurements on the activesurfaces themselves during cycling.

Bibliography
[1] P.G. Bruce, S.A. Freunberger, L.J. Hardwick, and J.M. Tarascon. Li–O2and Li–S batteries with high energy storage. Nature materials, 11(1):19–29,2011.
[2] Xue-Ping Gao and Han-Xi Yang. Multi-electron reaction materials for highenergy density batteries. Energy & Environmental Science, 3(2):174, 2010.
[3] Xiulei Ji and Linda F. Nazar. Advances in Li–S batteries. Journal of Mate-rials Chemistry, 20(44):9821, 2010.
[4] Bruno Scrosati, Jusef Hassoun, and Yang-Kook Sun. Lithium-ion batteries.A look into the future. Energy & Environmental Science, 4(9):3287, 2011.
[5] J Wang, S Y Chew, Z W Zhao, S Ashraf, D Wexler, J Chen, S H Ng, S LChou, and H K Liu. Sulfur–mesoporous carbon composites in conjunctionwith a novel ionic liquid electrolyte for lithium rechargeable batteries. Car-bon, 46(2):229–235, February 2008.
[6] M Galinski, A Lewandowski, and I Stepniak. Ionic liquids as electrolytes.Electrochimica Acta, 51(26):5567–5580, 2006.
[7] L.X. Yuan, J.K. Feng, X.P. Ai, Y.L. Cao, S.L. Chen, and H.X. Yang. Im-proved dischargeability and reversibility of sulfur cathode in a novel ionicliquid electrolyte. Electrochemistry Communications, 8(4):610–614, April2006.
[8] Martin Winter and Ralph J Brodd. What are batteries, fuel cells, and super-capacitors? Chemical reviews, 104(10):4245–69, October 2004.
[9] Thomas B. Reddy and David Linden. Linden’s Handbook of Batteries,Fourth Edition. McGraw-Hill, 4th ed. edition, 2011.
[10] Bruno Scrosati and Jürgen Garche. Lithium batteries: Status, prospects andfuture. Journal of Power Sources, 195(9):2419–2430, May 2010.
BIBLIOGRAPHY 35
[11] Ninie S a Manan, Leigh Aldous, Yatimah Alias, Paul Murray, Lesley J Yel-lowlees, M Cristina Lagunas, and Christopher Hardacre. Electrochemistryof sulfur and polysulfides in ionic liquids. The journal of physical chemistry.B, 115(47):13873–9, December 2011.
[12] Guangyuan Zheng, Yuan Yang, Judy J Cha, Seung Sae Hong, and Yi Cui.Hollow carbon nanofiber-encapsulated sulfur cathodes for high specific ca-pacity rechargeable lithium batteries. Nano letters, 11(10):4462–7, October2011.
[13] Xiulei Ji, Kyu Tae Lee, and Linda F Nazar. A highly ordered nanostruc-tured carbon-sulfur cathode for lithium – sulphur batteries. Nature Materi-als, 8(June), 2009.
[14] D Marmorstein, T H Yu, K A Striebel, F R Mclarnon, J Hou, and E JCairns. Electrochemical performance of lithiumrsulfur cells with three dif-ferent polymer electrolytes. Journal of Power Sources, pages 219–226,2000.
[15] Joon Ho Shin and Elton J. Cairns. Characterization of N-Methyl-N-Butylpyrrolidinium Bis(trifluoromethanesulfonyl)imide-LiTFSI-Tetra(ethylene glycol) Dimethyl Ether Mixtures as a Li Metal CellElectrolyte. Journal of The Electrochemical Society, 155(5):A368, 2008.
[16] P. Dubois, JP Lelieur, and G. Lepoutre. Chemical species in solutions ofsulfur in liquid ammonia. Inorganic Chemistry, 26(12):1897–1902, 1987.
[17] Yajuan Li, Hui Zhan, Suqin Liu, Kelong Huang, and Yunhong Zhou. Elec-trochemical properties of the soluble reduction products in rechargeable Li/Sbattery. Journal of Power Sources, 195(9):2945–2949, May 2010.
[18] Dong-Hun Han, Bum-Soo Kim, Shin-Jung Choi, Yongju Jung, JuhyounKwak, and Su-Moon Park. Time-Resolved In Situ SpectroelectrochemicalStudy on Reduction of Sulfur in N,N’-Dimethylformamide. Journal of TheElectrochemical Society, 151(9):E283, 2004.
[19] Eva Boros, Martyn J Earle, Manuela a Gîlea, Andreas Metlen, Anja-VerenaMudring, Franziska Rieger, Allan J Robertson, Kenneth R Seddon, Alina aTomaszowska, Lev Trusov, and Joseph S Vyle. On the dissolution of non-metallic solid elements (sulfur, selenium, tellurium and phosphorus) in ionicliquids. Chemical communications (Cambridge, England), 46(5):716–718,February 2010.


![LMS-NEWTON ADAPTIVE FILTERING USING FFT{BASEDetna.mcs.kent.edu/vol.4.1996/pp14-36.dir/pp14-36.pdffor instance, Levinson, 1947 [14]) have been derived to solve such Toeplitz systems,](https://img.pdfslide.us/doc/110x75/5e7a9fc6414b0304c03c3cfa/lms-newton-adaptive-filtering-using-fft-for-instance-levinson-1947-14-have.jpg)