Embed Size (px)
Citation preview

Royal College of Surgeons in Irelande-publications@RCSI
Masters theses/dissertations - taught courses Theses and Dissertations
1-1-2014
Redesign of a consultant led prosthetic clinic.Iain BriggsRoyal College of Surgeons in Ireland
This Thesis is brought to you for free and open access by the Theses andDissertations at e-publications@RCSI. It has been accepted for inclusion inMasters theses/dissertations - taught courses by an authorizedadministrator of e-publications@RCSI. For more information, pleasecontact [email protected].
CitationBriggs I. Redesign of a consultant led prosthetic clinic. [MSc Thesis]. Dublin: Royal College of Surgeons in Ireland; 2014.

— Use Licence —
Creative Commons Licence:
This work is licensed under a Creative Commons Attribution-Noncommercial-Share Alike 3.0 License.
This thesis is available at e-publications@RCSI: http://epubs.rcsi.ie/mscttheses/48

Redesign of a consultant led prosthetic clinic
MSc in Healthcare Management 2014
Student ID: 12120758
Submission Date: 14th May 2014
Word Count: 15,406
Facilitator: Ms Theresa Keane

i
Table of Contents
List of tables’ iii
List of figures iv
Abstract v
Acknowledgements vi
1. Introduction ................................................................................................................................ 1
1.1 Context of organisation ........................................................................................................... 1
1.2 Rationale for change ................................................................................................................ 2
1.3 Aims and objectives ............................................................................................................. 4
1.4 Role of the Student .............................................................................................................. 4
1.5 Summary ............................................................................................................................... 6
2. Literature Review ......................................................................................................................... 6
2.1 Introduction ............................................................................................................................. 6
2.2 Process Design ..................................................................................................................... 7
2.3 Capacity and Demand ....................................................................................................... 10
2.4 Documentation .................................................................................................................... 15
2.5 Assessment forms .............................................................................................................. 17
2.6 Outcome measures ............................................................................................................ 20
2.7 Implications for the change project .................................................................................. 22
3. Methodology ................................................................................................................................... 24
3.1 Introduction......................................................................................................................... 24
3.2 Critical Review of Change Models ................................................................................... 25
3.3 Initiation Stage .................................................................................................................... 30
3.4 Planning stage .................................................................................................................... 33
3.5 Implementation ................................................................................................................... 35
3.6 Mainstreaming Phase ........................................................................................................ 37
4. Evaluation ....................................................................................................................................... 39
4.1 Introduction .............................................................................................................................. 39
4.2 Quantitative Results ........................................................................................................... 40
4.2.1 Participation questionnaire............................................................................................ 46

ii
4.2.2. Clinic format questionnaire ........................................................................................... 47
4.3 Qualitative results ............................................................................................................... 49
5. Discussion and conclusion ........................................................................................................... 50
5.1 Introduction .............................................................................................................................. 50
5.2 Project strengths ................................................................................................................. 52
5.3 Project limitations ............................................................................................................... 56
5.4 Organisational Impact ........................................................................................................ 62
5.5 Recommendations ............................................................................................................. 64
5.6 Conclusion ........................................................................................................................... 65
Reference List ................................................................................................................................. 66
Appendix 1: SWOT analysis ......................................................................................................... 71
Appendix 2: TOWS analysis ......................................................................................................... 72
Appendix 3: PESTLE ..................................................................................................................... 73
Appendix 4: Stakeholder analysis ............................................................................................... 74
Appendix 5: Goffee and Jones Cultural analysis results .......................................................... 75
Appendix 6: Force Field analysis ................................................................................................. 76
Appendix 7: Established state process map .............................................................................. 77
Appendix 8: New process map .................................................................................................... 85
Appendix 9: Consultant review process map .................................................................................... 88
Appendix 10: Team presentation ................................................................................................. 89
Appendix 11: Participation questionnaire ................................................................................... 94
Appendix 12: Clinic redesign questionnaire ............................................................................... 95
Appendix 13: Interdisciplinary Team assessment form ............................................................ 97
Appendix 14: Gantt chart ............................................................................................................ 107

iii
List of tables
Table 1: Waiting time statistics P41
Table 2: Assessment appointment duration P41
Table 3: Space utilisation P43

iv
List of figures
Figure 1: HSE change model P28
Figure 2: Assessment form completion rate 2013 P44
Figure 3: Assessment form completion rate 2014 P45
Figure 4: Results of the participation questionnaire P46
Figure 5: Radar diagram of clinic format before and after change P48

v
Abstract
The writer’s department operates a consultant led clinic once a week on a Friday. Its purpose is to provide an interdisciplinary team assessment for new patients being referred into the service, whilst also providing consultant/prosthetist review appointments for established patients.
The current clinic process has evolved to have an inefficient patient flow resulting in delays to the patient, variation in waiting time and appointment duration with its accompanying assessment form having a low completion rate
The HSE change model was chosen to restructure the clinic. During the initiation and planning stage an Interdisciplinary assessment form was designed through a collaborative approach and the clinic process redesigned into parallel clinics within the department. Following a presentation outlining the rationale for change and the new clinic structure proposal the project went live on the 25th April.
Results from the first two clinics showed that assessment form completion rate increased and waiting times reduced which was in line with what was expected. The appointment duration increased which was not intended
The assessment form will continue to be developed to provide a quicker population method based on best practice and historical input.

vi
Acknowledgements
I would like to thank all those who have helped me with this project and also
throughout the two year journey which has been this MSc. A special mention goes to
my family whom never tired of supporting me during the challenges that I faced and
my facilitator Ms Theresa Keane. Whose balanced view of my project provided
perspective and objectivity when needed most.

~ 1 ~
1. Introduction
Change in healthcare is abundant worldwide (Glouberman and Mintzberg,
2001) with changing populations the resulting needs and expectations are
therefore changing too (HSE, 2008). It can therefore be seen that a process
or way of working that was relevant at one point in an organisations history
may no longer be appropriate in the present as the needs and demands
change. Given the present economic climate within Ireland, where demand on
healthcare is increasing and resources are decreasing the author would view
this as being especially relevant in today’s climate.
1.1 Context of organisation
With this in the mind, the authors’ project is to redesign a consultant led
prosthetic clinic. The clinic is held for out-patients on a weekly frequency
every Friday. Its purpose is for newly referred patients to be assessed by the
multidisciplinary team with view to prescribing prosthesis, and also for
established patients to participate in a joint review with consultant and
prosthetist. With the aim being for medical issues, treatment plans and patient
advocacy to be discussed. The present design of the clinic had been
established approximately eighteen months previously, where an assessment
model established in National Health Service prosthetic centres was proposed
and then implemented. This consisted of a multi-disciplinary team approach
where four patients were appointed at the same time, each allocated to a

~ 2 ~
different starting station with one therapist before rotating to the next station
after a fifteen minute assessment. Four stations were set up consisting of
prosthetist, consultant, physiotherapist and occupational therapist. Once each
patient had been assessed at each station the clinicians would meet and
discuss the patient, predict an activity level and then the prosthetist would
form a prosthetic prescription. The patient would be informed and an
appointment to start prosthetic provision arranged. In principle four patients
could be assessed in an hour. When applied to the authors department this
formed a clinic structure of four assessments scheduled for nine thirty in the
morning and eight review patients scheduled from ten thirty to twelve thirty in
the morning.
1.2 Rationale for change
However this format did not prove to be a success due to a lack of
understanding of the process within the attending staff and a teamwork
culture clash. Whilst the rotation model focused on a multi-disciplinary
approach the authors department had moved to work in an interdisciplinary
teamwork model following Commission on Accreditation of Rehabilitation
Facilities (CARF) accreditation for in-patient care. The attending therapists
were primarily based in the in-patient setting with only four hours allocated to
the out-patient setting. As a consequence this was leading to the four
assessment patients being started at the same time by the medics who
numbered between two and four depending on who many registrars were on
duty. The prosthetist, occupational therapists and physiotherapist numbers

~ 3 ~
remained constant unless in the event of leave when their numbers would be
less. As the team was continuing to work to an interdisciplinary model, the
resultant effect was that therapists were moving between patients in an
unplanned manor when requested by other members of the team.
Consequently this was leading to significant variation in appointment duration
and patient wait times during the clinic. It was observed that the assessment
patients were not always finished by the start of the review patients. This
again increased the variation in appointment duration and waiting time
variation which was being compounded by not using all the available rooms in
the department.
Following staff and roll change in April 2013 there was growing
acknowledgement from the team that the clinic flow was ineffective with
delays becoming more common, with the resulting variation in appointment
duration and patient wait time needing to be addressed. A further issue was
identified to be that of documentation, as the assessment forms were not
being consistently completed and that the attending physiotherapist and
occupational therapist were inconsistently recording within the healthcare
record. Instead preferring to rely on the consultant letter to document their
input, as the letter followed every appointment.
Given that patient flow in healthcare is acknowledged to have delays within it
(Haraden & Resar, 2004) which can adversely affect resource utilisation
(NHS, 2005) the need to redesign the flow to improve efficiency and quality
~ 4 ~
(Baker et al, 2009) of care is clearly needed. In addition to the patient flow
issue, there is that of documentation. The literature would show that whilst
there is no direct correlation between the quality of documentation and the
quality of care received (Bosek & Ring, 2010), it is essential for good
communication and in the formation of a care plan (Tornvall & Wilhelmsson,
2007). This is relevant to the authors organisation given that that new patients
are rehabilitated through interdisciplinary team model of in-patient care.
1.3 Aims and objectives
With this in mind the overarching aim of the project is to redesign the
consultant led prosthetic clinic. In order to achieve this, the following
objectives were set:
Reduce the patient wait time during the clinic
Reduce variation in appointment duration
Improve clinic space utilisation
Design and implement an IDT assessment form
Determine the percentage completion rate of the assessment form
1.4 Role of the Student
In order to achieve the overarching aim of the project, the author took on a
leadership role to drive the change project through whilst using the HSE
change model (HSE, 2008). This required a four stage approach consisting of

~ 5 ~
initiation, planning, and implementation and finally mainstreaming. Initiation
required a situational analysis which consisted of a stakeholder analysis, force
field analysis, Goffee and Jones cultural analysis, PESTLE SWOT and TOWS
analysis, data collection of appointment times from 2013 and a collaborative
approach to process mapping of the current clinic structure. The planning
phase was aimed at building commitment by communicating the issues
identified with the clinic, and then using a participative approach to improve
buy in and reduce resistance (Kotter and Schlesinger, 2008) by redesigning
the clinic process and constructing an interdisciplinary assessment form. The
implementation stage consisted of a presentation to the team outlining the
current structure and its quantified issues followed by the proposed new
structure and assessment form. This facilitated agreement on the new
structure and its implementation date. Clinic lists were then restructured with
attention paid to the timing of patient appointments relative to their travel time.
During the mainstreaming data was collected on appointment times (arrival
time, seen time, finish time) and the assessment form completion rate.
Questionnaires were issued to the team members so that their opinion on
their involvement in the change process and their view of clinic efficiency
before and after the change could be sought. In order to facilitate this, a
situational leadership approach was taken. Whilst the author was the
department manager the clinic was essentially under programme
management due to the interdisciplinary team approach. As the programme
manager position was not occupied during the project, the situational
approach was deemed most appropriate in order to be flexible with the
stakeholders and in application of the authors influence.

~ 6 ~
1.5 Summary
This project is aimed at improving process efficiency and documentation
within a consultant led prosthetic clinic. All changes have been underpinned
by a literature review to provide an evidence base for the new design, in order
to maximise the success and longevity of the project. Although the project
was subject to substantial delays which will be discussed in further chapters,
much has been achieved in improving patient flow and documentation
standards whilst embedding the new way of working into department culture.
2. Literature Review
2.1 Introduction
This chapter is a review of academic literature of the main themes associated
with the redesigning of the consultant led clinic. It is done in order to provide a
knowledge base from which to consider the critical points and current
knowledge on the subject.
Its objective within this project is to identify current knowledge and practice
around the themes of process design, capacity and demand, healthcare team
models, documentation, assessment forms and outcome measures. To do
this, key words were used in the search. These were prosthetics, assessment
forms, standardisation, documentation, capacity, demand, process flow,
healthcare teams. Google scholar, RCSI library, UCD library, Prosthetics and

~ 7 ~
Orthotics online library were all used to search for publications. The
publications used were selected in the English language, publicised in either
journals or books.
The identified themes were chosen in order to form the basis for restructuring
the clinic into a smooth process with capacity set as appropriate to the
demand, whilst having appropriately designed documentation to compliment
it. Some of the literature recommended that outcome measure be used at
assessment stage so that the effectiveness of an intervention could be
measured upon the interventions completion.
2.2 Process Design
Flow is a concept which describes the progressive movement of information
or people through a sequence of processes (NHS, 2005). However when
viewed in the healthcare setting it is defined as being dependent on the
inherent variation within healthcare delivery systems that results in the patient
being guided through a series of steps in a process which will typically have
delays within it (Haraden & Resar, 2004).
Such delays within the flow may typically result from the demand exceeding
capacity, a mismatch between variation in demand and capacity, and a
perverse incentive for having a queue, such as appearing to be busy in order
to be rewarded with extra resources to reduce the queue (NHS, 2005).
However by analysis of flow through process mapping delays and bottlenecks

~ 8 ~
can be identified in order to create a redesigned process which will be quicker
and more efficient to facilitate better quality care. Concepts such as Lean
Management (Anon, 2004) can be used in processes redesign to ensure that
value is added to every step (Womack et al, 2005) and bottlenecks are
removed from the process.
Whilst the work of Brideau in 2004 outlined the rising complexity in healthcare
systems during the fifty years prior to the article, the concept of flow in
healthcare was still in its infancy despite the promise of improvements in
efficiency and quality at the time of being published.
Evidence to support the need for development of the flow concept to improve
efficiency and quality can be found in the article by Baker et al in 2009 which
investigated patient flow variability and unplanned readmissions to an
intensive care unit. It did so by analysing a twenty three month period
containing three thousand two hundred and thirty three patients to ascertain
patient admission numbers in relation to daily admissions, unplanned
readmissions and patient complexity. The study found that unplanned
readmissions had a higher chance of occurring within a three day period
following on from any day which had more than eight patients admitted. This
was resulting in a decrease in capacity for new admissions and a degree of
rework whilst also compromising patient safety. Whilst the study drew
recommendations around quality improvement methods, teamwork and
culture, it strongly recommended that patient flow should be used to

~ 9 ~
standardise processes, maximise resources to achieve overall efficiencies
and improve patient safety.
Despite the afore mentioned potential benefits being clear, it was found that
this concept was not being significantly explored and applied across
healthcare due to the belief that each patient is different and a prevailing
culture of physician autonomy (Brideau, 2004). However within Brideaus’
2004 article, its case studies showed documented evidence that redesign of
the flow in the healthcare setting can reduce unwanted random variation from
the process, improved operating efficiency by increasing patient throughput
with a reduction in patients self-discharging from an emergency department
against medical advice. With strong evidence to support the concept of
redesigning patient flow becoming available, along with growing interest in
lean management due to cost pressures and national targets (De Souza &
Pidd, 2011) why is the patient flow concept not more common place?
The 2011 article by De Souza & Pidd essentially outlines a lack of ground
level operational synthesis to incorporate lean management into healthcare
culture. Which in turn resulted in an effective barrier to lean implementation,
that otherwise would have facilitated a focus on patient flow and processes to
remove delays. It was found that healthcare professionals committed well to
lean principles when it was used to provide structure to keep decisions under
their control. This result was only achieved when the healthcare professionals
were in a full understanding of what the goal was and the benefit that it would
achieve. Citing issues of perception, new terminology established skill sets,
~ 10 ~
hierarchy/management roles, fragmentation in the team and a general
resistance to change it can be seen that barriers are more people and
organisational based (Radnor et al, 2006) as opposed to an inherent
misapplication of flow and lean theory.
2.3 Capacity and Demand
If capacity is the resources available to do the work in a task, demand is all
the requests and referrals from all sources requesting to have the task done
(NHS, 2002). When a mismatch in capacity relative to the demand occurs this
can cause delays, which in the healthcare setting equates to increased
waiting time.
However it has been shown that a lack of capacity is rarely the issue as it
tends to be the way in which capacity is supplied that causes the delays
(Silvester et al, 2004). In the 2004 article on reducing waiting lists in the NHS,
Silvester et al proposed four main hypotheses as to why waiting lists occur.
These were outlined as the demand is greater than capacity, a mismatch in
variation in demand and variation in capacity, that queues keep resources
used at a hundred percent capacity and that a queue can discourage use of
what people perceive to be scarce resources. Whilst the article outlined that
the mismatch in variation in demand and variation in capacity had been found
to be the main cause of queues, it was able to show that capacity met
demand as queue levels remained constant, bottlenecks in the system
resulted in other resources being kept artificially busy and that clinicians and

~ 11 ~
managers didn’t understand the true demand levels meaning that the
resources relatively speaking were not scarce.
But with this in mind, why is variation in demand and variation in capacity
cited as the main cause of queues? Given that how capacity is being used
was the summary of Silvester et al article, it becomes evident as to why this is
the case when the theory of constraints is applied to healthcare (Goldratt and
Cox, 2000). The main tenant of the theory is that the bottlenecks in the
process dictate the process out-put, and that if capacity at the bottleneck is
increased to reduce the queue or wait time, then the bottleneck will simply
change location within the process. Therefore if capacity is varied at each
system bottleneck on a regular basis demand at each bottleneck will vary and
capacity will vary as action is taken. In the modern day scenario of funding cut
backs adding capacity may not be a viable option for many, increasing the
need to analyse capacity and demand.
When capacity and demand are properly analysed, it has rarely been found
that demand is exceeding capacity (Audit Commission, 2002, 2003). Why
therefore is capacity not consistently measured effectively to facilitate
appropriate planning?
Bamford and Chatziaslan, 2009 identified that two factors came into
consideration in this scenario. Those being conflicting stakeholder priorities in

~ 12 ~
relation to the use of the capacity and also the interaction of capacity
decisions with each other. Should different stakeholders have different
priorities for the use of resources during the decision making process, then a
balanced outcome may not always be achieved. In turn this has the potential
to introduce a bias in the resource utilisation leading to queues or delays in
one aspect of the process as the true demand is not appropriately managed.
This is then likely to feed back into a cycle of apparent variation of demand
and variation of capacity in the effected parts of the process.
The second point of interaction of capacity decisions with each other raises
the interesting concept of taking an overview of the entire situation before
making a decision. In order for a patient group to be provided with appropriate
treatment, several different resources may have to be utilised to do so. Thus
the utilisation of different resources will have a knock on effect on the other.
Whilst it was identified by Bamford and Chatziaslan in 2009 that a focus on
single resource uptake was common place, it was clear to see that this was
not the most appropriate way to proceed as it led to lower utilisation in the
system as a whole (Gemmel & Van Dierdock, 1999). In order for the whole
system to be utilized effectively, system wide performance measures were
recommended so that the most significant resources were measured (Zigan et
al, 2008). By taking a broader view of the system, it ensured that the knock on
effect which was identified to occur in single resource focus would not occur,
as different departments have different demands that must be responded too.

~ 13 ~
2.3 Healthcare Team Models
The concept of the team approach is common in healthcare, as teams are
seen as a way to provide quality services and as a way to redesign work
(McCallin, 2001). Whilst the scale and complexity of this challenge is
considerable, the concept allows the potential of the individuals within the
team to be utilised so that the task at hand is spread across the team with
increased levels of responsibility. Three main models of healthcare teams
were identified to be Multi-disciplinary, Interdisciplinary and Trans-disciplinary.
Multi-disciplinary teams function with its individual team members working
independently to gain information before coming together to share the
information before making any decision (Sorrells-Jones, 1997). This style of
team requires someone to determine what disciplines will form the team. With
each team member then working in their discipline specific parameters, it can
be seen that this is supportive of independent clinical decision making.
However the communication of this information will be directly or in-directly
communicated/shared to the rest of the team (Dyer, 2003), which in turn can
be seen to lack a degree of co-ordination or collaboration in the planning of
care. This can result in members lacking a common understanding of patient
issues which may influence interventions (Sheehan et al, 2007)
By contrast the interdisciplinary method of team work expands on the
multidisciplinary team work concept by having all team members working
collaboratively to solve problems and form a collaborative service plan (Dyer,

~ 14 ~
2003). A more holistic approach can therefore be taken, that has the patient
and family as integral centre members of the team. Whilst this substantially
improves the patient focused approach when compared to the multi-
disciplinary team, communication between all team members becomes
essential in order to facilitate collaborative decision making and care plans
during episodes of care (Behm and Gray. 2010). By using this approach the
team can “provide knowledge, skill and expertise whilst using the individual
team members’ perspective in the collective planning of patient goals” Easton,
1999.
It must be noted, however, that a significant challenge of the interdisciplinary
team work model is conflict between team members who believe that their
professional judgement is being questioned (Strasser et al 1994). Given the
background of functioning within the individual discipline, such conflict must
be guarded against so that the collaborative approach is maintained.
Regression to the individual approach will hamper the efforts made in working
towards collaborative thinking (Herbert et al, 2007), which is of course the
essence of interdisciplinary working.
Trans-disciplinary working values knowledge and skill of each member and
depends upon effective and frequent communication (Dyer, 2003). It differs
from interdisciplinary working by having one team member as the primary
provider and requires each team member to cross train in areas outside of
their discipline. In what is a blurring of professional roles between team
members, each member must show flexibility and willingness to take on this

~ 15 ~
model of care (Mumma & Nelson, 1996). Without the ability to take on what
would ordinarily be another disciplines responsibilities in a different team
model, the patient will be unable to receive the appropriate treatment. Each
team member must therefore be highly competent and secure in their
disciplines to enjoy teaching skills to others and acquiring new skills also
(Garner, 1995)
2.4 Documentation
Documentation is the written and legal recording of the interventions that
concern the patient and it includes a sequence of processes. This is
established in the personal record of the patient to constitute a base of
information regarding the patient (Ioanna et al, 2007). However, consistency
in documentation quality is often difficult to achieve (Webber, 1987), even
though it is seen as integral to professional practice and reflective of good
quality care (McGeehan, 2007).
In light of McGeehan’s work it is important to establish the relationship
between documentation and the quality of care. Interestingly, contrary to
McGeehan’s work articles by Bosek and Ring in 2010 found that good patient
documentation from clinicians did not necessarily reflect the same standard of
patient care. Which was a finding further reflected by Ferguson et al, 2010
who concluded that it was difficult to prove that good documentation equated
to good clinical practice. With this in mind, the potential disparity between
documentation and care becomes an interesting proposition.

~ 16 ~
Cox 2003 undertook a study took over a one year period which gathered a
substantial sample size on the documentation of cardiac history, specifically
previous myocardial infarction or heart failure. The study found that a lack of
documentation in the medical records was recorded and shown to be a
concern on the quality of the subsequent treatment that was received. Whilst
it postulated that if poor documentation reflected a gap in knowledge and
competence of the physician as opposed to a lapse in documenting then
patient management was being affected. However should a physician know
the patient, then all documentation may not be recorded as the physician will
be fully aware of the history and the lack of documentation only becomes an
issue should the patients care pass to another physician. Therefore familiarity
with a patient should not be a reason not to document pertinent information,
which may act as a prompt for appropriate treatment.
The study concluded that lack of documentation complicates efforts at
optimising patient management and recommended exploring the reasons that
a lack of documentation occurs.
It can be seen from the literature that quality documentation is highly
important in enhancing communication and in the formation of patient care
plans without a direct link between quality of care and quality of
documentation being proven. Communication has been proved to be essential
for patient safety and comfort with documentation in the form of patient

~ 17 ~
records being cited as one of the main tools of communication (Tornvall &
Wilhelmsson, 2007).
With this being the case would there be any benefit in standardisation of the
documentation being used in patient care?
Standardisation of a process is designed to formalise procedures so that it
can be repeatedly followed with the aim of consistently achieving repeated
quality (Ungan, 2006). Without such standardisation it has been found that
variation in processes can result in variation in quality (Shiffman, 2003).
However a Swedish study found that Nurses cited time constraints and a lack
of knowledge as major concerns when looking to standardise documentation
(Bjorvell et al, 2003) which points to implementation as opposed to
inappropriate theory as a barrier to standardisation of documentation.
2.5 Assessment forms
There is currently a wide range of tools available to assess patient function
and activity of daily living; however few are specific for assessing amputee’s
functional potential with prosthesis (Gailey et al, 2002). Given the backdrop of
busy clinical practice using an assortment of tests to determine all the various
aspects is likely not to be feasible (Miller et al, 2001). However, given the
need for consistent repeatable documented information in modern practice,
assessment forms are advisable tool to facilitate this need, as they are

~ 18 ~
associated with significantly higher rates of documentation (Parikh et al,
2007).
A search of literature for prosthetic assessment in the interdisciplinary team
setting revealed no recommended or specifically designed tools. However the
benefit of an interdisciplinary team assessment and subsequent rehabilitation
programme was outlined as early as 1987 by Ham et al. The article showed
that the amputee’s rehabilitated through a team approach would have
substantially improved outcomes from prosthetic provision in terms of
improved functionality, reduced primary rehabilitation time whilst also
introducing a cost saving for the health service (Ham et al, 1987).These gains
are underpinned by a thorough patient assessment.
Amputee assessment instruments such as AMPRO (Gailey et al, 2002)
proved to be validated, but were designed for single discipline use. As the
core rehabilitation team members for an amputee service are regarded as
being the Rehabilitation Consultant, Prosthetist, Physiotherapist, Occupational
Therapist and Nurse (Jorge et al, 2012) an assessment form appropriate for
the situation was required to be developed. With this in mind, an assessment
form to be used during an interdisciplinary team assessment, which would
predict activity level in combination with providing all attending team members
with specific information to formulate their own care plan, would need to be
constructed to facilitate this. The benefits of standardised documentation as
outlined in section four can then be achieved.

~ 19 ~
On the basis that each individual discipline within inter disciplinary team has
their own key areas of pragmatic knowledge (schilling, 2006) from which they
will assess a patient to build their opinion and subsequent care plan; a
collaborative approach was found to be appropriate. As through this
collaborative approach the function and efficiency of the final product which in
this case is the assessment form, can be optimised (Wang et al, 2002). The
term pragmatic knowledge can be defined as established principles, heuristics
and rules which guide their actions and decisions during the assessment
process (Schilling, 2006).
As an overview the 2009 article by Sansam et al, reviewed literature to
determine the constituent factors around which prediction of walking ability
post amputation can be based. It showed that the main factors to take into
consideration were amputation cause and level, residual limb presentation
and pain, cognition and mood disturbance, body mass index prior to
amputation, physical fitness, motivation, pre-amputation walking status, ability
to stand on one leg, independence in activities of daily living, employment
history, hobby history, age, co-morbidities, social support and smoking history
(Sansam et al, 2009). Whilst the article acknowledged that each factor
accounted for varying degrees of significance in a patient’s outcome, it did not
present a standard assessment or measurement for each aspect. But it did
give rise to a template from which to base the core elements of the
interdisciplinary assessment form. As in the absence of evidenced based
practice, empirical knowledge which encapsulates the pragmatic knowledge

~ 20 ~
can be used in the assessment forms construction along with consensus
based decision making (Van der Linde, 2004).
The literature will show that the use of assessment forms will save time during
the actual assessment, facilitate standardisation in the assessment process
and provide repeatable quality through the predetermined standardised
measures and tests (Swinkels et al, 2011). Such improvements also facilitate
healthcare being provided on an evidence base, built from the assessment
form, as opposed to the unproven opinions of the individual clinician (Hewitt-
Taylor, 2003, McSherry & Taylor, 2003).
2.6 Outcome measures
Outcome measurement is the evaluation of the effectiveness of the result of
an intervention (lazenbatt, 2002). This clinical effectiveness is one of the
seven pillars of clinical governance (Nicholls et al, 2000) which underpins
healthcare delivery. In turn it facilitates the continued measurement of the
quality of intervention to allow for continued improvement in the intervention.
It has been shown that in the last ten years there has been an increase in the
measurement of healthcare (Sheldon, 2005).
The principal of outcome measurement is clearly woven into the fabric of
clinical governance. It does however need to have its goals and objectives
clarified and measures linked to such goals with reliable data collection
methods in place (Buckmaster, 1999), so that progress can be monitored and

~ 21 ~
suitable adjustments made as appropriate. The work of Garland in 2003
showed that standardised outcome measures may have direct impact in
programme planning, funding decisions and also monitoring of quality of care
across different agencies. But it also showed that there were barriers to
effective implementation of outcome measures through clinicians’ attitude
towards it (Garland, 2003). The barriers were identified as being a time
burden, an increase in paperwork and a perceived invalidity of the outcome
measures to the clinician’s patient group. These barriers were corroborated in
an article by Abrahamson who cited logistical concerns and appropriateness
of measures as a barrier to implementation (Abrahamson, 1999).
The literature review by Condie et al 2006 found that in the domain of lower
limb prosthetics there are many outcome measures in use. However it was
identified that there was no agreement on best practice and little agreement
on which measure to use and when to use it or indeed a single measure to be
universally appropriate (Condie et al, 2006). It therefore gives rise to a
situation where an outcome measure must be selected to be used in the
assessment process which can be used again at the end of the rehabilitation
process. Blankertz 1998 identified eleven principles for this selection. These
being that outcome measure should be relevant to the target group, have a
simple teachable methodology, be objective, use multiple respondents,
identify outcomes that are the results of the rehabilitation process, have solid
psychometric data, have a low implementation cost, be understandable to a
nonprofessional audience, involve easy feedback and uncomplicated
interpretation, be useful in clinical services and be compatible with clinical

~ 22 ~
theories and practices (Blankertz, 1998). This can be seen to be effective in
providing appropriate guidance in applying a contextually appropriate
outcome measures as it considers all stakeholders perspectives and clinical
service.
In Summary outcome measures whilst presenting ground level challenges to
implement amongst clinical staff, offer notable benefits to patient care and
service development by measuring the effectiveness of the clinical
intervention.
2.7 Implications for the change project
The literature review revealed the main themes of the project to be that of
process design, capacity and demand, healthcare team models,
documentation, assessment forms and outcome measures.
Review of the process design area revealed that patient flow was a concept in
healthcare that was of considerable relevance to the project. Flow enables the
analyst to identify where delays are occurring whilst also identifying
bottlenecks and resulting capacity and demand mismatch (NHS, 2005). By
introducing techniques from industry such as lean management, processes
can be redesigned to obtain value at each process step (Womack et al, 2005).
However resistance in the workplace can be evident from clinicians through
their lack of understanding as to its purpose and nature (Brideau, 2004).
Capacity and demand revealed that lack of capacity in a system was rarely an

~ 23 ~
issue for delays forming, as it tended to be the application of capacity which
was at the heart of the issue (Silvester et al 2004). And this was compounded
by the true level of demand not being understood due to conflicting
stakeholder priorities plus the interaction of decisions on capacity leading to a
cycle of variation in capacity application (Bamford and Chatziaslan, 2009).
Healthcare team models was investigated in order to provide clarity on the
appropriate model of teamwork in the rehabilitation setting which is the
background to the clinic. It revealed three main teamwork models which were
multi-disciplinary, interdisciplinary and trans-disciplinary all of which were
shown to provide quality healthcare services (McCallin, 2001). However the
interdisciplinary model was found to be appropriate for rehabilitation (Behm,
2011) due to its collaborative approach utilising each disciplines expertise to
maximise communication and problem solving ability. The potential for conflict
was noted as a potential drawback should the clinicians have a perception
that their professional judgement was being questioned (Strasser et al 1994).
Documentation proved to be key area of review as it was found that
healthcare documentation is a legal requirement and forms a base of
information on the patient (Ioanna et al, 2007). Whilst it was established that
consistency within this area was difficult to achieve (Webber, 1987) the
benefits have been shown to be enhancement of communication and to be
critical in the formation of a care plan (Tornvall and Wilhelmsson, 2007). This
has led to standardisation being sought in order to facilitate improvement in
the consistency and quality (Ungan, 2006). The type of documentation

~ 24 ~
particularly relevant to this project is that of assessment forms. Few
assessments specifically aimed at assessing amputees potential with
prosthesis were found (Gailey et al, 2002), or indeed specific to the
interdisciplinary team setting. In order to design a standardised assessment
form each team member’s knowledge was used (Schilling, 2006) in a
collaborative approach in order to maximise the forms function and efficiency
(Wang et al, 2002). Factors which were considered to be predictive of the
potential ability to ambulate were also taken into consideration form Samsan
et al’s 2009 publication.
Finally outcome measures were recommended to be included in the
assessment form as good practice to measure quality of care. They have
been found to help in programme planning, funding decisions and improving
quality of care (Garland, 2003). However as there was not one specifically
recommended outcome measure (Condie et al, 2006), guidance on selection
criteria was taken form a publication by Blankertz in 1998.
3. Methodology
3.1 Introduction
Change occurs when movement from one way of operating to another way
operating is undertaken. It is however usually feared as it is a disturbance not
only of the status quo but a threat to people’s vested interests and the
established way of doing things (Kotter and Schlesinger, 2008). Yet within the

~ 25 ~
world of healthcare change is abundant worldwide (Glouberman and
Mintzberg, 2001) as the population is changing resulting in its needs and
expectations changing also (HSE, 2008). Given that seventy percent of
healthcare change initiatives fail (Balogun and Hailey, 2004) careful
consideration must be given to the change management model employed. As
there is not one change model that is universally accepted as being suitable
for all organisations and situations (Todnem, 2005)
The following chapter outlines why the HSE change model was selected by
the author, instead of other recognised change models such as those from
Lewin, Kotter and Deming.
3.2 Critical Review of Change Models
In 1958 Kurt Lewin proposed a three phased approach to planned
organisational change. It was based on the principle of force field analysis,
where by change would only occur when the driving forces were greater than
the restraining forces. This would then enable the desired change to become
permanent feature and that the old behaviour will be discarded (Morley et al,
2004).
The three phases of the model are unfreezing, change and refreezing. Within
the unfreezing state the forces which are restraining the new situation must be
reduced whilst creating a palpable need for change. Strategies to do so may
consist of education and communication of the underlying need. The middle

~ 26 ~
phase is the change phase itself. At this point the change is implemented
through structural and process changes typically using a change agent to
promote the case. At this point the values and attitudes of the stakeholders
should be becoming consistent with desired outcome. Finally the refreezing
phase begins and the change should stabilise in the newly reached situation.
This should be reinforced by supporting mechanisms, values and a culture to
facilitate the new way of working.
Whilst this model can be seen to be a general framework (Todnem, 2005) for
understanding the change process, some considered it to be too broad
(Eldrod and Tippet, 2002) and perhaps not practical (Bamford and Forrester,
2003) resulting in adaptations of the theory being developed. However the
work of Bamford and Forrester showed it to be highly effective and suitable for
small scale incremental change (Burnes, 2004). The author would therefore
argue that given the continual evolution of healthcare this model is perhaps
appropriate in some instances but not for situation where there is continual
change and evolution in a cyclic manner.
In 1995 John Kotter introduced a change model consisting of an eight step
process. It was developed from a study of over one hundred organisations
varying in size and industry and concentrates on avoiding the major errors
that can befall any change process (Mento et al, 2002). Best viewed as a
vision of the change process it focuses on the strategic level of the process
(Mento et al, 2002). In sequential order these steps are establishing a sense

~ 27 ~
of urgency, forming a powerful guiding coalition, creating a compelling vision,
communicating the vision, empowering others to act on the vision, planning
for and creating short term wins, consolidating improvements and finally
institutionalising the new approach (Kotter, 2006). It can be seen that the first
three steps create a climate for change, the fourth, fifth and sixth steps
engage and enable the whole organisation whilst the final two steps
implement and sustain the change.
Whilst the model became an instantaneous success upon its release despite
the publications lack of referencing, subsequent limitations of the model have
been identified (Appelbaum, 2012). These are cited by Appelbaum in 2012 as
it having a rigid approach, that some steps are not relevant to the context in
which they are applied and its ability to deal with difficulties and changes it
encounters during the change management process. To its credit the model is
cited as an excellent starting point which will improve the chances of success
(Appelbaum, 2012), whilst also being recommended to be used in
combination with other models so that it can overcome its limitations.
The plan, do, check, act cycle was first discussed by Walter A Shewhart in
1939 (Best and Neuhauser, 2006). However it was following its promotion by
W. Edwards Deming, that the cycle became known as the Deming cycle. The
four step cycle begins with the change process being planned out, is acted
on, the results are measured to find deficiencies and then the gap between
the intended goals and the results achieved is acted on (Senapati, 2004). Like

~ 28 ~
Lewins’ model, the Deming cycle can be seen to be rather simplistic in its
approach and lacks detail for approaching complex challenges. However its
strength is that it is designed to be a cycle and will allow for continual
improvement within the change process.
The final change model considered was the HSE change model (HSE, 2008).
This model is developed from a literature review of best practice and on HSE
organisational experience, whilst incorporating the involvement of all key
stakeholders. There are four stages within the model (see figure 1).
Figure 1: HSE change model
In sequential order these are initiation, planning, implementation and
mainstreaming. The initiation stage of the process serves as a situational
analysis where the need and urgency are identified and project direction
given. The next stage is planning, where it is aimed at determining the detail
of the change and to create support. Within this stage are three individual

~ 29 ~
steps, of which the first is building commitment. This realise on building a
shared vision, communicating the vision, increasing the readiness and
capacity to change whilst demonstrating that change is underway from a view
point that the old way of operating is about to change. The second step of
determining the detail of the change can be defined as assessing the current
situation to compare it against the new vision, feeding back this analysis to
the stakeholders then describing what needs to change. Developing the
implementation plan is the final step in this stage and focuses on outlining the
detail of the plan and reviewing it with all relevant stakeholders with view to
revising it as necessary. The third stage is that of implementation where
agreed actions are carried out and momentum is built behind the initiative.
The final stage is mainstreaming. At this point focus is put on the success of
the change effort so that it can be embedded into the culture and also
evaluates its predetermined outcomes. This model has flexibility to it as it
allows for movement between stages to cope with changing circumstances.
Whilst also being cyclic in nature which will allow for continual improvement
and evolution of the situation.
When the four different models were taken into consideration, the HSE model
was seen by the author as being most applicable to the project. Whilst the
other models had advantages such as Kotter’s emphasis on communication,
Lewins focus on reducing restraining forces or the continuous improvement of
the Deming cycle. They all had significant weaknesses which would have
made using them problematic. In the authors opinion the HSE model
incorporated strengths from the other models such as situational analysis,

~ 30 ~
cyclic nature and stakeholder involvement whilst adding attention to detail,
flexibility and heightened awareness of culture. The only drawback which was
apparent was the potential to become stuck between stages should the
previous stage not have been comprehensively completed.
3.3 Initiation Stage
The initiation stage was delayed by four months due to staff change and staff
shortages. However once the project was underway a situational leadership
approach was employed so that the style of leadership was appropriate to the
situation in order to be at its most effective (Papworth et al, 2009).
As per the HSE model, this stage consisted of a situational analysis designed
at obtaining an understanding of the background in which the project would be
set. In order to do this the following analysis tools were used. SWOT,
PESTLE, force field, stakeholder, Goffee and Jones cultural analysis, process
mapping and the likelihood of resistance determined. Each of the tools will
now be discussed.
The SWOT analysis (see appendix 1) is a simple tool used to determine the
strengths, weaknesses, opportunities and threats in relation to its purpose for
being used (Walshe and Smith, 2011). When carried out it revealed that the
project had more weaknesses than strengths but more opportunities than
threats. However the strengths and opportunities of the project were seen to

~ 31 ~
be quite powerful by the author as they would facilitate change whilst the
threats and weaknesses could be avoided or overcome. To structure this
TOWS analysis (see appendix 2) as recommended by the RCSI was
performed so that strategies to develop the project could be implemented. A
PESTLE analysis (see appendix 3) was also carried out to examine the
external influences, but it did not reveal any further points to be extrapolated
on.
Once the initial analysis was done an informal discussion then took place with
high importance high influence stakeholders as identified in the stakeholder
analysis (see appendix 4). It was decided to use informal discussions with the
team as a Goffee and Jones cultural analysis (see appendix 5) had revealed a
communal culture (Goffee and Jones, 1998) in the service. The first
discussion took place with the consultant/head of service, in order to seek
their opinion and bring forward the findings of the situational analysis. As the
most powerful stakeholder in the project approval at this stage was vital.
Without it the project would be unlikely to proceed as decisions made at this
level have not been seen to be reversed. However the discussion revealed an
understanding of the issues raised and a willingness to change in order to
address the variation in waiting and appointment times and to improve patient
flow.
This was followed by proceeding to discussions with the physiotherapist and
occupational therapist involved in the project. As staff resistance to change,

~ 32 ~
perception of quality of service and staff buy in were identified as being
resistors to change in the force field analysis (see appendix 6) a process of
weakening these resistors was undertaken. Focus was put on participation
and involvement (Kotter and Schlesinger, 2008) in a process mapping
exercise so that the full extent of the current situations patient flow (see
appendix 7) could be seen. Once this was done the team could be seen to
understand the issues more clearly as it was referenced during clinics when
delays occurred. Data from the 1st January 2013 to 31st December 2013 was
collated into a spreadsheet as preparation for future presentation. The data
collected was on appointment duration, on the day waiting times, assessment
form completion, change of prescriptions, patient seen per clinic.
This spreadsheet was also used to analyse demand on the service in 2014
based on data from 2013. It was found that the average length of assessment
appointment was sixty three minutes with two point six assessment patients
per clinic. Review clinics proved to have an average appointment time of thirty
six minutes with six point seven review patients attending per clinic. A second
process map with the proposed new situation was then drafted and a new
interdisciplinary team assessment form drafted with view to it being discussed
and redrafted.

~ 33 ~
3.4 Planning stage
The second process map of the proposed new situation was then shown to
the team. This drew resistance as the proposed method was that of a multi-
disciplinary approach and not of the interdisciplinary approach which is used
in the hospital in-patient setting, which conforms to CARF accreditation
standards. It could be seen at this time that there was a cultural element to
the resistance as the IDT approach was believed to be the hospitals way of
working, even though accreditation for out-patient CARF standards had not
yet been sought. The process map was redrafted (see appendix 8) to
represent an IDT model for new assessments which would take place in one
room located at the back of the clinic. Patients would have hour long
sequential appointments, with capacity set to four which was one appointment
slot more than had been identified during data collection from 2013. The
Consultant review clinic was also mapped out (see appendix 9), with the
intention of it running at the same time but using the two main rooms in the
department, operated by the remaining team members. In this clinic each
appointment would be allocated thirty minutes with capacity set to a maximum
of eight which had one extra appointment slot from the figure identified during
data collection from 2013. This was agreed by the team as an appropriate
process to use. To be used at the assessment process was the
interdisciplinary team assessment form. This was drafted from the existing
assessment form, current in-patient assessment form and publications found
in the literature review. It was decided that each team member would have
their own section to complete as the assessment progressed. This was to act
as a guide for the assessment in the event of less experienced staff being

~ 34 ~
present and also to ensure that the agreed content of the form was
completed.
Meetings were arranged for mornings before clinic started so that the content
and flow of the assessment form could be discussed and redrafted, in order to
avoid duplication, establish role clarity and confirm the content. In order to
capture the data into one presentable format to communicate the vision and
implementation plan, a presentation was constructed (see appendix 10). At
this point in the project commitment had been gained from all the
stakeholders through participation in determining the detail of the changes.
However the project effectively stalled for one month as the
Consultant/Director of service unexpectedly took sick leave. As the length of
absence was unknown at this point and the new programme manager had not
taken up the post, the project was unable to move into the implementation
phase as there was no senior management to approve it. Also the
physiotherapist in attendance at the clinic changed due to the senior returning
from leave. In order to maintain the momentum that had built up during the
planning phase, regular informal conversations took place to keep awareness
of the project intact.

~ 35 ~
3.5 Implementation
Following the Consultant/Director of services’ return to work, a presentation
date was arranged. Due to various work place commitments not all of the
team were available at the same time. This was due to either geographical
clinic location or patient appointments which had no alternative dates within
reasonable time frame. It was therefore decided to first of all present to the
Consultant/Director of service and senior physiotherapist with view to
establishing a go live date. The senior occupational therapist felt sufficiently
involved and satisfied with the proposal to not need to attend the presentation
and instead requested to be notified of any changes. The outcome of the
presentation was that the go live date was set to the following week (twenty
fifth April) to facilitate rearranging patient appointments and that the case load
of the assessment clinic be reflective of whether a senior or junior prosthetist
was attending it. The consultant also requested that the decision on which
doctor attends the review or assessment clinic be left at their discretion due to
training needs of registrars. Given that the identified reasons were outside of
the authors’ scope of management and it was concerning a stakeholder of
high importance and high power, this was agreed upon. Following on from the
presentation the senior occupational therapist confirmed that there were no
further issues to be addressed from her perspective and the appointment
schedule was rearranged to facilitate the new structure.
The date of the first clinic was communicated to all team members verbally
and by an e-mail summarising the key point of the process and new

~ 36 ~
assessment form. All new assessment forms were printed of by administration
staff and filed into the healthcare records for the patients listed as an
assessment. On the morning of the first clinic the team members arrived on
time for the changed start time, which was thirty minutes earlier than
previously. However due to a third clinic being scheduled for that day (an
upper limb clinic which involved a registrar, senior prosthetist and senior
occupational therapist) and a change to the programme manager position
where by the senior physiotherapist had been moved into the programme
manager position at short notice resulting in no physiotherapy cover being
available for the first clinic. It led to the assessment clinic operating with the
registrar and senior prosthetist as there was no physiotherapy cover provided
to the clinic and the senior occupational therapist was allocated as planned to
the upper limb clinic. A further discussion took place with the registrar
regarding the new form and to advise that the prosthetist would be able to
complete sections of the occupational therapy and physiotherapy sections
due to prosthetist clinical practice overlapping within these areas. In order to
be able to address any issues as it emerged and to support the new way of
working the author was allocated to the assessment clinic and the other
senior prosthetist allocated to the upper limb clinic. At the end of the clinic the
only issue of note that had developed in either the assessment clinic, review
clinic or upper limb clinic was that there was a format error in the new
assessment form document. A discussion took place at the end of the clinic
whereby no problems were perceived to have occurred in the clinic operation
and the team consensus was that it was an uneventful start to the new

~ 37 ~
structure but that more would be known following the second clinic where
there was a full allocation of staff members.
3.6 Mainstreaming Phase
As the second clinic approached one week later, the team was again engaged
in discussion throughout the lead up time, with regard to how the clinic
structure would work and what had emerged from the previous week. It was
acknowledged by the author that in the first clinic the assessment form had
been completed by one person in order for the team member who was
performing their assessment of the patient to avoid interruptions to their work
flow, followed by a check of the detail entered at the end of the appointment.
As it had proved successful in the previous clinic it was agreed to try it for the
first assessment patient. On the morning of the second clinic the new
programme manager requested an unplanned meeting with the author before
the first patient was started. This meeting overran due to several items being
discussed resulting in the first patient being started without the attending
prosthetist at the consultants request. The registrar had been allocated the
appointment by the consultant. At the end of the clinic several issues were
identified for review which were the first appointment time slot of nine in the
morning attending at ten minutes past ten, appointment duration of the ten
o’clock patient being too long and the consultant allocating patients to the two
attending registrars one of whom attendance had not been communicated to
the author. Recording of patient arrival, start and end times had not been fully
recorded for the consultant review clinic. It was noted however that the team

~ 38 ~
felt the assessment form had been a success due to its comprehensive deign
and having all the information recorded during the session instead of after the
session was finished which had been part of the previous way of working. In
order to bring into focus the points learned from the change process a review
date was set for one month post change to review the lessons which had
emerged and also the objectives of the project so that appropriate adaptations
can be made.
By having the informal discussions before and after the clinics it is aimed at
providing a system to facilitate continuous improvement within the new
process, as it allows for the team members to express their opinion to
increase their buy in to the situation. Whilst also keeping it appropriate to the
culture of the department. The meeting date to review the projects objectives
is aimed at facilitating removal of any temporary change structures that have
developed such as having one person write up the assessment form whilst
also quantifying the changes made in terms of assessment form completion
rate, appointment duration and patient wait time. It is also a timely opportunity
to look for any emergent improvements/issues that had not been foreseen to
be addressed and a plan put in place.
Whilst this is the evaluating and learning part of the mainstreaming phase of
the project it is of note that this section will be discussed further in the
discussion section due to the time constraints which affected the project
restricting the content of the chapter

~ 39 ~
4. Evaluation
4.1 Introduction
Evaluation can measure different aspects of healthcare before and after an
intervention (Lazenbatt, 2002). The intervention should, however, be evidence
based so that the gap between research and practice is reduced (Walshe and
Smith, 2011). This can be done by measuring against a standard. Standards
can be taken from international best practice, or if none can be obtained then
a local standard should be set. The focus of the evaluation should be on
efficiency -achievement of aim and objectives, effectiveness - have the
desired outcomes been achieved, economy - have all outcomes been
achieved and equity - has there been a fair opportunity to achieve the
outcome (lazenbatt, 2002).
In order to evaluate the project, it was decided to use both qualitative and
quantitative methods. Quantitative methods tend to assign numbers to the
data collected and can be used in before and after studies. In this way
statistics on time can be collected to evaluate efficiency gains from the
process change, the percentage completion rate of assessment forms and
team opinion when using the likard scale in a questionnaire. Qualitative
methods which look to record peoples experiences were used in the form of
unstructured interviews following each clinic. Whilst neither method has been
shown to be better than the other (Carr, 1994) the emphasis was placed on
the quantitative methods so that quantifiable information was obtained to

~ 40 ~
provide evidence that the theory was affecting the operational efficiency of the
clinic. The qualitative methods were used to turn the teams experience into
possible ways of improving the project, which should then be reflected back in
the quantitative data at the next round of evaluation.
4.2 Quantitative Results
To evaluate the change in efficiency of the redesigned process time data was
collected from the consultant led clinics in 2013 before the change and from
the first two clinics following the change. This was done by having
administration staff record the arrival time of the patient, followed by the
clinician recording the start time and end time of the appointment on a clinic
list located at the front desk in the reception area. This data was recorded for
both assessment and consultant review patients. It was then able to be
analysed into patient wait time and the appointment duration times. No
standards could be found for the length of time a patient should wait in the
prosthetic clinic from arrival to being seen or indeed for the appointment
duration. A local standard was therefore implemented at thirty minutes.
Variation in appointment time was determined so that any change in variation
could be evaluated.
Table 1 displays the average waiting time and its variation for the assessment
clinics for 2013 and 2014. This shows a seventy five percent reduction in the

~ 41 ~
average waiting time post change. The variation has also reduced significantly
with zero
Waiting Time (minutes)
2013 2014 % change
Average wait time
29minutes 7.5 minutes 75% reduction
Shortest wait time 10minutes 0minutes 100% reduction
Longest wait time 50minutes 30minuttes 40% reduction
Table 1: waiting time statistics
minutes being recorded as the shortest wait time and the longest wait time
being shown to have reduced forty percent to thirty minutes. It is of note that
patients who arrived early for their appointments and were seen prior to their
allocated time were not recorded in these statistics in order to maintain equity
in the service. Patients who arrived early but were seen after their allocated
time, had there figures recorded from the allocated time onward, and
conversely patients who arrived after their allocated time were recorded from
their arrival time onward. This was done to maintain equity within the service,
as in the authors’ opinion no control can be exerted over external transport
issues that occur on the day that can adversely affect the perceived efficiency
of the service.
Duration for the assessment appointments were calculated from the patient’s
start to finish time and is shown in table 2.
Appointment time (minutes)
2013 2014 % change
Average time 63 minutes 76 minutes 20% increase
Shortest time 20 minutes 30 minutes 33% increase
Longest time 105 minutes 120 minutes 15% increase
Table 2: Assessment appointment duration

~ 42 ~
This table shows a rise in the average time duration of the assessment
appointments and also that the shortest duration time and longest duration
times both increased. Although this result shows that the opposite of the
intended goal has been achieved, in that time figures have increased instead
of decreasing. It highlights interesting areas for discussion in chapter five as it
is worth considering the content of the assessment form, design and layout of
the assessment form and leadership style, as all will have a bearing on the
duration of the appointment. It is also worth considering that the 2014 data is
taken from the first two clinics, whereas the 2013 data has been taken from
one years’ worth of data of which the appointment duration was recorded over
twenty three clinics from when the time data recording was implemented in
May. Process familiarity may also be a factor as well as perception of
available time in the increase of appointment duration.
So that clinic space utilisation could be quantified for each clinic (assessment
and review appointments combined) the number of hours that each room was
occupied for by one or more patients was determined. This is shown in table
3. Clinics held in 2013 had a total of three and a half hours available for use
per clinic (nine thirty am start time to one pm finish time),

~ 43 ~
Table 3: Space utilisation
whilst the 2014 clinics had a total of four hours during which they were
available to be used (nine am to one pm). Whilst this shows that the number
of rooms being used has increased, it also highlights that the female cast
room which had been allocated to be used in for all new assessments had not
been used for the maximum time available. The first clinic of 2014 had
operated at full capacity for the assessment clinic although one appointment
had been performed in a separate room due to one patient arriving late which
had resulted in another prosthetist using the female cast room and therefore
not available for the assessment. The second clinic had two patients attend
and as the first appointment duration was longer than the allocated hour, part
of the second appointment had been performed in a different room due to the
consultant allocating a registrar to start the session to minimise any patient
delay. Therefore the total time spent on assessment patients was three hours
forty minutes, three hours of that time was spent in the allocated room and
forty minutes in a room not allocated for assessment. This also had the effect
of lengthening the appointment time and reducing the potential waiting time.
In summary the female cast room which had been allocated for use in the
assessment clinic showed a 75% utilisation rate in 2014 compared to 0% in
2013.
Clinic room (average hours per clinic)
2013 2014 Change in utilisation rate
Male fitting room 3.5 hours 4 hours 0%
Female fitting room 3.5 hours 4 hours 0%
Female cast room 0 hours 3 hours +75%

~ 44 ~
Once designed the IDT assessment form was implemented from the first
clinic. The pie chart in figure 2 shows the completion rate from 2013.
Figure2: assessment form completion rate from 2013.
As this was a low completion rate in comparison to the local standard of
100%, it was hoped that by developing an interdisciplinary assessment form
that the completion rate would substantially increase. It had been found that
with assessment form used in 2013 there had been a misunderstanding within
the team as they understood it to be a form that only the prosthetist’s had to
complete, whereas this form had originally been intended to be completed by
all team members. Figure 3 shows the completion rate achieved in 2014 with
a comparison to 2013 results.

~ 45 ~
Figure 3: 2014 assessment form completion rate.
This shows that a 100% completion rate was achieved for the first two clinics,
which represents a 55% increase from the 2013 results. It is of note that there
were zero forms partially completed were defined as one area not being
populated.
The final area of quantitative data analysis was that of the questionnaires.
Two questionnaires’ were designed and circulated to the consultant, registrar,
junior prosthetist, occupational therapist and physiotherapist whom were
involved in the project. The first was questionnaire (see appendix 11) was
aimed at evaluating the teams participation experience in redesigning the
clinic and the second (see appendix 12) was aimed at gaining there opinion
on the format of the clinic. The second questionnaire was circulated before
and after the change. The questionnaires were set up using a seven point
Likert scales with each question so that the participant could rate their answer
Completion rate

~ 46 ~
between very and not very relative to the context of the question. The
participation questionnaire had a return rate of 50% (n=2, but was not
circulated to registrar as they are rotated on a six week rotation), whilst the
clinic format questionnaire had a return rate of 60% (n=3) before the change
and a return rate of 60% (n=3) after the change.
4.2.1 Participation questionnaire
The results have been collated for and averaged for the participation
questionnaire as shown in figure 4
Figure 4 results of the participation questionnaire
From this questionnaire it can be seen that by in large the respondents felt
included within the process of redesigning the consultant led clinic and
satisfied with the outcome. When looking into the results of each question,

~ 47 ~
question one showed similarly positive attitude toward the extent of their
inclusion within the clinic structure. Whereas question two shows that
although both felt included the second respondent felt more included than the
first within their inclusion of designing the new assessment form. Question
three showed the same result of two out of seven on the likard scale
indicating that both felt their input was taken into consideration. Question four
showed a small difference in regard to how their input impacted the outcome
of the project but the average still showed a positive degree of impact.
Question five displayed the biggest difference between the respondents on
how satisfied they are with the new clinic design as the first respondent was
neutral score of four whilst the second respondent scored at two indicating a
strong preference to being satisfied. Question six and seven both scored at
one indicating that both participants felt very satisfied with the design of the
new assessment form and their overall involvement in the project,
4.2.2. Clinic format questionnaire
The aim of the clinic format questionnaire was to quantify the teams’ opinion
on the change clinic structure with view to operating efficiency. Figure 5 is a

~ 48 ~
radar diagram which shows
Figure 5: Radar diagram of clinic format questionnaire before and after change
the average score for each question before and after the change projects
intervention. Across the team there was an improvement noted within each
area. Question one showed an improvement in how well guided the clinicians
felt in obtaining information as the score improved from 2.3 to 1 indicating a
very well guided approach to gaining appropriate information. Question two
showed a significant increase in how effectively clinicians felt there time was
utilised as the score changed from 4.3 (indicating a negatively orientated
opinion) to 1.7 indicating that the time was felt to be used very effectively. It is
of note that question three looks to be a reversal of this trend of improvement,
however it is not the case as by the figure changing from 3.3 to 5 indicates
that clinicians felt they were pulled away (interrupted) less during an
appointment than before the change. Question four shows the smallest

~ 49 ~
change in score following the intervention. By changing from 3 to 2.7 shows a
minor increase in how the clinic structure enhanced the clinicians practice.
The fifth and final question shows a significant improvement in how
appropriate the structure was viewed to be by the clinicians. By the score
changing from 3.6 which is marginally a positively orientated score to 1.7
which is a significantly positive score showing that the clinicians viewed the
new clinic format as very appropriate for the type of appointments which they
were performing.
4.3 Qualitative results
This section was undertaken by having unplanned interviews with the team
once the first two clinics of the new structure had finished. The unplanned
interview consisted of the author, the registrar, physiotherapist and
occupational therapist having a five minute discussion at the end of the clinic.
It revealed three issues that the team felt needed to be addressed. These
were timekeeping during appointments, legibility of the recorded information in
the assessment form and the suitability of the nine am appointment time. The
team put forward the ideas of having a clock in the room in order to keep
timekeeping at the forefront of everyone’s mind and also to have more tick
boxes within each section of the assessment form to help speed up the note
taking aspect and to improve the clarity when reading the form at a later date.
The nine am appointment time was noted for review of attendance and
timekeeping, at the review meeting. The feedback was by in large positive as
the team were participating in continuous improvement of the project whilst it

~ 50 ~
was also noted that the assessment form had saved a lot of time outside of
the clinic, as there was no longer the need for the therapists to write up
individual notes in the afternoon following the clinic.
In summary the evaluation data from the objectives has proved to be
encouraging. Whilst it has identified that appointment duration has increased
which is not a desired outcome, it has shown that waiting time, assessment
form completion rate and the clinic space utilisation rate have all improved.
The questionnaires’ and qualitative data which are not objectives of the
project but do facilitate management of the objectives have given evidence of
the team perceiving the benefits and buying into the project whilst creation of
a quality improvement culture within the team has become evident.
5. Discussion and conclusion
5.1 Introduction
This change management project set out to redesign a consultant led
prosthetic clinic, which operated in the authors department on a weekly basis
each Friday. The purpose of the clinic was for primary amputees to be
assessed by the multi-disciplinary team with view to establishing suitability on
prescribing prosthesis, whilst also providing access for established patients to
be reviewed by the consultant and prosthetist. Approximately eighteen

~ 51 ~
months prior to initiating the project a new clinic structure and assessment
form had been implemented based on a multidisciplinary team approach used
in some NHS prosthetic centres in the UK, where by four patients were
appointed for the same time and were assessed individually by a team
member in rotation. Although this had advantages of effective time utilisation it
had not been effectively implemented resulting in variation in appointment
duration, variation in waiting time, interruptions to appointments as clinicians
were asked to leave one session and join another session and an assessment
form completion rate of forty five percent. The assessment form was
designed to be completed by each team member; however this was
misunderstood and was commonly thought to be for the prosthetist to
complete.
The literature review revealed that there was a need to establish the current
patient flow during the clinic so that delays can be identified and then the flow
process mapped into a new flow using lean management principles (Anon,
2004) to eliminate delays whilst ensuring that each step of the process added
value to the process purpose (Womack et al, 2005). It also showed that
standardised documentation allowed for increased consistency in the quality
of the documentation (Ungan, 2006) by reducing variation and that this could
be achieved by having a standardised assessment form which all team
members completed. In turn this would also assist in good communication
(Tornvall & Wilhelmsson, 2007) forming the care plan which would be part of
the outcome of the assessment appointments. In order to change the clinic
structure and implement a new assessment form the HSE change model

~ 52 ~
(HSE, 2008) was used. This had four main stages in its design which were
initiation, planning, implementation and mainstreaming. This chapter will aim
to discuss the strengths and limitations of the project and also its
organisational impact and recommendations.
5.2 Project strengths
In the authors opinion one of the main strengths of the project was the
understanding of the culture that was evident within the team. There were two
aspects to this. One was that of interdisciplinary team work and the second
was the communal culture (Goffee and Jones, 1998) identified during the
situational analysis in the initiation phase of the project. The culture around
interdisciplinary team work had developed from the in-patient setting, where
the hospital had gained accreditation from the commission on the
accreditation of rehabilitation facilities (CARF) by adhering to CARF
standards. One of the foundations of the accreditation is for interdisciplinary
team working, which was identified in the literature review as being
appropriate for rehabilitation (Behm, 2011) due to its collaborative approach in
skill utilisation to enhance problem solving. This relies on good
communication amongst team members to be an effective model of practice.
So strong was the belief in interdisciplinary practice that when the failed
multidisciplinary model was brought forward for discussion, it drew a polite
passive resistance from the two team members present. As this was in line
with the introverted component of their personality trait, it was viewed as a
strong form of resistance to the concept which was likely to intensify if the

~ 53 ~
method was improved. By contrast when the interdisciplinary assessment
model was suggested it drew a much more positive response which added
further weight to proceeding with that as the model for assessment. When
used both models are effective in providing the relevant information to the
team for decision making on the prescription outcome and forming a care
plan. The resistance can not only be viewed as cultural but as self-interest
(Kotter and Schlesinger, 2008) as individual practice has evolved around this
model from both clinicians whom had only worked with the team post CARF
accreditation and would represent a large degree of change to practice.
A corner stone of effective interdisciplinary work is good communication
(Behm and Gray, 2010) within the team and this was also found within the
communal culture (Goffee and Jones, 1998) with a positive slant as identified
within the department. As communal cultures have a high degree of sociability
and when a positive slant is evident, it will manifest itself in the teams’
behaviour with high level of social interaction where people can share ideas
openly between each other. Although it can’t be said as to which culture
developed first as this data is not available, it is undoubtedly the similarity
between the identified cultures that bind the team model to the team culture.
This was then able to be used by the author to help drive the change by
reducing resistance at a conceptual level.
Building on the collaborative approach and the high levels of communication a
further strength of the project could be argued to be the strategy of

~ 54 ~
participation and involvement (Kotter and Schlesinger, 2008). Again by
drawing on these fundamental attitudes within the team further success was
gained within a process mapping exercise, which proved a good tool of
education for all members of the team. It became evident during the process
mapping exercise that there were different levels of understanding by each
stakeholder around the issues which surrounded the clinic a as it had not
been fully appreciated by the team as to the extent by which patients were
being delayed by team members moving between patients in an unplanned
way during appointments. It was a measure of this success that the process
map was referenced by the team during clinics where such delays were
occurring, which in the authors opinion demonstrated a good degree of buy in
from the team. Whilst this degree of support for the project could be viewed
with pleasant surprise on the basis of the failure of the previous attempt to
change the clinic, it really depends on the point of perspective of the
individual.
The previous attempt had failed essentially due to a lack of appreciation for
the core beliefs and culture of the team. This derived from the physiotherapist,
occupational therapist and consultant all working within the in-patient service
under interdisciplinary team work model and having no other reference point
from which to base their practice in the out-patient setting. The out-patient
setting is indeed where the consultant led prosthetic clinic operates. In
contrast to this the prosthetist’s work in the in-patient setting one day per
week and four days per week in out-patient clinics which are multi-disciplinary
based. Therefore it is the authors’ belief that it was of little importance what
~ 55 ~
structure was to be suggested, as to have an multidisciplinary model would
mean that the degree of change to the in-patient based team was high and
the impact on culture was high, meaning that there would be high resistance
to the project with a low chance of success. By learning from this experience
and proposing a new structure which had a low impact on culture and low
degree of change (from the therapists’ perspective) indicated that a high
chance of success was likely. It was hoped that by aligning the new process
to established ways of working it would help embed it into the culture of the
team so that it would become the new normal (Young, 2009).
Therefore when the presentation was performed to the team, little resistance
was encountered. Although in some situations this may have been a passive
form of resistance which was witnessed before, sufficient evidence of buy in
to the project had been displayed to believe that the reaction was genuine.
For example the team collaboration on the process mapping and the support
for the move from multi-disciplinary team model to interdisciplinary team
model. The only concern at this time for the author was from the pending
departure of the consultant and the programme manager not yet having
assumed their post. In a backdrop where there had been a degree of
schismatic behaviour during past projects from major stakeholders, whereby
full support of a project would be offered despite voicing beliefs that it was not
progressing correctly without attempting to intervene. There was a concern
that support of the project could reduce from a reduction in work placed
motivation levels which may adversely affect the projects outcome. Although it
did not occur it shall be discussed later in the chapter under limitations.

~ 56 ~
5.3 Project limitations
The main limitations of the project were that of delays and the qualitative
nature of the assessment form. All of which will now be discussed.
Two main delays occurred in the project which limited the outcome at time of
submission. Both essentially revolved around two main stakeholders in the
process which culminated in a delay in starting the project and then a delay
between the planning and implementation phase of the project.
Chronologically the first delay was starting the initiation phase. Whilst this was
aimed at September it did not start until January. The reason for this was that
the authors’ employer had undergone staff change resulting in a senior
prosthetist leaving the team and being replaced by a junior member in the
same month (April) as the author was moved into the department manager
position. This led to an increase in basic clinical work by the author whilst also
managing the development of the new junior member of staff. Although a
case could have been made to start the project and use the newly acquired
positional power to negotiate obtaining protected time, it is arguable that this
did not happen due to the context of the organisational change that had led to
the authors’ promotion. In retrospect it is evident that the author was
unconsciously accepting the new situation that the organisation had found
itself it (Boonstra et al, 1998) and not that of his own objectives in relation to
the redesign of the consultant led prosthetic clinic. This objective was not in
line with the employers need to secure revenue generation following the loss
of a revenue generating asset, which made it more likely that the true

~ 57 ~
definition of the authors own objectives at this time was to embed into the
department manager position and maintain the employers financial wellbeing.
This is understandable given that the desired outcome of the situation was
being consciously adjusted by the author to one that benefited both employer
and employee on the basis that it was fair (Bazerman, 2003) to all parties
given the authors desire to succeed and justify his promotion. Essentially this
links to the second level of Maslow’s hierarchy of needs (Maslow, 1943) which
is safety and security, in this case preserving and establishing the author in a
new position. From empirical knowledge this had always been viewed as a
challenging position due to the demands placed upon the individual
concerned.
The second major delay to affect the project occurred unfortunately due to
consultant/service director sick leave, which accounted for a one month delay
between March and April. Although evidence suggests that the longer the
duration of a change management project the more likely it is to succeed
(Sirkin et al, 2005), the reality of the situation was that work based pressures
that had developed following the projects inception such as drive for revenue
and the implementation of a new IT system were drawing significant amounts
of the authors time and energy which in combination with this new unexpected
delay was putting the project at risk of failure by testing the authors resilience.
Whilst ultimately this did not happen, it limited the project by influencing the
authors’ decision on not seeking an extension in order to complete the project
and eliminating a source of stress by completing it within the time frame. Had
an extension been sought then it would have allowed for the project to have

~ 58 ~
been written up at a later date with increased levels of data from the
mainstreaming phase to be incorporated.
In the consultants/service directors’ absence and with the new programme
manager yet to take up their post the team did not view it appropriate to
proceed with the project until the situation had resolved. Although the project
could have progressed quite effectively in the absence of afore mentioned
stakeholders the reason it did not, in the authors opinion, comes down to the
leadership style within the department that is the power culture (Handy, 1999).
Using this model it can be seen that the consultant/director of service is at the
centre of the team exerting expert power to control the team into achieving
results for the patient. Non-consultant led initiatives generally progress from
the ability to influence the consultant by other team members as opposed to
another designated team member making the decision. It was inevitable that
the leave of absence would have resulted in a time delay to the project.
However when pondering the question of why this situation exists and if it is
appropriate to the department when it is delaying this project but possibly
other initiatives or decisions too, then the hospital management’s influence
over consultants must be considered. Not only with specific relation to this
project but as a general concept. Essentially whilst working in the same
organisations consultants are governed by a set of values and principles
different to that of managers, the hospital board or even the nurses/therapists
(Glouberman and Mintzberg, 2001). This has resulted in them becoming a
separate entity within the hospital with which they are involved with and are
technically independent of its formal authority whilst directing their activities

~ 59 ~
into operations of delivering the service to the patients. The hospital board,
management and nurses/therapists can also be viewed as separate entities
within this concept making the four organisational components of the hospital
disconnected, which it would be argued gives rise to a culture of physician
autonomy (Bridea, 2004).
In a situation whereby the nurses/therapists and consultants are acting toward
a service delivery initiative then common ground would be found to progress
on, although the nurses/therapists would remain under hospital management
control whilst the consultants would not. This would lead to a situation
whereby the consultants and management would have to collaborate together
to achieve the desired goal, with the challenge being that the management
would have very little influence over the consultants given that the consultants
view the hospital as a place they work and not as their employers
(Glouberman and Mintzberg, 2001). When translated into the context of this
project where the situation had arisen of the new programme manager not yet
being in place, full responsibility was with the consultant who had
considerable influence over the previous programme manager. Therefore
when neither person was present the only two options to continue with the
project and avoid delay were either to proceed without formal permission
which would have been out with the authors’ responsibilities or to seek
approval from the CEO. Given the context of the organisational structure the
author deemed that to proceed would have made the project unsustainable in
the long term, as the returning consultant would have viewed that action as

~ 60 ~
inappropriate in the absence and would likely have disengaged with
supporting the project. Such a risk was not justified.
The other limitation of the project was the qualitative nature of the assessment
form (see appendix 13). The content of the assessment form was taken from
existing assessment forms used in the in-patient and out-patient setting in
order to facilitate construction of the patient care plan. Whilst the factors used
to predict ability of prosthetic use were taken from publications identified
during the literature review and empirical knowledge.
This has led to the team acknowledging the assessment form to be very
comprehensive with more sections to complete than the previous assessment
form, but has been well received by all the team. However as the majority of
the content have blank boxes with headings and examples at the top of the
box, it has caused an issue with appointment duration and legibility. This was
identified by the team during feedback interviews as they acknowledge that
the time is too long, although they are suggesting methods of improving this.
Upon reflection there are two main reasons as to why this occurred. Firstly
that the predictive factors found in Sansam’s 2009 publication outlined each
factor but did not stipulate in a format that could be entered into a tick box
format, which in combination with predetermined standardised measurements
and tests will reduce completion time (Swinkels et al, 2011). Also the same
situation was found within the assessment forms that were already in use
throughout the department. Whereby data boxes that were populated by

~ 61 ~
written information had been incorporated into their design, giving a situation
where there were a limited number of tick box style sections to be added to
the new form. One possible solution to this issue would have been to
retrospectively perform a contents analysis on the assessment forms already
in use; so that the most commonly entered data could be obtained and set up
in tick box style. However, due to the external work places pressures already
outlined and with no other resources available to assist in the project, the
author was unable to progress the assessment form in this manner. It will
however be discussed in the recommendations section.
Legibility of the form post completion was also deemed to be an issue. During
the evaluation stage the author reviewed the completed assessment forms
and found the legibility to be low in some instances. From having been
involved with the assessments it was known to have occurred when either
time was pressurised or from individual hand writing styles. Although there is
familiarity within the team of hand writing styles, it is an issue that needs to be
improved upon so that team members who rotate onto the team are able to
read the documentation and absorb all the available information to enhance
communication.

~ 62 ~
5.4 Organisational Impact
Although the mainstreaming phase of the project is in its infancy, there is
much to ponder on the impact that the new clinic structure is having on the
team. As the evaluation phase showed that the assessment form completion
rate improved by 55% and the average patient waiting times reduced by 75%,
it can be considered to be an improvement in performance.
When outlined against the four p model (purpose, process, people and
performance) whereby the performance comes from a synergy of purpose,
people and process, the improvements can be seen in context of the
organisation. Where as in the previous clinic model there were knowledgeable
people with strong values of interdisciplinary team working using different
forms of documentation trying to work in a process that was not aligned to
either people or purpose. It is understandable that the performance level was
low in areas such as assessment form completion rate and patient waiting
time. Whereas with the new clinic structure the values and beliefs,
expectations of the people have been aligned to the processes which facilitate
interdisciplinary team working to meet the purpose of the clinic which has led
to the improved performance level.
Building on the changes which improved the clinics performance, gives
opportunity to improve the preparation work on the care plan by continuous
revision of the assessment form. Whilst the need for changing the qualitative

~ 63 ~
nature of the assessment form was discussed under the limitations section of
chapter five, further drafts of the assessment form will be able to incorporate
sections of the more peripheral team members involved during the primary
rehabilitation phase, such as dietetics, medical social work and psychology.
Although careful consideration would need to be given to the size and data
recording method within each section so as to avoid issues of validity,
reliability and time management, it does none the less give significant
opportunity to enhance the clinical information recording and subsequent
efficiency and quality of the patient care plan.
Underpinning afore mentioned areas is that of a quality improvement culture
being initiated amongst the team. The author would argue that this has
developed from the leadership shown in developing the project and the
subsequent buy-in from the team who understood the opportunity to improve
their own practice. Whether or not the positive response to the project will
remain, is no doubt resting on the leaders’ ability to focus the team. In order to
refine the assessment form and the clinic process in the wake of new
challenges or initiatives that will emerge as time progresses. At present this
culture stands to have a substantial impact on the organisation as a culture of
quality improvement had been intermittently evident due to a lack of
leadership when areas of improvement were raised. Certainly with regard to
the consultant led clinic, team members withdrew from approaching areas
where they perceived improvements could be made. Possibly due to the
perceived complexity of the issues or possibly due to uncertainty around the
leadership of any proposed initiative. Whilst the author would argue that both

~ 64 ~
are valid, it none the less remains that if used appropriately this will have a
substantial impact on the organisation out with the project.
5.5 Recommendations
By redesigning the process by which patients are seen at the consultant led
prosthetic clinic and by introducing a new assessment form, efficiency gains
have been made and a culture of continuous quality improvement is
developing. This must be utilised to good effect by continuing to develop the
assessment form to incorporate the peripheral therapies who are involved
during primary admissions to the service, allowing for a more comprehensive
care plan to be developed. Additionally the qualitative nature of populating the
assessment form should be revised to tick box style where appropriate by
reviewing the data entered. By doing so, it will make the form quicker to
complete without compromising the quality of the content. In addition to this
timekeeping by the team needs to be improved during the patient
appointments so that the allocated appointment time can be adhered to.
Evaluation of the first two clinics showed that this is an area for improvement.
Finally regular review dates of the project objectives have been set at monthly
intervals so that any changes within the evaluation objectives can be
monitored and so that the new consultant and programme manager be
educated on the project. By doing so, the assessment form can be used to
~ 65 ~
offer guidance on clinical practice to the new consultant whilst also benefiting
from new insight.
5.6 Conclusion
The aim of the project was to redesign the consultant led prosthetic clinic. In
order to do so the clinic process was redesigned and complimented with a
new assessment form. Evaluation parameters were determined at the onset.
By selecting the HSE change model the author was able to adapt to changing
circumstances which developed during the course of the project. Whilst the
changing circumstances were largely outside of the authors control and
represented a significant threat to the success of the project. The project has
never the less managed to set in motion a change that has benefited the team
and most importantly the patients. Although appointment duration has
increased by 20% which was not intended, clinic space utilisation increased,
waiting times reduced by 75% and assessment form completion rate
improved by 55%. With the initiation of a quality improvement culture within
the team now becoming evident, there is every opportunity for the efficiency of
the redesigned clinic to keep on improving into the future.

~ 66 ~
Reference List
Abrahamson, D. (1999). Outcomes, guidelines and manuals: on leading horses to water. Clinical Psychology: Science and Practice, 6(467-471).
Anon. (2004). Toyota principles teach how to implement change in Healthcare. Health Care Biller, 10 – 11.
Appelbaum, S. H., Habashy, S., Malo, J.-L., & Shafiq, H. (2012). Back to the future: revisiting Kotter’s 1996 change model. Journal of Management Development, 31(8), 764–782. doi:10.1108/02621711211253231
Audit Commission. (2002). Ear Nose and throat and audiology services: access to care.
Audit Commission. (2003). Acute Hospital Portfolio; review of national findings: outpatients.
Baker, D. R., Pronovost, P. J., Morlock, L. L., Geocadin, R. G., & Holzmueller, C. G. (2009). Patient flow variability and unplanned readmissions to an intensive care unit*. Critical Care Medicine, 37(11), 2882–2887. doi:10.1097/CCM.0b013e3181b01caf
Balogun, & Hailey. (2004). Exploring strategic change.
Bamford, D., & Chatziaslan, E. (2009). Healthcare capacity measurement. International Journal of Productivity and Performance Management, 58(8), 748–766. doi:10.1108/17410400911000390
Bamford, D. R., & Forrester, P. L. (2003). Managing planned and emergent change within an operations management environment. International Journal of Operations and Production Management, 23(5), 546–564.
Bazerman, M. H. (2003). When Self-Interest Is Sabotage. Harvard Business Review.
Behm, J., & Gray, N. (2010). Members of the Rehabilitation team (pp. 51–62).
Best, M., & Neuhauser, D. (2006). Walter A Shewhart, 1924, and the Hawthorne factory. Quality & Safety in Health Care, 15(2), 142–3. doi:10.1136/qshc.2006.018093
Bjorvel, Wredling, & Thorell-ekstrand. (2003). Improving documentation using a nursing model. Journal of Advanced Nursing, 43(4), 402–410.
Blankertz, L., & Cook, J. A. (1998). Choosing and using outcome measures. Psychiatric Rehabilitation Journal, 22(2), 167–174. doi:10.1037/h0095251
Boonstra, J. J., & Gravenhorst, K. M. B. (1998). Power Dynamics and Organisational Change: A Comparison of Perspectives. European Journal of Work and Organisational Psychology, 7(2), 97–120.
Bosek, M. S. D., & Ring, M. E. (n.d.). Does good documentation equate to good nursing care? JONA’S Healthcare Law, Ethics and Regulation, 12(2), 43–7. doi:10.1097/NHL.0b013e3181e05ee7

~ 67 ~
Brideau, L. P. (2004). Flow: Why does it matter? Frontiers of Health Service Management, 20(4), 46–50.
Buckmaster, N. (1999). Associations between outcome measurement, accountability and learning for non-profit organisations. International Journal of Public Sector Management, 12(2), 186–197. doi:10.1108/09513559910263499
Burnes, B. (2004). Managing change: A strategic approach to organisational dynamics. Management Decision, 34(10), 11–18.
Carr, L. T. (1994). The strengths and weaknesses of quantitative and qualitative research: what method for nursing? Journal of Advanced Nursing, 20(4), 716–21. Retrieved from http://www.ncbi.nlm.nih.gov/pubmed/7822608
Condie, E., Scott, H., & Treweek, S. (2006). Lower limb prosthetic outcome measures: A review of the literature 1995 to 2005. American Academy of Orthotists and Prosthetists, 18(6).
Cox, J. L., Zitner, D., Courtney, K. D., MacDonald, D. L., Paterson, G., Cochrane, B., … Johnstone, D. E. (2003). Undocumented patient information: an impediment to quality of care. The American Journal of Medicine, 114(3), 211–216. doi:10.1016/S0002-9343(02)01481-X
De Souza, L. B., & Pidd, M. (2011). Exploring the barriers to lean health care implementation. Public Money & Management, 31(1), 59–66. doi:10.1080/09540962.2011.545548
Dyer, J. A. (n.d.). Multidisciplinary, interdisciplinary, and transdisciplinary Educational models and nursing education. Nursing Education Perspectives, 24(4), 186–8. Retrieved from http://www.ncbi.nlm.nih.gov/pubmed/14528864
Eldrod, P. D., & Tippett, D. (2002). The “death valley” of change. Journal of Organisational Change Management, 15(3), 273–291.
Ferguson, F., Holdsworth, L., Rafferty, D. (2010). A national framework for supporting improvements in the physiotherapy assessment and management of low back pain: The Scottish experience. Physiotherapy.
Gailey, R. S., Roach, K. E., Applegate, E. B., Cho, B., Cunniffe, B., Licht, S., … Nash, M. S. (2002). The Amputee Mobility Predictor: An instrument to assess determinants of the lower-limb amputee’s ability to ambulate. Archives of Physical Medicine and Rehabilitation, 83(5), 613–627. doi:10.1053/apmr.2002.32309
Garland, A. F., Kruse, M., & Aarons, G. A. (2003). Clinicians and outcome measurement: What’s the use? The Journal of Behavioral Health Services & Research, 30(4), 393–405. doi:10.1007/BF02287427
Garner, H. (1995). Teamwork models and experience in education.
Gemmel, P., & Dierdonck, R. Van. (1999). Admission scheduling in acute care hospitals: does the practice fit with the theory? International Journal of Operations & Production Management, 19(9), 863–878. doi:10.1108/01443579910280188

~ 68 ~
Glouberman, & Mintzberg. (2001). Managing the care of health and cure of disease - part 1: Differentiation.
Goffee, R., & Jones, G. (1998). The Character of a Corporation.
Goldratt, E., Cox, J. (2000). The Goal.
Ham, R., Regan, J. M., & Roberts, V. C. (1987). Evaluation of introducing the team approach to the care of the amputee: the Dulwich study. Prosthetics and Orthotics International, 11(1), 25–30. Retrieved from http://www.ncbi.nlm.nih.gov/pubmed/3588260
Handy, C. (1999). Understanding Organisations (pp. 183–184).
Haraden, R,. Resar, C. (2004). Patient flow in hospitals: Understanding and controlling it better. Frontiers of Health Service Management, 20(4), 3–15.
Herbert, C. P., Bainbridge, L., & Bickford, J. (2007). Factors that influence engagement in collaborative proactice: How 8 health professionals became advocates. Canadian Family Physician, 53, 1328–1325.
Hewitt-Taylor, J. (2003). National recommendations and guidelines.
HSE. (2008). Improving Our Services.
Ioanna, P., Stiliani, K., & Vasiliki, B. (2007). Nursing documentation and recording systems of nursing care. Health Science Journal, 4.
Jorge, M., Nielsen, C. C., & Lusardi, M. M. (2013). Orthotics and Prosthetics in Rehabilitation.
Kotter, J. (2006). Leading change: why transformation efforts fail. Harvard Business Review.
Kotter, & Schlesinger. (2008). Choosing strategies for change.
Lazenbatt, A. (2002). The evaluation handbook for healthcare professionals (pp. 127–129).
Maslow, A. H. (1943). A theory of human motivation. Psychological Review, 50(4), 370–396. doi:10.1037/h0054346
McCallin, A. (2001). Interdisciplinary practice--a matter of teamwork: an integrated literature review. Journal of Clinical Nursing, 10(4), 419–28. Retrieved from http://www.ncbi.nlm.nih.gov/pubmed/11822488
McGeehan, R. (2007). Best practice in record-keeping. Nursing Standard (Royal College of Nursing (Great Britain) : 1987), 21(17), 51–5; quiz 58. doi:10.7748/ns2007.01.21.17.51.c6397
McSherry, R., & Taylor, S. (2003). Developing best practice clinical governance and best value: meeting and modernisation agenda.
Mento, A., Jones, R., & Dirndorfer, W. (2002). A change management process: Grounded in both theory and practice. Journal of Change Management, 3(1), 45–59. doi:10.1080/714042520

~ 69 ~
Miller, W. C., Deathe, A. B., & Speechley, M. (2001). Lower extremity prosthetic mobility: a comparison of 3 self-report scales. Archives of Physical Medicine and Rehabilitation, 82(10), 1432–40. doi:10.1053/apmr.2001.25987
Morley, M., Moore, S., Heraty, N., Linehan, M., & MacCurtain, S. (2004). Principles of Organisational Behaviour an irish text.
Mumma, C. M., & Nelson, A. (1996). Rehabilitation nursing: Process and applications, 2, 20–36.
NHS. (2002). Matching Capacity and Demand.
NHS. (2005). Improving Flow.
Nicholls, S., Cullen, R., O’Neill, S., & Halligan, A. (2000). Clinical governance: its origins and its foundations. British Journal of Clinical Governance, 5(3), 172–178. doi:10.1108/14777270010734055
Papworth, M. A., Milne, D., & Boak, G. (2009). An exploratory content analysis of situational leadership. Journal of Management Development, 28(7), 593–606. doi:10.1108/02621710910972706
Parikh, J. A., Yermilov, I., Jain, S., McGory, M. L., Ko, C. Y., & Maggard, M. A. (2007). How much do standardized forms improve the documentation of quality of care? The Journal of Surgical Research, 143(1), 158–63. doi:10.1016/j.jss.2007.03.040
Radnor, Z., Walley, P., Stephens, A., & Bucci., G. (2006). Evaluation of the lean Approach to Business Management and its Use in the Public Sector.
Sansam, K., Neumann, V., O’connor, R., & Bhakta, B. (2009). Predicting walking ability following lower limb amputation: A systematic review of the literature. Journal of Rehabilitation Medicine, 41, 593–603.
Schilling, J. (2006). On the Pragmatics of Qualitative Assessment. European Journal of Psychological Assessment, 22(1), 28–37. doi:10.1027/1015-5759.22.1.28
Senapati, N. R. (2004). Six Sigma: myths and realities. International Journal of Quality & Reliability Management, 21(6), 683–690. doi:10.1108/02656710410542070
Sheehan, D., Robertson, L., & Ormond, T. (2007). Comparison of language used and patterns in communication interprofessional and multidiscilinary teams. Journal of Interprofessional Care, 21(1), 17–30.
Sheldon, T. A. (2005). The healthcare quality measurement industry: time to slow the juggernaut? Quality & Safety in Health Care, 14(1), 3–4. doi:10.1136/qshc.2004.013185
Shiffman, R. N. (2003). Standardized Reporting of Clinical Practice Guidelines: A Proposal from the Conference on Guideline Standardization. Annals of Internal Medicine, 139(6), 493. doi:10.7326/0003-4819-139-6-200309160-00013
Silvester, K., Frcophth, M. B. A., Bevan, H., & Obe, D. B. A. (2004). Reducing waiting times in the NHS : is lack of capacity the problem ?, 105–111.

~ 70 ~
Sirkin, H. L., Keenan, P., & Jackson, Al. (2005). The Hard Side of Change Management. Harvard Business Review.
Sorrells-Jones, J. (1997). The challenge of making it real: interdisciplinary practice in a “seamless” organisation. Nursing Administration Quarterly, 21(2), 20–30.
Strasser, D. C., Falconer, J. A., & Martino-Saltzman, D. (1994). The rehabilitation team: Staff perceptions of the hospital environment, the interdisciplinary team environment and interprofessional relations. Archives of Physical Medicine and Rehabilitation, 75, 177–182.
Swinkels, R. A. H. M., van Peppen, R. P. S., Wittink, H., Custers, J. W. H., & Beurskens, A. J. H. M. (2011). Current use and barriers and facilitators for implementation of standardised measures in physical therapy in the Netherlands. BMC Musculoskeletal Disorders, 12, 106. doi:10.1186/1471-2474-12-106
Todnem By, R. (2005). Organisational change management: A critical review. Journal of Change Management, 5(4), 369–380. doi:10.1080/14697010500359250
Törnvall, E., & Wilhelmsson, S. (2008). Nursing documentation for communicating and evaluating care. Journal of Clinical Nursing, 17(16), 2116–24. doi:10.1111/j.1365-2702.2007.02149.x
Ungan, M. C. (2006). Standardization through process documentation. Business Process Management Journal, 12(2), 135–148. doi:10.1108/14637150610657495
Van-der-Linde, Geertzen, J., Hofstad, C., Limbeck, J. Van, & Postema, K. (2004). A systematic review of the effects of different prosthetic components on human locomotion functioning with a lower limb prosthesis.
Walshe, K., & Smith, J. (2011). Healthcare Management.
Wang, L., Shen, W., Xie, H., Neelamkavil, J., & Pardasani, A. (2002). Collaborative conceptual design—state of the art and future trends. Computer-Aided Design, 34(13), 981–996. doi:10.1016/S0010-4485(01)00157-9
Webber, W. B. (1987). Rhinoplasty: The Importance of Consistent Documentation and Significant Long-Term Follow-Up. Plastic & Reconstructive Surgery, 79(4), 640–654.
Womack, James P., Arthur P Byrne., Orest J Flume., Garry S Kaplan., J. T. (2005). Going Lean in Healthcare. Insitute for Healthcare Improvement.
Young, M. (2009). A meta model of change. Journal of Organisational Change Management, 22(5), 524–548.
Zigan, K., Macfarlane, F., & Desombre, T. (2008). Intangible resources as performance drivers in European Hospitals. International Journal of Productivity and Performance Management, 57(1), 57–71.

~ 71 ~
Appendices
Appendix 1: SWOT analysis
Well educated team
Dedicated team
Need to change acknowledged by team
Supportive consultant
Supportive evidence to change Strengths
Prosthetic department layout
Low Staffing levels
Note keeping from therapists
Leadership structures
Time consuming paperwork
Change in IT system
Nursing cover available on call Weaknesses
Opportunities
New rehabilitation consultant starting in March
Increase in request for clinical information in new prescriptions
Improve documentation
Reduce delays
Improve clinic space utilisation
Threats
Change in Programme manager
Transport to hospital
Slowdown in sanction times
Staff changes and shortages
Change in IT system

~ 72 ~
Appendix 2: TOWS analysis
Strengths Weaknesses
Opportunities New Interdisciplinary assessment form
Standardise documentation
Improve care plans
Redesign clinic process
(strategies for advancement)
Utilise available clinical space
Maximise clinician time with patients
Run parallel clinics (overcome weaknesses)
Threats
Stay with Friday as allocated day to avoid transport and staff availability issues
Obtain consultant support
Establish nominated leader
(avoid threats)
Investigate room redesign once project has begun
Avoid any transport schedule issues
Redistribute paperwork over the team
(avoid and overcome)

~ 73 ~
Appendix 3: PESTLE
Political Changing rehabilitation service delivery model
Increase in number of rehabilitation consultants
Pending change in procurement policy
Haddington road agreement
Irish association of prosthetist and Orthotist
Strategic partnership
Commission of Accreditation for Rehabilitation facilities
Economic Slowdown in sanction times
Staff cut backs
Availability of transport
Social Reduction in take home pay across general public
Increased need for family support
Aging population
Technological High definition link
Increasing component cost
Change in IT system
Legal/Ethical HIQA safer better healthcare
No regulatory body for prosthetics and orthotics
Environmental New hospital project
Poor clinical space layout
Hospital accessibility from local road works

~ 74 ~
Appendix 4: Stakeholder analysis
Nurse Manager Community Transport Team administration staff
Consultant/director of service Programme manager Senior Physiotherapist Physiotherapist Senior Occupational therapist
Occupational therapy manager Physiotherapy manager
Authors employer
High
High
Low Influence
Imp
ort
ance
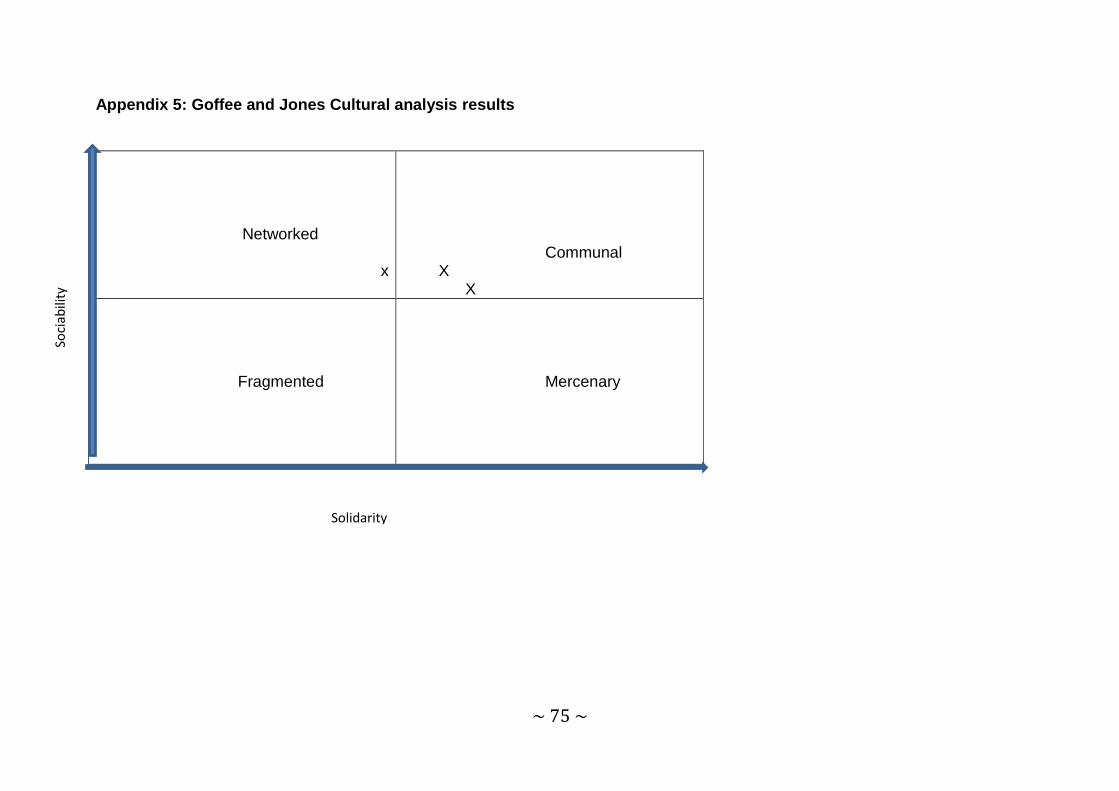
~ 75 ~
Appendix 5: Goffee and Jones Cultural analysis results
Networked
x
Communal X X
Fragmented
Mercenary
Solidarity
Soci
abili
ty
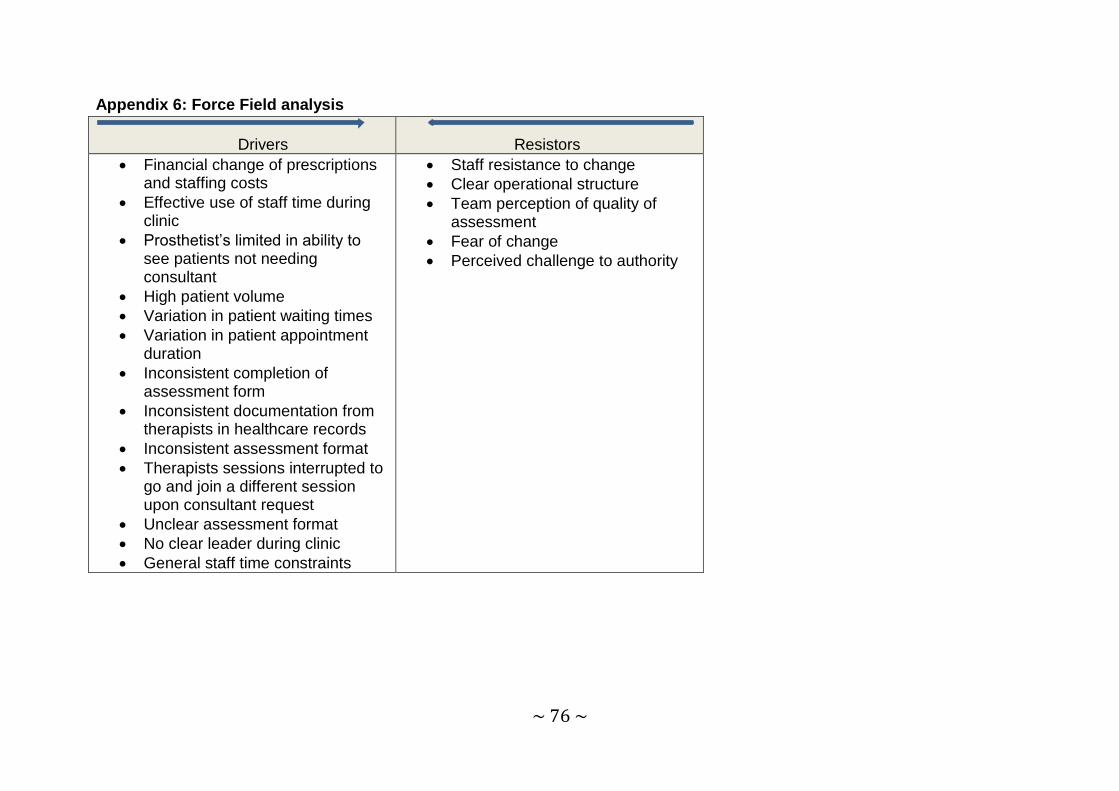
~ 76 ~
Appendix 6: Force Field analysis
Drivers
Resistors
Financial change of prescriptions and staffing costs
Effective use of staff time during clinic
Prosthetist’s limited in ability to see patients not needing consultant
High patient volume
Variation in patient waiting times
Variation in patient appointment duration
Inconsistent completion of assessment form
Inconsistent documentation from therapists in healthcare records
Inconsistent assessment format
Therapists sessions interrupted to go and join a different session upon consultant request
Unclear assessment format
No clear leader during clinic
General staff time constraints
Staff resistance to change
Clear operational structure
Team perception of quality of assessment
Fear of change
Perceived challenge to authority

~ 77 ~
Patient
attends
clinic
Patient booked into
clinic by administration
staff
Wait Wait
Consultant allocated to
patient
Second consultant
allocated to patient
Registrar allocated to
patient
Second registrar allocated to
patient
Patient taken to
clinic room
Assessment
starts
Flow follows identical path
as per consultant allocation
and run in parallel
Consultant allocates medic to
patient
Appendix 7: Established state process map

~ 78 ~
Can medic
start
assessment
?
assessmen
t?
Can
Physiotherapist
start
assessment?
Is a change of
room necessary?
No
Yes
no
yes
Wait
Room changed
Assessment
complete Is a change of
room necessary?
Wait
Room changed
Assessment
complete
Yes
Yes
No

~ 79 ~
Can
Occupational
therapist start
assessment?
Is a change of
room necessary?
Wait
Room changed
Assessment
complete Assessment
complete Is a change of
room necessary?
Can Prosthetist
start
assessment?
Wait
Room changed
Yes Yes
Yes Yes
No No
No No

~ 80 ~
Has everyone
completed their
assessments?
Yes
Has the medic
completed their
section?
No
Is the medic
available?
Is a change of
room needed? Medic completes
assessment
Can the medic be
found?
Can an alternative
be found?
Wait
Wait
Wait
Room changed Wait
No
No
No
No
Yes
Yes
Yes
No
Yes

~ 81 ~
Has the OT
completed their
section?
Is the OT
available?
Does team
proceed without
OT?
Is a change of
room necessary?
Room changed
OT completes
assessment
Wait
Wait
Has the
Physiotherapist
completed their
section?
No
No
No
No
Yes
Yes
Yes
Yes
Is the
physiotherapist
available?
Is a change of
room necessary?
Does the team
proceed without
Physio?
Wait
Is the OT
available?
Wait
Physiotherapist
completes
assessment
No
No
No
No Yes
Yes
Yes
Room changed

~ 82 ~
Has the
Prosthetist
completed their
section?
Is a Prosthetist
available?
Is a change of
room needed?
Can a prosthetist
be found?
Proceed without
prosthetist?
Does team need a
prosthetist?
Wait
Room changed
Wait
Prosthetist
completes
assessment
Wait
Yes
No
No
No
No
No
No Yes
Yes
Yes
Yes
Yes
Have all
available
team
members
completed
assessment
Yes
No

~ 83 ~
Assessment ends Team leaves room Wait
Are all team
members available
to discuss?
Team members
discuss patient
Can missing team
members be found?
Is appropriate
information available to
discuss patient?
Wait
Wait
Is a prescription
appropriate?
Predicted activity
level determined
Prescription agreed
by the team
Team inform
patient
Patient leaves
department
Prosthetist writes
up health care
records
Does patient need
reassessment?
Team inform
patient
Patient leaves
department
Prosthetist writes
up health care
records End
Yes
No
No
No
Yes
Yes
Yes
No
No

~ 84 ~
Does patient
need
community
services?
Wait
Are community
services
available?
Wait
Team
inform
patient
Prosthetist
writes up
health care
records
Patient
leaves
department
Are in-patient
services
appropriate?
Team
inform
patient
Patient listed
for admission
to hospital
Patient
leaves
department
Prosthetist
writes up
health care
records Are day-patient
services
appropriate?
Does consultant
think further action
is appropriate?
Team
inform
patient
Patient
leaves
department
Prosthetist
writes up
health care
records
End
End
End
No
Yes Yes
Yes
Yes
No
No
No
No Yes

~ 85 ~
Appendix 8: New process map
Patient attends clinic Patient booked into
clinic by admin
Patient taken into
clinic room Wait Assessment starts
Medic Performs
assessment
Physiotherapist
performs assessment
Occupational
therapist performs
assessment
Prosthetist performs
assessment and completes
assessment form
Assessment Ends Team enters meeting
room
Team members
present findings
Team agree on predicted
activity level
Is a prescription to
be raised?
Prosthetist
proposes
prescription
Team
agree on
suspension
and knee
Prescription
amended if
appropriate
Team inform
patient
Patient given
information
package
No
Yes

~ 86 ~
Does patient need
reassessment?
Is in-patient service
appropriate?
Is Day-patient service
appropriate?
Is community referral
appropriate?
Medic decides on
course of action
Is community
service
available?
Wait Interdisciplinary team
set goals
Medic informs
patient of decision
Patient leaves
department
No
Yes
No
No
Yes
Yes
Yes
No No
Yes

~ 87 ~
Prosthetist completes
assessment form and
staples together and
stores in health care
record
Are any assessment
patients waiting to be
seen?
Prosthetist records in
Heath care record
End
No
Yes

~ 88 ~
Appendix 9: Consultant review process map
Patient attends
clinic
Patient booked into clinic
by administration staff Wait Patient taken
into room by
consultant
Consultant reviews
patient
Prosthetist reviews
patient Does prosthesis
need adjusting? Limb adjusted in
workshop
Limb returned to
patient
Is prescription to
be raised?
Patient leaves
department
Prosthetist writes
prescription
End
No
Yes
Yes
No

~ 89 ~
Appendix 10: Team presentation

~ 90 ~

~ 91 ~

~ 92 ~

~ 93 ~

~ 94 ~
Appendix 11: Participation questionnaire

~ 95 ~
Appendix 12: Clinic redesign questionnaire

~ 96 ~

~ 97 ~
Appendix 13: Interdisciplinary Team assessment form

~ 98 ~

~ 99 ~

~ 100 ~

~ 101 ~

~ 102 ~

~ 103 ~

~ 104 ~

~ 105 ~

~ 106 ~

~ 107 ~
Appendix 14: Gantt chart
Milestone Date Revised Date
Date completed Comments
Process map current assesment process 20th December
6th January
10th january OT and Physio not available week of 20th december
Define evaluation parameters 19th January
10th january
appointment wait and length of time taken, sanction time, in-patient length of time, % in-patients change of prescription, cost of change of prescription and who paid, number of prosthetist only appointments before and after change
- over 2013 wait times at clinic for assesments and reviews, length of appointments, period find out % completed assesment forms, assesment outcome, length of stay for in-patients, % who had a change of prescription and subsequent length of stay for this group, appointment data on arrival, seen and finish times, cost of change of prescription and who paid,no of review appointments per clinic and investgate peaks and troughs
10th January
31st january
1st February
will use patinet wait time, wait time variation, appointment duration and duration variation, assessment form completion rate,clinic space utilisation
select change model 27th December
27th December HSE change model
situational analysis 27th December
31st january
4th February therapists needed for cultural and personality analysis
- review situational analysis with view to using information to assist in moving to new process design use in write up
Literature Review 5th January 13th April entering literature into mendely
- change models
- Healthcare team models
- culture

~ 108 ~
- resistance to change
- power and infulence
- documentation
- outcome measures
- assesment form
- capacity and demand
- predicitng prosthetic mobility levels SIGAM, A code,
- process design check out lean, flow, implementing lean
Process map new assessment process 12th January
31st january
9th February
team requested IDT format so process redesigned to facilitate. Draft 1 completed by 11/1/14
- assessment patient triage 12th January
21st April 15th April consultant to continue with this
Redesign consultant review process 12th January
11th February
23rd February
collate review data first to establish demand, look for the length of time for assessments, any overlap with reviews and their wait times/length of appointment times, set start times and capacity based on evidence from spreadsheet
Define evaluation parameters 19th January
19th march
19th march
- appointment waiting times for assesment and reviews, actual appointment length time, change of prescription during admission, cost of change of prescription, length of stay of when prescription changed v not changed, % completed assesment forms,
19th January
1st february
spreadsheet complete, delays due to chart accessibility in hopsital
Design Draft one of assesment document 19th January
31st january
9th February IDT assessment form drafted, team to review
Team to review draft 1 of IDT assessment document 11th February
18th February
18th february
form redrafted to reorder OT section and include consultant request for summary and further points for assesment, sent to team for review 16/2/14
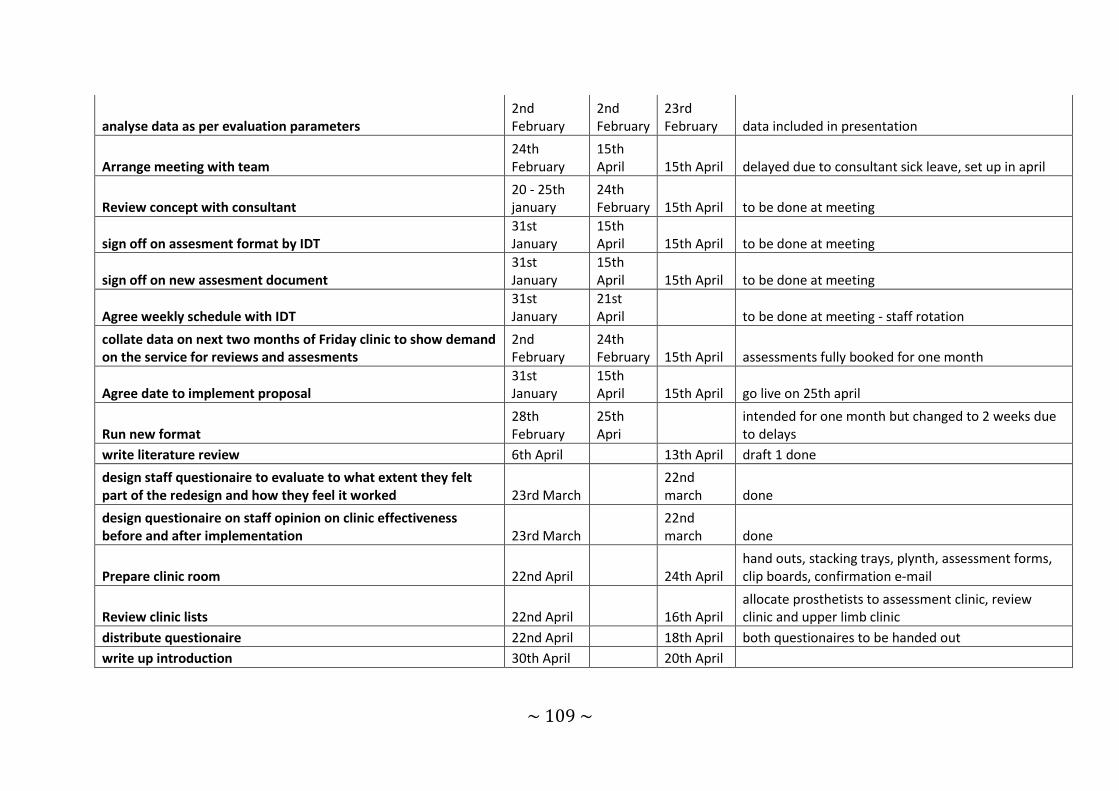
~ 109 ~
analyse data as per evaluation parameters 2nd February
2nd February
23rd February data included in presentation
Arrange meeting with team 24th February
15th April 15th April delayed due to consultant sick leave, set up in april
Review concept with consultant 20 - 25th january
24th February 15th April to be done at meeting
sign off on assesment format by IDT 31st January
15th April 15th April to be done at meeting
sign off on new assesment document 31st January
15th April 15th April to be done at meeting
Agree weekly schedule with IDT 31st January
21st April to be done at meeting - staff rotation
collate data on next two months of Friday clinic to show demand on the service for reviews and assesments
2nd February
24th February 15th April assessments fully booked for one month
Agree date to implement proposal 31st January
15th April 15th April go live on 25th april
Run new format 28th February
25th Apri
intended for one month but changed to 2 weeks due to delays
write literature review 6th April 13th April draft 1 done
design staff questionaire to evaluate to what extent they felt part of the redesign and how they feel it worked 23rd March
22nd march done
design questionaire on staff opinion on clinic effectiveness before and after implementation 23rd March
22nd march done
Prepare clinic room 22nd April 24th April hand outs, stacking trays, plynth, assessment forms, clip boards, confirmation e-mail
Review clinic lists 22nd April 16th April allocate prosthetists to assessment clinic, review clinic and upper limb clinic
distribute questionaire 22nd April 18th April both questionaires to be handed out
write up introduction 30th April 20th April

~ 110 ~
write up methodology 27th April 20th April mainstreaming to short as only two clinics post change
prepare appendices 30th April 13th May
type up for inclusion, situational analysis including goffee and jones, questionaires, presentation, idt assessment form,
write up relfective diary 30th April 13th May 5 x 200 word reflection plus 1200word main reflection using gibbs cycle
write up evaluation 5th may 14th may date delayed due to consultant being off
write up discussion 11th May 14th may
write up draft 1 of thesis 18th April 14th may 14th may
prepare poster 20th April 18th April 14th may
redrafted after class presetation to add in evaluation data
check over final document and submit 14th May 14th May