Embed Size (px)
Citation preview

“Redelsheimer’s Graphs to Know” AP Macro Review Copyright 2005
“Redelsheimer’s Graphs to Know” AP Macro Review Copyright 2005
Q
Ro
bo
ts (t
ho
us
an
ds
)
Pizzas (thousands)
1413121110 9 8 7 6 5 4 3 2 1
1 2 3 4 5 6 7 8
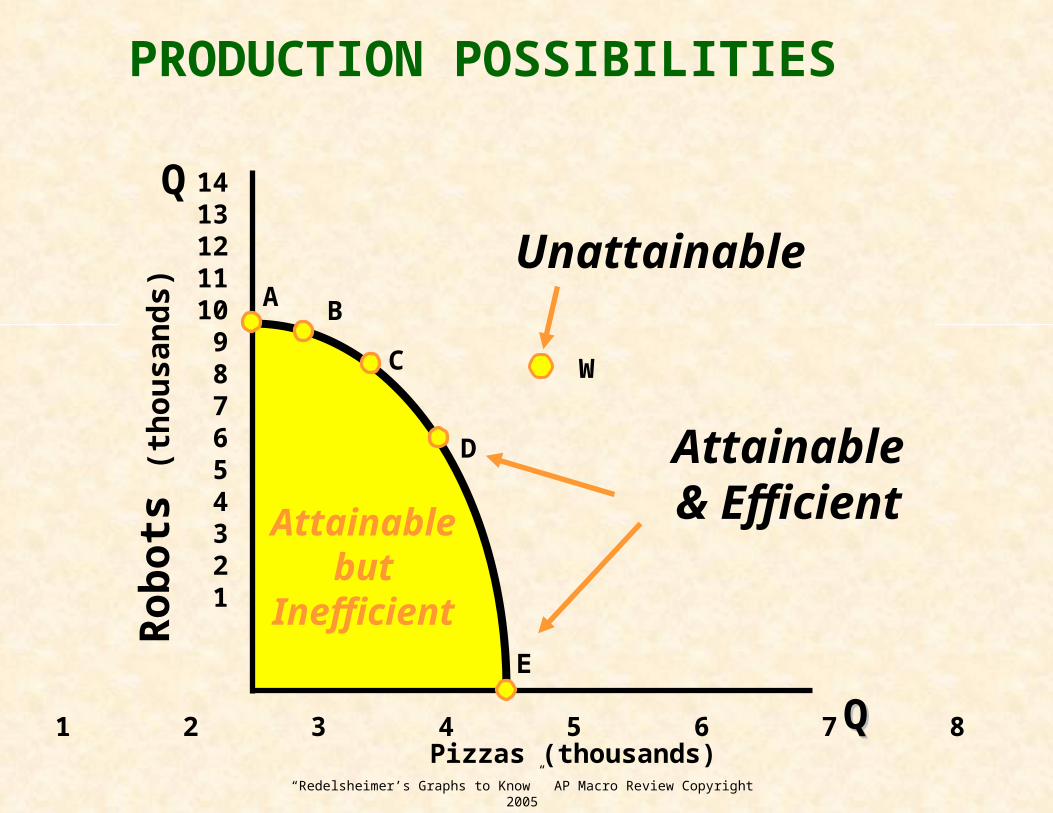
A B
C
D
E
W
Attainablebut
Inefficient
Unattainable
Attainable& Efficient
PRODUCTION POSSIBILITIES
“Redelsheimer’s Graphs to Know” AP Macro Review Copyright 2005
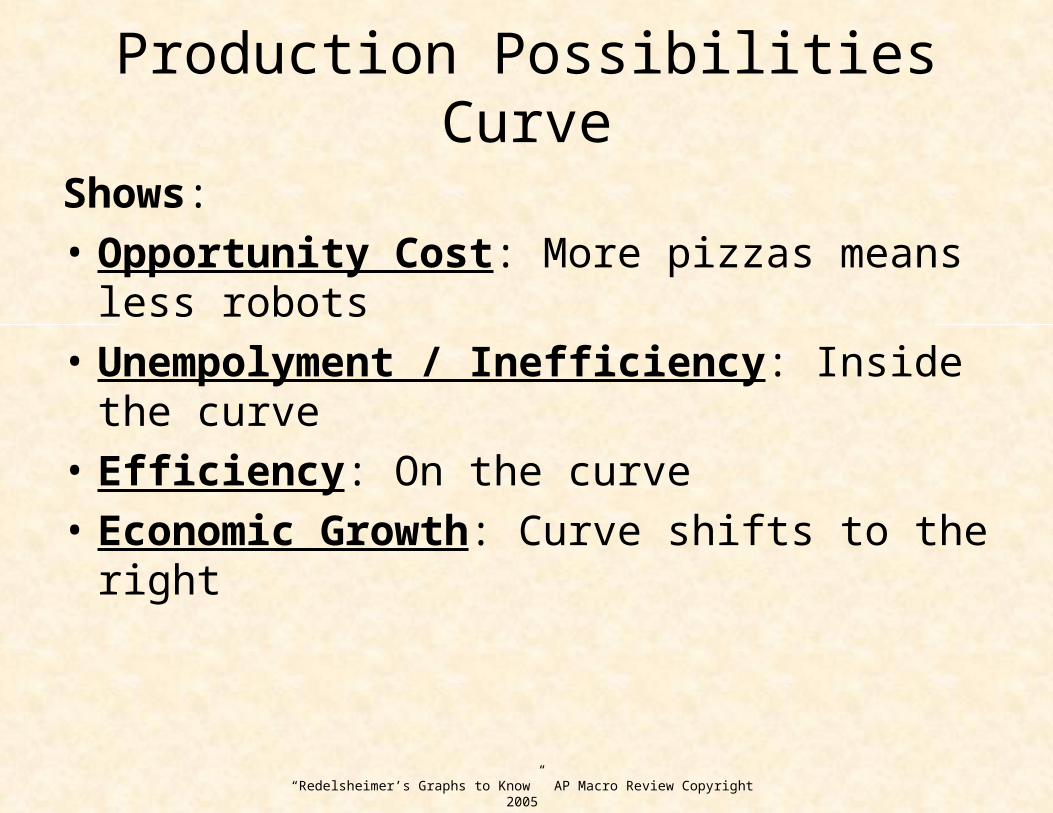
Production Possibilities Curve
Shows: • Opportunity Cost: More pizzas means less
robots• Unempolyment / Inefficiency: Inside the curve• Efficiency: On the curve• Economic Growth: Curve shifts to the right
“Redelsheimer’s Graphs to Know” AP Macro Review Copyright 2005
Pric
e Le
vel
Real Domestic Output, GDP
Q
P AS
AD
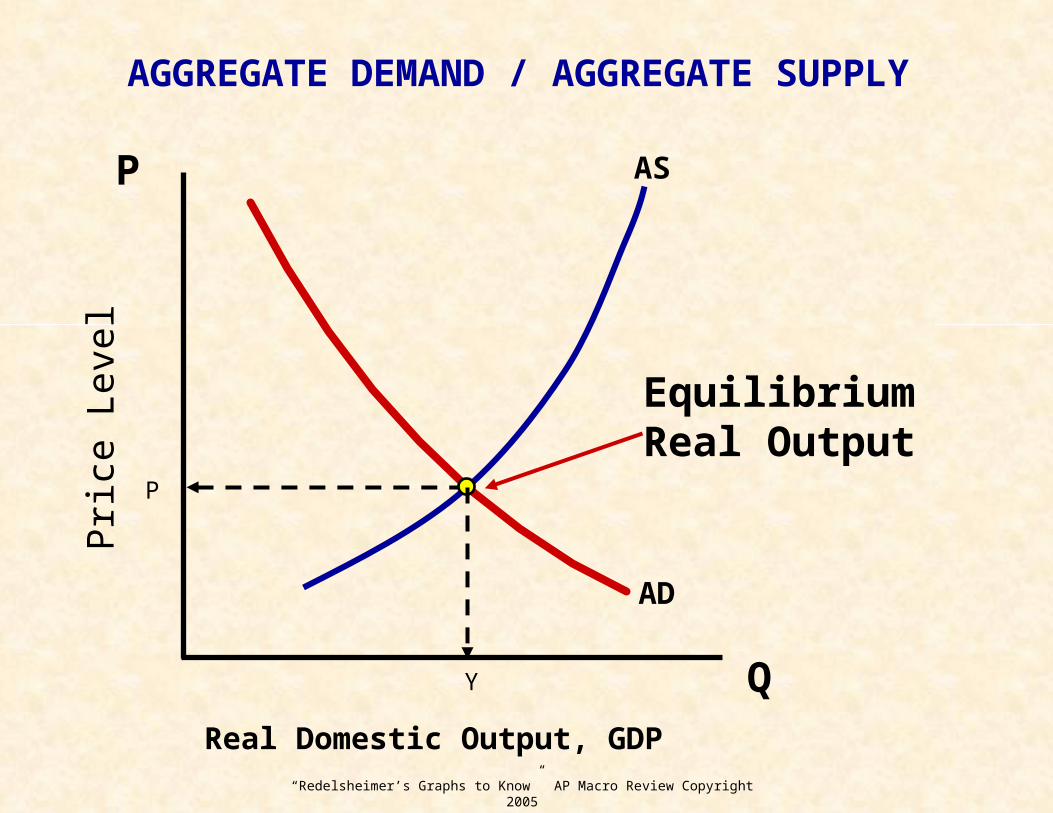
AGGREGATE DEMAND / AGGREGATE SUPPLY
EquilibriumReal Output
Y
P
“Redelsheimer’s Graphs to Know” AP Macro Review Copyright 2005
Pric
e Le
vel
Real Domestic Output, GDP
Q
P AS
AD
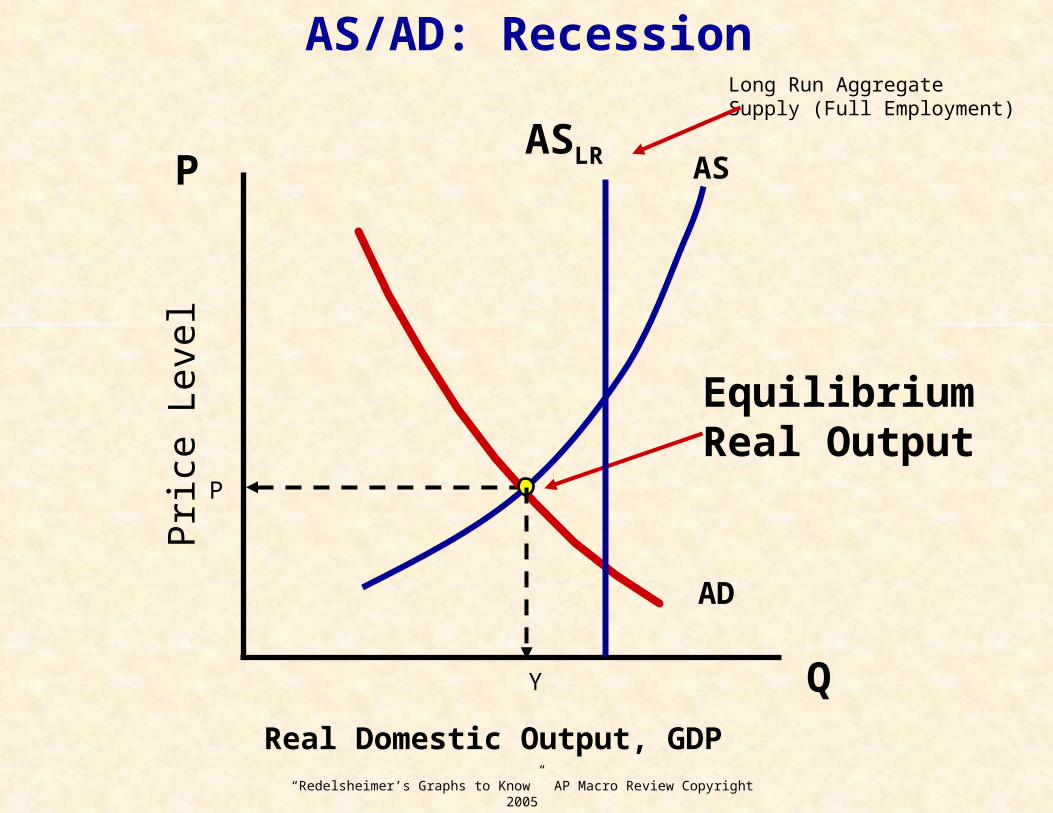
AS/AD: Recession
EquilibriumReal Output
ASLR
Long Run Aggregate Supply (Full Employment)
Y
P
“Redelsheimer’s Graphs to Know” AP Macro Review Copyright 2005
Pric
e Le
vel
Real Domestic Output, GDP
Q
P AS
AD
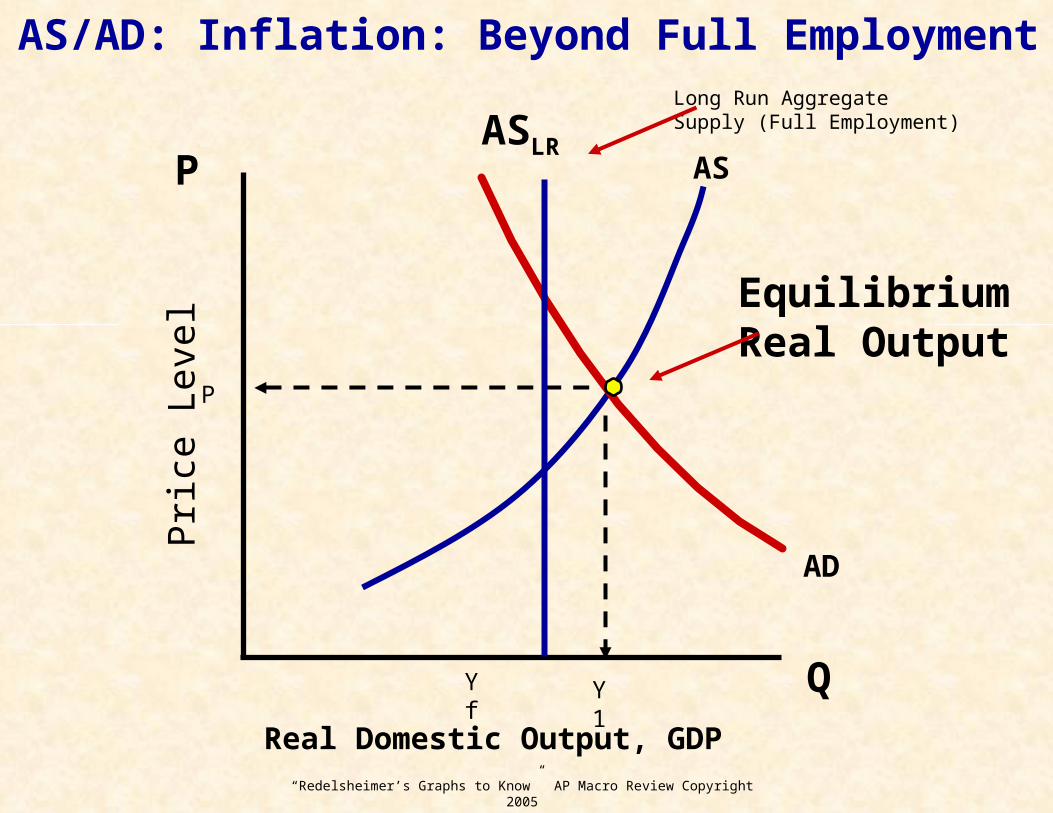
AS/AD: Inflation: Beyond Full Employment
EquilibriumReal Output
ASLR
Long Run Aggregate Supply (Full Employment)
Y f Y 1
P
“Redelsheimer’s Graphs to Know” AP Macro Review Copyright 2005
Pric
e Le
vel
Real Domestic Output, GDP
Q
P ASAD1
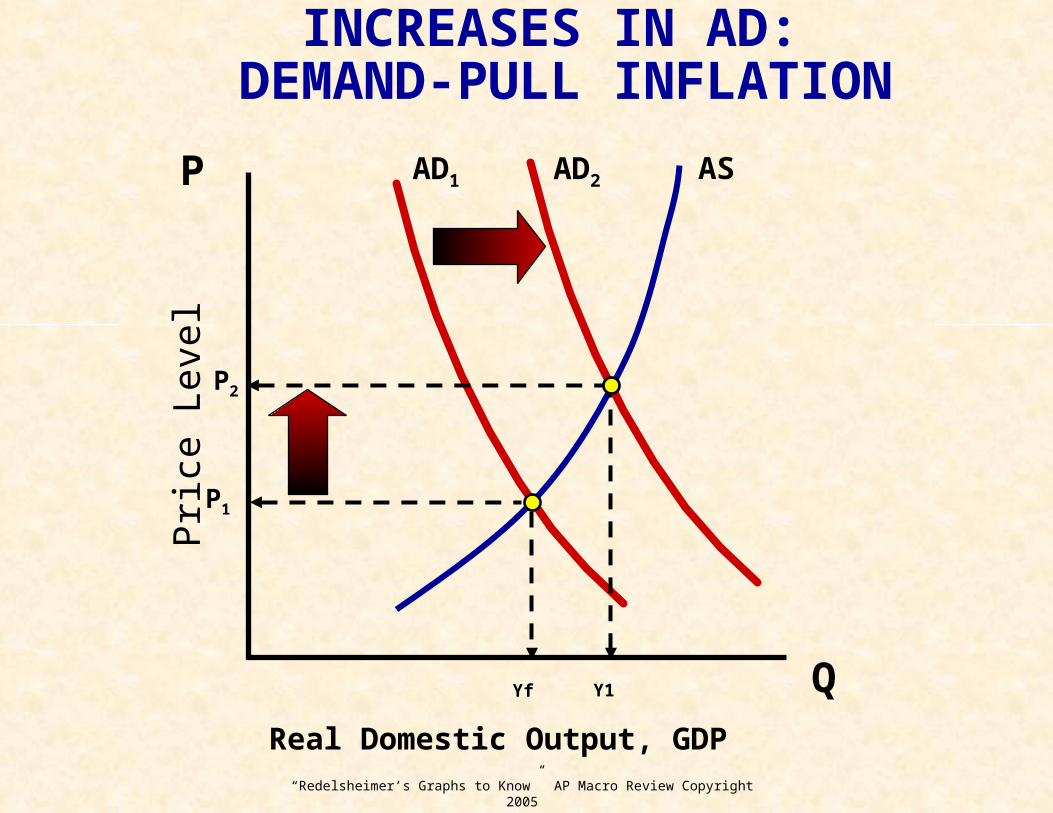
INCREASES IN AD: DEMAND-PULL INFLATION
P2
P1
AD2
Yf Y1
“Redelsheimer’s Graphs to Know” AP Macro Review Copyright 2005
Pric
e Le
vel
Real Domestic Output, GDP
Q
P AS1
AD1
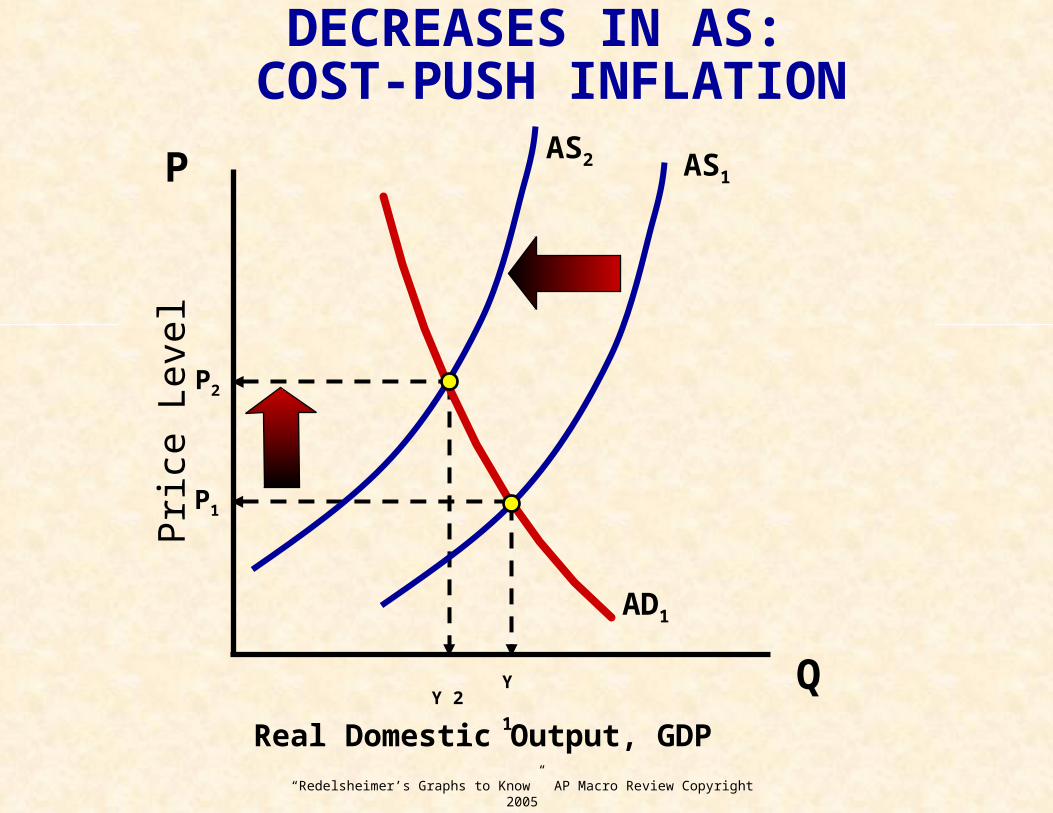
DECREASES IN AS: COST-PUSH INFLATION
P2
Y 1Y 2
AS2
P1
“Redelsheimer’s Graphs to Know” AP Macro Review Copyright 2005
AGGREGATE SUPPLY / AGGREGATE DEMAND
SHOWS: • National Output: (Real GDP)• Employment and Unemployment• Price Level
Aggregate Demand CurveDown Sloping Due To:
• Real-Balances Effect• Interest-Rate Effect• Foreign Purchases Effect
“Redelsheimer’s Graphs to Know” AP Macro Review Copyright 2005
NO
MIN
AL
inte
res
t ra
te, i
Quantity of Money
Dm
Sm
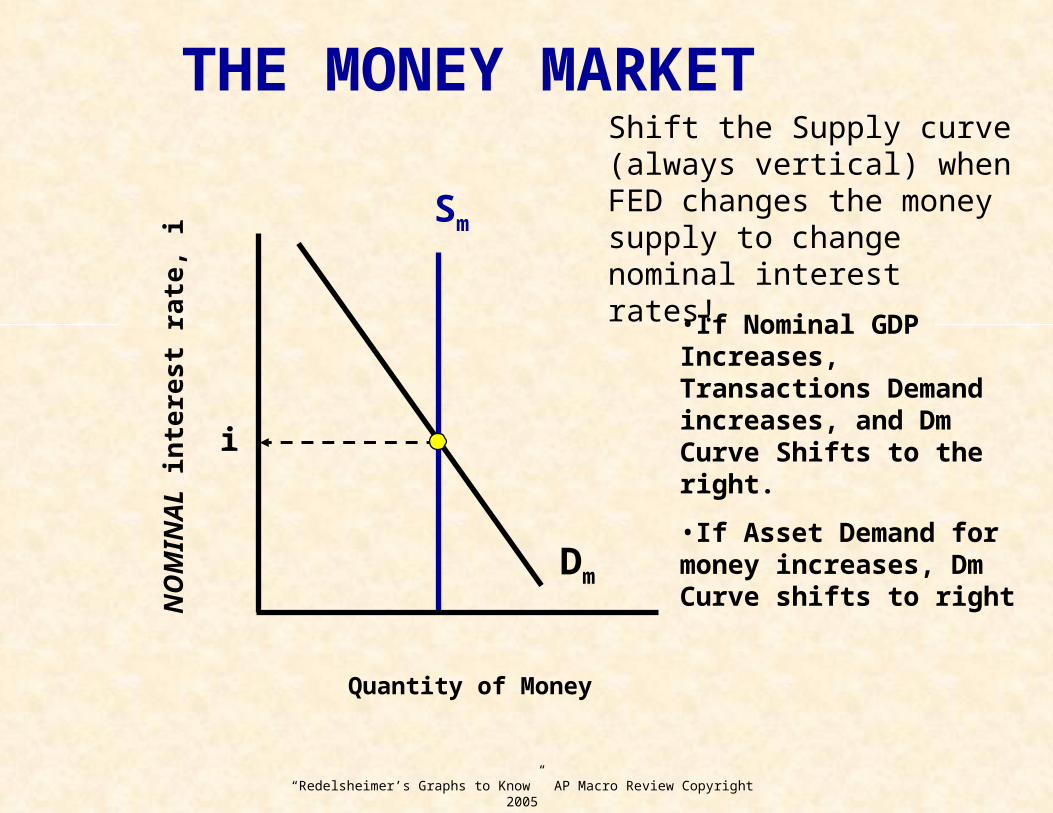
THE MONEY MARKETShift the Supply curve (always vertical) when FED changes the money supply to change nominal interest rates!
i
•If Nominal GDP Increases, Transactions Demand increases, and Dm Curve Shifts to the right.
•If Asset Demand for money increases, Dm Curve shifts to right
“Redelsheimer’s Graphs to Know” AP Macro Review Copyright 2005
Real domestic output, GDP
Dm
InvestmentDemand Graph
rate
of
inte
rest
, i
10
8
6
0
Qty. of Money Amount of investment, I
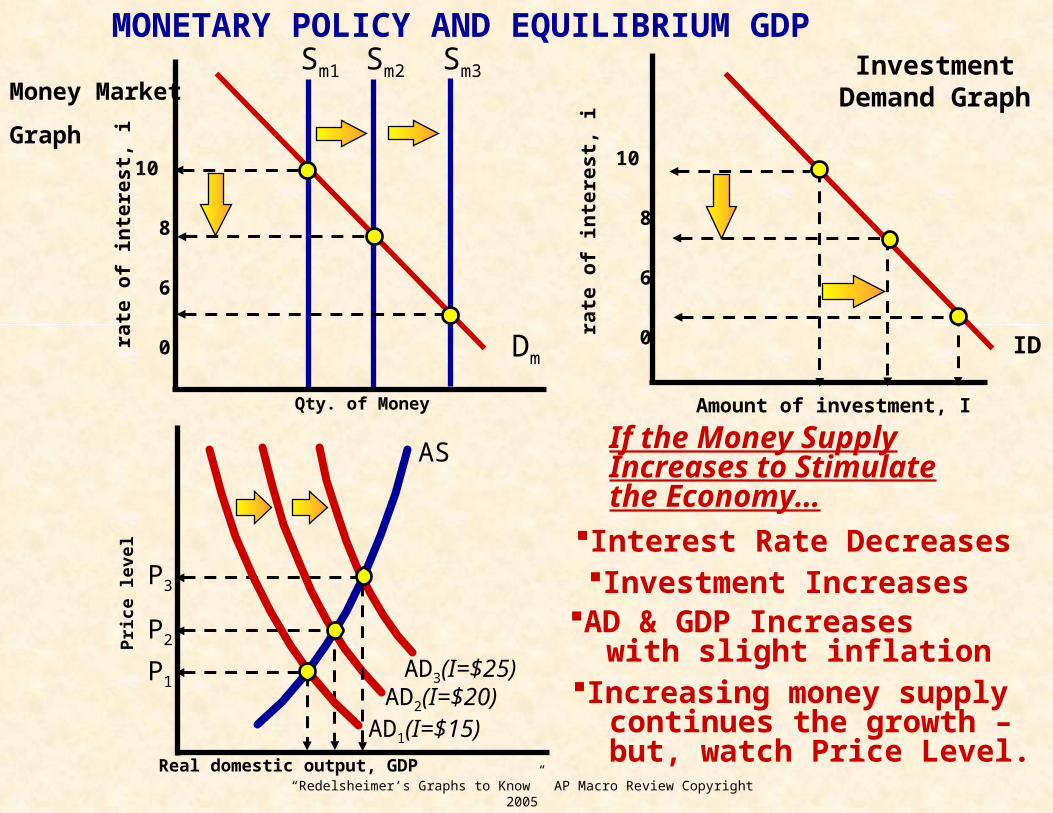
MONETARY POLICY AND EQUILIBRIUM GDPSm1
AS
AD1(I=$15)
P1
10
8
6
0
Sm2
AD3(I=$25)
P2
If the Money SupplyIncreases to Stimulatethe Economy…Interest Rate DecreasesInvestment IncreasesAD & GDP Increases with slight inflation
Pri
ce le
vel
AD2(I=$20)
P3
Sm3
Increasing money supply continues the growth – but, watch Price Level.
ID
rate
of
inte
res
t, i
Money Market
Graph
“Redelsheimer’s Graphs to Know” AP Macro Review Copyright 2005
Re
al I
nte
res
t R
ate
, r
Quantity of Loanable Funds
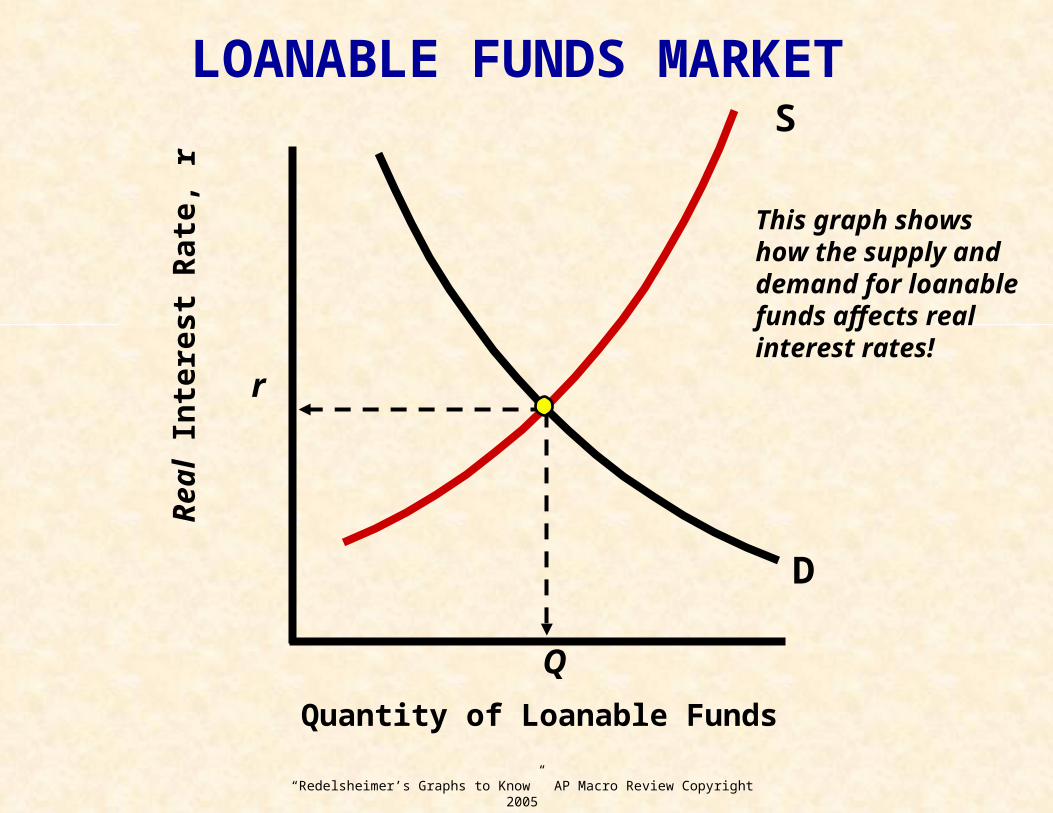
LOANABLE FUNDS MARKET
r
D
Q
S
This graph shows how the supply and demand for loanable funds affects real interest rates!
“Redelsheimer’s Graphs to Know” AP Macro Review Copyright 2005
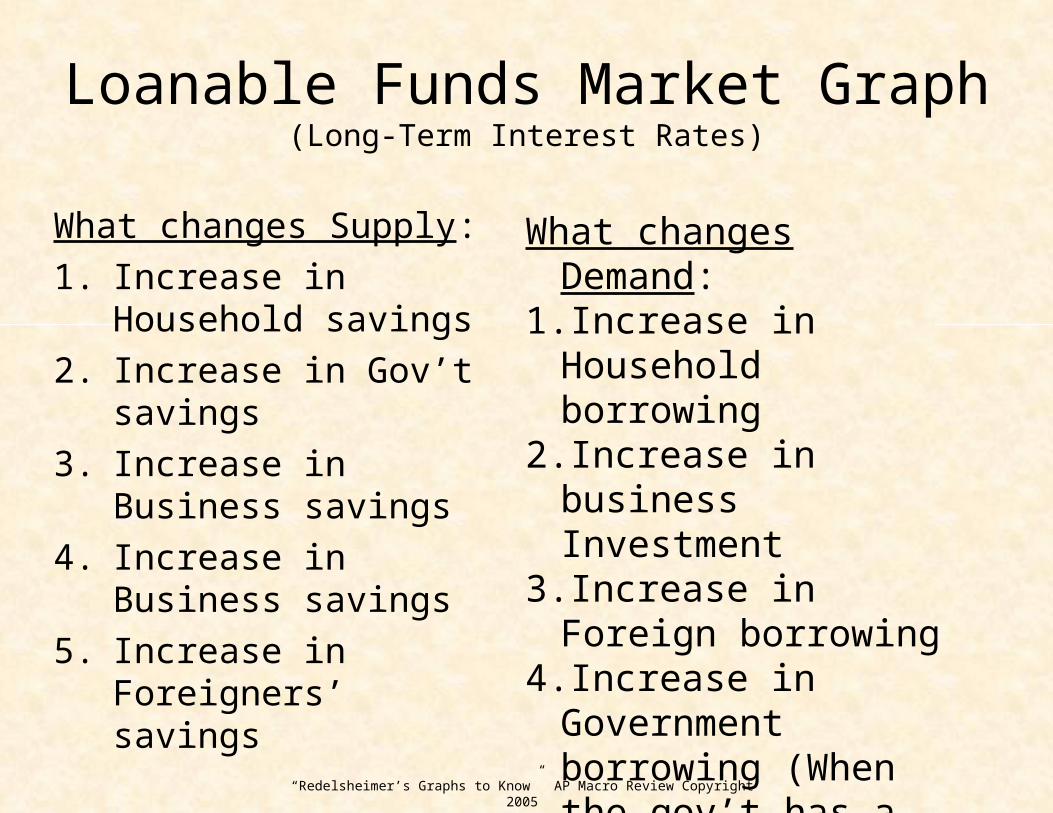
Loanable Funds Market Graph(Long-Term Interest Rates)
What changes Supply:
1. Increase in Household savings
2. Increase in Gov’t savings
3. Increase in Business savings
4. Increase in Business savings
5. Increase in Foreigners’ savings
What changes Demand: 1. Increase in Household
borrowing2. Increase in business
Investment3. Increase in Foreign
borrowing4. Increase in Government
borrowing (When the gov’t has a budget deficit!) = (the crowding -out effect)
“Redelsheimer’s Graphs to Know” AP Macro Review Copyright 2005
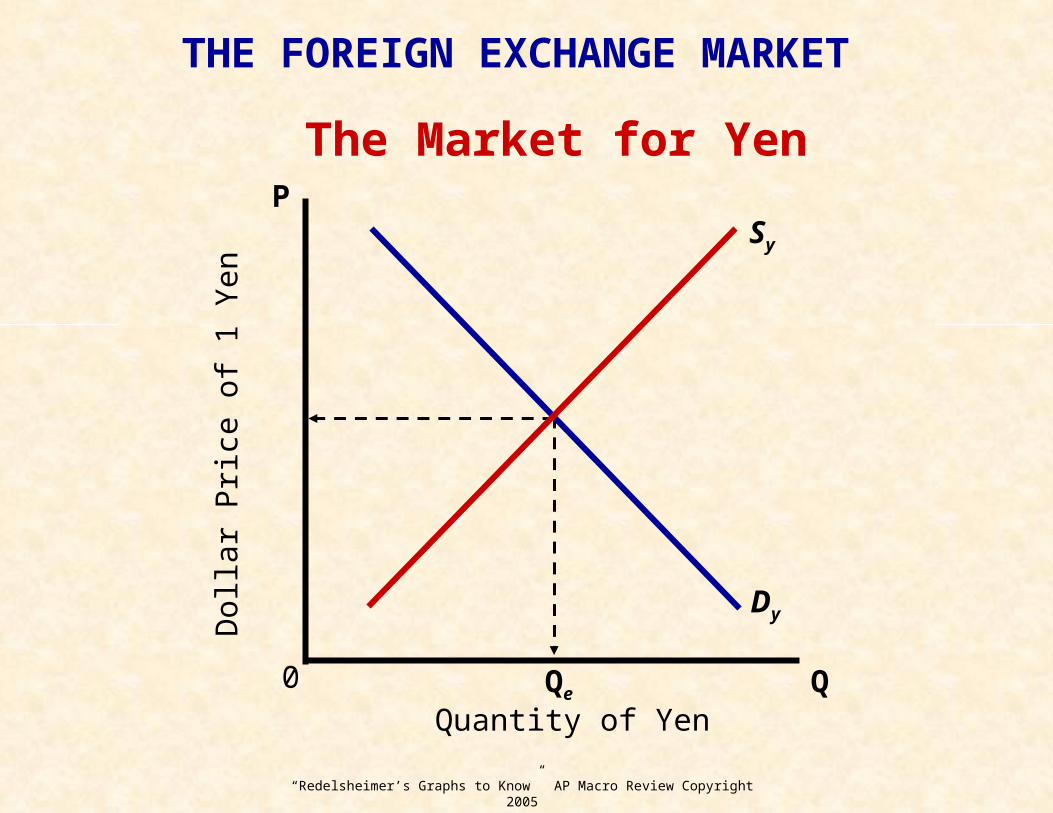
The Market for Yen
Quantity of Yen
Dol
lar
Pri
ce o
f 1
Yen
0
P
QQe
Sy
Dy
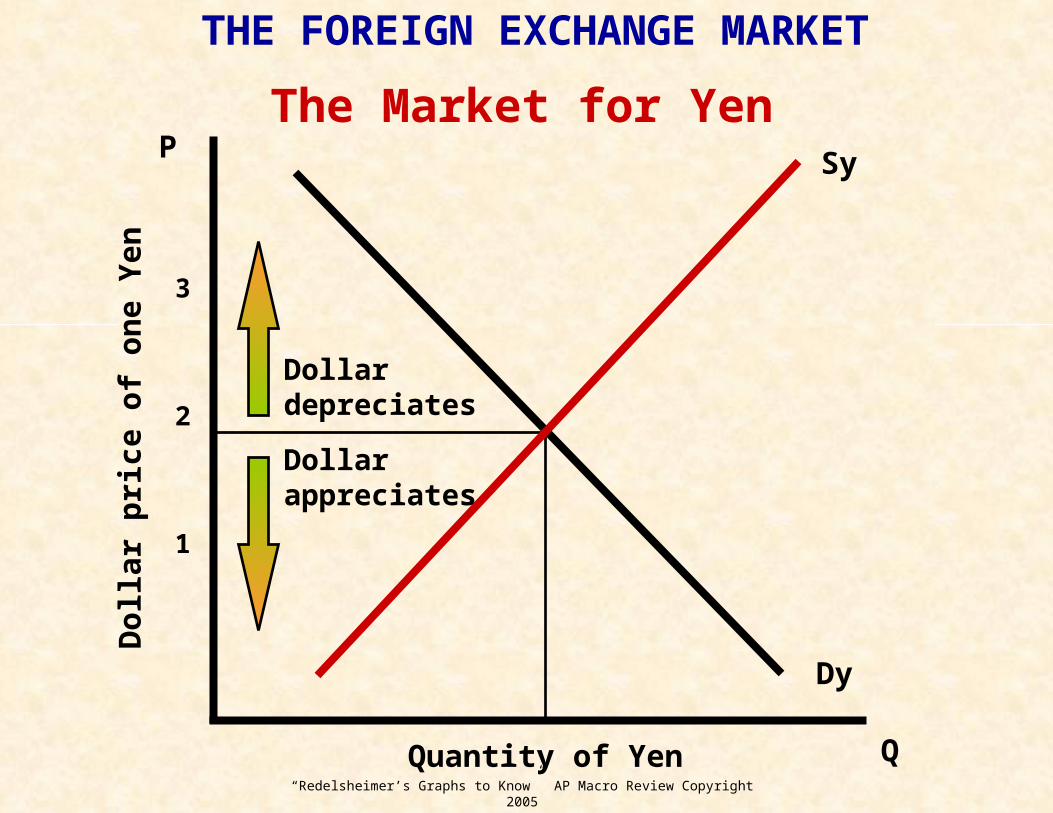
THE FOREIGN EXCHANGE MARKET
“Redelsheimer’s Graphs to Know” AP Macro Review Copyright 2005
P
Q
Dy
SyD
olla
r p
ric
e o
f o
ne
Ye
n
Quantity of Yen
3
2
1
Dollardepreciates
Dollarappreciates
The Market for Yen
THE FOREIGN EXCHANGE MARKET
“Redelsheimer’s Graphs to Know” AP Macro Review Copyright 2005
An
nu
al r
ate
of in
flat
ion
(per
cen
t)
Unemployment rate (percent)
7
6
5
4
3
2
1
0
1 2 3 4 5 6 7
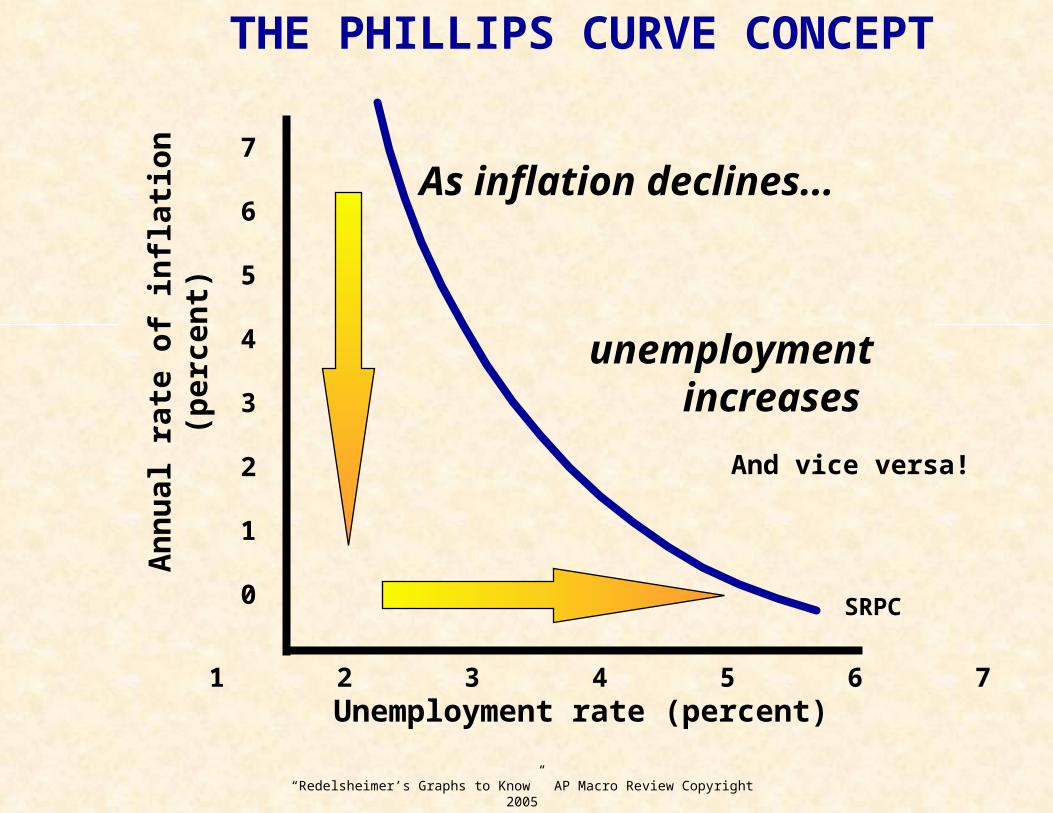
As inflation declines...
THE PHILLIPS CURVE CONCEPT
unemploymentincreases
And vice versa!
SRPC
“Redelsheimer’s Graphs to Know” AP Macro Review Copyright 2005
An
nu
al r
ate
of in
flat
ion
(per
cen
t)
Unemployment rate (percent)
7
6
5
4
3
2
1
0
1 2 3 4 5 6 7
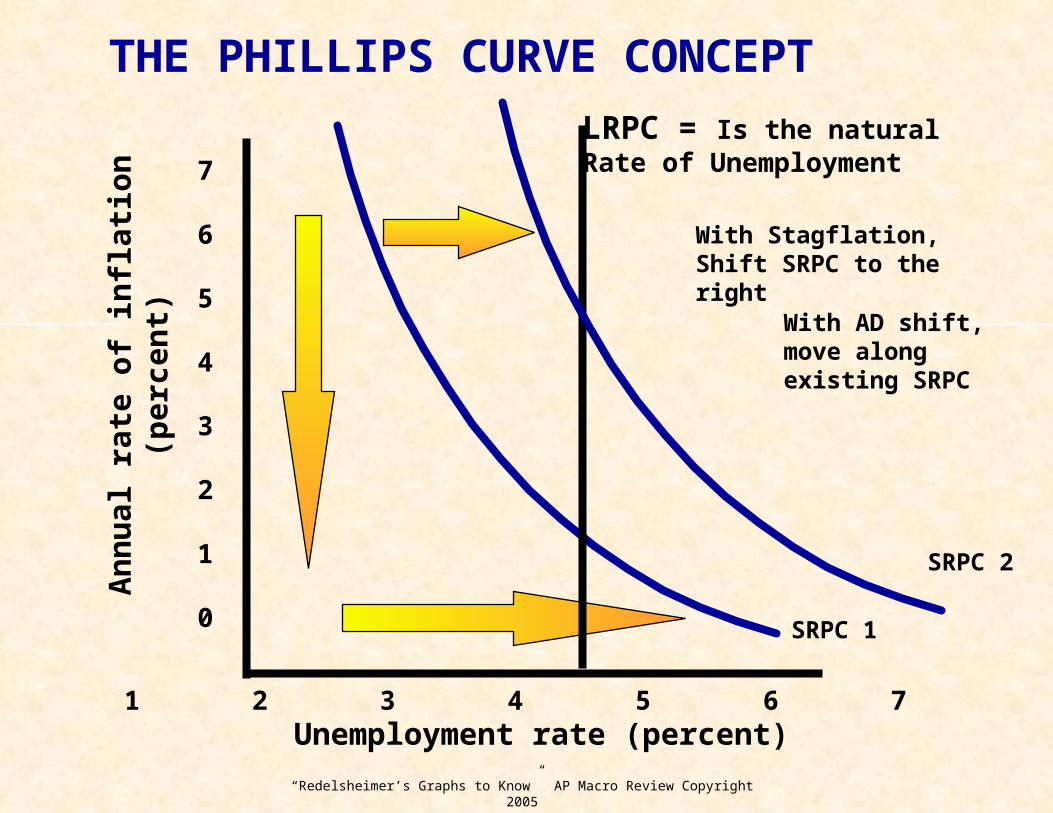
THE PHILLIPS CURVE CONCEPT
SRPC 1
LRPC = Is the naturalRate of Unemployment
SRPC 2
With Stagflation, Shift SRPC to the right
With AD shift, move along existing SRPC
“Redelsheimer’s Graphs to Know” AP Macro Review Copyright 2005
Phillips Curve
• Short run trade-off between inflation and unemployment.
• In the Long Run there is no trade off. The long run Phillips curve is Vertical!
• Stagflation (an increase in Unemployment and inflation) or an Aggregate Supply Shock will shift the SRPC to the right.
• Decreases in Inflation and Unemployment will shift the SRPC to the left. (and increase in AS would cause this)
“Redelsheimer’s Graphs to Know” AP Macro Review Copyright 2005
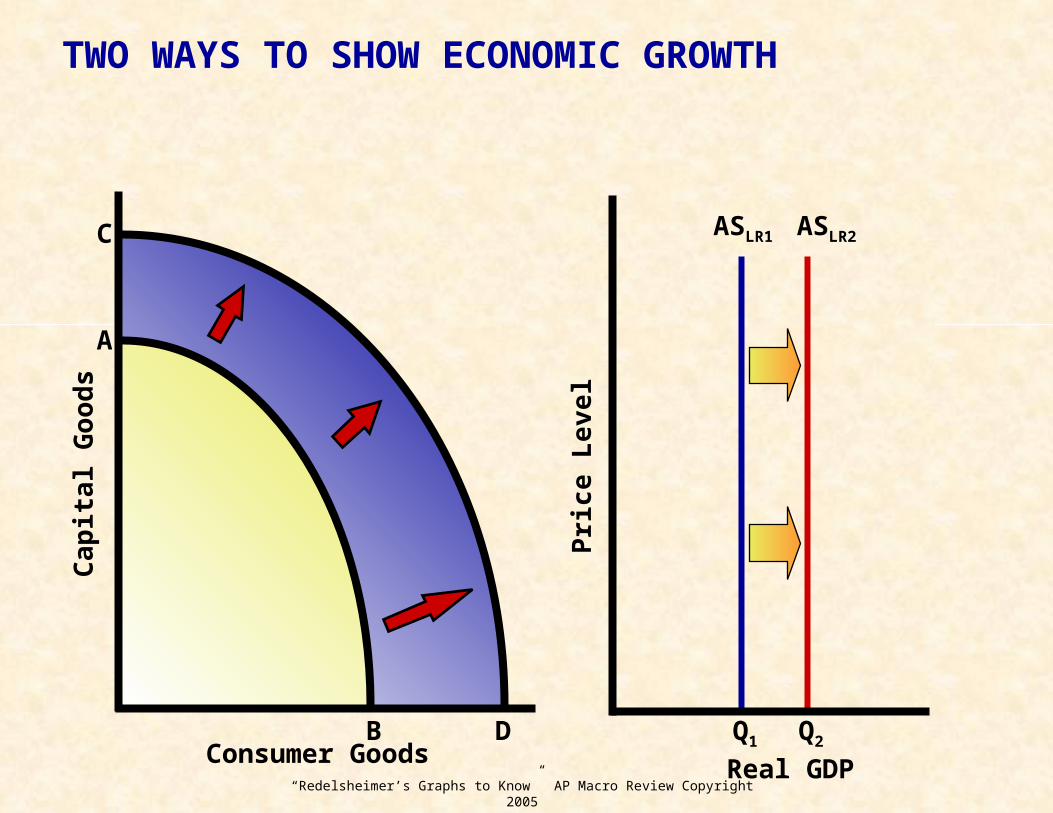
TWO WAYS TO SHOW ECONOMIC GROWTH
A
B
C
D
Ca
pit
al G
oo
ds
Consumer Goods
Pri
ce
Lev
el
Real GDP
ASLR1 ASLR2
Q1 Q2
“Redelsheimer’s Graphs to Know” AP Macro Review Copyright 2005
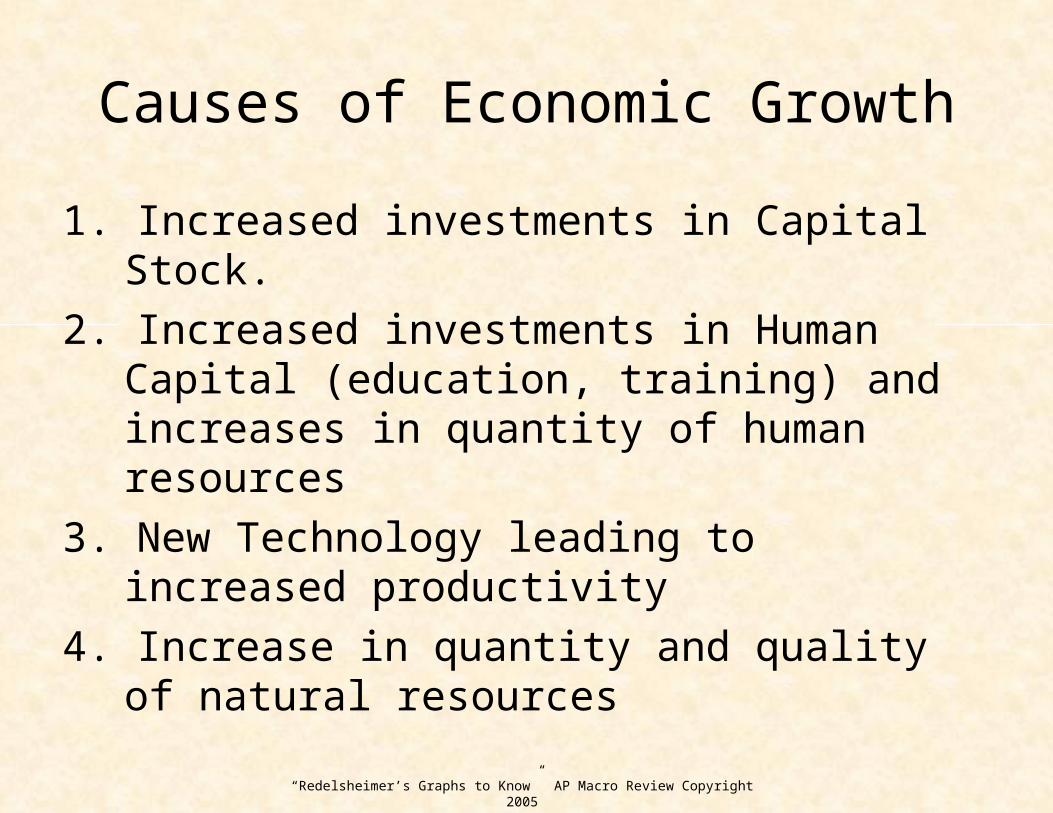
Causes of Economic Growth
1. Increased investments in Capital Stock.
2. Increased investments in Human Capital (education, training) and increases in quantity of human resources
3. New Technology leading to increased productivity
4. Increase in quantity and quality of natural resources
“Redelsheimer’s Graphs to Know” AP Macro Review Copyright 2005
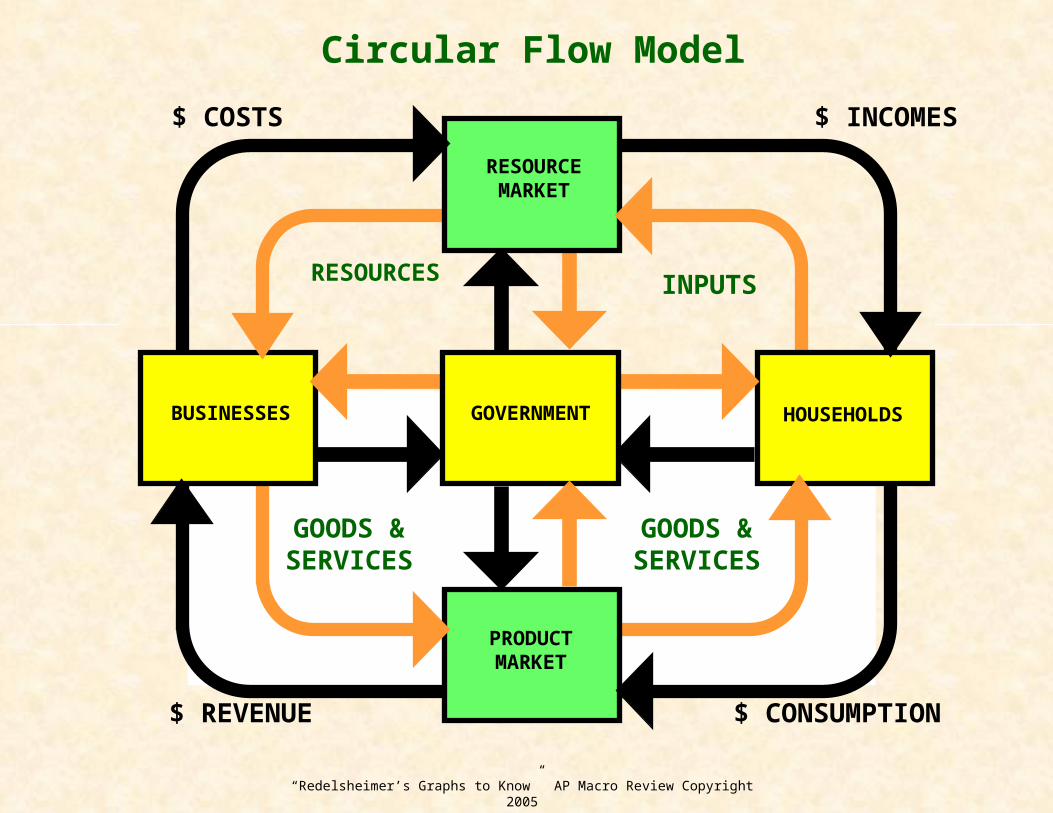
BUSINESSES HOUSEHOLDS
RESOURCES INPUTS
$ COSTS $ INCOMES
PRODUCTMARKET
GOODS &SERVICES
GOODS &SERVICES
$ CONSUMPTION$ REVENUE
GOVERNMENT
RESOURCEMARKET
Circular Flow Model