Embed Size (px)
DESCRIPTION
Redefining America: Key Findings from the 2006 Latino National Survey Luis Fraga Associate Professor of Political Science, Stanford University John Garcia Professor of Political Science, University of Arizona Rodney Hero Professor of Political Science, Notre Dame University - PowerPoint PPT Presentation
Citation preview

Redefining America: Key Findings from the 2006 Latino National Survey
Luis FragaAssociate Professor of Political Science, Stanford University
John GarciaProfessor of Political Science, University of Arizona
Rodney HeroProfessor of Political Science, Notre Dame University
Michael Jones-CorreaAssociate Professor of Government, Cornell University
Valerie Martinez-EbersAssociate Professor, Texas Christian University
Gary M. SeguraAssociate Professor, University of Washington


Sources of FundingSources of Funding
• Annie E. Casey FoundationAnnie E. Casey Foundation• Carnegie CorporationCarnegie Corporation• Ford FoundationFord Foundation• Hewlett FoundationHewlett Foundation• Irvine FoundationIrvine Foundation• Joyce FoundationJoyce Foundation• Kellogg FoundationKellogg Foundation• National Science FoundationNational Science Foundation• Russell Sage FoundationRussell Sage Foundation• Texas A&M University: MALRC, PERGTexas A&M University: MALRC, PERG

Percent Hispanic of U.S. Population, 1960-2030
3.64.8
6.9
9.7
13.2
16.4
19.3
22.5
0
5
10
15
20
25
1960 1970 1980 1990 2000 2010 2020 2030
3.64.8
6.9
9.7
13.2
16.4
19.3
22.5
0
5
10
15
20
25
1960 1970 1980 1990 2000 2010 2020 2030
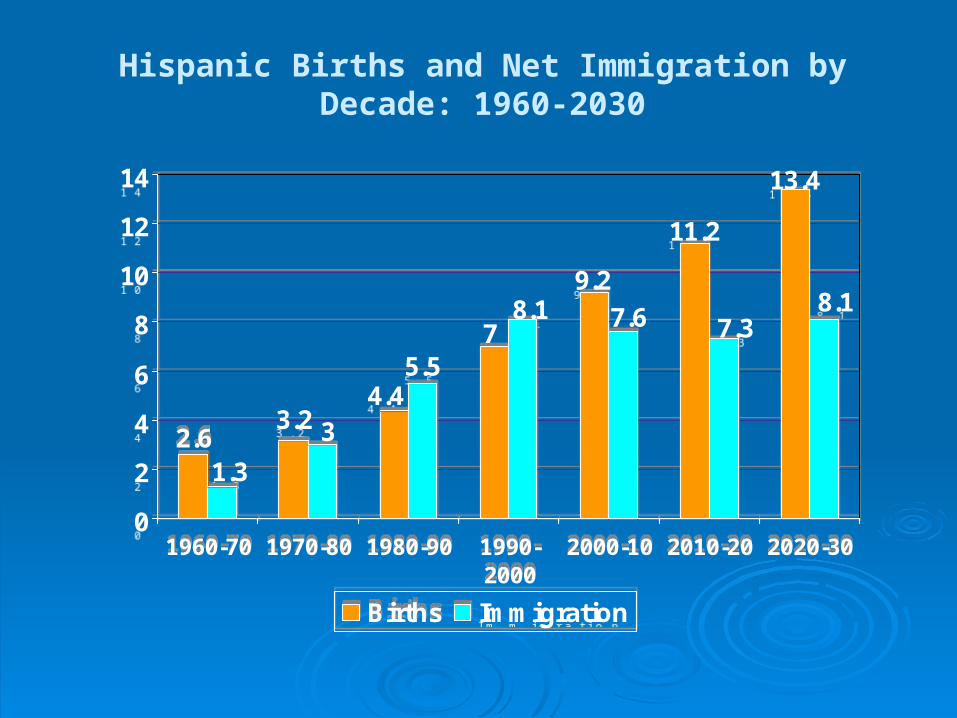
Hispanic Births and Net Immigration by Decade: 1960-2030
2.61.3
3.2 34.4
5.57
8.19.2
7.6
11.2
7.3
13.4
8.1
0
2
4
6
8
10
12
14
1960-70 1970-80 1980-90 1990-2000
2000-10 2010-20 2020-30
Births Immigration
2.61.3
3.2 34.4
5.57
8.19.2
7.6
11.2
7.3
13.4
8.1
0
2
4
6
8
10
12
14
1960-70 1970-80 1980-90 1990-2000
2000-10 2010-20 2020-30
Births Immigration

Latino Diversity
44 million Latinos in the US
Census Bureau (American Community Survey, Released August 2006)
Mexican 63.9%Puerto Rican 9%Cuban 3.5%Salvadoran 2.9%Dominican 2.7%Guatemalan 1.7%Colombian 1.8%ALL OTHERS 14.3%
Native-born (not Island-born): 35.4%
Foreign-born 61%Island-born PR 3.6%No high school diploma 43%College graduate 11.1%
Latino National Survey (unweighted N) Summer 2006
*Mexican 66.1% (5704)*Puerto Rican 9.5% (822)*Cuban 4.9% (420)*Salvadoran 4.7% (407)*Dominican 3.9% (335)*Guatemalan 1.7% (149)*Colombian 1.6% (139)*All Others 7.6%
*Native-born 28.4% (2450)Foreign-born (adults)
66.2% (5717)*Island-born PR 5.4% (467)*No high school diploma 37%*College graduate 16.2%

Separate but Related:Separate but Related:
The Realities of Pan EthnicityThe Realities of Pan Ethnicity within the Latino National Surveywithin the Latino National Survey

A Multiplicity of IdentitiesA Multiplicity of Identities
• Simultaneous strong Simultaneous strong sense of pan-ethnic sense of pan-ethnic identity, national origin identity, national origin identity, and American-identity, and American-nessness
Puerto Ricans illustrate Puerto Ricans illustrate best that identities are best that identities are not mutually exclusivenot mutually exclusive
Cuban pan-ethnicity Cuban pan-ethnicity surprisingly highsurprisingly high
Mexican sense of Mexican sense of American-ness high American-ness high considering the share considering the share foreign bornforeign born
AmericanAmericanNational National OriginOrigin
Pan-Pan-EthnicEthnic
MexicanMexican 61.761.7 84.084.0 87.487.4
CubanCuban 77.877.8 82.182.1 81.681.6
Puerto Puerto RicanRican 83.783.7 90.790.7 89.389.3
AllAll 65.065.0 84.084.0 87.287.2
Cells are percent expressing Cells are percent expressing “somewhat” or “very strongly”“somewhat” or “very strongly”

Extent of Pan Ethnic IdentificationExtent of Pan Ethnic Identification
by National Originby National Origin Variation among Variation among
national origin national origin groups modestgroups modest
Lowest groups Lowest groups are Cubans and are Cubans and SpaniardsSpaniards
Highest groups Highest groups are Central are Central Americans, Americans, Puerto Ricans, Puerto Ricans, and Dominicansand Dominicans
Order of bars- So. Amer; Order of bars- So. Amer;
Cen. Amer.;Cen. Amer.; Mex.; Puerto Mex.; Puerto Rican; Cuban; Dominican; Rican; Cuban; Dominican; Salvadoran; Guatemalan; Salvadoran; Guatemalan; SpaniardsSpaniards
0
10
20
30
40
50
60
70
80
SomewhatStrongly
VeryStrongly

Background Background CharacteristicsCharacteristics
Positive Positive AssociationAssociation
Direction Direction
GenderGender ++ Latinas more pan Latinas more pan ethnic ethnic
Educational Educational AttainmentAttainment
++ Slight increase with Slight increase with more education more education
Language UseLanguage Use ++ Slightly more Slightly more Spanish speakers Spanish speakers
Place of BirthPlace of Birth ++ Highest among Island Highest among Island born Puerto Ricansborn Puerto Ricans
Latinos as distinct Latinos as distinct racerace
++ Support idea of Support idea of Latinos as distinct Latinos as distinct
racerace
Preferred Pan –Preferred Pan –ethnic Label ethnic Label
++ Slightly more to Slightly more to Hispanic, but large Hispanic, but large
segment prefer either segment prefer either
Religious Religious AffiliationAffiliation
++ Stronger pan-ethnic Stronger pan-ethnic identifiers more likely identifiers more likely
to be Catholicto be Catholic
Correlates of Pan Ethnic Identity and Background Characteristics

Pan Ethnic Identity and Preferred LabelPan Ethnic Identity and Preferred Label
Two in five Latinos Two in five Latinos consider either pan- consider either pan- ethnic label as ethnic label as acceptableacceptable
Hispanic is preferred Hispanic is preferred term by 43% of the term by 43% of the respondentsrespondents
Pan ethnic identifiers Pan ethnic identifiers more prevalent than more prevalent than 1989 LNPS 1989 LNPS 0
10
20
30
40
50
60
70
Hisp. Either
Not at all
Not veryStrongSomewhatstrongVeryStrongly
Latino

Correlates of Pan Ethnic Identity and Political Interest and Media Use
Political Interest Political Interest and Media Useand Media Use
Positive Positive AssociationAssociation
Direction Direction
Extent of Watching Extent of Watching Television NewsTelevision News
++ Stronger Pan-ethnic Stronger Pan-ethnic identifiers watch TV identifiers watch TV news almost dailynews almost daily
Regularity of Reading Regularity of Reading NewspaperNewspaper
++ Stronger Pan-ethnic Stronger Pan-ethnic identifiers read identifiers read
newspapers almost newspapers almost dailydaily
Level of Political Level of Political InterestInterest
++ Higher levels of Higher levels of political interests political interests
among stronger pan-among stronger pan-ethnic identifiersethnic identifiers
Political IdeologyPolitical Ideology ++ Weaker pan-ethnic Weaker pan-ethnic Identifiers are more Identifiers are more
conservative and not conservative and not think in these termsthink in these terms
Partisan IdentificationPartisan Identification ++ Stronger pan-ethnic Stronger pan-ethnic identifiers more likely identifiers more likely
to identify as to identify as DemocratsDemocrats

Levels of Pan Ethnicity and Levels of Pan Ethnicity and Party IdentificationParty Identification
One fourth of LNS respondents identified as One fourth of LNS respondents identified as DemocratsDemocrats
Second largest category was do not know-12.5%Second largest category was do not know-12.5%
Self-identified independents exceed Latino Self-identified independents exceed Latino RepublicansRepublicans

Correlates of Pan Ethnic Identity and Political Participation
Political Interest and Political Interest and Media UseMedia Use
Positive AssociationPositive Association Direction Direction
Participate in Participate in community activitiescommunity activities
++ Stronger pan-ethnic Stronger pan-ethnic identifiers more likely identifiers more likely
to participate in to participate in community activitiescommunity activities
Composition of Composition of fellow group fellow group membersmembers
++ Stronger pan-ethnic Stronger pan-ethnic identifiers are more identifiers are more
likely to work w/ other likely to work w/ other Latinos. Latinos.
If problem, vehicle If problem, vehicle to act collectivelyto act collectively
++ Stronger pan-ethic Stronger pan-ethic identifiers more likely identifiers more likely
to work w/ existing to work w/ existing orgs. And act.orgs. And act.
Whether public Whether public official contacted official contacted was Latinowas Latino
++ Stronger pan-ethnic Stronger pan-ethnic identifiers more likely identifiers more likely to contact official who to contact official who
is Latinois Latino
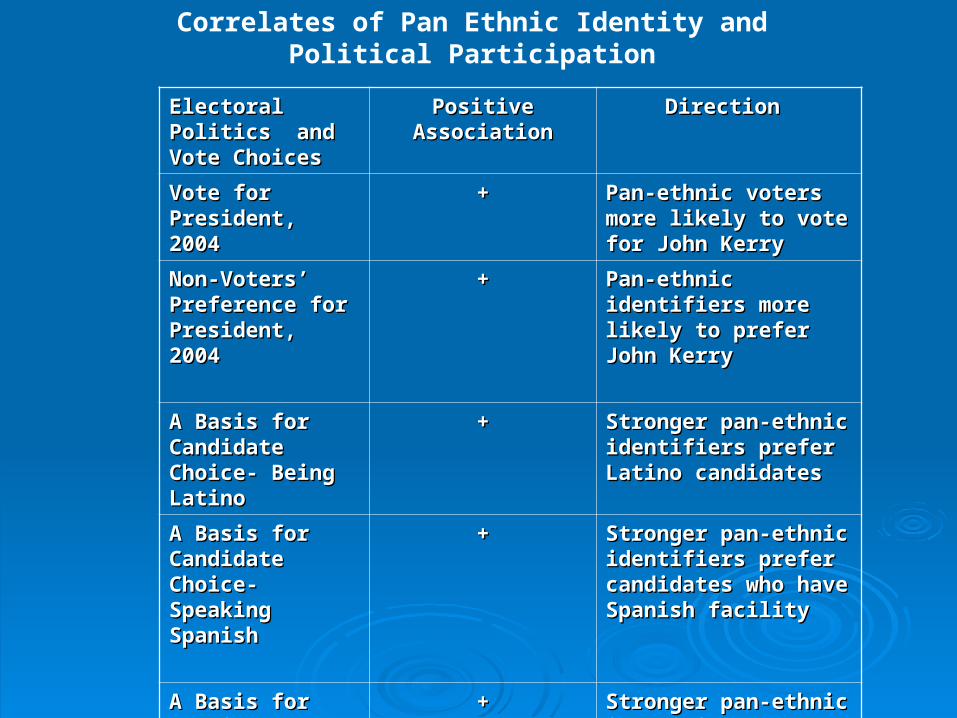
Correlates of Pan Ethnic Identity and Political Participation
Electoral Politics Electoral Politics and Vote Choicesand Vote Choices
Positive AssociationPositive Association Direction Direction
Vote for President, Vote for President, 20042004
++ Pan-ethnic voters more Pan-ethnic voters more likely to vote for John likely to vote for John KerryKerry
Non-Voters’ Non-Voters’ Preference for Preference for President, 2004President, 2004
++ Pan-ethnic identifiers Pan-ethnic identifiers more likely to prefer more likely to prefer John KerryJohn Kerry
A Basis for A Basis for Candidate Choice- Candidate Choice- Being Latino Being Latino
++ Stronger pan-ethnic Stronger pan-ethnic identifiers prefer Latino identifiers prefer Latino candidatescandidates
A Basis for A Basis for Candidate Choice- Candidate Choice- Speaking Spanish Speaking Spanish
++ Stronger pan-ethnic Stronger pan-ethnic identifiers prefer identifiers prefer candidates who have candidates who have Spanish facilitySpanish facility
A Basis for A Basis for Candidate Choice- Candidate Choice- IssuesIssues
++ Stronger pan-ethnic Stronger pan-ethnic identifiers place high identifiers place high emphasis on issues emphasis on issues

Correlates of Pan Ethnic Identity and Sense of aPan Ethnic Community
Elements of a Pan-Elements of a Pan-ethnic Communityethnic Community
Positive Positive AssociationAssociation
Direction Direction
Linked fate with other Linked fate with other LatinosLatinos
++ Stronger pan-ethnic Stronger pan-ethnic identifiers have identifiers have
higher level of linked higher level of linked fatefate
Ethnic group’s Ethnic group’s socioeconomic status socioeconomic status as similar w/ other as similar w/ other Latinos Latinos
++ Stronger pan-ethnic Stronger pan-ethnic identifiers perceived identifiers perceived
socioeconomic status socioeconomic status as similar w/ other as similar w/ other
Latinos Latinos
Ethnic group’s Ethnic group’s political status as political status as similar w/ other similar w/ other Latinos Latinos
++ Stronger pan-ethnic Stronger pan-ethnic identifiers perceived identifiers perceived their political status their political status as similar w/ other as similar w/ other
Latinos Latinos
Ethnic group’s sense Ethnic group’s sense of linked fate common of linked fate common to that of other to that of other Latinos Latinos
++ R’s sense of own sub-R’s sense of own sub-group’s status as group’s status as
linked w/ other linked w/ other LatinosLatinos

Levels of Pan Ethnicity and ConnectivenessLevels of Pan Ethnicity and Connectiveness
Of One’s Subgroup to Other LatinosOf One’s Subgroup to Other Latinos
One-half of LNS Latinos perceive a lot of One-half of LNS Latinos perceive a lot of commonalities with one’s group and other Latinos commonalities with one’s group and other Latinos
Stronger pan-ethnic identifiers are more inclined to Stronger pan-ethnic identifiers are more inclined to see this connection.see this connection.
Over three- fourths of the combined stronger pan-Over three- fourths of the combined stronger pan-ethic identifiers see their own national origin group ethic identifiers see their own national origin group as having a similar fate with other Latinosas having a similar fate with other Latinos

Forced Choice: Boxing in LatinosForced Choice: Boxing in Latinos
• However, forced choice reveals However, forced choice reveals more traditional patterns:more traditional patterns:
American-ness suffers American-ness suffers among foreign-born but among foreign-born but improves greatly across improves greatly across generationsgenerations
Puerto Ricans least Puerto Ricans least “Latino” and most stand “Latino” and most stand alone as a groupalone as a group
Share of Mexicans Share of Mexicans choosing pan-ethnicity choosing pan-ethnicity equalsequals share choosing share choosing national originnational origin
• We caution that this is an We caution that this is an artificial choice, one not artificial choice, one not required of people in the real required of people in the real worldworld
• Preference for pan-ethnicity Preference for pan-ethnicity still more than double what still more than double what was found in LNPS 1989was found in LNPS 1989
Distribution of Single-Identity Preference Distribution of Single-Identity Preference by National Origin Groupby National Origin Group
AmericanAmericanNational National OriginOrigin
Pan-Pan-EthnicEthnic
MexicanMexican 16.116.1 38.938.9 39.039.0
CubanCuban 27.727.7 36.836.8 26.726.7
Puerto Puerto RicanRican 21.221.2 43.943.9 27.927.9
AllAll 17.017.0 38.538.5 38.038.0
Cells are percent of group choosing that Cells are percent of group choosing that identityidentity

Less Separate and More Related: A Less Separate and More Related: A Broader and Integrated Latino Broader and Integrated Latino
CommunityCommunity
Clearer evidence of active Clearer evidence of active presence of pan-ethnicity presence of pan-ethnicity among Latinos among Latinos
Transcends nativity and Transcends nativity and immigrant background.immigrant background.
Reflects multiplicity of group Reflects multiplicity of group related identities for Latinos related identities for Latinos living in Americaliving in America
There is a political connection There is a political connection among those with stronger among those with stronger levels of pan-ethnicity and levels of pan-ethnicity and political involvements political involvements
Stronger pan-ethnic identifiers Stronger pan-ethnic identifiers more inclined to be politically more inclined to be politically aware and tied to their fellow aware and tied to their fellow Latinos. Latinos.
Partisan and ideological Partisan and ideological implications with stronger pan-implications with stronger pan-ethnic identifiersethnic identifiers
Real indicators of ongoing and Real indicators of ongoing and inter-related pan-ethnic inter-related pan-ethnic community and inter-group community and inter-group commonalities commonalities

Latinos and Racial IdentificationLatinos and Racial Identification

More complex than previously understoodMore complex than previously understoodwith confounding notions of phenotype and skin-tone.with confounding notions of phenotype and skin-tone.
Self-identification distribution among LNS Self-identification distribution among LNS respondents:respondents:
67.2% some other race67.2% some other race22.8% white22.8% white .8% black.8% black
Fully 51% of respondents say Latino/Hispanic is a Fully 51% of respondents say Latino/Hispanic is a different race!different race!
But… is Race the same as Skin-tone?But… is Race the same as Skin-tone?
Racial IdentificationRacial Identification

Determinants of Racial Self-Determinants of Racial Self-identificationidentification
Racial identification doesn’t obviously vary by Racial identification doesn’t obviously vary by citizenshipcitizenship or or generation in USgeneration in US. .
With one exception, no obvious differences by With one exception, no obvious differences by national national originorigin or or state of residencestate of residence. .
Cubans (and Floridians) are outliers (25% difference with six other Cubans (and Floridians) are outliers (25% difference with six other major Latino ethnic groups).major Latino ethnic groups).
As previously documented, Cuban Americans are more likely than As previously documented, Cuban Americans are more likely than other Latinos to self-identify as white.other Latinos to self-identify as white.
But…. Even Cuban response is a big shift from LNPS in But…. Even Cuban response is a big shift from LNPS in 1989.1989.
Cuban DistributionCuban Distribution whitewhite otherother19891989 92.592.5 3.8 3.820062006 49.949.9 43.043.0
BBuutt

Skin-tone Skin-tone
Question: “Latinos can be Question: “Latinos can be described based on skin described based on skin tone or complexion tone or complexion shades. Using a scale shades. Using a scale from 1 to 5 where 1 from 1 to 5 where 1 represents very dark and represents very dark and 5 represents being very 5 represents being very light, where would you light, where would you place yourself on that place yourself on that scale?”scale?”
A plurality selects the A plurality selects the exact middle category of exact middle category of skin-tone. skin-tone.
PercentPercent
Very dark = 1 3.31 Very dark = 1 3.31
2 7.67 2 7.67 3 40.68 3 40.68 4 19.62 4 19.62 Very light = 5 22.61 Very light = 5 22.61 REFUSED 9 6.11 REFUSED 9 6.11 -------------------------------------------------------------------- Total 100.00Total 100.00

Cuban responses for skin-tone is not significantly different from Cuban responses for skin-tone is not significantly different from other groups:other groups:
9 % answering ‘dark’ or ‘very dark,’ compared to 10-11% of 9 % answering ‘dark’ or ‘very dark,’ compared to 10-11% of other national origin groups.other national origin groups.
Darker skin-tone is associated with lower outcomes in income and Darker skin-tone is associated with lower outcomes in income and home ownership but NOT with employment or education. home ownership but NOT with employment or education.
Darker skin-tone also associated with more negative incidents with Darker skin-tone also associated with more negative incidents with police, obtaining housing, and service in restaurants.police, obtaining housing, and service in restaurants.
A Closer Look at Skin-tone A Closer Look at Skin-tone

Skin-tone and “American” Skin-tone and “American” IdentificationIdentification
In general, how strongly or not do In general, how strongly or not do you think of yourself as you think of yourself as American?American?- Very strongly, somewhat- Very strongly, somewhat
strongly, not very strongly, strongly, not very strongly, or not al all.or not al all.
The plurality answer for all The plurality answer for all respondents was “very strongly” respondents was “very strongly” but the ones most likely to feel but the ones most likely to feel this way were the lightest skin-this way were the lightest skin-tone.tone.
Not atNot at Very Very
AllAll StronglyStrongly
DarkestDarkest 20% 20% 14% 14%
NeutralNeutral 16% 16% 35% 35%
LightestLightest 14% 14% 44% 44%
----------------------------------------------------------------
All RespondentsAll Respondents
15% 15% 39%39%

Racial Identity By Skin-toneRacial Identity By Skin-tone(in percentages)(in percentages)
Skin-toneSkin-toneRace IDRace ID DarkerDarker NeutralNeutral LighterLighterWhiteWhite 1111 3232 58 58Other raceOther race 1212 4747 41 41BlackBlack 1919 5050 32 32TotalTotal 1212 4343 45 45

Latinos and PartisanshipLatinos and Partisanship

Patterns of PartisanshipPatterns of Partisanship
Overall U.S. Born Puerto Rico Born Overall U.S. Born Puerto Rico Born Outside Outside
U.S.U.S.
Democrat Democrat 42.1 55.9 56.3 33.9 42.1 55.9 56.3 33.9
RepublicanRepublican 21.5 26.0 22.9 18.8 21.5 26.0 22.9 18.8
IndependentIndependent 8.1 5.6 3.1 10.0 8.1 5.6 3.1 10.0
Don’t CareDon’t Care 12.7 4.8 5.5 17.4 12.7 4.8 5.5 17.4
Don’t KnowDon’t Know 15.6 8.6 12.7 20.0 15.6 8.6 12.7 20.0

Partisanship Among CitizensPartisanship Among Citizens
U.S. Born Naturalized Registered Not U.S. Born Naturalized Registered Not RegisteredRegistered
Democrat Democrat 55.9 43.9 55.9 33.6 55.9 43.9 55.9 33.6
RepublicanRepublican 26.0 24.9 26.1 22.3 26.0 24.9 26.1 22.3
IndependentIndependent 5.6 8.6 6.1 8.2 5.6 8.6 6.1 8.2
Don’t CareDon’t Care 4.8 9.2 3.9 15.4 4.8 9.2 3.9 15.4
Don’t KnowDon’t Know 8.6 13.4 8.1 20.6 8.6 13.4 8.1 20.6

Partisanship and GenderPartisanship and Gender
MaleMale FemaleFemale
Democrat Democrat 41.241.2 40.7 40.7
Republican Republican 23.7 18.723.7 18.7
Independent Independent 9.3 7.6 9.3 7.6
Don’t Care Don’t Care 11.7 14.611.7 14.6
Don’t Know Don’t Know 14.1 18.414.1 18.4

Partisanship and the Bush Effect:Partisanship and the Bush Effect:Presidential ApprovalPresidential Approval
RegisteredRegistered Not Registered Not Registered
DemocratDemocrat 23.6 30.0 23.6 30.0
Republican Republican 52.7 37.952.7 37.9
IndependentIndependent 29.6 31.8 29.6 31.8
Don’t Know Don’t Know 28.5 30.728.5 30.7
Don’t Care Don’t Care 26.6 31.3 26.6 31.3
“How strongly do you approve or disapprove of how President Bush is doing as President?”

Partisanship and the Bush Effect:Partisanship and the Bush Effect:Presidential FavorabilityPresidential Favorability
RegisteredRegistered Not Registered Not Registered
DemocratDemocrat 24.1 29.3 24.1 29.3
Republican Republican 53.8 38.753.8 38.7
IndependentIndependent 31.4 31.3 31.4 31.3
Don’t Know Don’t Know 28.3 19.028.3 19.0
Don’t Care Don’t Care 27.1 22.2 27.1 22.2
“Now I would like to ask you about your feelings toward President Bush. Thinking about the kind of person he Is, would you say you view him very favorably, somewhat favorably, …?”

Foundations of Bush FavorabilityFoundations of Bush Favorability
His policy positionsHis policy positions 25.225.2
LikeabilityLikeability 9.59.5
LeadershipLeadership 25.425.4
Ability to speak SpanishAbility to speak Spanish 5.3 5.3
Relates well to LatinosRelates well to Latinos 19.119.1
Commitment to his Commitment to his Christian FaithChristian Faith 15.615.6

Citizenship and Issue Positions:Citizenship and Issue Positions:Problem Facing the CountryProblem Facing the Country
CitizenCitizen Non-citizenNon-citizen
Iraq WarIraq War 30.0 33.2 30.0 33.2
Economy Economy 14.7 12.414.7 12.4
IllegalIllegal Immigration Immigration 8.4 14.8 8.4 14.8
Education/Education/ Schools Schools 4.2 4.74.2 4.7
Other Other 12.4 6.612.4 6.6
“What do you think is THE one most important problem facing the country today?”

Partisanship and Issue Positions:Partisanship and Issue Positions:Problem Facing the CountryProblem Facing the Country
Democrat Republican IndependentDemocrat Republican Independent
Iraq WarIraq War 33.8 25.1 25.8 33.8 25.1 25.8
Economy Economy 15.0 14.6 14.515.0 14.6 14.5
IllegalIllegal Immigration Immigration 6.9 9.0 10.6 6.9 9.0 10.6
Education/Education/ Schools Schools 5.4 4.5 5.05.4 4.5 5.0
Other Other 11.7 17.3 16.111.7 17.3 16.1
“What do you think is THE one most important problem facing the country today?”

Partisanship and Issue Positions:Partisanship and Issue Positions:Party Approach CountryParty Approach Country
Democrats Republicans Neither Don’t KnowDemocrats Republicans Neither Don’t Know
Democrat Democrat 39.4 7.4 43.1 10.1 39.4 7.4 43.1 10.1
RepublicanRepublican 14.6 26.2 46.3 13.0 14.6 26.2 46.3 13.0
IndependentIndependent 12.1 6.8 63.8 17.2 12.1 6.8 63.8 17.2
Don’t CareDon’t Care 6.2 3.9 54.2 35.7 6.2 3.9 54.2 35.7
Don’t KnowDon’t Know 6.1 4.8 48.5 40.6 6.1 4.8 48.5 40.6
“Which political party do you think has a better approach to address this problem?”

Citizenship and Issue Positions:Citizenship and Issue Positions:Problem Facing LatinosProblem Facing Latinos
CitizenCitizen Non-citizenNon-citizen
IllegalIllegal ImmigrationImmigration 25.0 35.1 25.0 35.1
Education/Education/ Schools Schools 13.9 3.613.9 3.6
Unemp/Jobs Unemp/Jobs 11.7 12.6 11.7 12.6
Iraq War Iraq War 1.5 1.61.5 1.6
Other Other 13.6 9.213.6 9.2
“What do you think is THE one most important problem facing the country today?”

Partisanship and Issue Positions:Partisanship and Issue Positions:Problem Facing LatinosProblem Facing Latinos
Democrat Republican IndependentDemocrat Republican Independent
IllegalIllegal Immigration Immigration 24.7 23.7 27.5 24.7 23.7 27.5
Education/Education/ Schools Schools 18.2 15.3 11.318.2 15.3 11.3
Unemp/Jobs Unemp/Jobs 12.4 11.0 9.7 12.4 11.0 9.7
Iraq War Iraq War 1.8 0.9 1.91.8 0.9 1.9
Other Other 13.8 16.4 14.413.8 16.4 14.4
“What do you think is THE one most important problem facing the Latino community today?”

Partisanship and Issue Positions:Partisanship and Issue Positions:Party Approach LatinosParty Approach Latinos
Democrats Republicans Neither Don’t KnowDemocrats Republicans Neither Don’t Know
Democrat Democrat 44.8 6.7 37.1 11.4 44.8 6.7 37.1 11.4
RepublicanRepublican 19.3 21.0 42.1 17.6 19.3 21.0 42.1 17.6
IndependentIndependent 14.4 7.8 55.7 22.0 14.4 7.8 55.7 22.0
Don’t CareDon’t Care 12.1 6.2 48.2 33.5 12.1 6.2 48.2 33.5
Don’t KnowDon’t Know 7.7 6.2 40.5 45.6 7.7 6.2 40.5 45.6
“Which political party do you think has a better approach to address this problem?”

Latinos in New and Traditional AreasLatinos in New and Traditional Areas
The Latino population, especially immigrants, has moved well The Latino population, especially immigrants, has moved well beyond traditional states such as California, Texas, and New York beyond traditional states such as California, Texas, and New York to include considerable and increasing presence in such states as to include considerable and increasing presence in such states as Arkansas, Georgia, Iowa and North Carolina.Arkansas, Georgia, Iowa and North Carolina.
These latter states -- Arkansas, Georgia, Iowa and North Carolina – These latter states -- Arkansas, Georgia, Iowa and North Carolina – are also states that had previously had little experience with are also states that had previously had little experience with immigrants and/or have substantially large African-American immigrants and/or have substantially large African-American populations.populations.

Latinos Seeing CommonalitiesLatinos Seeing Commonalitieswith Other Groups with Other Groups
Response Choices: nothing, little, some, a lot, DK/no answerResponse Choices: nothing, little, some, a lot, DK/no answer
QuestionQuestion:: Thinking about issues like job opportunities, educational attainment Thinking about issues like job opportunities, educational attainment
or income, how much do [selected ethnic term] have in common with or income, how much do [selected ethnic term] have in common with other racial groups in the United States today? Would you say other racial groups in the United States today? Would you say [selected ethnic term] have[selected ethnic term] have
… ….. .. in commonin common with African Americanswith African Americans
Results:Results: In all 7 statesIn all 7 states more respondents say “some” or “a lot” more respondents say “some” or “a lot” -- ranging -- ranging
from 46% to 57% -- than say “nothing” or from 46% to 57% -- than say “nothing” or “little.”“little.”
However, in the 4 “emerging states” 50 percent However, in the 4 “emerging states” 50 percent or lessor less of of respondents say “some” or “a lot,” while more in the other states say respondents say “some” or “a lot,” while more in the other states say “some” or “a lot”: CA (51%), TX (52 %), NY (57%)“some” or “a lot”: CA (51%), TX (52 %), NY (57%)

Question:Thinking about issues like job opportunities, educational attainment or income, how much do [selected ethnic term]have in common with other racial groups in the United States today? Would you say [selected ethnic term] have….. in common with whites:
Results:Varied pattern, hard to summarize, except that in all states fewer respondents answer “some” or “a lot” than they did for the similar question regarding Blacks. Also, CA only state where more say nothing /little than some/ a lot (47%/44%).
Socioeconomic Commonalities

Inter –Group Competition: Latinos and Others
Question:Some have suggested that [selected ethnic term] are in competition with African Americans
. …Would you tell me if you believe there is strong competition, weak competition or no competition at all with African Americans? How about… competition in getting jobs
Results:In all seven states (only) about a quarter (25-28 percent) perceived “strong competition” and about 15-20 percent or so sees “weak competition;” the plurality choice in every state is “no competition at all.”
New York stands out in having clearly the highest proportion, 36 percent, saying “strong competition.”

In 4 emerging states, 47-52 percent say “no competition at all;” consistently 25-27 percent in these states say “strong competition.”
Percent saying “strong competition” is highest in NY (35%) and TX (32%)
Competition in….having access to education and quality schools
…getting jobs with the city or state government
42 to 48% in emerging states say “no competition,” and roughly 28 % say“strong competition.” GA stands out in this group, with 33% percent saying “strong competition”
The other three states tend to have higher percentage (than “emerging”)saying “strong competition: CA 35%; TX 33% and, most strikingly, NY 43%.

Question:Competition in …“Having [selected ethnic term] representatives in elected office” Results:In all 4 emerging states “no competition” is the most common answer (41, 39, 42, and 28 percent for AR, GA, IA, and NC, respectively). GA is highest with “strong competition,” 36%.
IN CONTRAST
In the three others states, “strong competition” is the most common answer: CA 38%, TX 38%, and NY 42%
Competition in… Political Representation

Concept of “Linked Fate” with Others
Question:How much does [Latinos] doing well depend on African Americansdoing well?
Results:Percent saying “some” or “a lot” in 4 emerging states ranges from 58% (NC) to 65% (AR).
Interestingly, percent saying “some” or “a lot” is highest in NY (67%). In TX is 64% and in CA 53% say this.

IMMIGRATION POLICY
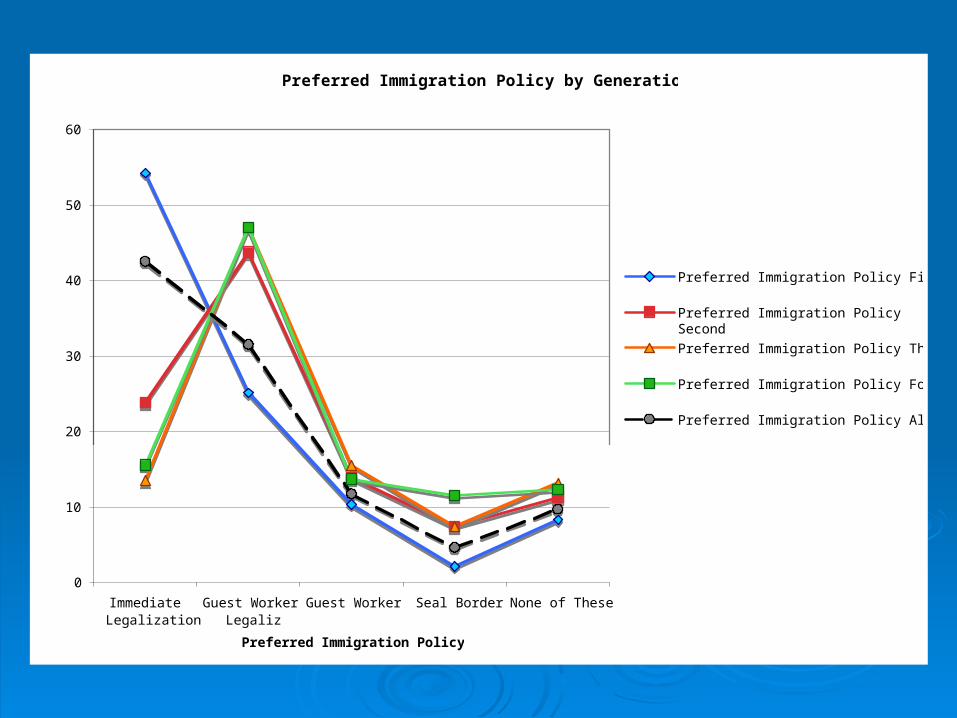
Preferred Immigration Policy by Generation
0
10
20
30
40
50
60
ImmediateLegalization
Guest WorkerLegaliz
Guest Worker Seal Border None of These
Preferred Immigration Policy
Perc
en
t w
ith
in G
en
era
tion
Preferred Immigration Policy First
Preferred Immigration PolicySecond
Preferred Immigration Policy Third
Preferred Immigration Policy Fourth
Preferred Immigration Policy All

Opinion of Effect of "Minutemen" Organizations on US Border
0
5
10
15
20
25
30
35
Improved BorderControl
Little Difference More Hostilitytoward
Immigrants
More Hostilitytoward all
Latinos
No Opinion Don't Care
Perc
en
t w
ith
in G
en
era
tion
First
Second
Third
Fourth
All

THE DECLINE OF TRANSNATIONALISM

Plans to Return Permanently to Country of Origin, among First Generation Latinos, by Years in US
Cases weighted by WT_NATIO
Years in US
4946434037343128252219161310741
Inte
nti
on t
o R
eturn
Perm
anen
tly
.5
.4
.3
.2
.1
0.0

Remittances to Country of Origin Once a Month or More, among First-Generation Latinos, by Years in US
Cases weighted by WT_NATIO
Years in US
4946434037343128252219161310741
Send R
emit
tance
s O
nce
a M
onth
or
More
.7
.6
.5
.4
.3
.2
.1
0.0

Frequent Contact (more than once a month) with Family in Country of Origin, among First-Generation Latinos,
by Years in US
Cases weighted by WT_NATIO
Years in US
4946434037343128252219161310741
Conta
ct O
nce
a M
onth
or
More
1.2
1.0
.8
.6
.4
.2
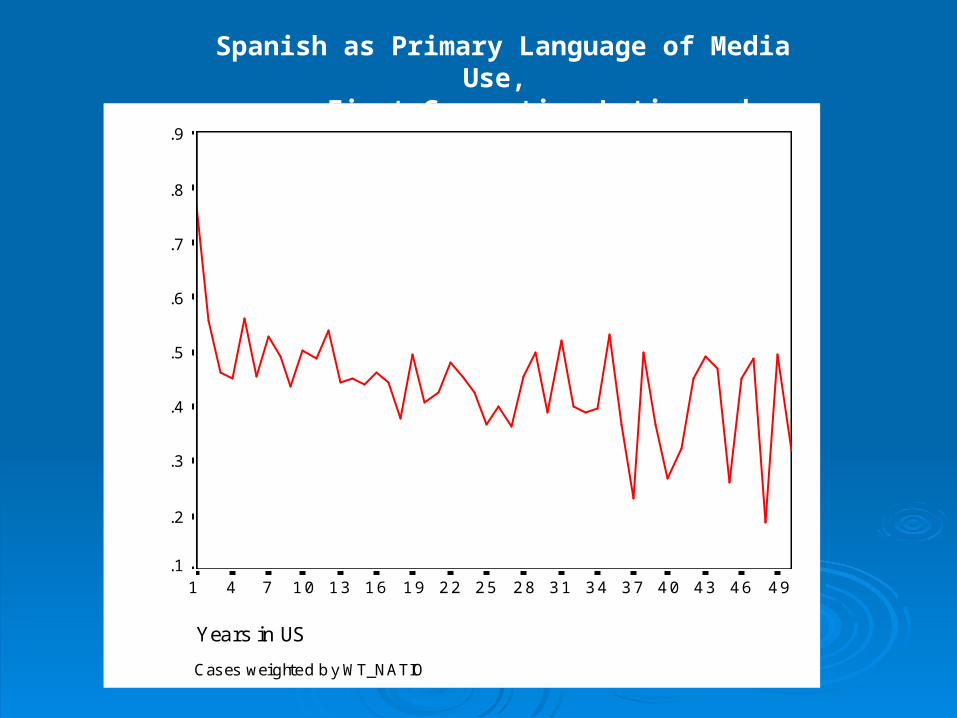
Spanish as Primary Language of Media Use, among First-Generation Latinos, by Years in US
Cases weighted by WT_NATIO
Years in US
4946434037343128252219161310741
Spanis
h a
s P
rim
ary
Langu
age o
f M
edia
Use
.9
.8
.7
.6
.5
.4
.3
.2
.1

Contact with Friends and Family in Country of Origin Once a Month or More, among Latinos in the US, by Generation
Cases weighted by WT_NATIO
Generation in the US
4321
Mean o
f C
onta
ct O
nce
or
More
Per
Month
.9
.8
.7
.6
.5
.4
.3
.2
.1
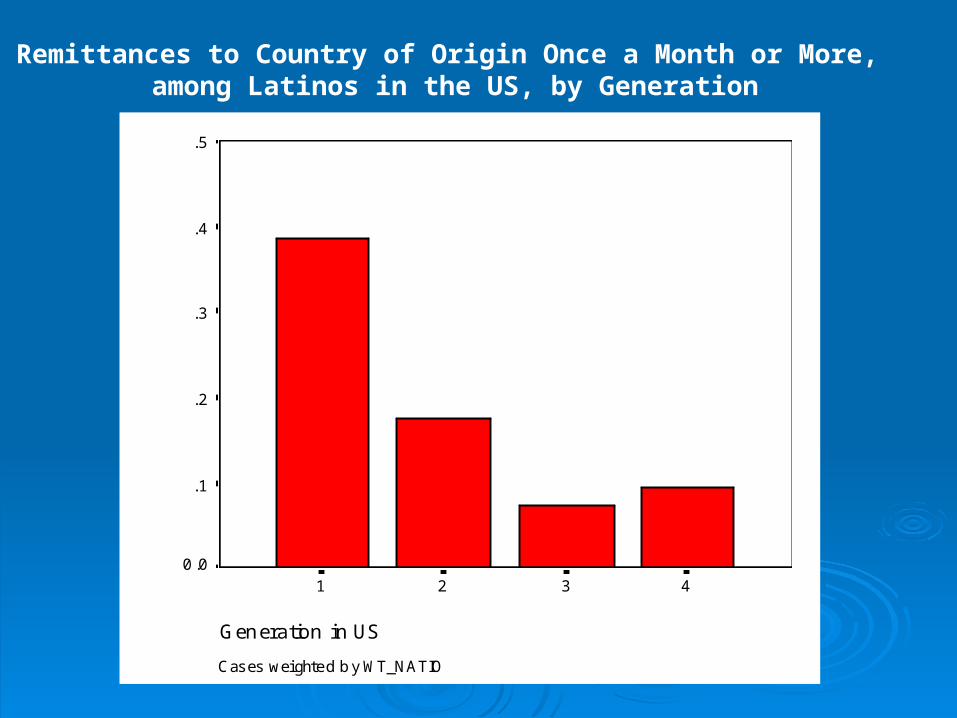
Remittances to Country of Origin Once a Month or More, among Latinos in the US, by Generation
Cases weighted by WT_NATIO
Generation in US
4321
Mean R
em
itta
nce
Once
a M
onth
or
More
.5
.4
.3
.2
.1
0.0

Spanish as Primary Language of Media Use, among Latinos in the US, by Generation
Cases weighted by WT_NATIO
Generation in US
4321
Mean P
rim
ary
Spanis
h M
edia
.5
.4
.3
.2
.1

Follow Politics in Country of Origin a Lot, among Latinos in the US, by Generation
Cases weighted by WT_NATIO
Generation in US
4321
Mean F
ollo
w P
oliti
cs in C
ountr
y of
Ori
gin
A L
ot
.16
.14
.12
.10
.08
.06
.04

BEING AMERICAN

"Very Strong" Identification
0
10
20
30
40
50
60
70
80
90
First Second Third Fourth
Generation
Perc
en
t Latino/Hispanic
Country of Origin
American

Choice of Primary Identifier, by Generation
0
10
20
30
40
50
60
First Second Third Fourth
Percent
Gen
era
tion
in
US
Latino/Hispanic
Country or Origin
American

Perceived Importance of Speaking English
0
10
20
30
40
50
60
70
80
90
100
First Second Third Fourth
Generation
Perc
en
t w
ith
in G
en
era
tion
Not Important
Somewhat
Very Important

Perceived Importance of Being White
0
10
20
30
40
50
60
70
80
First Second Third Fourth
Generation
Perc
en
t w
ith
in G
en
era
tion
Not ImportantSomewhatVery Important

Perceived Importance of Being Christian
0
5
10
15
20
25
30
35
40
45
50
First Second Third Fourth
Generation
Perc
en
t w
ith
in G
en
era
tion
Not Important
Somewhat
Very Important

The Latino National Survey Presentation at the The Latino National Survey Presentation at the Woodrow Wilson Center, including:Woodrow Wilson Center, including:
• Executive Summary• Executive Summary• Demographic Tables• Demographic Tables• Background Tables• Background Tables• Toplines• Toplines
Will be available at:Will be available at:
http://[email protected]://[email protected]
andand
http://depts.washington.edu/uwiser/LNS.shtmlhttp://depts.washington.edu/uwiser/LNS.shtml