Embed Size (px)
Citation preview

Estudios de Economía Aplicada
ISSN: 1133-3197
Asociación Internacional de Economía
Aplicada
España
Post, Thierry
A Stochastic Dominance Approach to Spanning. With an Application to the January Effect
Estudios de Economía Aplicada, vol. 23, núm. 1, abril, 2005, pp. 7-25
Asociación Internacional de Economía Aplicada
Valladolid, España
Disponible en: http://www.redalyc.org/articulo.oa?id=30123101
Cómo citar el artículo
Número completo
Más información del artículo
Página de la revista en redalyc.org
Sistema de Información Científica
Red de Revistas Científicas de América Latina, el Caribe, España y Portugal
Proyecto académico sin fines de lucro, desarrollado bajo la iniciativa de acceso abierto

ISSN 1697-5731 (online) – ISSN 1133-3197 (print)
E S T U D I O S D E E C O N O M Í A A P L I C A D A V O L . 23-1, 2 0 0 5. P Á G S . 7-25
A Stochastic Dominance Approach to Spanning. With anApplication to the January Effect
THIERRY POSTErasmus University Rotterdam .P.O. Box 1738, 3000 DR Rotterdam, The Netherlands».Tfno. (+31) 10 - 408 14 28 Fax. (+31) 10 - 408 91 65. E-mail: [email protected]
RESUMEN
En este trabajo se desarrolla una metodología tipo Dominio Estocástico para analizar si un inversorracional, insaciable y adverso al riesgo se beneficia de una particular expansión de sus posibilidades deinversión. Mediante el Dominio Estocástico se elimina la asunción simplificadora subyacente a la aproxi-mación tradicional Media Varianza a este fenómeno. En este trabajo se extiende también la aplicación deesta metodología al análisis del comportamiento del mercado de pequeñas firmas en el mes de enero. Losresultados obtenidos sugieren que la explicación de este fenómeno, el Efecto Enero, no es congruente conla asunción simplificadora sobre el comportamiento de los rendimientos.
Palabras Clave: Spanning, Dominio Estocástico, Efecto Enero, Asimetría.
Una aproximación mediante la metodología del dominio estocástico alfenomeno del Spanning. Una aplicación al efecto Enero
ABSTRACT
We develop a Stochastic Dominance methodology to analyze whether rational non-satiable and riskaverse investors benefit from a particular expansion of the investment possibilities. This methodologyavoids the simplifying assumptions underlying the traditional mean variance approach to spanning. Themethodology is applied to analyze the stock market behavior of small firms in the month of January. Ourfindings suggest that the previously observed January effect is remarkably robust with respect tosimplifying assumptions regarding the return distribution.
Keywords: Spanning, Stochastic Dominance, January Effect, Asymmetry.
Clasificación JEL: G10, G11, C15.
Artículo disponible en versión lectrónica en la página www.revista-eea.net, ref.: -23112
8 Thierry Post
Estudios de Economía Aplicada, 2005: 7-25 • Vol. 23-1
SPANNING occurs if no investor in a particular class of investors benefits from aparticular expansion of the investment possibilities. This concept is useful for numerousproblems in financial economics. For example, it is useful for analyzing the impact ofthe introduction of new assets (e.g., via IPOs) or the relaxation of investment restrictionsfor existing assets (e.g., liberalization in emerging markets).
Thus far, the literature on spanning predominately focused on mean variance analysis(MVA); see, e.g., Huberman and Kandel (1987). Unfortunately, MVA in many casesis not ‘economically meaningful’. For example, it is well known that MVA is consistentwith Expected Utility Theory only for restrictive classes of return distributions andinvestor utility functions. Roughly speaking, the return distribution should be ellipticalor investor utility should be quadratic (see, e.g., Hanoch and Levy (1969), SectionIV). A wealth of evidence suggests that both assumptions are highly unrealistic. Forexample, asset returns exhibit systematic skewness and investors exhibit a preferencefor positive skewness (see, e.g., Kraus and Litzenberger (1976) and Harvey andSiddique (2000)). One approach to circumvent this limitation is to extend MVA towardsa more general framework that also includes higher moments of the return distribution.Unfortunately, economic theory does not forward strong predictions on investorpreferences or asset return distributions, and it gives minimal guidance for selectingthe appropriate set of moments.
This paper uses an alternative approach to spanning, using Stochastic Dominance(SD; see, e.g., Levy (1998)). SD criteria rely on a minimal set of preference anddistribution assumptions, and they effectively consider the entire return distributionrather than a finite set of moments. This approach is useful if there is no prior reasonto restrict preferences or distributions, as is generally true for investor behavior andasset returns. Despite its theoretical attractiveness, SD thus far has not seen a strongproliferation in financial economics. (Noteworthy exceptions are Falk and Levy’s (1989)study of market reactions to quarterly earnings’ announcements and the studies of theJanuary effect by Seyhun (1993) and Larsen and Resnick (1996).) This is presumablycaused by several practical problems traditionally associated with SD: (1) the lack ofstatistical power (=ability to detect inefficient portfolios) in small samples, (2) theabsence of tools for statistical inference, and (3) the computational burden for theimportant case where it is possible to diversify between the choice alternatives. Anumber of recent developments deals with these problems and provides a strong stimulustowards the further proliferation of SD. First, various approaches have been developedto approximate the sampling distribution of SD results, including bootstrapping (e.g.Nelson and Pope (1990)) and asymptotic distribution theory (see, e.g., Davidson andDuclos (2000)). These approaches allow for constructing confidence intervals and fortesting hypotheses. Second, Post (2003) presents tractable linear programming (LP)tests for SD efficiency in the case with diversification possibilities. These tests improvecomputational tractability and statistical power (all diversified portfolios are includedin the analysis, which improves the likelihood of detecting inefficient portfolios).


17A STOCHASTIC DOMINANCE APPROACH TO SPANNING. WITH AN APPLICATION...
Estudios de Economía Aplicada, 2005: 7-25 • Vol. 23-1
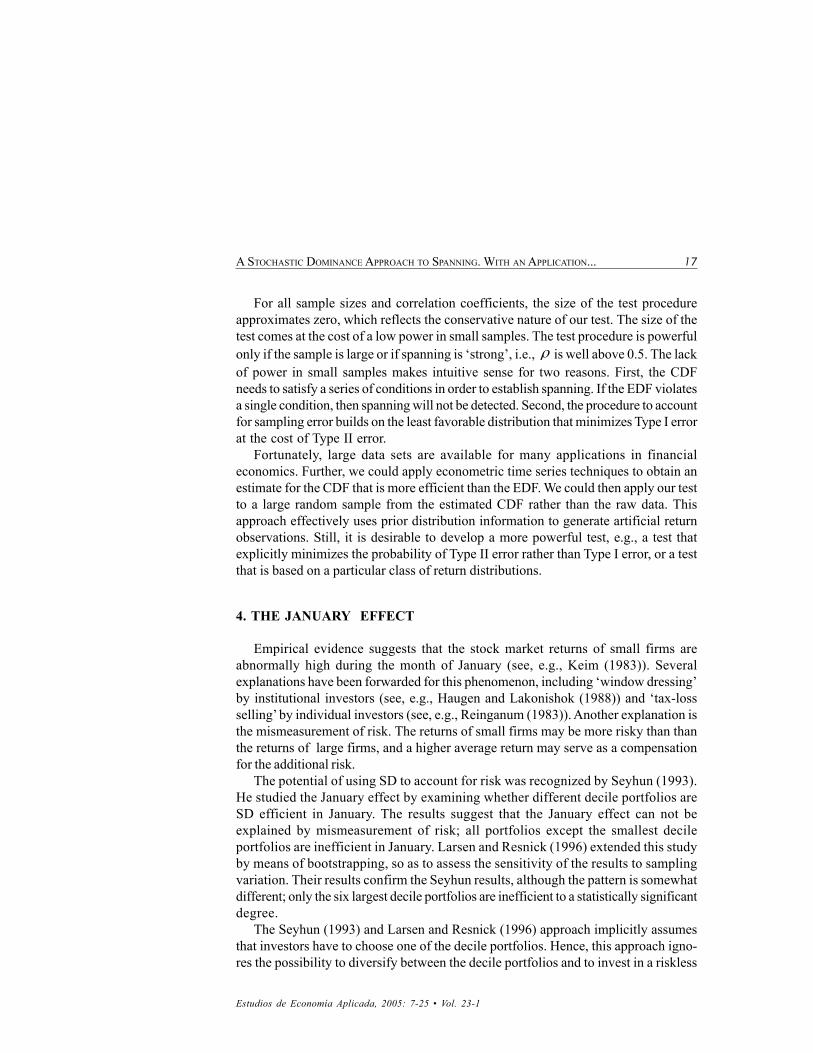
For all sample sizes and correlation coefficients, the size of the test procedureapproximates zero, which reflects the conservative nature of our test. The size of thetest comes at the cost of a low power in small samples. The test procedure is powerfulonly if the sample is large or if spanning is ‘strong’, i.e., ρ is well above 0.5. The lackof power in small samples makes intuitive sense for two reasons. First, the CDFneeds to satisfy a series of conditions in order to establish spanning. If the EDF violatesa single condition, then spanning will not be detected. Second, the procedure to accountfor sampling error builds on the least favorable distribution that minimizes Type I errorat the cost of Type II error.
Fortunately, large data sets are available for many applications in financialeconomics. Further, we could apply econometric time series techniques to obtain anestimate for the CDF that is more efficient than the EDF. We could then apply our testto a large random sample from the estimated CDF rather than the raw data. Thisapproach effectively uses prior distribution information to generate artificial returnobservations. Still, it is desirable to develop a more powerful test, e.g., a test thatexplicitly minimizes the probability of Type II error rather than Type I error, or a testthat is based on a particular class of return distributions.
4. THE JANUARY EFFECT
Empirical evidence suggests that the stock market returns of small firms areabnormally high during the month of January (see, e.g., Keim (1983)). Severalexplanations have been forwarded for this phenomenon, including ‘window dressing’by institutional investors (see, e.g., Haugen and Lakonishok (1988)) and ‘tax-lossselling’ by individual investors (see, e.g., Reinganum (1983)). Another explanation isthe mismeasurement of risk. The returns of small firms may be more risky than thanthe returns of large firms, and a higher average return may serve as a compensationfor the additional risk.
The potential of using SD to account for risk was recognized by Seyhun (1993).He studied the January effect by examining whether different decile portfolios areSD efficient in January. The results suggest that the January effect can not beexplained by mismeasurement of risk; all portfolios except the smallest decileportfolios are inefficient in January. Larsen and Resnick (1996) extended this studyby means of bootstrapping, so as to assess the sensitivity of the results to samplingvariation. Their results confirm the Seyhun results, although the pattern is somewhatdifferent; only the six largest decile portfolios are inefficient to a statistically significantdegree.
The Seyhun (1993) and Larsen and Resnick (1996) approach implicitly assumesthat investors have to choose one of the decile portfolios. Hence, this approach igno-res the possibility to diversify between the decile portfolios and to invest in a riskless
18 Thierry Post
Estudios de Economía Aplicada, 2005: 7-25 • Vol. 23-1
asset.8 To test whether the January effect is robust with respect to the inclusion ofdiversification possibilities and a riskless asset, we apply our SSDR spanning test. Weanalyze ten value-weighted decile portfolios of NYSE, AMEX, and NASDAQ stocks,and the one-month US Treasury bill (the riskless asset). We use data on monthlydividend-adjusted returns from July 1926 to December 2000 (894 observations) obtainedfrom the data library on the homepage of Kenneth French. Table 1 gives somedescriptive statistics for the data set.9
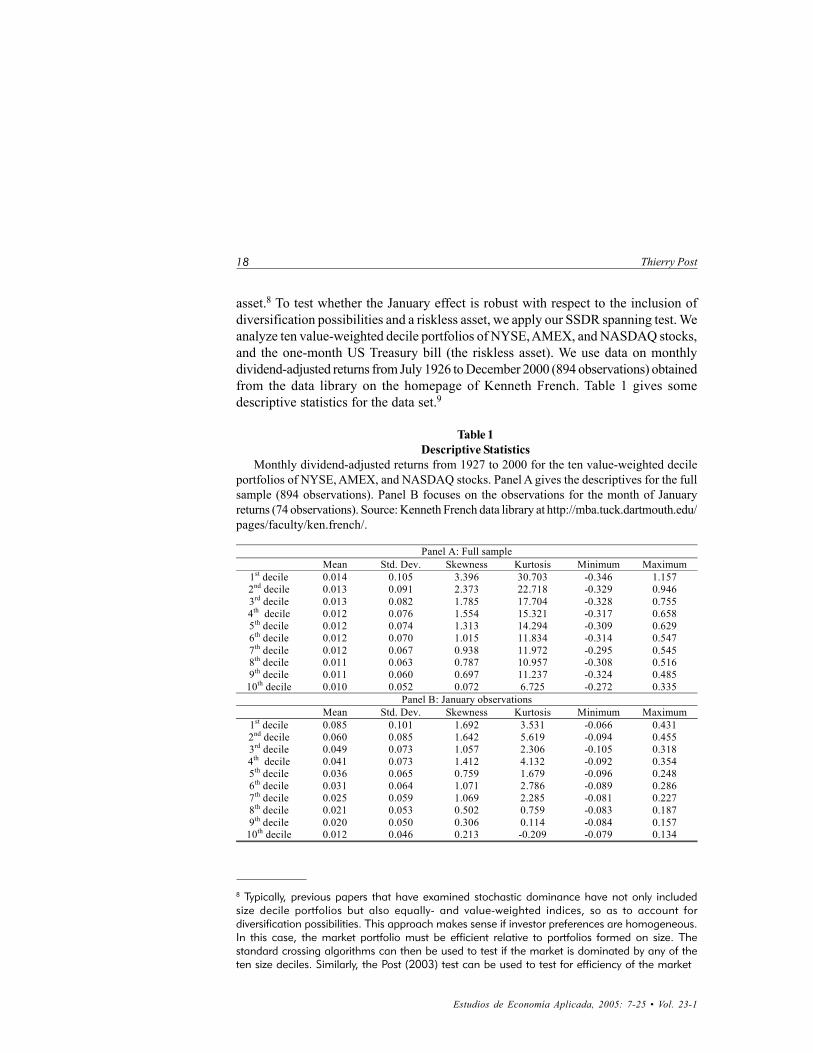
Table 1Descriptive Statistics
Monthly dividend-adjusted returns from 1927 to 2000 for the ten value-weighted decileportfolios of NYSE, AMEX, and NASDAQ stocks. Panel A gives the descriptives for the fullsample (894 observations). Panel B focuses on the observations for the month of Januaryreturns (74 observations). Source: Kenneth French data library at http://mba.tuck.dartmouth.edu/pages/faculty/ken.french/.
Panel A: Full sample Mean Std. Dev. Skewness Kurtosis Minimum Maximum
1st decile 0.014 0.105 3.396 30.703 -0.346 1.157 2nd decile 0.013 0.091 2.373 22.718 -0.329 0.946 3rd decile 0.013 0.082 1.785 17.704 -0.328 0.755 4th decile 0.012 0.076 1.554 15.321 -0.317 0.658 5th decile 0.012 0.074 1.313 14.294 -0.309 0.629 6th decile 0.012 0.070 1.015 11.834 -0.314 0.547 7th decile 0.012 0.067 0.938 11.972 -0.295 0.545 8th decile 0.011 0.063 0.787 10.957 -0.308 0.516 9th decile 0.011 0.060 0.697 11.237 -0.324 0.485
10th decile 0.010 0.052 0.072 6.725 -0.272 0.335 Panel B: January observations
Mean Std. Dev. Skewness Kurtosis Minimum Maximum 1st decile 0.085 0.101 1.692 3.531 -0.066 0.431 2nd decile 0.060 0.085 1.642 5.619 -0.094 0.455 3rd decile 0.049 0.073 1.057 2.306 -0.105 0.318 4th decile 0.041 0.073 1.412 4.132 -0.092 0.354 5th decile 0.036 0.065 0.759 1.679 -0.096 0.248 6th decile 0.031 0.064 1.071 2.786 -0.089 0.286 7th decile 0.025 0.059 1.069 2.285 -0.081 0.227 8th decile 0.021 0.053 0.502 0.759 -0.083 0.187 9th decile 0.020 0.050 0.306 0.114 -0.084 0.157
10th decile 0.012 0.046 0.213 -0.209 -0.079 0.134
8 Typically, previous papers that have examined stochastic dominance have not only includedsize decile portfolios but also equally- and value-weighted indices, so as to account fordiversification possibilities. This approach makes sense if investor preferences are homogeneous.In this case, the market portfolio must be efficient relative to portfolios formed on size. Thestandard crossing algorithms can then be used to test if the market is dominated by any of theten size deciles. Similarly, the Post (2003) test can be used to test for efficiency of the market
19A STOCHASTIC DOMINANCE APPROACH TO SPANNING. WITH AN APPLICATION...
Estudios de Economía Aplicada, 2005: 7-25 • Vol. 23-1
We test whether the smallest decile portfolio and the Treasury bill span the largerdecile portfolios. Specifically, for every decile portfolio, we compute the value of thetest statistic Pψ , using the smallest decile portfolio and the Treasury bills as benchmarkassets. Next, we compute the asymptotic least favorable p-value, with the samplevariance 2σ̂ to proxy the unknown population variance. If this p-value is smaller thanor equal to the significance level, then we may conclude that SSDR spanning occurs.
Table 2 gives the results. For decile the full sample, spanning occurs for none ofthe 9 higher portfolios. Hence, there exist rational, risk-averse investors that invest atleast part of their wealth in the higher decile portfolios, and we cannot conclude thatthe lowest decile portfolio exhibits abnormal performance. The results changeremarkably if we consider the January returns only. The smallest decile portfolio andthe T-bill span all of the 9 higher decile portfolios. For the 8 highest decile portfolios,the classification is statistically significant at a level of confidence of about 95 percent.10
These results support the results by Seyhun and Larsen and Resnick; the Januaryeffect is not explained away by the mismeasurement of risk. The robustness of theJanuary effect is remarkable, especially because our test is based on the asymptoticleast favorable distribution and it typically involves low power for samples as small as74 observations (see Figure 2).
relative to all possible portfolios constructed from the ten size deciles. However, these tests areno longer relevant if investors have heterogeneous preferences. Dybvig and Ross (1982) havedemonstrated that the SSD efficient set generally is not convex, and hence, there is no guaranteethat the market portfolio is efficient if different investors hold different portfolios. (In this case,there is no ‘size anomaly’ if, e.g., the market portfolio and the large decile portfolios areinefficient, but different investors hold different portfolios that include all ten deciles.) A test forspanning effectively tests if all assets are included in some efficient portfolio (not necessarilywith a weight that equals the relative market capitalization). This test is also relevant if differentinvestors hold different portfolios.9 To account for the variation over time of the return distribution, the raw returns in month t arecorrected for the difference between the riskless rate at time t and the riskless rate for December2000.10 Each p-value corresponds to the hypothesis that a single decile portfolio is not spanned. If wetest the joint hypothesis that all decile portfolios are not spanned, then we should adjust thesignificance level, so as to avoid a ‘fishing expedition’; increasing the number of portfoliosincreases the likelihood of finding small p-values. For example, a Bonferroni correction (see,e.g., Miller (1981, pages 6-8)) uses a significance level of /N for each of N individual tests, whichguarantees that the overall significance level is less than . Using this approach for our study, wecan reject thejoint hypothesis that no decile portfolio is spanned with at least 99 percentconfidence.

21A STOCHASTIC DOMINANCE APPROACH TO SPANNING. WITH AN APPLICATION...
Estudios de Economía Aplicada, 2005: 7-25 • Vol. 23-1
more power (or less Type II error; wrongly classifying an inefficient portfolio asefficient) than SD does. Therefore, the SD tests are natural complements ratherthan substitutes for the existing MVA tests.
2. Our spanning tests effectively test if the risky asset A improves the investmentpossibilities available from two benchmark assets: the riskless asset F and therisky asset M. This approach is useful if we can aggregate in a meaningful wayall risky benchmark assets and all new assets (e.g., using a two-fund separationtheorem). Still, it would be interesting to extend our analysis to the case withmultiple risky benchmark assets and multiple new assets. Our test is based onchecking whether all hyperplanes that support F and M also support A (see theProof to Theorem 1). Introducing multiple new assets is relatively simple: wecan check if the hyperplanes support all new assets. This boils down to simplyapplying our test for all new assets. (Section V effectively uses this approach toanalyze if the smallest decile portfolio and the T-bills span the 9 higher decileportfolios.) By contrast, introducing multiple risky benchmark assets substantiallyincreases computational complexity. In our model, all portfolios of M and Finvolve the same ranking for the returns (recall that the test statistics Pψ and
Dψ use ordered return observations). In case of multiple risky benchmark assets,many different rankings generally occur. Determining all different rankings isnot easy and enumerating all possible rankings involves substantial computationalburden. Finding a more tractable approach is an interesting route for furtherresearch.
3. We have focused on obtaining an analytical characterization of the asymptoticsampling distribution of our test statistics. Bootstrapping is another approach tosampling error. The bootstrap, first introduced by Efron (1979) and Efron andGong (1983), is a well-established statistical tool to analyze the sensitivity ofempirical estimators to sampling variation in situations where the samplingdistribution is difficult or impossible to obtain analytically. Nelson and Pope (1991)demonstrated in a convincing way that this approach can quantify the sensitivityof the EDF to sampling variation, and that SD analysis based on the bootstrappedEDF is more powerful than comparison based on the original EDF. The tractableLP structure of our tests suggests that it is possible also for SSDR spanning tosubstitute brute computational force to overcome the analytical intractability ofSD. The bootstrap potentially offers more power than the analyticalcharacterization in Theorem 2, as the theorem uses the least favorable distributionthat minimizes Type I error at the cost of Type II errors. Of course, this benefithas to be balanced against the computational burden associated withbootstrapping.


25A STOCHASTIC DOMINANCE APPROACH TO SPANNING. WITH AN APPLICATION...
Estudios de Economía Aplicada, 2005: 7-25 • Vol. 23-1
KROLL, Y. AND H. LEVY (1980): Sampling Errors and Portfolio Efficient Analysis, Journal of Financial
and Quantitative Analysis 15, 655-688.
LARSEN, G. A. AND B. G. RESNICK (1996): «Refining the Bootstrap Method of Stochastic DominanceAnalysis: The Case of the January Effect,» Review of Quantitative Finance and Accounting 7(1), 65-79.
LEVY, H. (1998): Stochastic Dominance, Kluwer Academic Publishers, Norwell, MA.
MILLER, RUPERT G., 1981, Simultaneous Statistical Inference, Second Edition, New York, Springer-Verlag.
NELSON, R. D. AND R. POPE (1991) ‘Bootstrapped insights into empirical applications of stochasticdominance ‘, Management Science 37, 1182-1194.
POST, G. T., 2003, ‘Empirical Tests for Stochastic Dominance Efficiency’, Journal of Finance 58, 1905-1932.
REINGANUM, M. R. (1983): ‘The anomalous stock market behavior of small firms in January: Empiricaltests for tax-loss selling effects’, Journal of Financial Economics 12, 89-104.
SEYHUN, H. N. (1993): ‘Can Omitted Risk Factors Explain the January Effect? A Stochastic DominanceApproach’, Journal of Financial an Quantitative Analysis 28, 195-212.