Embed Size (px)
Citation preview

REDACTED VERSION
Shipping Conferences: A Study of the Impact of FEFC Activity on
Prices in the North Europe-Asia Trade
By Nils von Hinten-Reed1, Tasneem Chipty2, and Fiona Scott Morton3
Charles River Associates
June 4, 2004
1 Principal, Charles River Associates 2 Principal, Charles River Associates 3 Professor of Economics, Yale School of Management

TABLE OF CONTENTS
I. Introduction and Summary of Opinions ........................................................... 1
II. Industry Background ......................................................................................... 3
III. The Economic Principles of Coordinated Behavior ........................................ 7
A. Coordination to Avoid Competition ....................................................... 8 B. Conference versus Non-Conference Members..................................... 9 C. Ability of the FEFC Members to Sustain Collusion ............................. 10
IV. Empirical Framework ....................................................................................... 11
V. Data used for Analysis..................................................................................... 14
A. FEFC Membership.............................................................................. 15 B. FEFC Rate Announcements ............................................................... 16 C. FEFC Capacity Share......................................................................... 17 D. Aggregate Demand............................................................................. 17 E. Exchange Rates ................................................................................. 18 F. Aggregate Capacity ............................................................................ 19 G. Singapore Diesel Spot Price ............................................................... 19
VI. Regression Analysis of Price Levels .............................................................. 19
A. Base Specification, 2000-2003 Sample .............................................. 19 B. Extensions of the Base Specification.................................................. 22 C. 2003 Only Sample .............................................................................. 25 D. First Difference Model......................................................................... 26
VII. Conclusions...................................................................................................... 27
i

I. INTRODUCTION AND SUMMARY OF OPINIONS
1. As part of the on-going DG Competition review of Regulation 4056/86 and the
Article 3 exemption of shipping conferences, we have been asked by outside counsel
for the European Liner Affairs Association (“ELAA”) to study the effect of shipping
conferences on shipping rates in the North Europe-Asia trade. Our goal has been to
study the effects of the Far East Freight Conference (“FEFC”), the conference that
governs the North Europe-Asia trade, on price levels and price volatility. To this end,
we provide a conceptual framework to evaluate the ability of the FEFC to monitor and
enforce an agreement amongst member carriers to raise price above competitive
levels. We also undertake an empirical analysis of the effect of FEFC activity on
price, using historical data.
2. The North Europe-Asia trade is currently served by 23 carriers, 15 of which belong to
the FEFC and control about 60 percent of the available capacity.1 The central
question is whether the FEFC has market power – that is, the ability to raise price
above competitive levels. An important determinant of market power is conference
presence, measured as market share. Unfortunately, these data were unavailable, and
as such, we were unable to collect information on conference market shares by route
over time. Thus, the scope of our empirical analysis is necessarily limited. Given
data availability, we have examined the effects of conference membership and rate
1
1 FEFC members are ANL Container Lines, APL Co Pte Ltd., CMA CGM SA, Egyptian International
Shipping Co., Hapag Lloyd Container Linie GmbH, Hyundai Merchant Marine Co. Ltd., Kawasaki Kisen Kaisha Ltd, A.P. Moller - Maersk SeaLand, Malaysia International Shipping Corporation Berhad, Mitsui O.S.K. Lines Ltd., Nippon Yusen Kaisha, Norasia Container Lines Ltd., Orient Overseas Container Line, P & O Nedlloyd Ltd, and Yangming Transport Corporation.

announcements on price levels. We have also examined the extent to which
conference rate announcements mirror expectations about market conditions.
3. Our principal findings thus far are that FEFC members earn higher revenues per TEU
than non-conference members. We expect that this difference is due in part to
differences in quality of services such as convenient inland transportation and
loading/unloading of cargo.2 This difference may also be due in part to differences in
shipper characteristics, across conference and non-conference carriers.3 In addition,
we find that conference rate announcements contain information about market
fundamentals. Specifically, in our study of westbound cargo movements, rate
announcements appear to be highly correlated with measures of aggregate demand
and fuel prices. Given data limitations, we are unable to estimate the effect of FEFC
market share on price levels, nor are we able to determine the effect of conference
activity on price volatility.
4. Our study of documents and materials relevant to this matter is ongoing. Among the
materials we have reviewed are various issues of “The Drewry Container Market
Quarterly;” materials available on the FEFC website; and various documents provided
2 According to a recent survey conducted by Capital Consulting & Management, Inc. (“CMMI”), Maersk,
APL, and the NYK Line, all three of which are conference carriers, were identified by shippers as “leaders in Trans-Pacific ocean carrier quality.” These shippers described “network and delivery as the most critical performance factors, followed by price….” See CMMI, “Maersk, APL, and NYK Line Are Leaders in Trans-Pacific Ocean Carrier Quality; Pioneering CMMI Survey Uncovers What Quality Means to Shippers, Forwarders,” www.ccmiservices.com, May 26, 2004, p. 1.
3 In addition to quality differences, there may also be different compositions of demand served by FEFC conference and non-conference members. We understand that within containerized cargo, conference carriers handle more cargo controlled by European importers who typically negotiate carrier rate agreements with longer-term commitments than their Asian counterparts. Thus, FEFC member carriers may be able to sustain higher rates in a falling market, as in the 2000 to 2001 time period, because of their shipper’s lesser ability to adjust rates in response to fluctuating market conditions.
2

by the ELAA. We have also reviewed proprietary data provided by eight carriers
serving the North Europe-Asia trade.
5. In the next section, we provide some industry background. Section III presents the
economic principles of coordination, including a discussion of whether the market
structure on the North Europe-Asia trade is likely to satisfy the elements necessary for
successful coordination. Section IV describes the empirical framework used to assess
the impact of the FEFC. Section V describes the data, and Section VI the regression
results. Section VII summarizes our conclusions.
II. INDUSTRY BACKGROUND
6. Shipping conferences have existed since the late 19th century with the stated goal of
insulating the marketplace from destructive competition.4 A shipping conference is a
group of member carriers serving a particular trade that regularly meets to discuss
trade and industry outlook.5 In contrast to a trade association, the members of a
shipping conference are permitted to discuss prices. Different trades are governed by
different conferences. For example, routes between North Europe and Asia are
governed by the FEFC, while routes between Europe and the US are governed by the
Trans-Atlantic Conference Association (“TACA”).6
7. According to David Jeffries, the General Manager of TACA, TACA representatives
have policy meetings about 10 times a year. Jefferies says, “The carriers come
4 William Sjostrom, “Antitrust Immunity for Shipping Conferences: An Empty Core Approach,” The
Antitrust Bulletin, Summer 1993, pp. 419-423. 5 Conferences, as stated above, are regulated by the Block Exemption contained in Regulation 4056/86. 6 OECD, “Competition Policy in Liner Shipping: Final Report” April 16, 2002, p.22.
3

together and they are able to consider the general state of the trade, and look at issues
of common interest -- rules and regulations, the regulatory scenes in Europe and in
Washington. The carriers can look at their general market share, the state of the trade,
how they see the market developing and consider means of creating and maintaining
stability in the market. If you can pool knowledge, pool views, you have a general
feel for the trade. Then you don't have people acting irrationally and you can
engender a degree of stability.”7 Similarly, the FEFC Principals representatives meet
about 8 times a year.8
8. Historically, carriers within a conference agree to adopt a common rate structure and a
regular schedule of service on specific routes, even during periods of low volume.9,10
Following the Carrier group discussions and Revised TACA decision of the
Commission in 1999, however, the FEFC – like many other conferences – has
reduced dramatically in both size and scope. It is our understanding that while the
FEFC must publish a tariff, it can no longer require a common rate structure.11
Instead, the FEFC engages in a “rate restoration” program whereby it periodically
announces desired rate increases. Since 1999, the FEFC has not policed its
7 Chris Dupin, “Why TACA Has Survived,” Journal of Commerce, Monday, January 29, 2001.
8 FEFC announcement archives, http://www.fareasternfreightconference.com/Press_and_Notices?archive=true.
9 OECD, op. cit., p. 18 10 See Fiona Scott Morton, “Entry and Predation: British Shipping Cartels 1879-1929,” Journal of Economics
and Management Strategy, Vol. 6, No. 4, Winter 1997, pp. 686-687, for a historical description of shipping conferences.
411 Interview with Rod Riseborough, Chief Executive Officer of the FEFC Secretariat, April 8, 2004

members’ relationships with shippers to determine or enforce compliance with its
suggested conference rate and/or announced rate increases.12
9. Over the last several years, containerized cargo between North Europe and Asia has
been transported at individually negotiated rates, whether they are spot rates or rate
agreements with longer-term commitments.13 Carriers typically charge an “all-in-
rate”, which includes sea transport charges, ancillary charges, and surcharges.14 Some
carriers are vertically integrated, owning certain equipment and facilities at ports that
can facilitate the loading or unloading of cargo.15 We also understand that certain
carriers offer better forms of inland transportation.16 To the extent that conference
members offer better services, in terms of loading/unloading cargo or inland
transportation, relative to non-conference members, conference members may be able
to charge higher prices.
10. Containerized cargo refers to cargo transported in standard containers that are loaded
onto container ships, and can include merchandise such as consumer electronics,
apparel, and paper.17 Containers come in two standard sizes: 20-foot boxes and 40-
12 Interview with Rod Riseborough, op. cit. 13 Due in part to the fact that there are no Federal Maritime Commission requirements outside of the US, rate
agreements in the FEFC are less formal than the rate contracts found in the North Atlantic. 14 This “all-in” rate contains at least 3 legs (maritime, two ports) and sometimes 5 if the inland rates are
included. The data set received from the FEFC lines was port to port. 15 For example, MSC in Antwerp, CMA CGM in Marseille, and Hapag Lloyd each have partial ownership in
Alterswerder, APM Terminal, P&O Ports. 16 For example, European Rail Shuttle is owned by Maersk Sealand and P & O Nedlloyd Ltd. 17 In 2000, about 60 percent of worldwide non-bulk cargo was containerized cargo. Joseph Sussman,
Introduction to Transportation Systems, Norwood, MA: Artech House, Inc., 2000, p. 264.
5

foot boxes. Volume is typically measured in terms of TEUs or “twenty-foot
equivalent units”. Thus, a 40-foot box contains 2 TEUs.18
11. Industry supply and demand needs have been generally increasing over time.19 As
manufactured products, such as consumer electronics, are produced primarily in Asia
(not in Europe), westbound demand for scheduled service is much greater than the
eastbound demand. As a result, there is less excess capacity going westbound,
relative to eastbound, and the lines’ principal problem is getting as many boxes back
to the Far East as quickly as possible in order to satisfy the westbound demand.20
12. In addition to shipping conferences, the industry attempts to balance its supply and
demand needs through the use of shipping consortia. Shipping consortia refer to
arrangements among carriers, conference and non-conference carriers alike, to share
current fleet capacity.21 If one carrier has sold too many slots, it can buy the excess
from another member of the consortia. By allowing carriers access to the same
vessels, shipping consortia dilute potential asymmetries that might otherwise arise
across conference and non-conference carriers.
18 Typically, a 40-foot bay cannot accommodate two 20-foot boxes. 19 World Trade Organization, Annual Report 2004, p. 3. 20 This has been particularly acute in 2003 and 2004 with the growth of exports from China. See World Trade
Organization, op. cit., p. 3. 21 Competition rules for consortia are contained in Regulation 823/2000.
6

III. THE ECONOMIC PRINCIPLES OF COORDINATED BEHAVIOR
13. Shipping conferences can provide the mechanism to orchestrate coordination among
carriers serving the routes in the trade. In principle, carriers may coordinate (either
explicitly or tacitly) on a number of different decisions – including sea prices, inland
haulage rates, schedules, capacity investments, and reactions to regulations. We focus
in this paper on the periodic conference announcements of suggested rate increases.
To the extent that these rate announcements are commensurate with changing supply
and demand conditions, they are simply precursors to independent price increases that
would have occurred anyway. However, to the extent that the rate announcements are
attempts by the conference to raise price above the competitive level, the magnitude
of their impact will depend largely on the mechanisms available to implement and
police the announced rates.
14. Firms can coordinate to raise prices above competitive levels through either explicit
collusion or through a form of behavior commonly called “tacit collusion,”
“conscious parallelism,” or “oligopolistic rationality.” In both tacit and explicit
collusion, successful coordination is characterized by firms' ability to agree on terms
of collusion, to monitor members’ compliance with the terms of the collusive
agreement, and to punish firms that deviate from the collusive agreement.22
15. In this section, we describe the mechanisms that have been known to facilitate and
hinder coordination. We also discuss the apparent asymmetry between conference
22 Phillip E. Areeda, et al., Antitrust Law: An Analysis of Antitrust Principles and Their Application, 1995,
Vol. IIA, ¶ 405.
7

and non-conference carriers. Finally, we describe aspects of the marketplace that
suggest that the FEFC may not be able to implement and police coordinated behavior.
A. COORDINATION TO AVOID COMPETITION 16. It is a well-known proposition in economics that firms have an incentive to coordinate
their behavior to avoid competition. An equally well-known proposition is that in the
face of a collusive agreement, firms have an incentive to cheat.
17. Factors that are known to facilitate collusion include: (1) the existence of mechanisms
to monitor and enforce adherence to an announced pricing scheme; (2) the ability to
punish deviations from the collusive agreement, including the extent to which the
same firms repeatedly encounter each other over time or in multiple markets;23 and
(3) the ability to backlog orders or maintain inventories. The first of these is required
to detect cheating. Absent detection and the associated threat of punishment, there
exists a strong incentive for at least some firms to unilaterally deviate from a collusive
agreement and undercut the agreed upon pricing scheme. Repeated interaction, either
over time or in multiple geographic markets, can provide opportunities to punish
cheaters, thereby raising the implicit cost of cheating from a collusive agreement. For
example, when it is detected that a firm has cheated in one geographic market, other
firms can retaliate and punish the cheating firm in any one or all of the markets in
which they interact. Thus, the possibility of retaliation in many markets can reduce
the incentives to “cheat” in any one market. The ability to backlog orders or maintain
inventories allows firms to adjust to unexpected fluctuations in market conditions.
23 B. Douglas Bernheim and Michael D. Whinston, “Multimarket Contact and Collusive Behavior,” RAND
Journal of Economics, Vol. 21, No. 1, Spring 1990.
8

Absent this ability, firms may have to raise or lower prices (thus deviating from their
collusive agreement) in order to clear the market.
18. Factors that are known to hinder implementation of a collusive agreement include: (1)
large number of sellers; (2) ease of entry; (3) the use of confidential contracts or rate
agreements between buyers and sellers; (4) infrequent or lumpy orders; and (5)
fluctuating market conditions. The first of these is intended to capture the scope of
the coordination problem. While there is no single number for all circumstances,
textbook wisdom suggests that collusion becomes unwieldy to implement as the
number of firms “exceeds 10 or 12.”24 Ease of entry can erode any potential gains
from raising prices above competitive levels. The use of confidential contracts and
fluctuating market conditions impede detection of deviations from the collusive
agreement. In addition, infrequent or lumpy demand can raise the incentive to cheat.
B. CONFERENCE VERSUS NON-CONFERENCE MEMBERS 19. FEFC member carriers handle approximately 60 percent of the trade between North
Europe and Asia, while non-conference carriers handle the remaining 40 percent.25
As a general rule, economic theory predicts that similarly situated non-conference
carriers will mimic conference prices. This symmetry should hold regardless of
whether the conference’s principal function is to process and relay information about
market fundamentals or to coordinate member firms in raising price above
competitive levels. To the extent that non-conference and conference carriers
24 F.M. Scherer, Industrial Market Structure and Economic Performance, Hopewell, NJ: Houghton Mifflin
Company, 2nd edition, p. 199.
25 Based on estimates of non-FEFC capacity, in Rod Riseborough, Chief Executive Officer of the FEFC Secretariat to the FEFC Principals, “Non-Conference Vessel Capacity”, December 17, 2003.
9

compete for the same shippers on the same routes, they should respond in the same
way to information about market fundamentals. Similarly, if the conference succeeds
in enforcing an increase in price above the competitive levels, then non-conference
carriers would find it in their interest to match this price increase.26 Therefore,
systematic differences in conference and non-conference prices, if any, must be
explained by underlying differences in service quality or composition of demand.
C. ABILITY OF THE FEFC MEMBERS TO SUSTAIN COLLUSION 20. As explained above, the operation of the FEFC conference secretariat has changed
dramatically over time. Over the last several years, the FEFC has reduced
dramatically in both size and scope. While conference carriers regularly convene to
discuss prices, the use of confidential rate agreements between shippers and carriers
has become the prevalent practice in the North Europe-Asia trade. Further the FEFC
does not – indeed, cannot – police its members’ relationships with shippers to
determine or enforce compliance with its conference rate and/or announced prices.
Thus, it is unclear whether the FEFC as it currently functions is able to sustain prices
above competitive levels.
21. A number of factors are likely to hinder the FEFC’s ability to sustain its conference
rates. The trade is served by a large number of carriers. Barriers to entry are
26 An industry that has both a cartel and non-cartel firms might be characterized by the “dominant firm-
competitive fringe” model. In this case, the cartel is a dominant firm and the competitive fringe firms are price takers, taking as given the price set by the cartel. (See Dennis Carlton and Jeffrey Perloff, Modern Industrial Organization, New York: HarperCollins College, 2nd edition, p. 200.) To the extent that some of the fringe are large firms able to influence the market, they will best respond to prices set by the cartel. In this case, the fringe firms will still prefer to match the cartel price.
10

relatively low.27 The use of confidential rate agreements between shippers and
carriers is prevalent. Demand for scheduled service can be infrequent and lumpy.
Market conditions have been known to fluctuate over time, and there is little ability to
backlog or inventory.
22. On the other hand, the carriers have multi-market contact – across different routes
within the same trade, across different trades, and over time. To the extent that multi-
contact improves carriers’ ability to punish deviators, it can facilitate collusive
arrangements. Further, even though rate agreements are confidential and the FEFC
does not itself engage in policing, it may be possible for the carriers to monitor each
other’s activity in other, more creative ways. For example, lines within a consortia
have information on the volume of business handled by each other.28
23. In practice, whether the FEFC or its member carriers are engaging in coordinated
behavior to raise prices above competitive levels is an empirical question. In the
remainder of this report, we describe our empirical framework and results of our
analysis of historical data on conference activity and market prices.
IV. EMPIRICAL FRAMEWORK
24. We employ regression analysis to study the effect of FEFC activity on price levels.
Regression analysis is a useful way of understanding the relationship between a
variable of interest – the average price of containerized cargo movement, in this case
– and a set of independent variables that play a role in its determination. Our basic 27 Expansion by an existing carrier entails acquiring additional capacity. We understand that de novo entry
requires capital up to 800 million Euros. Assuming that capital markets function properly, it is difficult to imagine significant barriers to entry.
1128 It is unclear whether on most trades these consortia are of a size that would facilitate collusion.

empirical model relates the average price of containerized cargo movement, defined
as revenue per TEU, to both a set of demand and supply factors that we understand
are widely believed to be important determinants of prices and measures of FEFC
presence. Controlling for observable determinants of market prices, we can use the
model to infer the impact, if any, of FEFC activity.
25. Given the substantial difference in “excess capacity” between westbound and
eastbound movements, we estimate the effects of FEFC activity on price levels
separately for the two directions. Ideally, the FEFC variables should include an
indicator for whether the carrier is a member of the FEFC, a measure of FEFC share
of capacity or volume, and FEFC rate increase announcements. A key demand factor
is the total demand for containerized cargo in the Far East trade. Key supply factors
are the price of fuel and the availability of capacity. Specifically, the model takes the
form:
ijt
tt
jtR
εββββ
ββββ
ββββ
+++++
++++
+++=
j11t10t92t8
7t654
jt32it10ijt
ControlsPair -Port Trends Time Rate ExchangeCapacity
CapacityPrice FuelDemand t Annoucemen Rate FEFC * Membership FEFC
tAnnoucemen Rate FEFCShare FEFCMembership FEFCTeuPer ev
where i indexes the carrier; j indexes the port-pair; and t indexes the time period. εijt
is a stochastic disturbance term, common to regression models, that captures the net
effect of all factors omitted from the empirical specification.
26. FEFC Membership varies by carrier and time.29 FEFC Share of volume or capacity
and FEFC Rate Announcement vary by port-pair and time. The interaction term,
between FEFC Membership and FEFC Rate Announcement, allows FEFC members 29 While in principle FEFC Membership can vary over time, the carriers in our analysis sample have not
changed their membership status over the years for which we have data.
12

to have a differential response from the non-members to the suggested rate increase.
In principle, this model allows us to investigate whether FEFC membership affects
the rate that a line charges; whether FEFC concentration affects all rates on a route;
and whether rate announcements represent information about expected
supply/demand conditions. A technical requirement of the analysis is variation in
conference presence either over time or on different port-pairs, for a given point in
time. We expect our variation to stem from varying degrees of conference presence
across the different port-pairs in our analysis sample.30
27. Measures of Demand, Fuel Price, Capacity, and Capacity Squared vary by time.
Demand and Fuel Price can include either contemporaneous or lagged values,
depending on the structure of the industry. If shipping rates at time t are determined
in a previous period, say t-1, then the information available in the previous period
may explain the average revenues in period t. In principle, revenue per TEU should
be increasing in both demand and fuel price. We expect that as capacity increases,
average revenue decreases, though it is unclear apriori whether this is likely to occur
at an increasing or decreasing rate. Thus, Capacity is allowed to enter as a quadratic;
that is, we include both the level and the squared term, to permit a more flexible
functional form with average revenue.
28. Exchange Rates are used to control for potential effects of currency fluctuations that
may affect the dependent variable, which is reported in USD in the proprietary data.
Time Trends include a set of indicator variables controlling for movements from year
30 According to 2003 FEFC capacity shares, conference share of capacity varies from 50 to 100 percent on the
different port-pairs in our analysis sample.
13

to year that are not otherwise captured by the other regressors discussed above. Port-
Pair Controls include a set of indicator variables controlling for the port-pair involved
in the movement. These variables control for differences in loading/unloading
technology, inland transportation, and regulations that are port or port-pair specific.
V. DATA USED FOR ANALYSIS
29. We have assembled an analysis dataset of containerized cargo movements in the
North Europe-Asia trade on both the eastbound and westbound legs. We use a
combination of proprietary and publicly available data to construct this dataset. The
proprietary data come from four FEFC conference and two non-conference
members.31 These data, which are summarized in Table 1, contain information on
revenues and total volume, measured in TEUs, for the years 2000-2003.32 We
construct revenue per TEU by dividing revenue by volume. Table 1 also presents the
variables contained in the carrier-provided data files. Based on communication with
carriers, our analysis assumes that revenues are sea only revenues and do not includes
revenues for other ancillary services such as inland transportation.
30. The proprietary data vary by month for four of the six carriers and by quarter for the
other two. The demand, fuel price, and capacity data – which are described in more
detail below – are available quarterly. Thus, our analysis dataset is quarterly, where
the monthly proprietary data are aggregated appropriately. 31 These data were collected in response to our information request submitted to the ELAA via outside
counsel. We understand that this request was sent to all ELAA member carriers, and the carriers who responded represent a random selection of ELAA members. We analyze data from Evergreen, HLCL, Hanjin, MSK, NYK, and PON (see Table 2). We also received data from MOL and CP Ships, but for different reasons these data were incompatible for use in our study.
32 The proprietary data are available from 1999-2003, but due to data limitations on aggregate demand and capacity, our analysis data begins in 2000.
14

31. The analysis data includes a total of 60 different port-pair combinations, with six ports
in Europe and five ports in Asia.33 Table 2 shows the different port-pair combinations
along with average revenues, 2003 FEFC market share, and carriers serving those
port-pairs. The final analysis data set contains 2,147 complete westbound records and
1,909 complete eastbound records of quarterly data for specific carrier and port-pair
combinations. Table 3 presents summary statistics (means and standard deviations)
for the variables of interest, separately for eastbound and westbound. The table also
presents summary statistics for the full sample (2000 to 2003) as well as for the
reduced sample looking only at 2003.
32. The remainder of this section describes the construction of the FEFC, demand, fuel
price, capacity, and exchange rate variables. We highlight concerns or limitations of
the data in the discussion.
A. FEFC MEMBERSHIP 33. We collected information on FEFC membership since 2000 from the FEFC website.34
While FEFC membership has fluctuated over time, the six carriers for which we have
proprietary data have not changed their member status. Thus, we are unable to
separately estimate carrier-specific effects from FEFC membership effects.35
33 The ports in Europe include: Hamburg, Antwerp, Bremerhaven, Felixstowe, Rotterdam, and Southampton.
The ports in Asia include: Hong Kong, Shanghai, Pusan, Yokohama/Tokyo/Kobe, and Yantian/Shekou. The port groupings (e.g. Yokohama/Tokyo/Kobe) reflect the aggregation present in the carrier data.
34 http://www.fareasternfreightconference.com.
35 In this case, the inclusion of both carrier-specific indicator variables and the FEFC membership indicator variable would result in a serious misspecification of the regression model. Specifically, the two sets of variables would be perfectly collinear.
15

B. FEFC RATE ANNOUNCEMENTS 34. We collected information about the FEFC rate restoration program from three
separate data sources: Drewry Shipping Consultants (“Drewry”), the FEFC website,36
and files received from the FEFC. Drewry publishes conference rate increases and
surcharge announcements.37 The announcements are also archived on the FEFC
website. Upon compiling the available information, we found the three sources to be
generally compatible, yet there were instances where one source contained more
announcements than the others. Thus, we collected all unique announcements across
the three sources.
35. The westbound rate announcements appear separately for 20-foot and 40-foot boxes,
and the 40-foot increases are systematically twice their 20-foot counterpart. As such,
the rate increase on a per TEU basis is the same, regardless of box size. The
eastbound rate announcements, however, appear to be the same for both the 20- and
40-foot boxes. We compute the rate increase on a per TEU basis assuming an equal
number of 20 and 40- foot boxes.
36. We calculate a “suggested conference rate” as the sum of the announced rate increase
and the average FEFC market rate during the month prior to the effective date of the
desired increase. For example, announcements of 200 USD in April and 150 USD in
June indicate that the conference suggested rate for period from April 1 to May 31
would be 200 USD higher than the average FEFC carrier rate in March, while the
suggested rate from June 1 onward would be 150 USD higher than the average FEFC
36 http://www.fareasternfreightconference.com/Press_and_Notices
37 Drewry Shipping Consultants, “The Drewry Container Market Quarterly”, various issues.
16

carrier rate in May. Figure 1 illustrates average monthly FEFC rate along with our
calculated suggested conference rate.
37. We constructed a quarterly suggested conference rate variable as the value during the
middle month of each quarter. For example, we use the February rate for the first
quarter of a given year.
C. FEFC CAPACITY SHARE 38. We obtained information on non-conference capacity serving the trade from a
confidential memo titled “Non-Conference Vessel Capacity.”38 The memo provides
estimates of non-conference carrier capacity on specific routes serving the trade.
Using the information from the March issue of Drewry’s “Container Market
Quarterly” on ports visited on each route and total nominal capacity on the route39, we
constructed conference capacity share for each port-pair.
39. A serious limitation of these data is that they are only available for 2003. As such,
when we include FEFC capacity share in the regression specification, we are limited
to a 2003 only sample. This is particularly limiting because most of our key
regressors, including demand, fuel price, and capacity, are only available at the
quarterly level.
D. AGGREGATE DEMAND 40. We employ two alternative measures of aggregate demand. The first is an estimate of
total TEUs shipped by route, separately for the eastbound and westbound legs, from
38 Rod Riseborough, Chief Executive Officer of the FEFC Secretariat to the FEFC Principals, “Non-
Conference Vessel Capacity”, December 17, 2003.
39 The table detailing this information is dated January 1, 2004 making it contemporaneous with the nonconference capacity data.
17

Drewry.40 Prior to 2000, Drewry reported this information twice a year; since 2000,
the information is available quarterly. (This same limitation applies to our data for
aggregate capacity.) Thus, our analysis sample begins in the year 2000, even though
our proprietary data are available going back to 1999.
41. Second, we measure aggregate demand using the growth in imports of key consumer
goods that account for the majority of containerized cargo. We understand that these
goods are electronics and paper goods, on the westbound and eastbound legs,
respectively.
42. On the westbound leg, we construct quarterly growth in the volume (measured in
USD) of consumer electronics41 imported to North Europe 42 from the Far East, using
trade data from a proprietary database known as TradStat.43 Similarly, on the
eastbound leg, we construct quarterly growth in the volume (measured in USD) of
paper goods imported to China, Hong Kong, Japan, and Korea, from North Europe.44
E. EXCHANGE RATES 43. In our westbound model, we use the average over the quarter of the daily Euro-USD
exchange rate. Similarly, in our eastbound model, we use a set of exchange rates one
40 Drewry Shipping Consultants, “The Drewry Container Market Quarterly”, March 2004, p. 102. 41 Consumer electronics includes goods such as domestic appliances and home entertainment equipment. 42 We define North Europe as Belgium, Denmark, Finland, Germany, Norway, Sweden, and the United
Kingdom. Data for the Netherlands are not available. 43 These data are obtained from Thompson Dialog’s TradStat database (http://www.tradstatweb.com). 44 This includes all origin countries in Europe with the exception of Belgium, due to the fact that the data for
Belgium are incomplete.
18

for each of the Far East countries in our analysis. These data are obtained from the
U.S. Federal Reserve.45
F. AGGREGATE CAPACITY 44. We obtained information on aggregate capacity, in 1000 TEUs, by route from
Drewry.46 As described above, these data are available quarterly as of 2000.
G. SINGAPORE DIESEL SPOT PRICE 45. To control for supply costs, we included a fuel price variable – the diesel spot price in
Singapore, measured in USD per metric ton47. We use the average over the quarter of
the midpoint between the daily high and low prices.
VI. REGRESSION ANALYSIS OF PRICE LEVELS
46. Using the method of ordinary least squares (OLS), we have estimated the parameters
of the base specification described above, and we have performed a series of
specification tests to determine the set of relevant variables and their functional form
that have resulted in extensions of the base model. Results for the full sample, 2000
to 2003, are presented in Tables 4A and 4B. Results for the 2003 only sample are
presented in Table 5. For each table, extensions are presented across the columns.
We discuss each specification in turn.
A. BASE SPECIFICATION, 2000-2003 SAMPLE 47. The estimation results for the full sample, 2000-2003, are presented in Tables 4A and
4B, for the westbound and eastbound legs, respectively. The regressors in the base
45 http://www.federalreserve.gov/releases/h10/Hist/
46 Drewry Shipping Consultants, “The Drewry Container Market Quarterly”, March 2004, p. 102.
47 Platt's Bunkerwire, Platt's Energy Prices, DRI-WEFA Webstract.
19

specification along with their expected signs (to the extent economic theory alone can
predict) are as follows:
• FEFC membership. The coefficient on this variable represents the price
differential charged by FEFC members, all else held equal.48
• Suggested Conference Rate. This variable shows the correlation, if any, of
suggested conference rate with average revenue. A finding of positive correlation
may indicate either that the FEFC is successful at elevating price above
competitive levels or that the FEFC is simply transmitting information about
expected market outlook, or both.
• FEFC membership interacted with suggested conference rate. This variable
illustrates whether the suggested conference rates affect FEFC members’ rates
differently than those of non-FEFC members.
• Aggregate demand. Aggregate westbound demand is used in the westbound
specification and aggregate eastbound demand, in the eastbound specification.
This variable is expected to have a positive effect on rates.
• Aggregate capacity and aggregate capacity squared. We expect capacity to have
a negative effect on rates, although perhaps at a decreasing rate. Thus, we may
find a small but negative coefficient on the squared term.49
• Singapore diesel spot price. The fuel price is a principal component of variable
cost and is expected to be positively associated with average revenues.
48 As explained earlier, we are unable to estimate separate carrier specific effects.
49 Aggregate capacity rather than carrier specific capacity is used since there appears to be a good deal of capacity sharing, through shipping consortia as well as individually negotiated rentals of excess capacity on vessels.
20
• Exchange rate. This variable (or set of variables) is used to control for
fluctuations in the currency of the region receiving the containerized cargo. We
expect this variable to be positively correlated with average revenues – that is, all
else equal, westbound revenue per TEU expressed in USD will increase as the
Euro appreciates vis a vis the U.S. dollar.
• Year Indicator Variables. These variables are used to control for fluctuations in
price over time due to external factors such as inflation.
• Port-Pair Indicator Variables. These variables are used to account for port
specific costs such as port handling charges.
48. The estimation results for the westbound sample are presented in Column 1 of Table
4A. The regression specification has an adjusted R2 of 0.65.50 We find that the
coefficient of the FEFC indicator is positive and statistically significant, suggesting
that FEFC members charge on average 215 USD more per TEU than non-conference
members. This result is generally stable over the extensions considered (across
Columns 1 through 5 in Table 4A), though the level of the premium fluctuates
between 44 USD to 240 USD, depending on the specification. In addition, the
suggested conference rate has a positive and statistically significant effect on actual
realized rates. The interaction term between FEFC membership and the suggested
conference rate has a small, negative coefficient that is statistically significant,
suggesting that the FEFC members have a somewhat smaller response to
announcements.
21
50 Adjusted R2 is a widely used measure of goodness of fit that can range from 0 to 1, where 1 represents a perfect fit.

49. Aggregate demand and capacity have the wrong sign, though the former is not
statistically significant. By contrast, the fuel price and the U.S. dollar to Euro
exchange rate are statistically significant and have the expected signs.
50. The estimation results for the eastbound sample are presented in Column 1 of Table
4B. This regression has a much lower adjusted R2 and has estimated coefficients that
are less statistically significant. We believe this pattern is driven in large part by the
low utilization of eastbound capacity. Nonetheless, it is noteworthy that the FEFC
membership indicator is never statistically significant, while the FEFC suggested
conference rate is positive and statistically significant across Columns 1 through 3.
B. EXTENSIONS OF THE BASE SPECIFICATION 51. We have examined various extensions to the base specification and have found that
there are several important omitted variables in the original specification. These
extensions are presented in the Columns of 2 through 5 of Tables 4A and 4B. We
discuss each in turn.
52. The first extension involves replacing the aggregate demand regressor with an
alternative measure of demand for containerized cargo. The reason for this change is
the concern that total volume in TEUs may not be an exogenous regressor – that is, it
may itself be determined, at least in part, by the dependent variable. In situations
where a regressor is jointly determined with the dependent variable, the estimates
obtained from OLS are no longer reliable. Thus, we replace aggregate demand in the
westbound model with our measure of electronics import growth, and we replace
aggregate demand in the eastbound model with our measure of paper import growth.
Electronics growth is statistically significant and has the expected sign in all of the
22

westbound specifications.51 (See Columns 2 through 5 of Table 4A.) Paper growth is
not statistically significant and has the wrong sign in the eastbound regressions. (See
Columns 2 through 5 of Table 4B).
53. The second extension is to add as an additional regressor the aggregate demand in the
opposite direction. This is important because the effective average cost of the
westbound cargo falls when the vessel is also used in the eastbound direction. Thus,
competition on the westbound routes may generate a lower rate in the high-demand
direction when demand in the opposite direction increases. Similarly, as demand for
westbound capacity increases, the capacity imbalance grows and there is more
capacity chasing very little cargo on the eastbound route. Because of the low
marginal costs in liner shipping, we expect that as westbound demand increases, the
eastbound average revenue decreases. As expected, we find that demand in the
opposite direction is an important predictor of average revenue, although this variable
has the wrong sign in the westbound model. (See Column 3 of Table 4A.) Aggregate
demand in the opposite direction in the eastbound model has the expected sign and is
statistically significant. (See Columns 3 through 5 of Table 4B.)
54. The third extension is to consider a lag structure for demand and the fuel price. If
rates in this period were determined in a prior period – due to long-term contracts,
then lagged demand and lagged fuel prices may explain at least a portion of today’s
average revenues. Given that long-term contracts between shippers and carriers last
51 In place of growth in the volume (measured in USD) of consumer electronics, we have also estimated the
westbound model using growth in volume (measured in kilograms). Both specifications yield the same qualitative results.
23

between one and six months, a one quarter lag structure is likely to be appropriate.52
Thus, we add as additional regressors lagged demand in the opposite direction and
lagged fuel price. Lagged fuel price is statistically significant and has the expected
sign in the westbound model (See Column 4 of Table 4A.) The lagged fuel price is
statistically significant and has the expected sign in the eastbound model. (See
Column 4 of Table 4B.)
55. Finally, we investigate the effect of dropping the FEFC announcement variables on
the coefficients associated with the demand and supply factors included in the
regression specifications. If it is the case that the FEFC simply serves the function of
transmitting market information, then the FEFC announcements should be highly
correlated with the demand and supply factors, resulting in inflated standard errors.
Upon dropping the announcement variables, we find that the explanatory power of
other market factors increases. In the westbound model, lagged aggregate demand in
the opposite direction and contemporaneous fuel price, neither of which were
statistically significant in the fully specified model, gain significance. Aggregate
demand in the other direction now has the expected sign and is statistically
significant. (See Column 5 of Table 4A.)
56. This finding suggests strongly that the FEFC announcements reflect market
conditions and draw away the explanatory power of those demand variables.
52 In addition, an analysis done by CapAnalysis (found on the DG Competition website) shows that the BAF
surcharge for fuel dictated by the FEFC is highly correlated with a lag in fuel prices.
24

C. 2003 ONLY SAMPLE 57. A serious omission of the specifications shown in Tables 4A and 4B is a variable
measuring FEFC presence on the different routes. The FEFC suggested conference
rate, for example, is likely to have a more noticeable effect on routes that have
stronger conference presence. Typical measures of concentration include market
share of volume or market share of capacity. However, to construct this variable with
our analysis sample we require data on total volume or total capacity by route, by
quarter. We have data on total capacity by quarter for 2003 only. What is evident
from these data is that FEFC market share varies noticeably from route to route,
ranging from 100 percent on some routes down to about 50 percent on others.
58. Thus, we have re-estimated our base specification using the 2003 sample. See
Columns 1 and 5 of Table 5. Notable omissions from the specifications shown in
Table 5 are demand in the opposite direction, the lagged variables, capacity, and the
exchange rate – all of which were important explanatory variables in Tables 4A and
4B and all of which vary by the calendar quarter. The reason for these omissions is
that the 2003 sample, by construction, has only four quarters and thus, permits at most
three variables that vary by quarter.53
59. Nonetheless, we re-estimated our regression specification including FEFC capacity
share, instead of these demand and supply factors. The coefficient on the capacity
share variable can show whether routes with higher FEFC presence have higher
prices. However, this variable does not appear to have any explanatory power. We
53 We were unable to include three quarterly variables in our specification because of near singularity. Thus,
the specifications shown in Table 5 include only two quarterly variables: electronics or paper growth and fuel price.
25

expect that this is likely due to the lack of sufficient data and the resulting omission of
important explanatory variables.
D. FIRST DIFFERENCE MODEL 60. In addition to the extensions discussed above, we have also re-estimated the
parameters of our regression model using a method known as first-difference
estimation. First difference estimation involves regressing the one-quarter change in
the dependent variable on the one-quarter changes in the independent variables. This
transformation of the original regression model has two potential benefits. First,
differencing the model in this manner eliminates the potential influence of time-
invariant, route-specific factors that may otherwise be omitted from the regression
specification. Second, the first-differenced data series can have desirable statistical
properties even in instances where the original data series may not.54 A potential
disadvantage of first difference estimation is that the differencing eliminates much of
the meaningful variation from the data.55
61. Assuming that the underlying model is well-specified and that the data series exhibit
the necessary statistical properties, the estimation of the model in levels is preferred to
first difference estimation. However, serious differences between the first difference
and levels results are an indicator of specification error in the levels model. As such,
estimation of the first difference model is appropriately viewed as a specification test
of the validity of the underlying model.
54 Andrew Harvey, The Econometric Analysis of Time Series, Cambridge, MA: The MIT Press, 1990, p. 29. 55 As such, overall measures of fit from first differenced estimation tend to be much lower than the
corresponding measures of fit from estimation of the model in levels.
26

62. Tables 6 and 7 present our first difference analysis. Table 6 shows the means and the
standard deviations of the first differenced data used in the regression analysis. Table
7 presents the estimation results. As expected, the adjusted R2 decrease from
approximately 0.6 to 0.29 or 0.21 in the westbound specification, depending on
whether or not the conference announcement variable is included. A similar pattern is
found in the eastbound specification. As with the levels regressions, the eastbound
regression has a much lower adjusted R2 and has estimated coefficients that are
persistently insignificant. We believe this pattern is driven in large part by the low
utilization of eastbound capacity.
63. The first difference westbound regression results are generally compatible with the
levels results. As with the levels results, the suggested conference rate has a positive
and statistically significant effect on average revenue per TEU. In addition, demand,
demand in the other direction, lagged fuel prices, capacity, and the exchange rate have
the expected signs and statistically significant effects on the revenue per TEU. We
also find that fuel price and lagged demand in the opposite direction take on the
expected signs and are statistically significant upon dropping the suggested
conference rate variable. As with the levels model, this pattern of results suggests that
the suggested conference rate and the supply and demand factors are likely to be
highly correlated.
VII. CONCLUSIONS
64. Using an analysis dataset of containerized cargo movements in the North Europe-Asia
trade, we have attempted to estimate a model that explains movements in average
revenue across routes and over time. Our analysis suggests very clearly that demand,
27

demand in the opposite direction, fuel prices, lagged demand and fuel prices, capacity,
and exchange rates are important determinants of average revenues.
65. Our analysis also suggests that conference activity has some effect on market
outcomes. In particular, we find fairly consistently that FEFC members receive
higher rates on westbound routes, as compared to non-members. Though the
empirical analysis is unable to identify the reason for this higher price, economic
principles suggest that this premium is likely due to a quality differential. To see this,
suppose hypothetically that the conference is successful at raising price above
competitive levels, then one would expect that the non-members would follow suit
and raise their price to match that of the FEFC members. It cannot be the case,
therefore, that a price differential is evidence of conspiracy. Rather, it is more likely
that this price differential reflects a service differential. For example, if it were the
case that conference members tend to offer better in-land transportation, shippers
would be willing to pay higher sea prices to ship with conference carriers.
66. In addition, our results suggest that suggested conference rates reflect information on
market fundamentals. It is noteworthy that lagged aggregate demand in the opposite
direction and contemporaneous fuel price, neither of which were statistically
significant in the fully specified model, gain significance in the westbound
specification that drops the announcement variables. In addition, contemporaneous
aggregate demand in the other direction takes on the correct sign and is statistically
significant in that model. Finding that one set of variables becomes statistically
significant when another, potentially related set is omitted, is symptomatic of
multicollinearity – that is when two or more variables in a regression model contain
28

29
essentially the same information, perhaps in different forms. Thus, these findings
support the proposition that the FEFC’s suggested conference rates are commensurate
with changing supply and demand conditions.
67. Finally, we temper these conclusions with the important caveat that we are unable to
control adequately for conference market share – inclusion of which can potentially
alter the results discussed above. Our 2003 only analysis suffers from insufficient
data – as evidence by the general lack of statistical significance. We would require a
longer time series of capacity or total volumes by trade routes to address this concern.

Figure 1: Westbound Suggested Conference Rates
0
500
1000
1500
2000
2500
Jan-99 Jan-00 Jan-01 Jan-02 Jan-03 Jan-04
U.S
. Dol
lars
Average FEFC Revenue per TEU
Suggested Conference Rate
* For the purpose of illustration, this Figure omits data for cargo movements originating in Japan after December 2002, when the Japan-Europe trade came under the control of the Japan Europe Freight Conference.

THIS PAGE HAS BEEN REDACTED
Table 1Carrier Statistics (2000-2003)
Westbound Eastbound
CarrierFEFC
MemberVariables Used to Construct
Average Revenue
Average Revenue per TEU
Average Total TEU
Average Total
Revenue
Average Revenue per TEU
Average Total TEU
Average Total
Revenue
Evergreen No "Total Revenue"; "Total TEU"Hapag-Lloyd Container Linie (HLCL) Yes "TEU"; "Tot Rev (excl. OLF/DLF)"Hanjin No "Vol"; "Rev"Maersk SeaLand (MSK) Yes "REVENUE"; "TEU"Nippon Yusen Kaisha (NYK) Yes "Total Revenue"; "Total Teu"P & O Nedlloyd (PON) Yes "Sea revenue $US"; "Volume Teu"
Note:Averages are across port pair and quarter.

THIS PAGE HAS BEEN REDACTED
Table 2Port Pair Statistics
Port PairAverage Rev.
per TEU2003 FEFC
Capacity Share Carriers Serving
Antwerp-Hong Kong Evergreen, Hanjin, MSK, NYK, PONAntwerp-Pusan Evergreen, Hanjin, MSK, NYK, PONAntwerp-Shanghai Evergreen, Hanjin, MSK, NYK, PONAntwerp-Yokohama/Kobe/Tokyo Evergreen, Hanjin, MSK, PONAntwerp-Yantian/Shekou Evergreen, Hanjin, MSK, NYK, PONBremerhaven-Hong Kong HLCL, Hanjin, MSK, NYK, PONBremerhaven-Pusan HLCL, MSK, NYK, PONBremerhaven-Shanghai HLCL, MSK, NYK, PONBremerhaven-Yokohama/Kobe/Tokyo HLCL, Hanjin, MSK, PONBremerhaven-Yantian/Shekou MSK, PONFelixstowe-Hong Kong Hanjin, MSKFelixstowe-Pusan Hanjin, MSKFelixstowe-Shanghai Hanjin, MSKFelixstowe-Yokohama/Kobe/Tokyo Hanjin, MSKFelixstowe-Yantian/Shekou Hanjin, MSKHamburg-Hong Kong Evergreen, HLCL, Hanjin, MSK, NYK, PONHamburg-Pusan Evergreen, HLCL, Hanjin, MSK, NYK, PONHamburg-Shanghai Evergreen, HLCL, Hanjin, MSK, NYK, PONHamburg-Yokohama/Kobe/Tokyo Evergreen, HLCL, Hanjin, MSK, NYK, PONHamburg-Yantian/Shekou Evergreen, HLCL, Hanjin, MSK, NYK, PONHong Kong-Antwerp Evergreen, Hanjin, MSK, NYK, PONHong Kong-Bremerhaven Evergreen, HLCL, Hanjin, MSK, NYK, PONHong Kong-Felixstowe Evergreen, Hanjin, MSKHong Kong-Hamburg Evergreen, HLCL, Hanjin, MSK, NYK, PONHong Kong-Rotterdam Evergreen, HLCL, Hanjin, MSK, NYK, PONHong Kong-Southampton Evergreen, HLCL, NYK, PONPusan-Antwerp Evergreen, Hanjin, MSK, NYK, PONPusan-Bremerhaven Evergreen, HLCL, Hanjin, MSK, NYK, PONPusan-Felixstowe Evergreen, Hanjin, MSKPusan-Hamburg Evergreen, HLCL, Hanjin, MSK, NYK, PONPusan-Rotterdam Evergreen, HLCL, Hanjin, MSK, NYK, PONPusan-Southampton HLCL, Hanjin, NYK, PONRotterdam-Hong Kong Evergreen, HLCL, Hanjin, MSK, NYK, PONRotterdam-Pusan Evergreen, HLCL, Hanjin, MSK, NYK, PONRotterdam-Shanghai Evergreen, HLCL, Hanjin, MSK, NYK, PONRotterdam-Yokohama/Kobe/Tokyo Evergreen, HLCL, Hanjin, MSK, NYK, PONRotterdam-Yantian/Shekou Evergreen, HLCL, Hanjin, MSK, NYK, PONShanghai-Antwerp Evergreen, Hanjin, MSK, NYK, PONShanghai-Bremerhaven Evergreen, HLCL, Hanjin, MSK, NYK, PONShanghai-Felixstowe Evergreen, Hanjin, MSKShanghai-Hamburg Evergreen, HLCL, Hanjin, MSK, NYK, PONShanghai-Rotterdam Evergreen, HLCL, Hanjin, MSK, NYK, PONShanghai-Southampton Evergreen, HLCL, Hanjin, NYK, PONSouthampton-Hong Kong HLCL, NYK, PONSouthampton-Pusan HLCL, NYK, PONSouthampton-Shanghai HLCL, NYK, PONSouthampton-Yokohama/Kobe/Tokyo HLCL, NYK, PONSouthampton-Yantian/Shekou HLCL, NYK, PONYokohama/Kobe/Tokyo-Antwerp Evergreen, Hanjin, MSK, NYK, PONYokohama/Kobe/Tokyo-Bremerhaven Hanjin, MSK, NYK, PONYokohama/Kobe/Tokyo-Felixstowe Hanjin, MSKYokohama/Kobe/Tokyo-Hamburg Evergreen, HLCL, Hanjin, MSK, NYK, PONYokohama/Kobe/Tokyo-Rotterdam Evergreen, HLCL, Hanjin, MSK, NYK, PONYokohama/Kobe/Tokyo-Southampton HLCL, NYK, PONYantian/Shekou-Antwerp Evergreen, Hanjin, MSK, NYK, PONYantian/Shekou-Bremerhaven Evergreen, HLCL, Hanjin, MSK, NYK, PONYantian/Shekou-Felixstowe Evergreen, Hanjin, MSKYantian/Shekou-Hamburg Evergreen, HLCL, Hanjin, MSK, NYK, PONYantian/Shekou-Rotterdam Evergreen, HLCL, Hanjin, MSK, NYK, PONYantian/Shekou-Southampton Evergreen, HLCL, Hanjin, NYK, PON

Table 3Means and Standard Deviations (in Parentheses) of Quarterly Analysis Data
Westbound Eastbound
2000 - 2003 2003 2000 - 2003 2003
Revenue per TEU 1,365 1,525 647 657(301) (250) (263) (191)
FEFC Membership 62% 61% 71% 71%(0.49) (0.49) (0.45) (0.45)
Suggested Conference Rate 1,613 1,680 877 873(240) (135) (93) (86)
Aggregate Demand (000 TEU) 1,044 732(273) (55)
Growth Rate of Electronics Imports 10.04 12.99(27) (31)
Growth Rate of Paper Imports 2.53 1.71(13) (12)
Singapore Diesel Spot Price 226 240 226 239(30) (23) (30) (23)
FEFC Capacity Share 73% 71%(0.18) (0.17)
Aggregate Capacity (000 TEU) 1,264 1,023(109) (94)
Aggregate Capacity Squared 1,610,700 1,054,769(278,037) (193,013)
Euro Exchange Rate ($ / Euro) 0.97(0.10)
China Exchange Rate ($ / 1000 Yuan) 121(0.01)
Japan Exchange Rate ($ / 1000 Yen) 9(0.54)
Korea Exchange Rate ($ / 1000 Won) 0.82(0.05)
Observations 2,147 537 1,909 484Number of Liners 6 6 6 6Number of Port Pairs 30 30 30 30
Notes:1. Values for "Growth Rate of Electronics Imports" for Q1 2000 are missing because the volume data for Q4 1999 are not available. The reported figures for 2000-2003 are based on a sample size of 2,007.2. Values for "Growth Rate of Paper Imports" for Q1 2000 are missing because the volume data for Q4 1999 are not available. The reported figures for 2000-2003 are based on a sample size of 1,791.

Table 4ADependent Variable: Revenue per TEU (Westbound, 2000 to 2003)
(1) (2) (3) (4) (5)
214.763 239.869 237.502 236.702 44.450(3.99)** (4.41)** (4.40)** (4.39)** (5.14)**
0.742 0.691 0.796 0.686(19.96)** (18.13)** (18.47)** (12.03)**
-0.103 -0.122 -0.121 -0.120(3.12)** (3.64)** (3.62)** (3.61)**
-0.010(0.49)
0.993 1.043 1.096 0.894(4.19)** (4.43)** (4.66)** (3.68)**
1.182 1.213 -0.894(5.12)** (3.50)** (2.93)**
-0.078 -1.846(0.21) (5.32)**
1.163 0.448 -0.113 0.006 1.882(6.13)** (2.12)* (0.48) (0.02) (7.08)**
1.140 2.698(3.20)** (7.91)**
4.991 -4.971 -3.813 -12.318 -26.537(2.78)** (2.46)* (1.89) (3.31)** (7.31)**
-0.002 0.002 0.001 0.004 0.010(2.79)** (2.10)* (1.43) (3.11)** (7.37)**
1,268.957 1,140.168 893.567 377.350 1,068.402(8.65)** (7.64)** (5.73)** (0.96) (2.66)**
-4,747.812 2,873.754 1,525.288 7,527.693 18,985.449(3.66)** (1.96) (1.03) (2.95)** (7.78)**
Port Pair Indicators Included Included Included Included IncludedYear Indicators Included Included Included Included Included
Observations 2147 2007 2007 2007 2007Adjusted R2 0.65 0.67 0.67 0.67 0.65
Note:Absolute value of t statistics in parentheses (* significant at 5%; ** significant at 1%).
Constant
Euro Exchange Rate
Aggregate Capacity Squared
Aggregate Capacity
Lagged Singapore Diesel Spot Price
Singapore Diesel Spot Price
Lagged Aggregate Demand in Other Direction
Aggregage Demand in Other Direction
FEFC Membership
Growth Rate of Electronics Imports
Aggregate Demand
FEFC Membership * Suggested Conference Rate
Suggested Conference Rate

Table 4BDependent Variable: Revenue per TEU (Eastbound, 2000 to 2003)
(1) (2) (3) (4) (5)
144.005 145.311 147.766 150.940 8.331(1.42) (1.40) (1.43) (1.47) (0.70)
0.535 0.423 0.571 0.092(4.74)** (3.26)** (4.15)** -0.54
-0.155 -0.155 -0.158 -0.162(1.35) (1.33) (1.36) (1.40)
0.354(0.93)
-0.373 -0.597 -0.974 -0.928(0.69) (1.09) (1.68) (1.84)
-0.096 -0.078 -0.080(3.17)** (2.55)* (2.86)**
0.059 0.056(1.19) (1.22)
-0.305 0.150 -0.036 1.663 1.625(0.68) (0.43) (0.10) (3.43)** (3.74)**
2.646 2.597(4.79)** (5.52)**
12.063 -1.634 0.117 -43.689 -42.724(3.21)** (0.34) (0.02) (4.42)** (5.43)**
-0.006 0.000 0.000 0.020 0.020(3.31)** (0.21) (0.21) (4.34)** (5.32)**
-3,305.658 679.570 1,094.907 9,210.732 8,971.351(1.53) (0.41) (0.65) (3.39)** (3.87)**
283.331 125.710 166.627 -515.166 -499.436(4.01)** (1.75) (2.29)* (3.35)** (4.18)**
-576.282 477.611 856.819 4,591.890 4,515.236(0.85) (0.82) (1.44) (4.80)** (5.36)**
391,204.365 -82,123.695 -133,726.078 -1,089,179.635 -1,060,733.266(1.51) (0.41) (0.67) (3.35)** (3.82)**
Port Pair Indicators Included Included Included Included IncludedYear Indicators Included Included Included Included Included
Observations 1909 1791 1791 1791 1791Adjusted R2 0.34 0.35 0.35 0.36 0.36
Note:Absolute value of t statistics in parentheses (* significant at 5%; ** significant at 1%).
FEFC Membership
Suggested Conference Rate
FEFC Membership * Suggested Conference Rate
Aggregate Demand
Growth Rate of Paper Imports
Aggregage Demand in Other Direction
Lagged Aggregate Demand in Other Direction
Singapore Diesel Spot Price
Japan Exchange Rate
Korea Exchange Rate
Constant
Lagged Singapore Diesel Spot Price
Aggregate Capacity
Aggregate Capacity Squared
China Exchange Rate

Table 5Dependent Variable: Revenue per TEU (2003 Only)
Westbound Eastbound
(1) (2) (3) (4) (5) (6) (7) (8)
396.088 384.931 392.861 -16.418 59.005 59.859 59.663 29.694(1.87) (1.79) (1.82) (0.92) (0.37) (0.38) (0.37) (1.76)
0.488 0.495 0.494 0.146 0.149 0.148(3.79)** (3.76)** (3.76)** (0.72) (0.73) (0.73)
-0.243 -0.240 -0.244 -0.032 -0.035 -0.034(1.94) (1.88) (1.91) (0.18) (0.19) (0.19)
138.978 141.766 -8.320 -10.782(1.28) (1.29) (0.09) (0.11)
1.983 1.975 1.974 3.021(4.72)** (4.60)** (4.60)** (10.28)**
-0.517 -0.462 -0.466 -1.152(0.49) (0.44) (0.44) (1.87)
-1.039 -1.018 -1.025 -1.465 -1.535 -1.534 -1.535 -1.695(2.61)** (2.50)* (2.52)* (3.77)** (4.15)** (4.12)** (4.12)** (5.38)**
856.699 984.232 845.425 1,768.384 787.888 797.262 803.014 976.086(3.28)** (3.73)** (2.97)** (11.90)** (3.48)** (3.40)** (3.29)** (9.64)**
Port Pair Indicators Included IncludedIndividual Port Indicators Included Included Included Included Included Included
Observations 537 537 537 537 484 484 484 484Adjusted R2 0.43 0.4 0.4 0.39 0.34 0.33 0.33 0.33
Note:Absolute value of t statistics in parentheses (* significant at 5%; ** significant at 1%).
Growth Rate of Electronics Imports
Growth Rate of Paper Imports
Singapore Diesel Spot Price
Constant
FEFC Membership
Suggested Conference Rate
FEFC Membership * Suggested Conference Rate
FEFC Capacity Share

Table 6Means and Standard Deviations (in Parentheses) of First-Differenced Data
Westbound (2000 - 2003)
Eastbound (2000 - 2003)
Change in Revenue per TEU 10 -5(184) (173)
Change in Suggested Conference Rate 10 -1(151) (111)
Change in Growth Rate of Electronics Imports 3.64(42)
Change in Growth Rate of Paper Imports -1.18(18)
Change in Aggregate Demand in Other Direction (000 TEU) 9 16(33) (374)
Change in Singapore Diesel Spot Price 2 2(35) (35)
Change in Aggregate Capacity (000 TEU) 26 23(33) (30)
Change in Aggregate Capacity Squared 69,070 48,246(88,552) (65,156)
Change in Euro Exchange Rate ($ / Euro) 0.02(0.04)
Change in China Exchange Rate ($ / 1000 Yuan) 0.00(0.01)
Change in Japan Exchange Rate ($ / 1000 Yen) -0.01(0.36)
Change in Korea Exchange Rate ($ / 1000 Won) 0.00(0.03)
Observations 1,808 1,639Number of Liners 6 6Number of Port Pairs 30 30
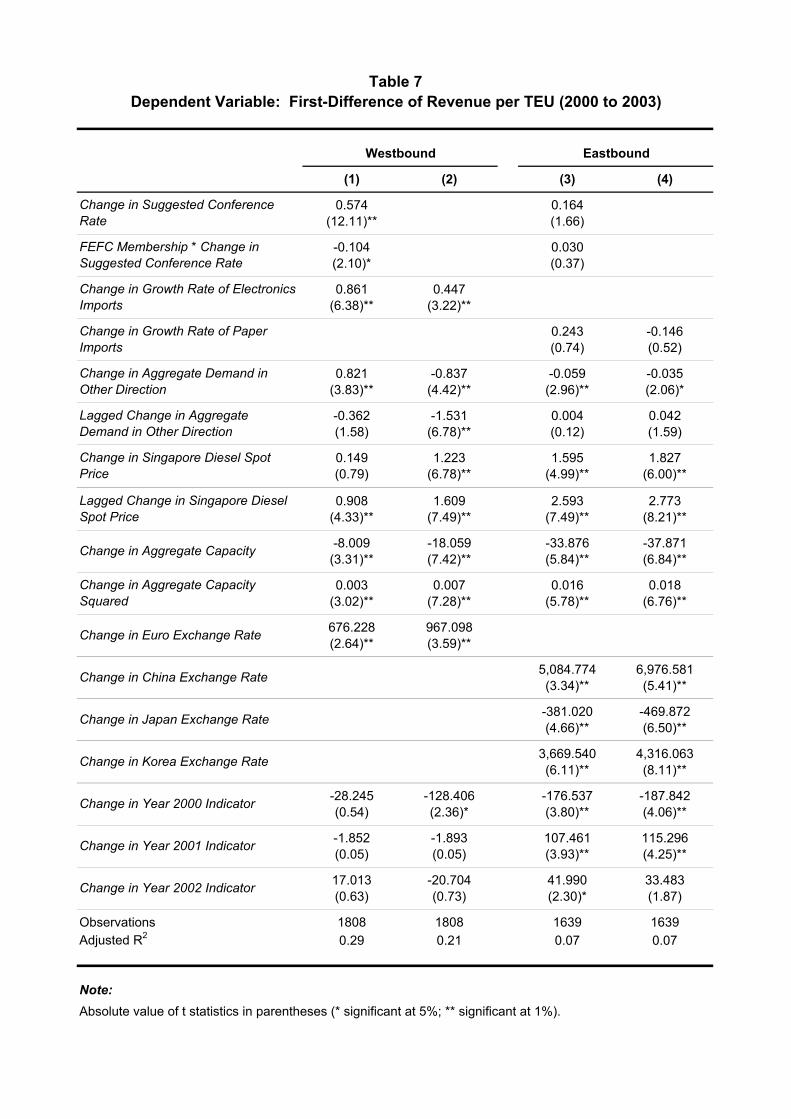
Table 7Dependent Variable: First-Difference of Revenue per TEU (2000 to 2003)
Westbound Eastbound
(1) (2) (3) (4)
0.574 0.164(12.11)** (1.66)
-0.104 0.030(2.10)* (0.37)
0.861 0.447(6.38)** (3.22)**
0.243 -0.146(0.74) (0.52)
0.821 -0.837 -0.059 -0.035(3.83)** (4.42)** (2.96)** (2.06)*
-0.362 -1.531 0.004 0.042(1.58) (6.78)** (0.12) (1.59)
0.149 1.223 1.595 1.827(0.79) (6.78)** (4.99)** (6.00)**
0.908 1.609 2.593 2.773(4.33)** (7.49)** (7.49)** (8.21)**
-8.009 -18.059 -33.876 -37.871(3.31)** (7.42)** (5.84)** (6.84)**
0.003 0.007 0.016 0.018(3.02)** (7.28)** (5.78)** (6.76)**
676.228 967.098(2.64)** (3.59)**
5,084.774 6,976.581(3.34)** (5.41)**
-381.020 -469.872(4.66)** (6.50)**
3,669.540 4,316.063(6.11)** (8.11)**
-28.245 -128.406 -176.537 -187.842(0.54) (2.36)* (3.80)** (4.06)**
-1.852 -1.893 107.461 115.296(0.05) (0.05) (3.93)** (4.25)**
17.013 -20.704 41.990 33.483(0.63) (0.73) (2.30)* (1.87)
Observations 1808 1808 1639 1639Adjusted R2 0.29 0.21 0.07 0.07
Note:Absolute value of t statistics in parentheses (* significant at 5%; ** significant at 1%).
Change in Year 2002 Indicator
Change in Year 2001 Indicator
Change in Year 2000 Indicator
Change in Korea Exchange Rate
Change in Japan Exchange Rate
Change in China Exchange Rate
Change in Euro Exchange Rate
Change in Growth Rate of Paper Imports
FEFC Membership * Change in Suggested Conference Rate
Change in Suggested Conference Rate
Change in Aggregate Capacity Squared
Change in Aggregate Capacity
Change in Growth Rate of Electronics Imports
Lagged Change in Singapore Diesel Spot Price
Change in Singapore Diesel Spot Price
Lagged Change in Aggregate Demand in Other Direction
Change in Aggregate Demand in Other Direction
![Round results Notices issued by Ofcom under Wireless ... · Airspan [REDACTED] 34 34 EE [REDACTED] 16 16 H3G [REDACTED] 46 46 Telefonica [REDACTED] 37 37 Vodafone [REDACTED] 40 40](https://img.pdfslide.us/doc/110x75/5ba4d8c509d3f257608be079/round-results-notices-issued-by-ofcom-under-wireless-airspan-redacted.jpg)
![From: [REDACTED] Sent: 05 July 2013 11:04 To: [REDACTED ...€¦ · From: [REDACTED] Sent: 05 July 2013 11:04 . To: [REDACTED] Cc: [REDACTED] Subject: FW: Ekwendeni Hospital Aids](https://img.pdfslide.us/doc/110x75/601c89910d63e778dd12db97/from-redacted-sent-05-july-2013-1104-to-redacted-from-redacted-sent.jpg)


![Round schedule Notices issued by Ofcom under … · Airspan [REDACTED] EE [REDACTED] H3G [REDACTED] Telefonica [REDACTED] Vodafone [REDACTED] Bidder Eligibility events available (start](https://img.pdfslide.us/doc/110x75/5ba4d8c509d3f257608be093/round-schedule-notices-issued-by-ofcom-under-airspan-redacted-ee-redacted.jpg)