Embed Size (px)
DESCRIPTION
Red Roadmaster Stock Talk featuring DIS, EK, FSLR, MA, MET, RDS-A
Citation preview
Red Roadmaster
STOCK TALK

Red Roadmaster

30th July, 2009 Contact
Paul A. Ebeling, [email protected]
Paul A. Ebeling, Jr. writes and publishes The Red Roadmaster's Technical Report on the US Major Market Indices, a weekly, highly-regarded financial market letter, read by opinion makers, business leaders and organizations around the world. Ebeling has studied the global financial and stock markets since 1984, following a success-ful business career that included investment banking, and market and business analysis. He is a spe-cialist in equities/commodities, and an accomplished chart reader who advises technicians with re-gard to Major Indices Resistance/Support Levels.

The Red Roadmaster’s US Market Re-cap + Stock Talk ™
July 30, 2009 US stocks retreated on Wednesday in this near term consolidation. Re-cap of the US Stock Market Action for 29 July 2009 + Stock Talk US stocks retreated on Wednesday in this near term consolidation.
The DJIA shed 26 pts, or 0.29%, to close at 9,070.72, the S&P 500 lost 4.47 pts, or 0.46% to close at 975.15, and the NAS closed minus 7.75 pts, or 0.39% at 1,967.76.
The three major US stock indexes gained 11% in the past two weeks as better than expected corporate earnings gave a second wind to a rally that drove the S&P 500 up 40% from a 12 yr closing low hit on March 9, 2009
For the second straight session health care stocks traded with strength while the broader market fell in range-bound trade.
Health care stocks outperformed the broader market for the entire session. They primarily benefited fromstrength in health care distributors (+4.9%), which followed better-than-expected earnings and an increased outlook from McKesson (MCK 52.01, +4.18).
Crude Oil futures fell US$3.88, or 5.8%, to settle at US$63.35 bbl after US government data showed a surprisingly large increase in crude inventories last week. The S&P Energy index dropped 2.1%.
Volume and Breadth: Trade was light on the NYSE, where about 1.25B/shrs changed hands, less than last year's estimated daily average of 1.49B/shrs, and the NAS, about 2.11B/shr shares traded, less than last year's daily average of 2.28B/shrs. Decliners outnumbered advancers on the NYSE by a ratio of about 3 to 2, and on the NAS, eight stocks fell for every five that rose.
Stocks to Watch Today
The Walt Disney Company (DIS), Eastman Kodak Co (EK), First Solar, Inc. (FSLR), MasterCard (MA), MetLife, Inc. (MET), and Royal Dutch Shell (RDS-A).

The Walt Disney Company (DIS) Up-date 6
July 30, 2009
Paul A. Ebeling, Jr. Analyst
Today let’s look at The Walt Disney Company (DIS), Mickey’s World, from a Technical POV. The overall indications, after Wednesday’s (July 29, 2009) market action, are Neutral: in the near term Neutral, mid-term Neutral, and long term Neutral. The recent Candle Stick analysis is: Neutral.
**Chart: http://www.stockta.com
Latest News: Disney Seeks Digital Magic http://www.forbes.com/2009/07/29/disney-earnings-preview-markets-equities-media.html?partner=yahootix
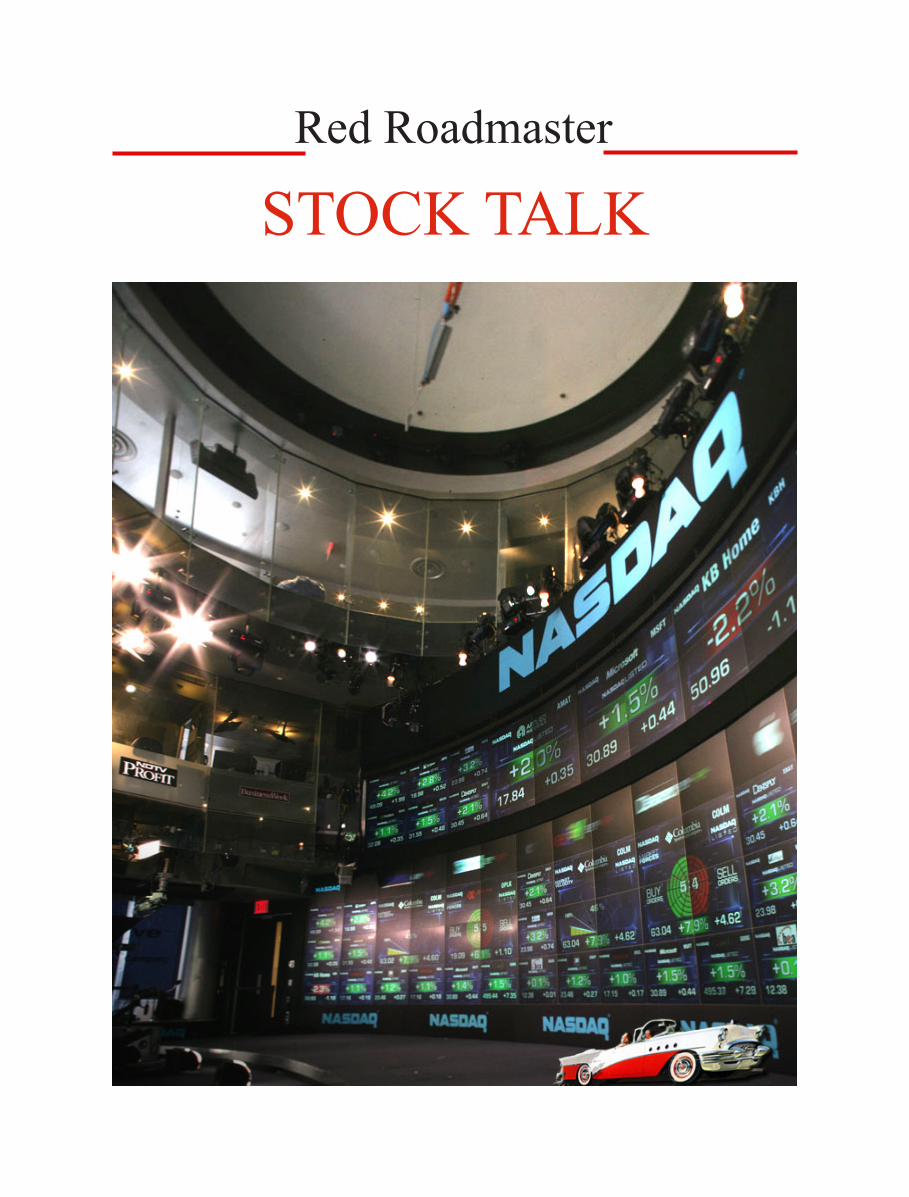
Thursday’s Market Action Close 25.89 - .48 Volume 11,834,700/shrs
There is an Bearish Harami on July 24, and two Gaps open up between July 15/16, 2009 at 23.21/24.36, support is 25.44, the near term resistance 25.94, and the 50 day exponential moving average at 23.97.
This is The Walt Disney Company: The King of the Magic Kingdom is a mouse, we all know him as Mickey. The Walt Disney Company is the world's #2 media conglomerate, # 1 is Time Warner (TWX) with assets encompassing movies, music, publishing, television, and theme parks. Disney’s TV holdings include the ABC TV network + 10 broadcast stations, and a portfolio of cable networks including ABC Family, A&E Television Networks (37%-owned), and ESPN (80%). Walt Disney Studios produces films through imprints; Walt Disney Pictures, Touchstone, Pixar, and Miramax. In addition, Walt Disney Parks and Resorts is one of the top theme park operators in the world, we all know them as Walt Disney World and Disneyland Resorts. Disney competitors are primarily in the Film & Video industry, DIS also competes in the Internet Content Providers, Music, and Publishing sectors, the competition is; CBS Corp, News Corp, and Time Warner.
The Competitive Landscape
In the motion picture production and distribution sector consumer spending drives demand. The profitability of individual companies depends on creativity, marketing, and distribution. Large companies have the advantages of long term contracts with key actors and directors, a permanent staff of technical employees, and wide distribution networks. Small companies compete by creating marketable movies, often for niche audiences, on low budgets. Although production work is labor-intensive, the value of the product results in high average annual industry revenue of $300,000 per employee.
The Walt Disney Company (HQ)
Robert A. Iger, President, CEO, and Director
500 S. Buena Vista St. Burbank, CA 91521-9722 United States Phone: 818-560-1000 Fax: 818-560-1930 http://disney.go.com/

EASTMAN KODAK CO (EK) Up-date 1
July 30, 2009
Paul A. Ebeling, Jr. Analyst
Today let’s look at Eastman Kodak Co (EK), the inventor of the Brownie camera (1900), from a Technical POV. The overall indications, after Wednesday’s (July 29, 2009) market action, are Bullish: in the near term Bullish, mid-term Bullish, and long term Bullish. The recent Candle Stick analysis is: Very Bearish.
**Chart by: http://www.stockta.com
Latest News: Earnings Preview: Eastman Kodak Co. http://seekingalpha.com/article/152152-earnings-preview-eastman-kodak-co?source=yahoo
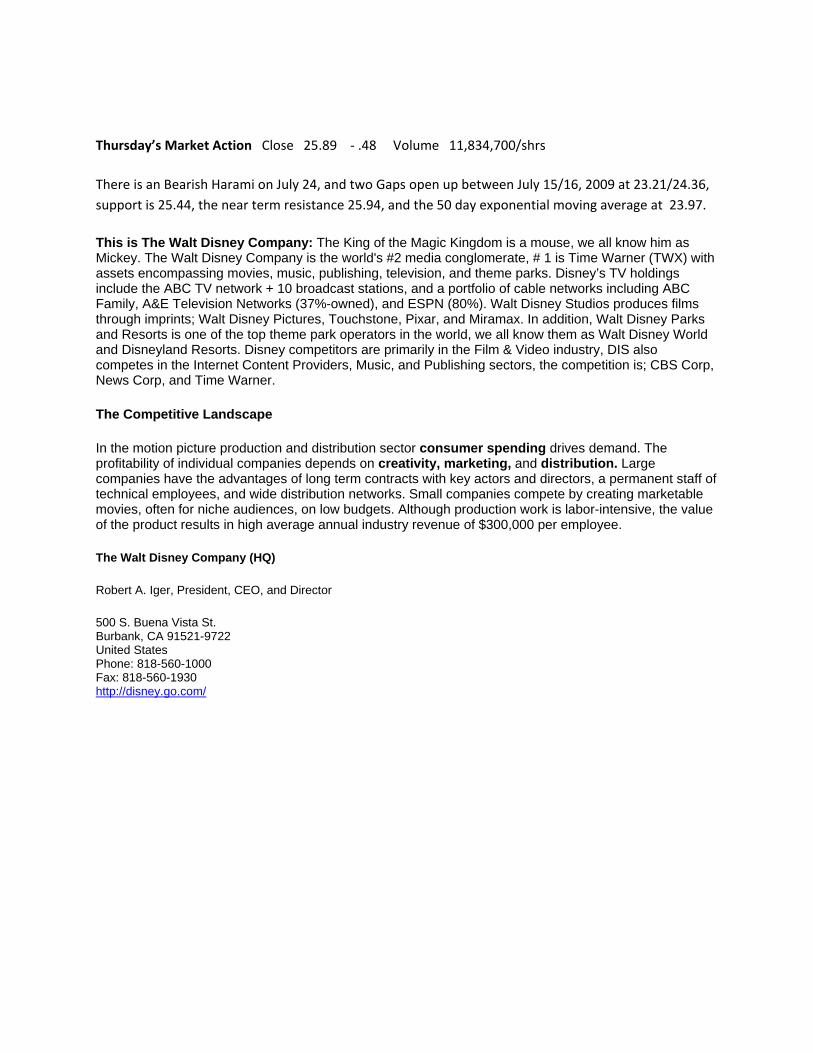
Wednesday’s Market Action Close 3.28 - .05 Volume 4,841,100/shrs
There is a Hammer on July 29 and one Gap open down on Apr 20, 2009 at 4.36/4.32, the near term resistance is 3.43, support at 3.11, and the 50 day (EMA) exponential moving average is 3.05.
This is Eastman Kodak Co (EK): The Company is the inventor of the Brownie camera (1900), Kodak has retouched its image from a top maker of photographic film to a provider of imaging technology products and services to the photographic and graphic communications markets. The firm has restructured itself to focus less on sales of film and more on sales of digital cameras and imaging systems. It operates through three business segments: Consumer Digital Group (CDG), Film Products Group (FPG), and Graphic Communications Group (GCG). Kodak's shift to become a digital technology business has involved purging some 30,000 employees, with additional plans to eliminate up to 18% of its workforce in 2009.
Competitive Landscape
Demand is tied to consumer and business income. The profitability of individual computer companies depends on purchasing and production efficiencies, and on technological expertise. Large companies have economies of scale in purchasing and production. Small companies can compete successfully by specializing in certain products or by developing superior technology. The industry is highly automated: annual revenue per employee is about US$400,000.
Computer Manufacture Industry Forecast The output of US computer manufacturing is forecast to grow at an annual compounded rate of 4% between 2008 and 2013. Data Sourced: December 2008
Eastman Kodak Co (EK)
Antonio M. Perez , Chairman, Chief Exec. Officer
343 State Street Rochester, NY 14650 United States Phone: 585-724-4000 Fax: 585-781-5400
http://www.kodak.com

First Solar, Inc. (FSLR) Up-date 2
July 30, 2009
Paul A. Ebeling, Jr. Analyst
Dear Reader,
Today let’s look at First Solar, Inc. (FSLR), the developer and maker of photovoltaic (PV) cells, from a Technical POV. The overall indications, after Wednesday’s (July 29, 2009) market action, are Neutral: in the near term Neutral, mid-term Neutral, and long term Neutral. The recent Candle Stick analysis is: Very Bearish
**Chart by: http://www.stockta.com
Latest News: Nil
Wednesday’s Market Action Close 167.99 + .09 Volume 3,124,000/shrs
There is a DOJI on July 28 and two Gaps open up between July 21/24, 2009 at 149.47/162.76, the near term resistance is 178.58, support at 165.87, and the 50 day (EMA) exponential moving average is 161.28.
This is First Solar, Inc. (FSLR): The Company designs, manufactures, and sells solar electric power modules using a proprietary thin film semiconductor technology. The company’s solar modules employ a thin layer of cadmium telluride semiconductor material to convert sunlight into electricity. It sells its products to project developers, system integrators, and operators of renewable energy projects primarily in Europe. First Solar also focuses on designing and deploying commercial solar projects for utilities in the United States. The company was founded in 1999. It was formerly known as First Solar Holdings, LLC, and changed its name to First Solar Holdings, Inc. and subsequently to First Solar, Inc. in 2006. The company is headquartered in Tempe, Arizona.
Industries Where First Solar Competes Electronics
Electrical Products
Power Generation & Storage (primary)
First Solar, Inc. (HQ)
Chairman and Chief Exec. Officer; Michael J. Ahearn
350 West Washington Street Suite 600 Tempe, AZ 85281-1244 United States Phone: 602-414-9300 Fax: 602-414-9400
http://www.firstsolar.com
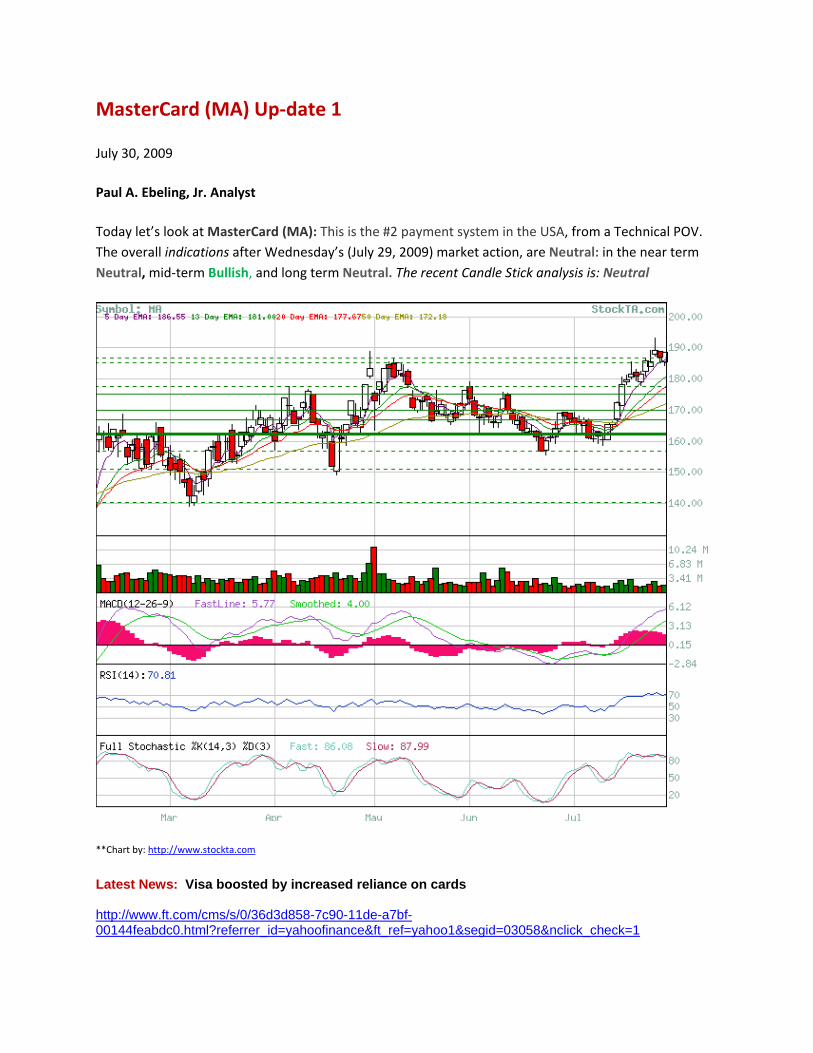
MasterCard (MA) Up-date 1
July 30, 2009
Paul A. Ebeling, Jr. Analyst
Today let’s look at MasterCard (MA): This is the #2 payment system in the USA, from a Technical POV. The overall indications after Wednesday’s (July 29, 2009) market action, are Neutral: in the near term Neutral, mid-term Bullish, and long term Neutral. The recent Candle Stick analysis is: Neutral
**Chart by: http://www.stockta.com
Latest News: Visa boosted by increased reliance on cards http://www.ft.com/cms/s/0/36d3d858-7c90-11de-a7bf-00144feabdc0.html?referrer_id=yahoofinance&ft_ref=yahoo1&segid=03058&nclick_check=1
Wednesday’s Market Action Close 188.55 + 1.61 Volume 1,807,500/shrs
There is an Inverted Hammer on July 24 and one Gap open up on July 15, 2009 at 166.22/166.70, the near term resistance is NIL, support at 186.69, and the 50 day (EMA) exponential moving average is 172.18.
This is MasterCard (MA): This is the #2 payment system in the US. The company does not issue credit or its namesake cards; rather, it markets the MasterCard (credit and debit cards) and Maestro (debit cards) brands, provides the transaction authorization network, establishes guidelines for use, and collects fees from members. The company provides services in more than 210 countries and territories; its cards are accepted at more than 25 million locations around the globe. MasterCard also operates the Cirrus ATM network.
Competitive Landscape
Demand is driven by consumer spending. The profitability of individual companies depends on efficient operations, as services are sold largely based on cost. Large companies have big economies of scale in processing and can provide more services; small companies can compete by specializing in industries and providing custom services. The business is highly automated and capital-intensive: average annual revenue per employee is about US$225,000.
Credit Card Processing Industry Forecast
The output of US credit card and finance companies is forecast to grow at an annual compounded rate of 1% between 2008 and 2013. Data Sourced: December 2008
Mastercard Incorporated (HQ)
Robert W. Selander, Chief Exec. Officer, Pres, Director,
2000 Purchase Street Purchase, NY 10577 United States - Map Phone: 914-249-2000 Fax: 914-249-4206
http://www.mastercard.com

MetLife, Inc. (MET) Up-date 2
July 30, 2009
Paul A. Ebeling, Jr. Analyst
Dear Reader,
Today, let’s look at MetLife, Inc. (MET), one of the USA’s largest insurers, from a Technical POV. The overall indications, after Wednesday’s (July 29, 2009) market action, are Neutral: in the near term Bearish, mid-term Bullish, and long term Bullish. The recent Candle Stick analysis is: Very Bearish
**Chart by: http://www.stockta.com
Latest News: Traders Buy Upside Option Calls in MetLife http://www.thestreet.com/_yahoo/story/10557780/1/traders-buy-upside-option-calls-in-metlife.html?cm_ven=YAHOO&cm_cat=FREE&cm_ite=NA

Wednesday’s Market Action Close 32.28 - .67 Volume 4,207,600/shrs
There a DOJI on July 29 and two Gap open up between Apr 2, and July 13, 2009 at 23.60/27.73, the near term resistance is 33.40, support at 31.74, and the 50 day (EMA) exponential moving average is 30.24. This is MetLife: Its first name stands for "metropolitan," but the company may be found in villages, towns, and huge cities coast-to-coast and then some. MetLife is one of the US's largest insurers; its flagship insurance subsidiary is Metropolitan Life Insurance Company. MetLife's Institutional segment offers group benefits products (life and disability insurance retirement products, prepaid legal plans); its Individual segment offers consumers many of the same types of products, while its International segment offers the same to groups and individuals in the Asia/Pacific region, Europe, and Latin America.
The Competitive Landscape
Demand is driven by demographics and commercial transactions. The profitability of individual companies depends on effective marketing and on the ability to accurately estimate future payments. Large companies have big economies of scale in administration and in access to capital. Small companies can compete successfully by specializing in particular products or industries.
Insurance Carriers Industry Forecast
The output of US insurance, which is an indicator for insurance carriers, is forecast to grow at an annual compounded rate of 4.6 % between 2008 and 2013.
MetLife, Inc. (HQ)
Chairman, President, and CEO C. Robert (Rob) Henrikson 200 Park Ave. New York, NY 10166-0188 United States Phone: 212-578-2211 Fax: 212-578-3320 Toll Free: 800-638-5433
http://www.metlife.com
MetLife Subsidiaries MetLife Life and Annuity Company of Connecticut Metropolitan Property and Casualty Insurance Company New England Life Insurance Company
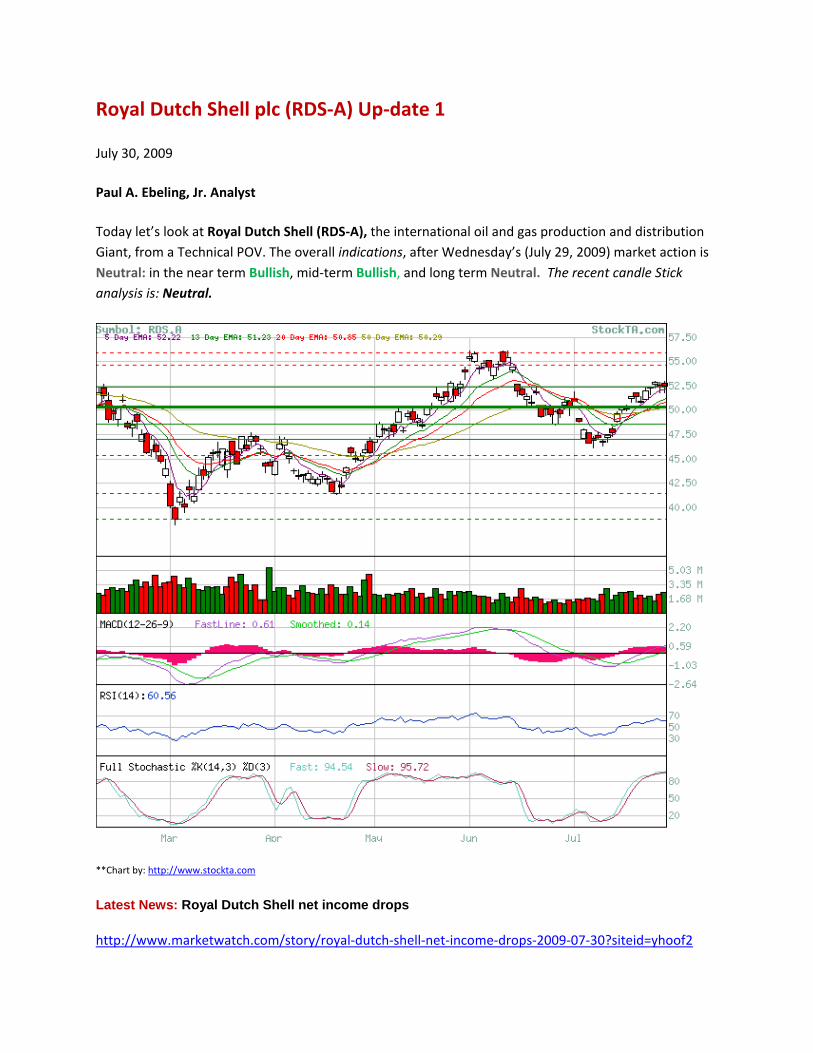
Royal Dutch Shell plc (RDS-A) Up-date 1
July 30, 2009
Paul A. Ebeling, Jr. Analyst
Today let’s look at Royal Dutch Shell (RDS-A), the international oil and gas production and distribution Giant, from a Technical POV. The overall indications, after Wednesday’s (July 29, 2009) market action is Neutral: in the near term Bullish, mid-term Bullish, and long term Neutral. The recent candle Stick analysis is: Neutral.
**Chart by: http://www.stockta.com
Latest News: Royal Dutch Shell net income drops
http://www.marketwatch.com/story/royal-dutch-shell-net-income-drops-2009-07-30?siteid=yhoof2
Wednesday’s Market Action Close 52.46 + .04 Volume 2,360,400/shrs
There is a Bearish DOJI Star on July 24, and two Gaps open up on Apr 24 and July 20, 2009 at 44.20/50.83, the near term resistance is 54.62, support at 52.39, and the 50 day (EMA) exponential moving average is 50.29.
This is Royal Dutch Shell (formerly Royal Dutch/Shell Group) (RDS-A): The Company sits on an oil and gas throne that is only slightly lower than that of #1 oil company Exxon Mobil. The company has worldwide proved reserves of 10.9 billion barrels of oil equivalent. Most of the oil giant's crude is produced in Nigeria, Oman, the UK, and the US. Royal Dutch Shell is also investing heavily in the Athabasca Oil Sands Project, which extracts bitumen from oil sands in Alberta and converts it to synthetic crude oil. It operates 45,000 gas stations, the world's largest retail fuel network. The company also produces refined products and chemicals, transports natural gas, trades gas and electricity, and develops renewable energy sources.
Competitive Landscape
Demand depends mainly on the volume of car driving, which in turn depends on economic activity. The profitability of individual stores is closely linked to location and product mix. Large companies have advantages in buying gasoline at bulk prices, but small companies can compete effectively by having superior locations. Annual revenue per worker is close to US$300,000.
Convenience Stores and Gas Stations Industry Forecast US personal consumption expenditures of gasoline, oil, nonalcoholic beverages, and tobacco, all major indicators for convenience stores and gas stations, are forecast to grow at an annual compounded rate of 2.4% between 2007 and 2012.
Royal Dutch Shell plc (HQ)
Carel van Bylandtlaan 30 The Hague, 2596 HR Netherlands Phone: 31 70 377 1365 Fax: 31 70 377 3953
http://www.shell.com
Royal Dutch Shell Subsidiaries Aera Energy LLC British Pipeline Agency Ltd. CRI Catalyst Co.
Disclaimer
DO NOT BASE ANY INVESTMENT DECISION UPON ANY MATERIALS FOUND ON THIS WEBSITE OR IN OUR NEWSLETTERS. Red Roadmaster is not registered as a securities broker-dealer or an investment advisor either within the US Securities and Exchange Commission (the “SEC”) or with any state securities regulatory authority. We are neither licensed nor qualified to provide investment advice.
The information contained on our website or in any of our newsletters should be viewed as commercial advertisement and is not intended to be investment advice. Any information found on our website, or in any of our newsletters is not provided to any particular individual with a view toward their individual circumstances. The information contained on our website, and in any newsletter we distribute, is not an offer to buy or sell securities. We distribute opinions, comments, and information free of charge exclusively to individuals who wish to receive them.
Our newsletter and website have been prepared for informational purposes only and are not intended to be used as a complete source of information on any particular company. An individual should never invest in the securities of any of the companies’ profiled based solely on information contained in our report. Individuals should assume that all information contained on our website or in one of our newsletters about profiled companies is not trustworthy unless verified by their own independent research.
Any individual who chooses to invest in any securities should do so with caution. Investing in securities is speculative and carries a high degree of risk; you may lose some or all of the money that is invested. Always research your own investments and consult with a registered investment adviser or licensed stock broker before investing.
Information contained in the Redroadmaster Stock Talk report will contain “forward looking statements” as defined under section 27A of the Securities Act of 1933 and Section 21B of the Securities Exchange Act of 1934. Subscribers are cautioned not to place undue reliance upon these forward looking statements. These forward looking statements are subject to a number of known and unknown risks and uncertainties outside of our control that could cause actual operations or results to differ materially from those anticipated. Factors that could affect performance include, but are not limited to, those factors that are discussed in each profiled company’s most recent reports or registration statements filed with the SEC. You should consider these factors in evaluating the forward looking statements included in the report and not place undue reliance upon such statements.
Red Roadmaster is committed to providing factual information on the companies that are profiled. However, we do not provide any assurance as to the accuracy or completeness of the information provided, including information regarding a profiled company’s plans or ability to effect any planned or proposed actions. We have no first-hand knowledge of any profiled company’s operations and therefore cannot comment on their capabilities, intent, resources, nor experience and we make no attempt to do so. Statistical information, dollar amounts, and market size data was provided by the subject company and related sources which we believe to be reliable.
To the fullest extent of the law, we will not be liable to any person or entity for the quality, accuracy, completeness, reliability, or timeliness of the information provided in this report, or for any direct, indirect, consequential, incidental, special or punitive damages that may arise out of the use of information we provide to any person or entity (including, but not limited to, lost profits, loss opportunities, trading losses, and damages that may result from any inaccuracy or incompleteness of this information). We encourage you to invest carefully and read investment information available at the websites of the SEC at http://www.sec.gov and FINRA at http://www.finra.org