Embed Size (px)
Citation preview

RED RELIEF IMAGE MAP1: NEW VISUALIZATION METHOD FOR THREE DIMENSIONAL DATA
Tatsuro CHIBA, Shin-ichi KANETA, Yusuke SUZUKI
Asia Air Survey Co., Ltd. 1-2-2 Manpukuji, Kawasaki, Japan (ta.chiba, sni.kaneta, ysk.suzuki)@ajiko.co.jp
KEY WORDS: LIDAR, Application, Visualization, DEM/DTM, Graphics, Representation ABSTRACT: The vast increase of the volume of three dimensional topographic data acquired by Airborne LIDAR extends the possibility of the visualization method. The maximum laser pulse frequency of modern LIDAR system has reached more than 250 kHz. In addition to such high reputation rate, multiple surveys over same area achieve 0.3 to 0.5 meters per point data resolution. High resolution three dimensional topographic data potentially holds useful information which can not be expressed by ordinal visualization method. In this study we propose Red Relief Image Map (RRIM). This new visualization method is based on multi-layered topographic information computed from gridded three dimensional data (DEM). RRIM can visualize the topographic slope, concavities and convexities at the same time. RRIM does not require the any specialty of geomatics nor mapping information to understand detail of topographic information to the image audience. The application of RRIM is not only LiDAR data but also wide variety three dimensional data such as SRTM, GTOPO30 and ETOPO2.
1 Protected by patent 3670274 in Japan and 285852 in Republic of China (Taiwan). Patent pending in U.S. and People's Republic of China.
1. INTRODUCTION
The resolution of three dimensional topographic data acquired by Airborne LIDAR is rapidly increasing due to hardware improvement mainly increasing of laser pulse reputation rate. The development of Airborne LIDAR goes back to the 1970s and 1980s, with an early NASA system (ATM, SLICER, RASCAL, SLA-01, SLA-02) and other attempts in USA and Canada (Ackermann, 1999). The early commercial system was laser profiler to generate a single line profile of the ground beneath an aircraft and in 1980s. But in 1990s the development of laser scanner and other technologies enabled to acquire a certain amount width along aircraft flight line. After those improvements, precise and high resolution three dimensional topographic data acquisition with airborne LIDAR becomes possible (Maune et al., 2007). And maximum laser pulse reputation rate of commercial airborne LIDAR becomes about 15 times in past 10 years (see Figure 1). The maximum resolution acquired by the state of the art commercial LIDAR system now reaches around 0.3 to 0.5 meters per point.
0
50
100
150
200
250
300
1997 1998 1999 2000 2001 2002 2003 2004 2005 2006 2007
Year
Las
er
Puls
e R
epu
tation R
ate (
kHz)
Figure 1. History of laser reputation frequency of commercial
Airborne LIDAR in past 10 years.
The detail topographic information which is included in such high resolution three dimensional data beyond the capability of ordinal visualization methods of plan view. In this study we propose Red Relief Image Map (RRIM) which extends the Openness parameter (Yokoyama et al., 2002) and slope gradient information as additional colour layer on it. This new visualization method efficiently expresses the topographic detail acquired by state of the art airborne LIDAR.
2. VISUALIZATION METHODS
Various kind of visualization method has been used for topographic information in many application areas, including environmental monitoring, development planning, disaster assessment, agriculture, and forestry. These methods may be broadly classified as follows (S.Ghosh el al., 2007),
Plan view Perspective view. Projecting an object into a view
plane and then mapping the plane onto display screen.
Stereoscopic view, based on binocular vision. Virtual reality, allowing a user to interact with
computer simulated environment. Rapid improvements of computer hardware and software enable interactive visualisation experience like above. Modern GIS user can chose various kind of visualisation method and adjust the processing parameters to retrieve maximum information from its original three dimensional topographic data interactively. At the same time, difficulty of access computers or limitation of display systems (field work, publication) require printed information especially plan view. Because a user can not adjust a view angle of perspective view and interact with computer in virtual reality system in such situation. Then the effective visualisation methods of two dimensional
1071

The International Archives of the Photogrammetry, Remote Sensing and Spatial Information Sciences. Vol. XXXVII. Part B2. Beijing 2008
plan view with high resolution topographic data still need improvement. In this section we select typical visualization method of plan view used as three dimensional topographic data. And evaluate each advantage and limitation. 2.1 Contour map
Contour map is conventional method and widely used for topographic map. This method represents elevation and topographic slope gradient at the same time. Slope gradient is represented by density of contour line then maximum value of expressible topographic slope is restricted by horizontal interval of contour line on the map. In contrast the interval of contour line becomes too wide on flat surface to represent fine structure of the area. Due to above shortcoming contour map is not appropriate method for steep topographic and fine detail of flat surface. The relation of horizontal interval of contour on the map and slope gradient represented as below,
1000tan
×Δ
=θs
hi (1)
Where i is horizontal interval of contour on the map (millimeters), Δh is vertical interval of contour in actual height (meters), s is the scale factor of the map, θ is the slope gradient respectively. Figure 2 represents the limitation of maximum slope gradient of contour map (scale is 1:25,000). In this figure each 4 line correspond vertical interval of contour in actual height (meters). Dotted line indicates the width of contour line (in this case we suppose 0.15 millimeters). Horizontal interval of contour on the map is narrowing in accordance with increase of slope gradient. In case of brown line (vertical interval is 10 meters), the limitation of slope gradient is about 70 degree. In steep hills its slope gradients more than 70 degrees, we can not distinguish each contour line any more with this scale of contour map (1:25,000). This limitation of slope gradient is getting stricter along with decrease of vertical interval of contour in actual height.
0.01
0.1
1
10
100
0 10 20 30 40 50 60 70 80 90
Topographic Sloop Gradient(degree)
Conto
ur
Inte
rval
on M
ap (
mm
)
50m
10m
5m
1m
Figure 2. Relation between contour interval on the map (scale is
1:25,000) and gradient of topographic sloop. Each lines show contour interval in actual height. Dotted line indicates the width
of contour line (0.15mm) on the map.
2.1 Colour level slice
Colour level slice is also referred to as colour contour which shows the elevation with the variety of colour gradation. This
method is useful for appropriate interpretation of topographic feature in wide area. But it is not suitable for displaying fine topographic structure. Because outlines of topographic features sometimes represented as quite similar colour difference. In left side of Figure 3 the border lines of red and yellow, yellow and green are relatively clear. But prominent topographic outline is located between light blue and green in this figure. Then the hill shape of this area is not clear with colour level slice. Right side of Figure 3 is exact same area and same data with RRIM. The detail of this method is described in section 3.
Figure 3. Comparison of colour level slice (upper) and RRIM (lower) for Tokyo, Japan. The DEM is Digital Map 5m Grid
(Elevation) , Geographical Survey Institute. 2.2 Shaded relief
Shaded relief is also popular visualization method for topographic data. It displays topographic features by simulated
shade which calculated using incident light direction and elevation data. The primary advantage of this method is
audience can understand the detail of topographic feature with intuitive manner. But shape and direction of shade depend on
direction of incident light. If you alternate the direction of light to opposite side then you will get completely upside down
impression to the convexity and concavity at all. Almost same visual effect will be appeared when viewing one shaded relief image with several audiences crowd around it. The impression
of convexity and concavity depends on the relative location between audience and the shaded image in question. And
sometimes small topographic structure may be obscured by part of shade itself. Four shaded relief images in
1072

The International Archives of the Photogrammetry, Remote Sensing and Spatial Information Sciences. Vol. XXXVII. Part B2. Beijing 2008
Figure 5 are example of visual effect of incident light direction. All four images computed from exactly same DEM but different incident light direction (red arrow). The impression of each image is deeply influenced by direction of incident light. Ridges of crater and valleys those are perpendicular to incident light direction displayed clearly. In contrast, visibility of topographic features parallel to incident light is poor. Best direction of incident light is different in each topographic feature in the entire image area. 2.3 Stereoscopic view
Stereoscopic view uses a pair of two dimensional images. Each image was taken from slightly different perspectives. The audience normally wears glasses that may have near complimentary colour filtered lenses, polarised lenses or lenses that occlude one eye sequentially in order to channel each of the
images in the stereo pair to their respective eyes (Ostnes et al., 2004). This method is widely used from aerial photogrammetry to 3D movie theatres. The disadvantage of this method requires additional device (see Figure 4) or stereopsis ability for its audience.
Figure 4. Stereoscopic glasses and monitor.
Figure 5. Incident light direction dependency in shaded relief (red arrows indicate incident light direction) for Kirishima mountains, Japan. The DEM is Digital Map 10m Grid (Elevation of Active Volcanos) , Geographical Survey Institute.
3. RED RELIEF IMAGE MAP (RRIM)
3.1 Openness parameter and its extension
The basic concept of RRIM is multiply of three landform element layers, topographic slope, positive openness and negative openness. Positive and negative openness were defined by Yokoyama et al. (2002). Negative openness represents concavity of surface and Positive openness represents convexity of surface. Negative openness takes higher value such as valley, inside of crater and gully. While positive openness represents
takes higher value such as crest, ridge and razor back. Figure 6 is conceptual diagram of positive and negative openness. Those are shown schematically for values less than 90 degrees. Edge line of brown and white is topographic surface. L is radial limit of calculation for chosen point (P1 and P2) on a DEM. The primary part of RRIM is definition of new parameter calculated from two openness parameters like below, 2)( np OOI −= (2)
1073

The International Archives of the Photogrammetry, Remote Sensing and Spatial Information Sciences. Vol. XXXVII. Part B2. Beijing 2008
Where Op is positive openness, On is negative openness. Above parameter efficiently eliminates incident light direction dependency like in shaded relief image and express convexity and concavity at the same time. Because convex topographic features have high value and concave topographic features have low values in above definition. In RRIM above index is expressed by gray-scale image layer and topographic slope is red colour layer. This multi-layered image shows concavity and convexity of surface without incident light. Our experience tells us that red colour has most rich tone for human eyes especially under computer oriented colour space. RRIM effectively represents large-scale land feature as well as fine structure at the same time in wide variety of topographic situation.
P1
L
P2
L Figure 6. Conceptual diagram of positive openness (left side)
and negative openness (right side). Figure 7 is sample colour diagram of RRIM method. Topographic slope is showed as chroma value of red (y axis) and (Op-On)/2 is showed as brightness (x axis). As a result top of ridges are showed as white, bottom of valleys are showed as black, steep slopes are showed as bright red and flat surfaces are showed as gray in RRIM.
Figure 7. Colour diagram of RRIM (example).
3.2 Merge of landform element images
Figure 8 shows the production procedure of RRIM and its landform elements. Upper figure shows topographic slope. In this figure deep red indicates steep slope and light red indicates flat surface. Middle figure shows openness (Op-On)/2. Bright part of this figure is convex surface and dark part is concave surface. Final result of RRIM is lower part of Figure 8. In this figure RRIM represents not only large-scale land features but also fine structures especially at the steep slope of mountain.
Merging above two images into one image.
Figure 8. Production procedure of RRIM. Topographic slope (upper), Openness (Op -On)/2 (middle) and RRIM (lower) for
Mt. Ohmuro, Japan. 1m grid LIDAR data.
3.3 Evaluation of RRIM
Unlike shaded relief, RRIM clearly shows convexity and concavity without any difficulty. RRIM effectively represent fine topographic structure even on the flat surface. In figure 11
1074

The International Archives of the Photogrammetry, Remote Sensing and Spatial Information Sciences. Vol. XXXVII. Part B2. Beijing 2008
RRIM clearly shows traces of lava flow near Mt. Fuji. In contrast, ordinary contour map (figure 11). Original scale of this map is 1:25,000 and contour interval is 10m with supplemental contour lines in flat region. This map does not express fine topographic structure on the flat surface. Contour map calculated by LIDAR derived 1m grid DEM is figure 10. In this figure fine topographic structure is express by dense contour lines (1m interval) but hard to interpret the trace of lava flow.
Figure 9. Ordinary contour map on the flat surface (around Mt Fuji). SPOT Image Copyright 2005, Geographical Survey
Institute.
Figure 10. Contour map with LIDAR data (1m DEM). Area is same as
Figure 10. Figure 12 is RRIM version of Figure 5. Both figures visualize same area and using same DEM each other. We need 4 different images in Figure 5. We have to change a direction incident light to eliminate the shade which obstacles fine structures. In contrast RRIM only needs one image to express fine and large scale topographic structures. No area is obscured by shade. No incident light direction dependency. This image still kept convexity and concavity information even under ortho-rectified plan view situation. RRIM enables to measure the distance and angle correctly. This feature is one of the advantages of RRIM against perspective 3D view and other non-ortho-rectified images.
Figure 11. Fine topographic structure on the flat surface with RRIM. Area is same as
Figure 10. LIDAR data are 1m grid DEM.
Figure 12. Same data as Figure 3 with RRIM expression. The DEM is Digital Map 10m Grid (Elevation of Active Volcanos) ,
Geographical Survey Institute. To summarize the main advantages of RRIM are,
No shade. RRIM is independent of direction of incident light.
RRIM represents wide range of 3D topographic structure with one image without any additional devices and stereopsis ability for its audience.
Suitable for variety of land feature and wide range of scale with one image.
Ortho-rectified image with convexity and concavity information.
By contrast the limitations of RRIM are, No elevation. No information about direction of slope.
3.4 Improvement of RRIM
Plain RRIM is useful for interpretation of topographic features in many cases of topographic situation but still has some limitations. Superimpose or merge of additional layer is the appropriate countermeasure of above limitations. Figure 13 is combination of contour map and RRIM. As discussed previous section, contour map also has potential limitation related to dense of contour line. But in this case wide
1075
The International Archives of the Photogrammetry, Remote Sensing and Spatial Information Sciences. Vol. XXXVII. Part B2. Beijing 2008
interval is enough to add the elevation into RRIM. Because contour line is not used for express the shape of fine topographic structures. It only adds the supplemental elevation information to RRIM. Horizontal interval of contour lines are also represents the direction of topographic slope which is not contained plain RRIM.
Figure 14 is combination of colour level slice and RRIM. Colour level slice also used as supplemental layer for elevation in this case. Colour level slice express the elevation with smooth colour gradation and RRIM express the fine structure topographic structure. Those combinations compensate its original limitation each other and improve the interpretability of topographic information from one image.
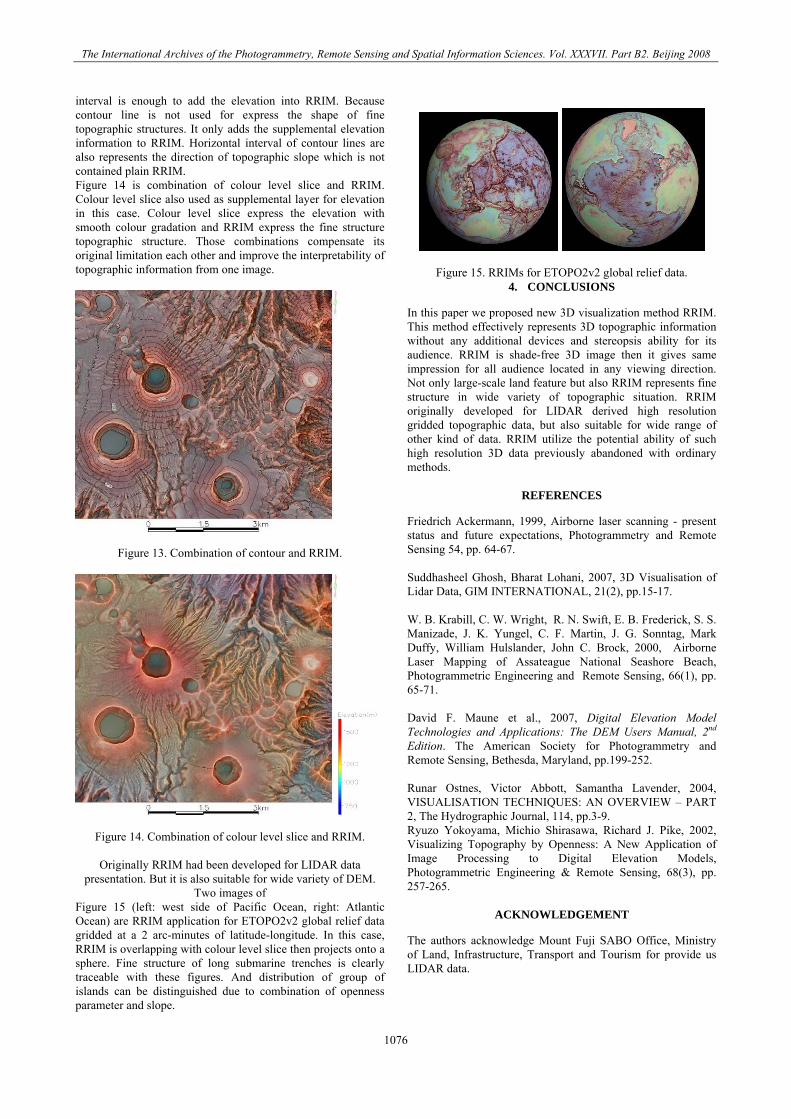
Figure 15. RRIMs for ETOPO2v2 global relief data.
4. CONCLUSIONS
In this paper we proposed new 3D visualization method RRIM. This method effectively represents 3D topographic information without any additional devices and stereopsis ability for its audience. RRIM is shade-free 3D image then it gives same impression for all audience located in any viewing direction. Not only large-scale land feature but also RRIM represents fine structure in wide variety of topographic situation. RRIM originally developed for LIDAR derived high resolution gridded topographic data, but also suitable for wide range of other kind of data. RRIM utilize the potential ability of such high resolution 3D data previously abandoned with ordinary methods.
REFERENCES
Friedrich Ackermann, 1999, Airborne laser scanning - present status and future expectations, Photogrammetry and Remote Sensing 54, pp. 64-67.
Figure 13. Combination of contour and RRIM.
Suddhasheel Ghosh, Bharat Lohani, 2007, 3D Visualisation of Lidar Data, GIM INTERNATIONAL, 21(2), pp.15-17.
W. B. Krabill, C. W. Wright, R. N. Swift, E. B. Frederick, S. S. Manizade, J. K. Yungel, C. F. Martin, J. G. Sonntag, Mark Duffy, William Hulslander, John C. Brock, 2000, Airborne Laser Mapping of Assateague National Seashore Beach, Photogrammetric Engineering and Remote Sensing, 66(1), pp. 65-71. David F. Maune et al., 2007, Digital Elevation Model Technologies and Applications: The DEM Users Manual, 2nd Edition. The American Society for Photogrammetry and Remote Sensing, Bethesda, Maryland, pp.199-252. Runar Ostnes, Victor Abbott, Samantha Lavender, 2004, VISUALISATION TECHNIQUES: AN OVERVIEW – PART 2, The Hydrographic Journal, 114, pp.3-9. Ryuzo Yokoyama, Michio Shirasawa, Richard J. Pike, 2002, Visualizing Topography by Openness: A New Application of Image Processing to Digital Elevation Models, Photogrammetric Engineering & Remote Sensing, 68(3), pp. 257-265.
Figure 14. Combination of colour level slice and RRIM.
Originally RRIM had been developed for LIDAR data presentation. But it is also suitable for wide variety of DEM.
Two images of Figure 15 (left: west side of Pacific Ocean, right: Atlantic Ocean) are RRIM application for ETOPO2v2 global relief data gridded at a 2 arc-minutes of latitude-longitude. In this case, RRIM is overlapping with colour level slice then projects onto a sphere. Fine structure of long submarine trenches is clearly traceable with these figures. And distribution of group of islands can be distinguished due to combination of openness parameter and slope.
ACKNOWLEDGEMENT
The authors acknowledge Mount Fuji SABO Office, Ministry of Land, Infrastructure, Transport and Tourism for provide us LIDAR data.
1076