Embed Size (px)
Citation preview
sustainability
Article
Recycling Agricultural Wastes and By-products inOrganic Farming: Biofertilizer Production, YieldPerformance and Carbon Footprint Analysis
Mariangela Diacono 1,* , Alessandro Persiani 1, Elena Testani 2, Francesco Montemurro 3
and Corrado Ciaccia 2
1 Consiglio per la ricerca in agricoltura e l’analisi dell’economia agraria—Research Centre for Agriculture andEnvironment, Via Celso Ulpiani 5, 70125 Bari, Italy
2 Consiglio per la ricerca in agricoltura e l’analisi dell’economia agraria—Research Centre for Agriculture andEnvironment, Via della Navicella 2-4, 00184 Roma (RM), Italy
3 Consiglio per la ricerca in agricoltura e l’analisi dell’economia agraria—Research Centre for Vegetable andOrnamental Crops, Via Salaria 1, 63030 Monsampolo del Tronto (AP), Italy
* Correspondence: [email protected]; Tel.: +39-080-5475052
Received: 27 May 2019; Accepted: 10 July 2019; Published: 12 July 2019�����������������
Abstract: The Circular Economy concept implies the re-design of existing production systems inagriculture, by promoting agricultural waste recycling. In an organic zucchini—lettuce rotation,two different agroecological tools were considered: biofertilizer and presence or absence of greenmanure (GM+ and GM−). In particular, we compared: (i) anaerobic digestate from cattle manure,co-composted with vegetable wastes, with the presence of GM (AD GM+); (ii) olive pomace compost,re-composted, with the presence of GM (OWC GM+); (iii) municipal waste compost with GM (MWCGM+); (iv) municipal waste compost without GM (MWC GM−). These materials were tested witha commercial organic fertilizer without GM (COF GM−) as a positive control. The objectives were:(i) assessing the environmental sustainability of biofertilizers through carbon footprint analysis bygreenhouse gas—GHG—emissions; (ii) evaluating the agronomic performance on the vegetablerotation, by energy output assessment. The total carbon emissions of biofertilizers production was 63.9and 67.0 kg of CO2 eq Mg−1 for AD and OWC, respectively. The co-composting and re-compostingprocesses emitted 31.4 and 8.4 kg CO2 per Mg of compost, respectively. In AD the ventilation phaseof composting accounted for 37.2% of total emissions. The total CO2 emission values for the two-cropcycles were the highest in COF GM− and the lowest in OWC GM+, due to different fertilizer sources.On the average of the treatments, the input that induced the highest CO2 emission was irrigation(37.9%). The energy output assessment for zucchini and lettuce highlighted similar performancefor all the treatments. Our findings demonstrated the validity of the tested processes to recycleagro-industrial wastes, and the potential of agroecological practices (GM) to mitigate GHG emissions.
Keywords: anaerobic digestate; co-composting; olive pomace compost; municipal waste compost;circular economy; environmental sustainability; Mediterranean environment; climate change
1. Introduction
Europe is experiencing unsustainable exploitation of natural resources, unpredictable severechanges of climate, loss in biodiversity and increasing food waste production, in a context of a worldpopulation increase of more than 9 billion by 2050 [1–3]. Overcoming these challenges requires researchand innovation in agriculture, to achieve radical switches in lifestyle and resource use.
In 2015, the European Commission published ‘Closing the loop—An EU action plan for thecircular economy’ [4]. The new model of economy can support the EU’s commitments to reach the
Sustainability 2019, 11, 3824; doi:10.3390/su11143824 www.mdpi.com/journal/sustainability
Sustainability 2019, 11, 3824 2 of 17
Sustainable Development Goal n.12 ‘Responsible consumption and production’. In closed systems,for example, the goal is to use wastes from one sector as an input for other ones. To this aim it isnecessary to consider that different Agricultural Wastes, Co-products and By-products (AWCB) aregenerated during the production, industrial manufacturing and consumption of agricultural produce.The studies reviewed by Corrado and Sala [5] showed that food waste generation along the supplychain ranges between 194 kilograms per capita−1 year−1 (kg/p/yr) and 389 kg/p/yr at the global level,and between 158 kg/p/yr and 298 kg/p/yr at the European scale. In the European Union, AWCBhave been estimated to be more than 700 million Mg every year [6]. They potentially represent anenormous loss of resources in the form of both materials and energy. In addition, the management andincorrect disposal of AWCB have huge environmental impacts, such as groundwater contamination,soil pollution and greenhouse gases emission to the air [7].
In Italy, AWCB are produced in different stages of supply chain, and in particular 3.3 and 2.6% ofagri-food products and final products, respectively, from the food industry are discarded before sale(17 and 1.7 Mt yr−1, respectively), while the loss occurring in food retailers is about 250,000 t yr−1 [3].
As a matter of fact, the long-term aim of the revised Waste Framework Directive (EU, 2018/851)is to decrease the quantity of waste produced and achieve high levels of recycling, as well as phaseout landfilling except for non-recyclable wastes. In the frame of development of the EuropeanBioeconomy [8,9], sustainable valorization of the abovementioned AWCB through conventional ornovel processes seems crucial. Therefore, waste management and global resource depletion can besolved together, for an eco-innovation focused on a “zero waste” society and economy. This model ofcircular chain, often defined as closed loops, could recover valuable components from AWCB. Much of themost important organic materials generated as AWCB contain, in fact, many components (e.g., proteins,sugars and lipids) that could be utilized as substrates and nutrients in different microbial/enzymaticprocesses, to originate innovative added-value products. Possible uses of residual organic materialsinclude production of biofertilizers and soil amendments, energy recovery, production of chemicals(volatile organic acids, alcohols, etc.) and utilization in farm animal nutrition [10,11].
Following the most widespread waste streams of the production chains in the study area (SouthernItaly), AWCB from farm livestock (cattle manure), olive milling (wet olive pomace and olive pruning)and vegetable processing (aubergines, peppers) were selected for the study. For the purposes of thisresearch, two traditional technologies of waste treatment, namely anerobic digestion and compostingwere considered, to study the contribution of integrated methodologies applied in the circulareconomy [12].
Digestates are co-products from biogas plants for methane production by anaerobic digestion ofdifferent organic matrices (e.g., farm livestock manure) and can be separated into a solid and a liquidfraction. In particular, according to Møller et al. [13] the solid digestate fraction can contain 60–80% ofthe organic matter and phosphorus, 20–25% of the nitrogen and 10–15% of the potassium comparedto the original material. However, since phytotoxicity, viscosity and odor limit the direct applicationof digestate on agricultural soils, pre-treatments are required to obtain a valuable biofertilizer, thusallowing sustainable crop cultivation without environmental risks [14]. To improve the quality ofthis pre-processed solid fraction, co-composting could be a feasible way, providing easily degradablematerials to foster the microbial activity during the treatment [15]. The co-composting process isa controlled biological degradation under aerobic conditions, where organic material compounds aretransformed in shorter molecular chains and a more stable humus, which is important in agriculturalproduction and to recycle organic matter [16]. The resulting co-composted anaerobic digestate (AD)can be easily produced at farm scale, by using raw materials available in the farm/area. The farmersknowledge on how apply organic fertilizers and their possible positive effects (e.g., soil health,suppressiveness, environmental benefits, etc.) is crucial [17]. Hence, soil application of this biofertilizerneeds a higher farmer’s expertise, to synchronize the mineralization rate with the plant growth,reducing the risk of leaching of excess N.
Sustainability 2019, 11, 3824 3 of 17
Among the AWCB, olive pomace (OP) is one of the most important organic agro-industrial wastesin Mediterranean countries, with a high content of organic matter (about 90%) that could profitablybe recycled through composting, so that it can be used in agriculture as fertilizer [18]. Olive pomaceis a semisolid fraction derived after the extraction of olive oil by two-phase centrifugation systems,generated in huge amounts in a short period of time (October-November), which incorrect disposalmay determine a damaging environmental impact. This is due to the phytotoxic and antimicrobialeffects of phenolic compounds and the lipid fraction [19]. Re-composting the pre-processed OP with anon-farm compost from vegetable residues could be a feasible treatment to recycle this waste, producinga biofertilizer with an adequate degree of stability and maturity. The re-composting of OP can leadto a decrease in the C/N ratio, compared to the starting material, and to an improvement of themicrobial activity.
There is a large literature relating to the influence of composted digestate and olive pomace bothon soils and different crops [20–23]. The combination of cover crops introduction (green manure) andapplication of organic materials was also studied for different crops in organic production [24,25].However, to the best of our knowledge there is a lack of information on environmental sustainabilityassessment of recycled organic matrices applied in association with green manure on vegetable cropsin organic farming, under Mediterranean conditions.
Vandermeersch et al. [26] in particular found that food waste management options can be evaluatedaccording to several assessment methods. These methods are material flow analysis, energy balance,exergy analysis and life cycle assessment. Indeed, carbon footprint method can also be applied [27],to assess the environmental impact and sustainability of the waste recycling treatments used. Thecarbon footprint is a measure of the total amount of carbon dioxide emissions that is directly andindirectly caused by an activity or is accumulated over the life stages of a product [28]. The unit iskg CO2 when only CO2 is considered, while if other greenhouse gases (GHG) are included the unitchanges to kg CO2-e, indicating the mass of CO2-equivalents. During biological waste treatments,the organic materials are metabolized by microorganisms, so a part of their embedded carbon isemitted into the air, and the remainder is stored as compost or digestate that can be assessed by carbonfootprint analysis.
The objectives of the research were: (i) to produce biofertilizers from AWCB so to close the organicmaterials cycle from field to productive sector and return back to the field, (ii) to test the environmentalsustainability and effectiveness of co-composting procedures through carbon footprint analysis, (iii) toevaluate the agronomic performance of the biofertilizers obtained on a zucchini–lettuce rotation underorganic farming management and Mediterranean conditions.
2. Materials and Methods
2.1. Experimental Site
The experimental field trial was carried out in 2016–2017 on an organic zucchini—lettuce rotationat the ‘Azienda Sperimentale Metaponto’ (one of the Research Centers of the Consiglio per la ricerca inagricoltura e l’analisi dell’economia agraria), located in Metaponto (MT)—South Italy (lat 40◦ 24’ N;long 16◦ 48’ E and 8 meters a.s.l.).
The climate is classified as “accentuated thermomediterranean” according to the UNESCO-FAOclassification [29], with an average month temperature of 8.8 and 24.4 ◦C in the winter and summer,respectively. Sometimes the winter and summer temperatures fall below 0 ◦C and rise above 40 ◦C,respectively. The mean rainfall is about 490 mm year−1 but it is unevenly distributed, since it isconcentrated in the winter months.
The soil of the experimental trial is classified as a Typic Epiaquert [30]. It has a clay loam texture(60 and 36% of the clay and silt, respectively) with a soil bulk density of 1350 kg m−3, and it contains1.0 and 19.0 g kg−1 of N and organic matter, respectively.
Sustainability 2019, 11, 3824 4 of 17
2.2. Experimental Design, Composting Processes and Measurements
2.2.1. AWCB Tested
The experiment was divided into two complementary stages. In the first one, co-composting/
re-composting processes of pre-processed organic matrices were carried out on selected wastes,sub-products and biofertilizers (as outlined above) derived from local production systems and residuesfrom experimental farm activities. In the second stage, the obtained stable materials were tested in anexperimental field, in comparison with a commercial fertilizer.
The anaerobic digestate from cattle manure (80% of total dry weight) was co-composted,in a six-weeks process, to improve the quality of this solid fraction, with (highly fermentable)organic vegetable wastes (10%)—i.e., Aubergines, peppers—and straws (10%) acting as bulking agent,so obtaining an anaerobic digestate-based compost (AD). The olive pomace compost was a powderycompost obtained by olive pomace (80% of total dry weight) and olive pruning (20%), which wassupplied by the Research Centre of Composting—CESCO—in Laurino (SA), Campania region (southof Italy). The olive pomace compost (75% of the final product) was re-composted at the CREAexperimental farm together with a Municipal Waste Compost (MWC; 5% of the total dry weight) andan on-farm compost (20%) obtained by highly fermentable farm residues (grass clippings and straws)and organic vegetable wastes, to obtain an olive waste-based compost (OWC). The percentage ofeach raw material used for the composting process was decided also on the C/N ratio basis, to ensurean equilibrate compost process and to obtain the best final C/N ratio. The obtained compost wasa stable material with total N content of 2.4% (dry matter) and C/N of 18 (compared to C/N of 21 of thestarting material).
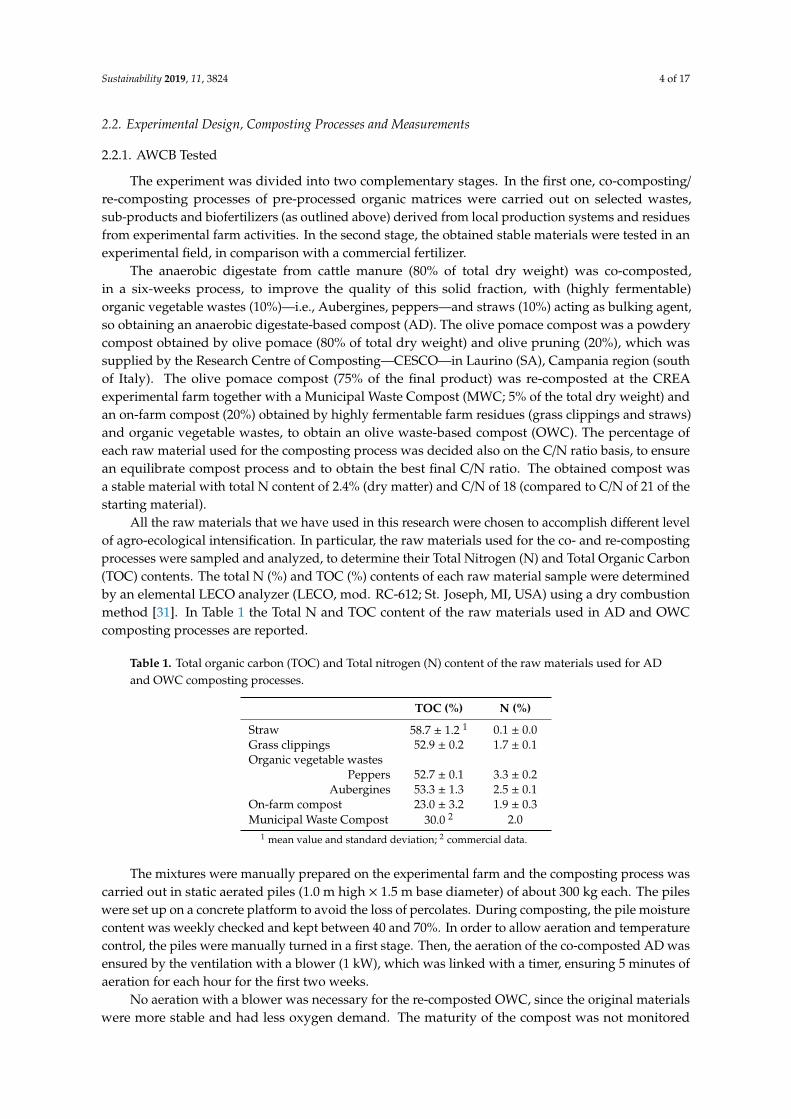
All the raw materials that we have used in this research were chosen to accomplish different levelof agro-ecological intensification. In particular, the raw materials used for the co- and re-compostingprocesses were sampled and analyzed, to determine their Total Nitrogen (N) and Total Organic Carbon(TOC) contents. The total N (%) and TOC (%) contents of each raw material sample were determinedby an elemental LECO analyzer (LECO, mod. RC-612; St. Joseph, MI, USA) using a dry combustionmethod [31]. In Table 1 the Total N and TOC content of the raw materials used in AD and OWCcomposting processes are reported.
Table 1. Total organic carbon (TOC) and Total nitrogen (N) content of the raw materials used for ADand OWC composting processes.
TOC (%) N (%)
Straw 58.7 ± 1.2 1 0.1 ± 0.0Grass clippings 52.9 ± 0.2 1.7 ± 0.1Organic vegetable wastes
Peppers 52.7 ± 0.1 3.3 ± 0.2Aubergines 53.3 ± 1.3 2.5 ± 0.1
On-farm compost 23.0 ± 3.2 1.9 ± 0.3Municipal Waste Compost 30.0 2 2.0
1 mean value and standard deviation; 2 commercial data.
The mixtures were manually prepared on the experimental farm and the composting process wascarried out in static aerated piles (1.0 m high × 1.5 m base diameter) of about 300 kg each. The pileswere set up on a concrete platform to avoid the loss of percolates. During composting, the pile moisturecontent was weekly checked and kept between 40 and 70%. In order to allow aeration and temperaturecontrol, the piles were manually turned in a first stage. Then, the aeration of the co-composted AD wasensured by the ventilation with a blower (1 kW), which was linked with a timer, ensuring 5 minutes ofaeration for each hour for the first two weeks.
No aeration with a blower was necessary for the re-composted OWC, since the original materialswere more stable and had less oxygen demand. The maturity of the compost was not monitored
Sustainability 2019, 11, 3824 5 of 17
through humification index but only indirectly, considering the microbiological activity linked tothe temperature of the composting process. In particular, we monitored the temperature of there-composting process turning the material with a shovel once per week during the first three weeks ofthe entire six-week process, whereas we did not turn the materials when the temperature was stable.
The heavy metals content (cadmium, Cd; chromium, Cr; copper, Cu; nickel, Ni; lead, Pb; zinc, Zn)of anaerobic digestate (AD) and olive wastes compost (OWC) before and after the co-/re-compostingprocesses was determined by inductively coupled plasma emission spectrophotometer (ICP-AES Iris;Thermo Optek, Milan, Italy). Data recorded from spectrophotometer have been submitted to Analysisof Variance (by using SPSS Inc. Released 2007, SPSS for Windows, Version 16.0. SPSS Inc., Chicago,IL, USA).
2.2.2. Experimental Design Treatment, Measurements
The experimental design was a split-plot with two factors and three replicates (blocks). Themain-plot factor was the green manure (GM) presence or not (GM+ and GM−, respectively). Thesubplot factor was assigned to fertilizer (F), comparing: (i) the co-composted anaerobic digestate(AD); (ii) the re-composted olive waste compost (OWC); (iii) a commercial organic fertilizer, based ondried animal manure (COF) (Ca’ verde—ED & F Man Liquid Products Italia srl, Bagnasco, Italy) aspositive control; (iv) a municipal solid waste compost (MSW), as second positive control, obtainedwith municipal solid waste from separate collection and biodegradable wastes from parks and gardensmanagement in processing plant of Tersan S.p.A. (Bari, Italy). Each sub-plot was 4 × 5 m. All thefertilizers were allowed in organic farming, in accordance to the European Regulation (CommissionRegulation N◦ 889/2008 of 5 September 2008 for EU Council Regulation N◦ 834/2007).
The fertilizers were applied to soil at the dose of 150 kg N ha−1, split in two amounts in separatestages of the rotation in both years: before GM sowing (70% of the total quantity) and before zucchinitransplanting (the remaining 30%), to reduce potential N immobilization phenomena during the cashcrop cycle. No fertilization was applied before the lettuce crop. The 150 kg ha−1 of N was derived asthe sum of the marketable N uptake of both crops in our environmental conditions and, consequently,we applied a different amount of organic materials, according with their N content.
Irrigation was done with the same volume of water in all treatments, calculated to reach 100% ofavailable soil water for a soil depth of 0–40 cm for each irrigation.
The green manure treatment was a mixture of common vetch (Vicia sativa L.) and oat (Avena sativaL.) sown at rate of 80 and 220 kg ha−1 for vetch and oat, respectively, on 3rd November 2016. The greenmanure crops sowing was replicated on 28th December 2017, mainly due to the dry period occurred onthe autumn 2016 (data not reported). The GM was then chopped and incorporated into the soil (aboutat 20 cm depth) by plowing on 26th April 2017. Zucchini (cv President) 25-days old seedlings werehand-transplanted at an inter-row × row distance of 1.0 × 1.0 m (1.0 plant m−2) on 3rd May in 2017.The harvest began the 9th of June and was completed by the 25th July, with a cropping cycle of 81 days.Lettuce (var. Iceberg,) transplanting was done after a rotary tillage and it occurred on 24th August2017. Lettuce harvest was completed on 23rd October, with a cropping cycle of 60 days. Furthermore,no chemicals to control pests and diseases were used in both cropping cycles.
In order to compare the systems production capacity including different crops, according to otherstudies [32,33], yields were transformed in energy output equivalent. The energy output was obtainedby multiplying the productions by their corresponding energy equivalents [34].
At GM termination, the aboveground biomass was sampled by placing two randomly-selected1.0 × 1.0 m2 quadrat within each sub-plot. Samples were dried for 48 h at 70◦ to determine dry content,and total N content (%) of each biomass sample was determined by LECO analyzer (dry combustion),thus allowing the calculation of the above soil biomass N (N content× biomass dry weight). At zucchiniand lettuce harvest stage, yield and residues (Mg ha−1) were sampled from a 1.0 m2 area in the middleof each sub-plot. Biomasses were then dried for 48 h at 70◦C for the dry content determination. At thebeginning and at the end of the rotation, two soil samples (0–30 cm depth) were randomly taken from
Sustainability 2019, 11, 3824 6 of 17
each sub-plot, air dried, 2-mm sieved and then analyzed for organic carbon content by means of anelemental analyzer (LECO, mod. RC-612; St. Joseph, MI, USA), using a dry combustion method [31].
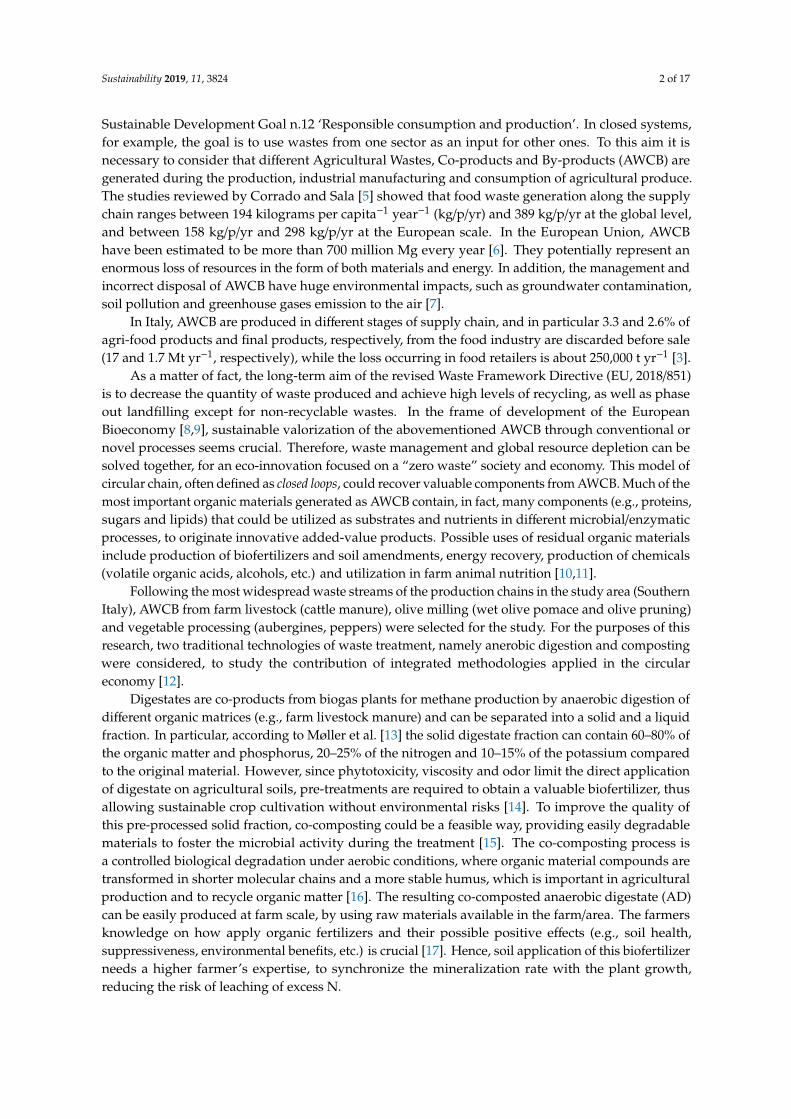
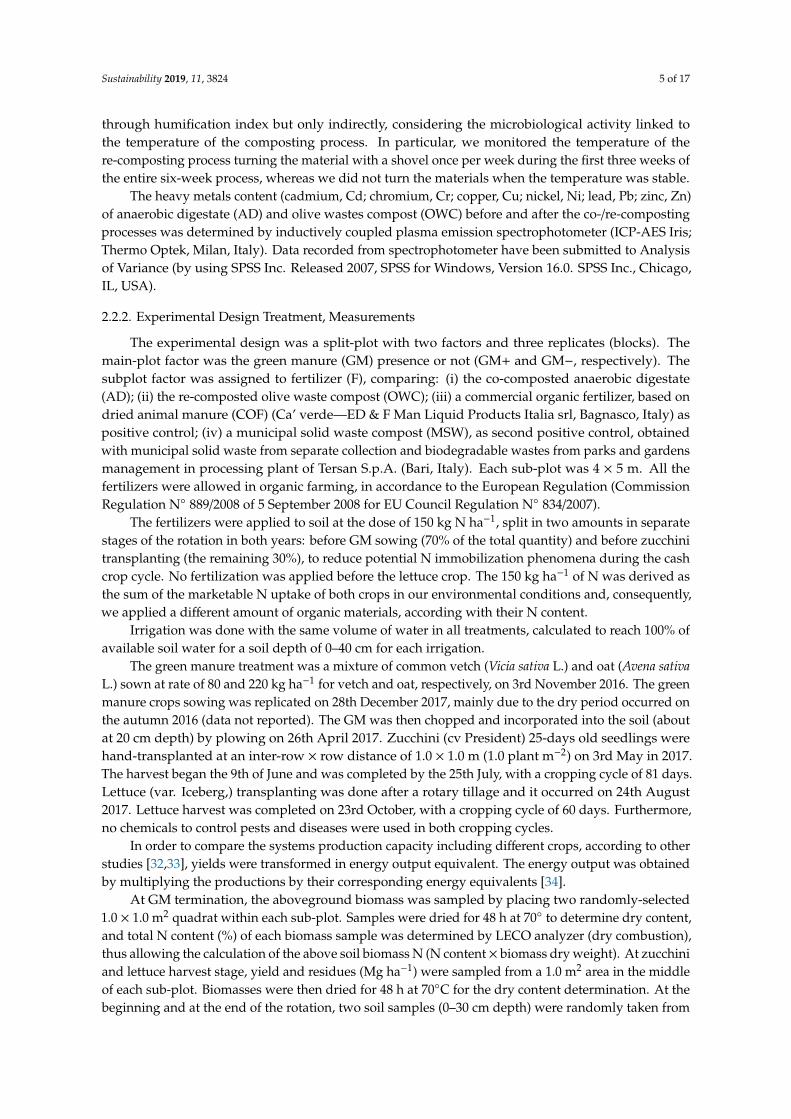
To answer to the specific aims of this study, only selected treatments—corresponding to differentand actual scenarios—were taken into consideration. Therefore, results are reported for the followingtreatment combinations: AD GM+, OWC GM+, MWC GM+, MWC GM− and COF GM−. The flowchartof the entire analyzed systems is described in Figure 1.
Sustainability 2019, 11, x FOR PEER REVIEW 6 of 18
To answer to the specific aims of this study, only selected treatments – corresponding to different and actual scenarios – were taken into consideration. Therefore, results are reported for the following treatment combinations: AD GM+, OWC GM+, MWC GM+, MWC GM- and COF GM-. The flowchart of the entire analyzed systems is described in Figure 1.
Figure 1. Flowchart to describe the analyzed systems: the system boundaries of the composting processes and cultivation processes.
2.2.3. Statistical analysis
A parametric one-way Analysis of Variance (ANOVA) was used to verify the effect of the treatments on energy output, and the Duncan Multiple Range Test (DMRT) was performed for mean comparisons (p ≤ 0.05 probability level). Statistical analysis was carried out by using SPSS for Windows, Version 16.0.
2.3. Environmental impact and sustainability assessment
2.3.1. Greenhouse gases emissions
To assess the environmental impact and the sustainability of the different fertilization strategies implemented in the field trial, the global warming potential (GWP) analysis was applied [35]. The GWP is the total array of GHG emissions (CO2, N2O and CH4), which is produced directly and indirectly during the cultivation cycles. However, we did not take into account the CH4 and ammonia emissions in our operations, since the CH4 in the composting process was already included in the coefficient reported in the Table 2. Furthermore, the CH4 emission is considered negligible when the aerobic conditions occurred, as reported in Luske [36] and Brown et al. [37]. Pampuro et al. [38] also showed that if during the composting process the materials are adequately turned and aerated the CH4 emissions are reduced. Moreover, in calculations the CH4 emission was not included since during the processes (in our conditions) this emission is much less than N2O, as reported by Pratibha
Figure 1. Flowchart to describe the analyzed systems: the system boundaries of the compostingprocesses and cultivation processes.
2.2.3. Statistical Analysis
A parametric one-way Analysis of Variance (ANOVA) was used to verify the effect of the treatmentson energy output, and the Duncan Multiple Range Test (DMRT) was performed for mean comparisons(p ≤ 0.05 probability level). Statistical analysis was carried out by using SPSS for Windows, Version 16.0.
2.3. Environmental Impact and Sustainability Assessment
Greenhouse Gases Emissions
To assess the environmental impact and the sustainability of the different fertilization strategiesimplemented in the field trial, the global warming potential (GWP) analysis was applied [35]. TheGWP is the total array of GHG emissions (CO2, N2O and CH4), which is produced directly andindirectly during the cultivation cycles. However, we did not take into account the CH4 and ammoniaemissions in our operations, since the CH4 in the composting process was already included in thecoefficient reported in the Table 2. Furthermore, the CH4 emission is considered negligible when theaerobic conditions occurred, as reported in Luske [36] and Brown et al. [37]. Pampuro et al. [38] alsoshowed that if during the composting process the materials are adequately turned and aerated the CH4
emissions are reduced. Moreover, in calculations the CH4 emission was not included since during the
Sustainability 2019, 11, 3824 7 of 17
processes (in our conditions) this emission is much less than N2O, as reported by Pratibha et al. [35].Also, since we re-composted the materials and considering their nature, the amounts of the ammoniashould be considered negligible [37].
The GHG emissions were transformed into CO2 equivalent by using GWP equivalent factors of1 and 310 for CO2 and N2O, respectively [39]. In this study, the amount of GHG emissions in termsof CO2 equivalent was estimated both in the composting processes and in the subsequent crop cycleactivities by means of several parameters, including human labor, machineries, fuels, fertilizers, seedsand pesticides, and marketable yields (Table 2). More specifically, also the emissions by the compostsused as raw materials before co-composting and re-composting are already included in the consideredcoefficients (Table 2). The labor time was measured for each operation, and the diesel consumptionwas directly measured in the farm. The machineries and implements weight for each operation werecalculated as follows:
W = M× t/l
where:
W = machinery and implement weights for each operation (kg)M = mass (kg)t = duration of each operation (h)l = lifespan of the tools (h)
The variability factor was the fertilization strategy used, whereas the soil and phytosanitarymanagements were not changed in the different treatments. The GHG values of unit inputs wereobtained by multiplying each input by its own emission coefficient taken from the literature (Table 3)and were reported by Mg of compost produced and by production unit (hectare) per year, for thewhole cultivation cycle. The GHG emissions were divided both by category (e.g., human labor, fuels,fertilizers) and operations (e.g., sowing, tillage, fertilizers application) [27,32,40].
Table 2. Greenhouse gases (GHG) coefficients (kg CO2 eq unit−1) of farm facilities for horticulturalcrops production.
Inputs Unit GHG Coefficient(kg CO2 eq./unit) References
Human labor h 0.36 [40]Machinery MJ 0.071 [41]Electricity) kWh 0.608 [42]FuelsDiesel L 2.76 [41]FertilizersMWC/Industrial/ on farm Composts kg 0.040–0.063 [43–45]Anaerobic digestate (AD) 0.031 [46]Nitrogen (N) kg 5.29 [47]Phosphate (P2O5) kg 0.52 [47]Potash (K2O) kg 0.38 [47]ChemicalsInsecticides kg 5.1 [48]Fungicides kg 3.9 [49]Herbicides kg 6.3 [49]Irrigation water m3 0.27 [40]Plastic pipes PE kg 2.2 [50]
Aside from the CO2 equivalent emissions measured during the crop’s cultivation operations,a further direct and indirect GHG impact of fertilizers use, and plants biomass decomposition arisesfrom N2O emissions from soils. Nitrous oxide is produced in soils mainly due to microbially-mediatedprocesses (nitrification and denitrification) [51]. The direct and indirect N2O emissions from the
Sustainability 2019, 11, 3824 8 of 17
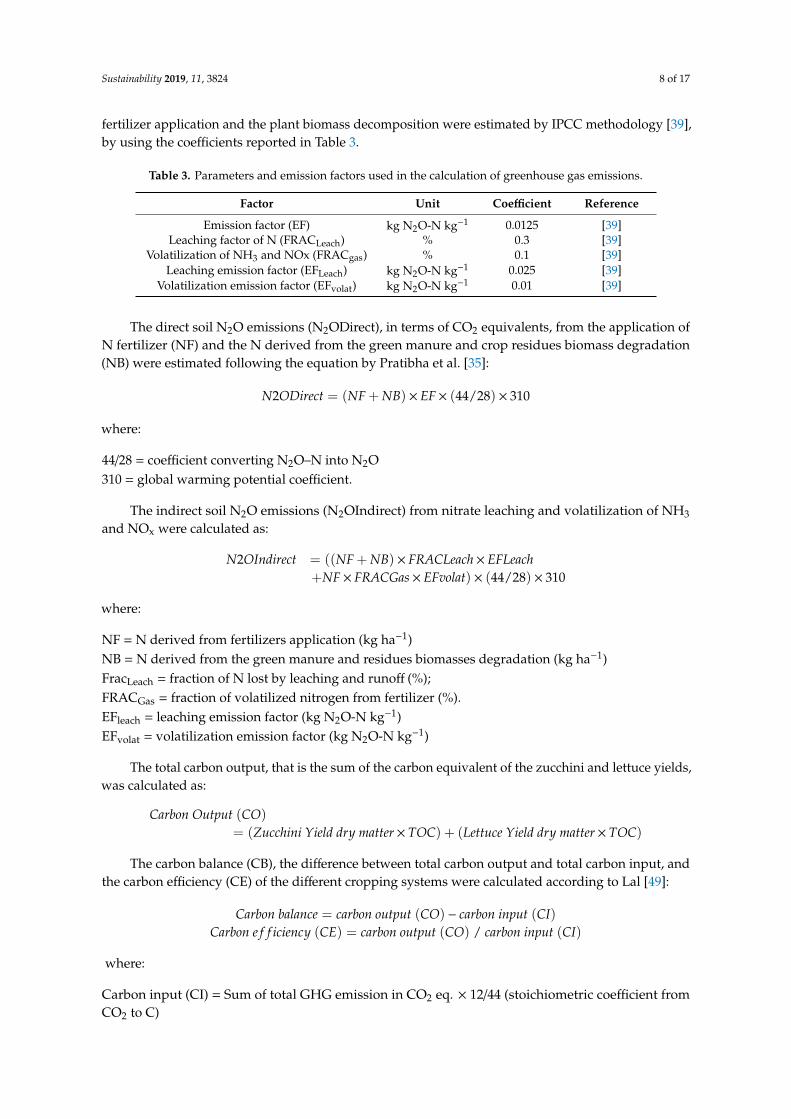
fertilizer application and the plant biomass decomposition were estimated by IPCC methodology [39],by using the coefficients reported in Table 3.
Table 3. Parameters and emission factors used in the calculation of greenhouse gas emissions.
Factor Unit Coefficient Reference
Emission factor (EF) kg N2O-N kg−1 0.0125 [39]Leaching factor of N (FRACLeach) % 0.3 [39]
Volatilization of NH3 and NOx (FRACgas) % 0.1 [39]Leaching emission factor (EFLeach) kg N2O-N kg−1 0.025 [39]
Volatilization emission factor (EFvolat) kg N2O-N kg−1 0.01 [39]
The direct soil N2O emissions (N2ODirect), in terms of CO2 equivalents, from the application ofN fertilizer (NF) and the N derived from the green manure and crop residues biomass degradation(NB) were estimated following the equation by Pratibha et al. [35]:
N2ODirect = (NF + NB) × EF× (44/28) × 310
where:
44/28 = coefficient converting N2O–N into N2O310 = global warming potential coefficient.
The indirect soil N2O emissions (N2OIndirect) from nitrate leaching and volatilization of NH3
and NOx were calculated as:
N2OIndirect = ((NF + NB) × FRACLeach× EFLeach+NF× FRACGas× EFvolat) × (44/28) × 310
where:
NF = N derived from fertilizers application (kg ha−1)NB = N derived from the green manure and residues biomasses degradation (kg ha−1)FracLeach = fraction of N lost by leaching and runoff (%);FRACGas = fraction of volatilized nitrogen from fertilizer (%).EFleach = leaching emission factor (kg N2O-N kg−1)EFvolat = volatilization emission factor (kg N2O-N kg−1)
The total carbon output, that is the sum of the carbon equivalent of the zucchini and lettuce yields,was calculated as:
Carbon Output (CO)
= (Zucchini Yield dry matter× TOC) + (Lettuce Yield dry matter× TOC)
The carbon balance (CB), the difference between total carbon output and total carbon input, andthe carbon efficiency (CE) of the different cropping systems were calculated according to Lal [49]:
Carbon balance = carbon output (CO) − carbon input (CI)Carbon e f f iciency (CE) = carbon output (CO) / carbon input (CI)
where:
Carbon input (CI) = Sum of total GHG emission in CO2 eq. × 12/44 (stoichiometric coefficient fromCO2 to C)
Sustainability 2019, 11, 3824 9 of 17
3. Results
3.1. Co-Composting and Re-Composting Processes
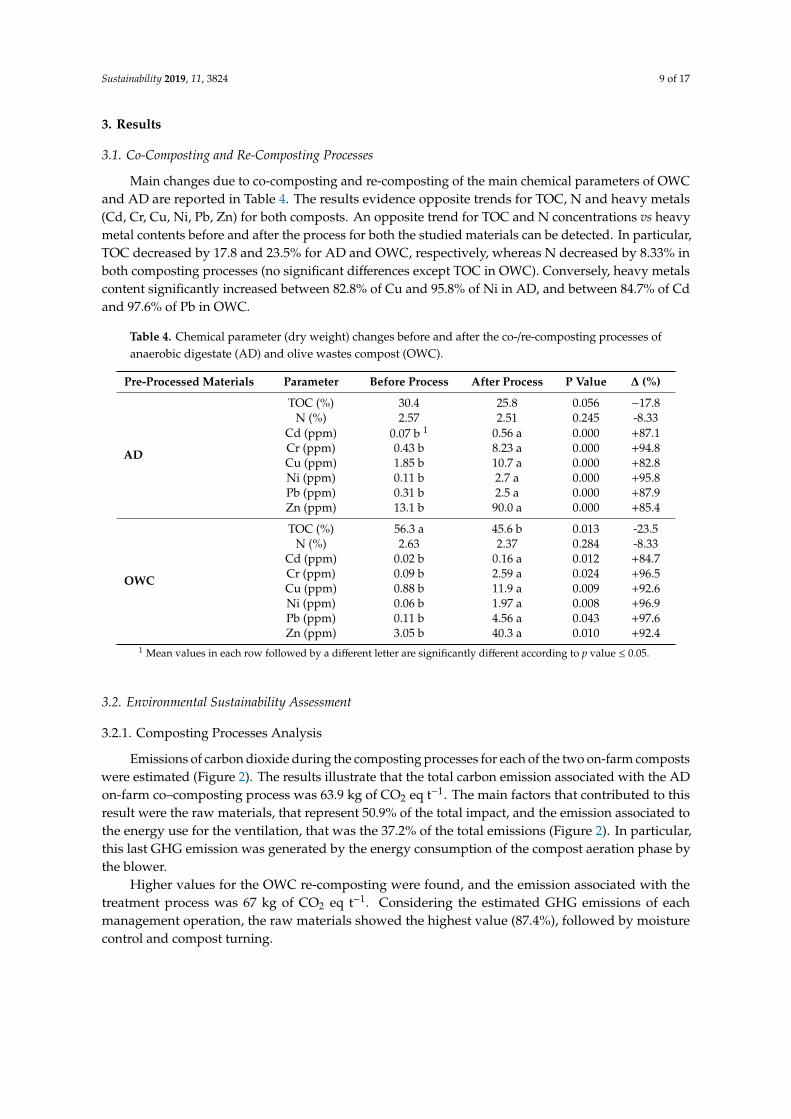
Main changes due to co-composting and re-composting of the main chemical parameters of OWCand AD are reported in Table 4. The results evidence opposite trends for TOC, N and heavy metals(Cd, Cr, Cu, Ni, Pb, Zn) for both composts. An opposite trend for TOC and N concentrations vs heavymetal contents before and after the process for both the studied materials can be detected. In particular,TOC decreased by 17.8 and 23.5% for AD and OWC, respectively, whereas N decreased by 8.33% inboth composting processes (no significant differences except TOC in OWC). Conversely, heavy metalscontent significantly increased between 82.8% of Cu and 95.8% of Ni in AD, and between 84.7% of Cdand 97.6% of Pb in OWC.
Table 4. Chemical parameter (dry weight) changes before and after the co-/re-composting processes ofanaerobic digestate (AD) and olive wastes compost (OWC).
Pre-Processed Materials Parameter Before Process After Process P Value ∆ (%)
AD
TOC (%) 30.4 25.8 0.056 −17.8N (%) 2.57 2.51 0.245 -8.33
Cd (ppm) 0.07 b 1 0.56 a 0.000 +87.1Cr (ppm) 0.43 b 8.23 a 0.000 +94.8Cu (ppm) 1.85 b 10.7 a 0.000 +82.8Ni (ppm) 0.11 b 2.7 a 0.000 +95.8Pb (ppm) 0.31 b 2.5 a 0.000 +87.9Zn (ppm) 13.1 b 90.0 a 0.000 +85.4
OWC
TOC (%) 56.3 a 45.6 b 0.013 -23.5N (%) 2.63 2.37 0.284 -8.33
Cd (ppm) 0.02 b 0.16 a 0.012 +84.7Cr (ppm) 0.09 b 2.59 a 0.024 +96.5Cu (ppm) 0.88 b 11.9 a 0.009 +92.6Ni (ppm) 0.06 b 1.97 a 0.008 +96.9Pb (ppm) 0.11 b 4.56 a 0.043 +97.6Zn (ppm) 3.05 b 40.3 a 0.010 +92.4
1 Mean values in each row followed by a different letter are significantly different according to p value ≤ 0.05.
3.2. Environmental Sustainability Assessment
3.2.1. Composting Processes Analysis
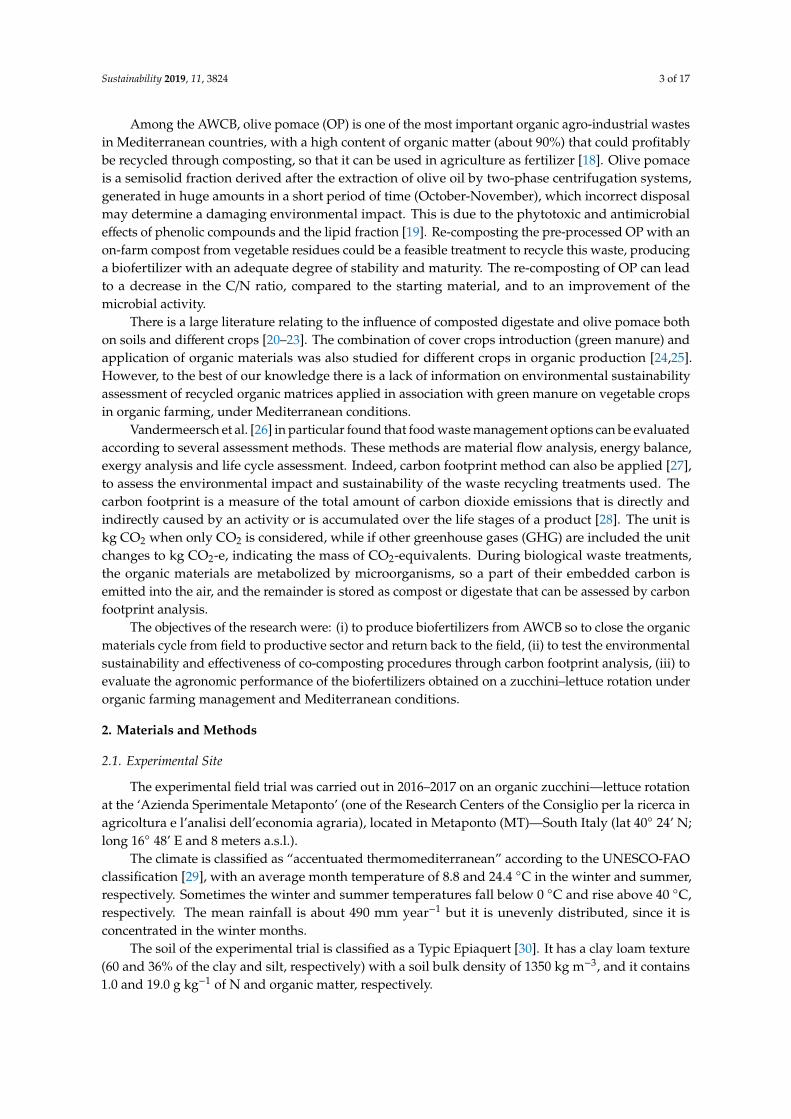
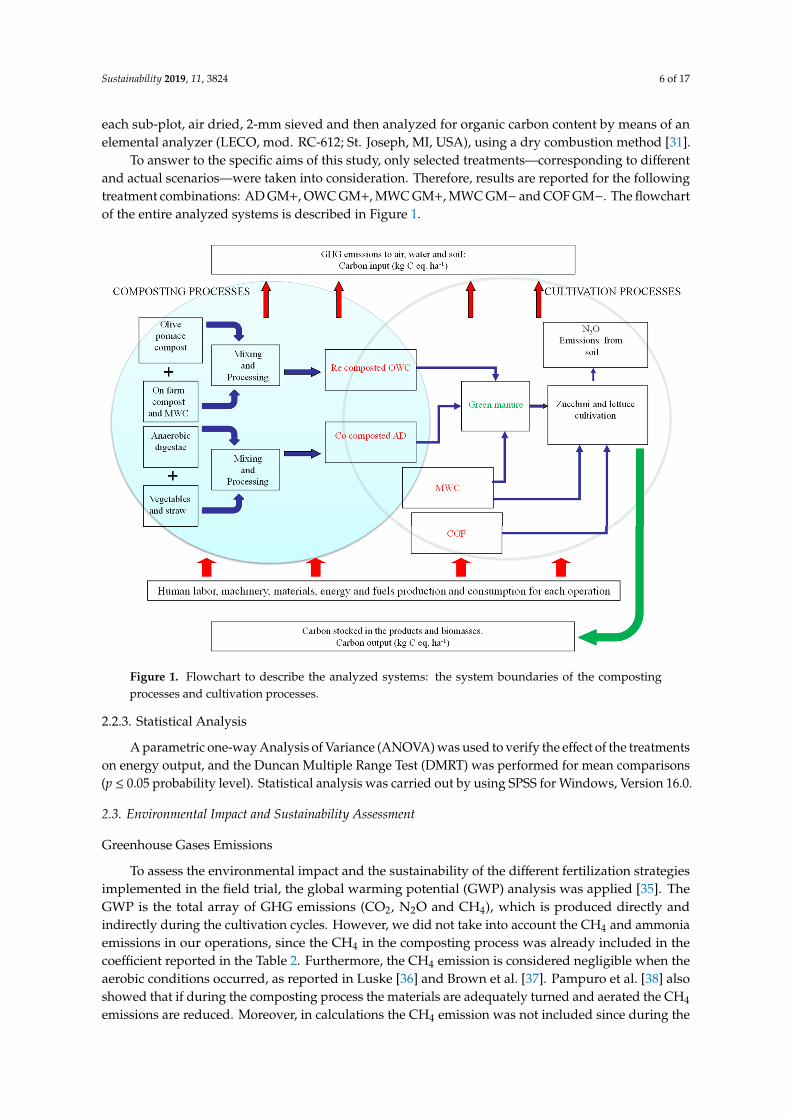
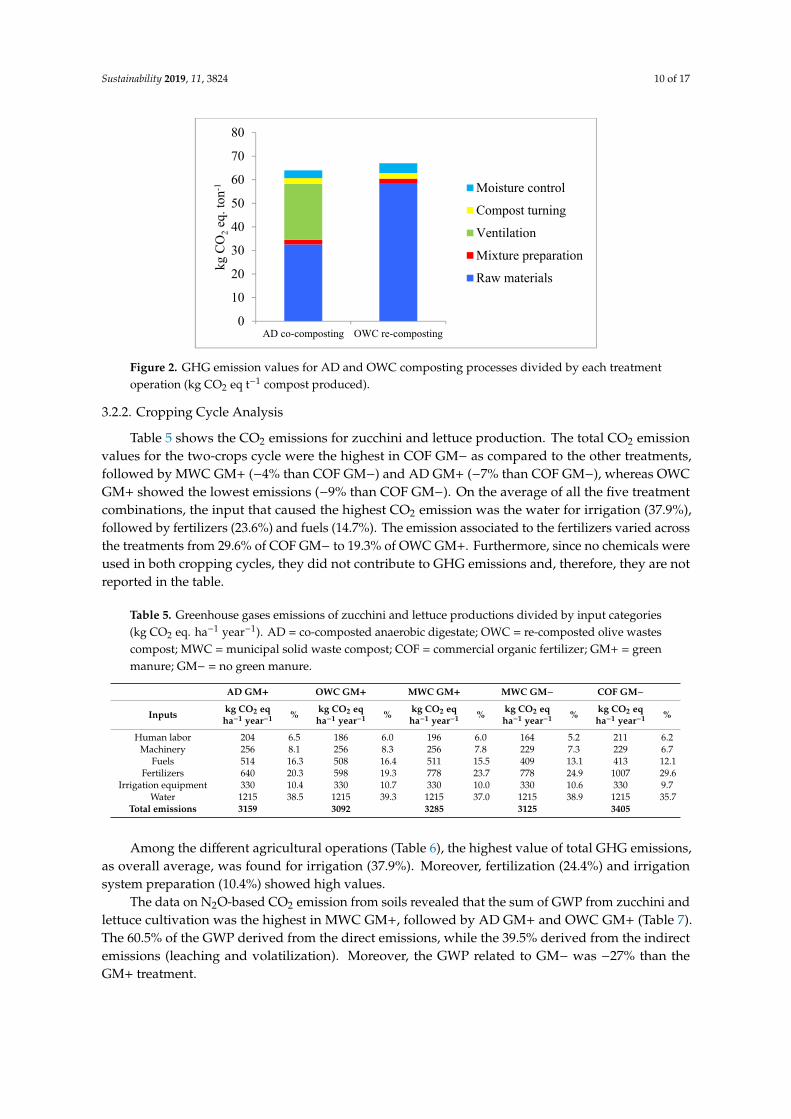
Emissions of carbon dioxide during the composting processes for each of the two on-farm compostswere estimated (Figure 2). The results illustrate that the total carbon emission associated with the ADon-farm co–composting process was 63.9 kg of CO2 eq t−1. The main factors that contributed to thisresult were the raw materials, that represent 50.9% of the total impact, and the emission associated tothe energy use for the ventilation, that was the 37.2% of the total emissions (Figure 2). In particular,this last GHG emission was generated by the energy consumption of the compost aeration phase bythe blower.
Higher values for the OWC re-composting were found, and the emission associated with thetreatment process was 67 kg of CO2 eq t−1. Considering the estimated GHG emissions of eachmanagement operation, the raw materials showed the highest value (87.4%), followed by moisturecontrol and compost turning.
Sustainability 2019, 11, 3824 10 of 17
Sustainability 2019, 11, x FOR PEER REVIEW 10 of 18
Figure 2. GHG emission values for AD and OWC composting processes divided by each treatment operation (kg CO2 eq t-1 compost produced).
3.2.2. Cropping cycle analysis
Table 5 shows the CO2 emissions for zucchini and lettuce production. The total CO2 emission values for the two-crops cycle were the highest in COF GM- as compared to the other treatments, followed by MWC GM+ (-4% than COF GM-) and AD GM+ (- 7 % than COF GM-), whereas OWC GM+ showed the lowest emissions (-9% than COF GM-). On the average of all the five treatment combinations, the input that caused the highest CO2 emission was the water for irrigation (37.9%), followed by fertilizers (23.6 %) and fuels (14.7 %). The emission associated to the fertilizers varied across the treatments from 29.6 % of COF GM- to 19.3 % of OWC GM+. Furthermore, since no chemicals were used in both cropping cycles, they did not contribute to GHG emissions and, therefore, they are not reported in the table.
Table 5. Greenhouse gases emissions of zucchini and lettuce productions divided by input categories (kg CO2 eq. ha-1 year-1). AD = co-composted anaerobic digestate; OWC = re-composted olive wastes compost; MWC = municipal solid waste compost; COF= commercial organic fertilizer; GM+ = green manure; GM- = no green manure.
AD GM+
OWC
GM+
MWC
GM+
MWC
GM-
COF
GM-
Inputs kg CO2 eq
ha-1 year-1 %
kg CO2
eq ha-1
year-1
%
kg CO2
eq ha-1
year-1
%
kg CO2
eq ha-1
year-1
%
kg CO2
eq ha-1
year-1
%
Human
labor 204 6.5 186 6.0 196 6.0 164 5.2 211 6.2
Machinery 256 8.1 256 8.3 256 7.8 229 7.3 229 6.7
Fuels 514 16.3 508 16.4 511 15.5 409 13.1 413 12.1
Fertilizers 640 20.3 598 19.3 778 23.7 778 24.9 1007 29.6
Irrigation
equipment 330 10.4 330 10.7 330 10.0 330 10.6 330 9.7
Water 1215 38.5 1215 39.3 1215 37.0 1215 38.9 1215 35.7
Total
emissions 3159
3092
3285
3125 3405
0
10
20
30
40
50
60
70
80
AD co-composting OWC re-composting
kg C
O2
eq. t
on-1 Moisture control
Compost turning
Ventilation
Mixture preparation
Raw materials
Figure 2. GHG emission values for AD and OWC composting processes divided by each treatmentoperation (kg CO2 eq t−1 compost produced).
3.2.2. Cropping Cycle Analysis
Table 5 shows the CO2 emissions for zucchini and lettuce production. The total CO2 emissionvalues for the two-crops cycle were the highest in COF GM− as compared to the other treatments,followed by MWC GM+ (−4% than COF GM−) and AD GM+ (−7% than COF GM−), whereas OWCGM+ showed the lowest emissions (−9% than COF GM−). On the average of all the five treatmentcombinations, the input that caused the highest CO2 emission was the water for irrigation (37.9%),followed by fertilizers (23.6%) and fuels (14.7%). The emission associated to the fertilizers varied acrossthe treatments from 29.6% of COF GM− to 19.3% of OWC GM+. Furthermore, since no chemicals wereused in both cropping cycles, they did not contribute to GHG emissions and, therefore, they are notreported in the table.
Table 5. Greenhouse gases emissions of zucchini and lettuce productions divided by input categories(kg CO2 eq. ha−1 year−1). AD = co-composted anaerobic digestate; OWC = re-composted olive wastescompost; MWC = municipal solid waste compost; COF = commercial organic fertilizer; GM+ = greenmanure; GM− = no green manure.
AD GM+ OWC GM+ MWC GM+ MWC GM− COF GM−
Inputs kg CO2 eqha−1 year−1 % kg CO2 eq
ha−1 year−1 % kg CO2 eqha−1 year−1 % kg CO2 eq
ha−1 year−1 % kg CO2 eqha−1 year−1 %
Human labor 204 6.5 186 6.0 196 6.0 164 5.2 211 6.2Machinery 256 8.1 256 8.3 256 7.8 229 7.3 229 6.7
Fuels 514 16.3 508 16.4 511 15.5 409 13.1 413 12.1Fertilizers 640 20.3 598 19.3 778 23.7 778 24.9 1007 29.6
Irrigation equipment 330 10.4 330 10.7 330 10.0 330 10.6 330 9.7Water 1215 38.5 1215 39.3 1215 37.0 1215 38.9 1215 35.7
Total emissions 3159 3092 3285 3125 3405
Among the different agricultural operations (Table 6), the highest value of total GHG emissions,as overall average, was found for irrigation (37.9%). Moreover, fertilization (24.4%) and irrigationsystem preparation (10.4%) showed high values.
The data on N2O-based CO2 emission from soils revealed that the sum of GWP from zucchini andlettuce cultivation was the highest in MWC GM+, followed by AD GM+ and OWC GM+ (Table 7).The 60.5% of the GWP derived from the direct emissions, while the 39.5% derived from the indirectemissions (leaching and volatilization). Moreover, the GWP related to GM− was −27% than theGM+ treatment.
Sustainability 2019, 11, 3824 11 of 17
Table 6. Greenhouse gases emissions of zucchini and lettuce productions divided by crop operation(kg CO2 eq. ha−1 year−1). AD = co-composted anaerobic digestate; OWC = re-composted olive wastescompost; MWC = municipal solid waste compost; COF = commercial organic fertilizer; GM+ = greenmanure; GM− = no green manure.
Crop Operations AD GM+ OWC GM+ MWC GM+ MWC GM− COF GM−
kg CO2 eq.ha−1 year−1 % kg CO2 eq.
ha−1 year−1 % kg CO2 eq.ha−1 year−1 % kg CO2 eq.
ha−1 year−1 % kg CO2 eq.ha−1 year−1 %
Tillage 61 1.9 61 2 61 1.9 82 2.6 82 2.4Harrowing/seedbed
preparation 304 9.6 304 10 304 9.3 304 9.7 304 8.9
Irrigation systemspreparation 333 10.5 333 11 333 10.1 333 10.6 333 9.8
Fertilization 670 21.2 628 20 808 24.6 808 25.9 1025 30.1Irrigation 1216 38.5 1216 39 1216 37.0 1216 38.9 1216 35.7
Planting/sowing 72 2.3 72 2 72 2.2 30 1.0 30 0.9Weeds control 48 1.5 48 2 48 1.5 48 1.5 48 1.4
Biomass chopping 200 6.3 200 6 200 6.1 100 3.2 100 2.9Harvest 254 8.0 229 7 242 7.4 204 6.5 267 7.8
Table 7. Direct and indirect CO2 equivalent (kgCO2 eq. ha−1) emission derived from N2O.
N2O Based CO2 eq.Emissions
AD GM+ OWC GM+ MWC GM+ MWC GM− COF GM−
kg CO2 eq.ha−1 year−1
kg CO2 eq.ha−1 year−1
kg CO2 eq.ha−1 year−1
kg CO2 eq.ha−1 year−1
kg CO2 eq.ha−1 year−1
Direct emissions 1555 1511 1571 1063 1150Indirect emissions 1006 979 1016 711 763
Leaching emission 933 906 942 638 690Volatilization
emission 73 73 73 73 73
Total GWP 2561 2490 2586 1774 1914
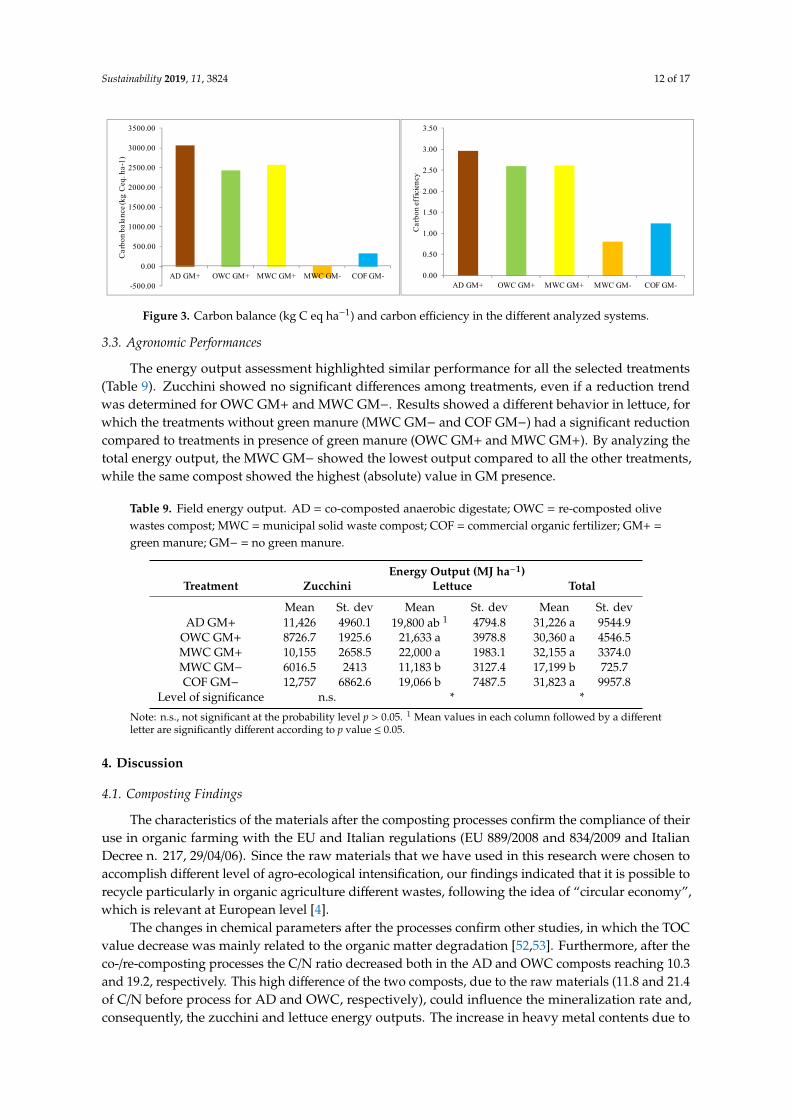
The highest Carbon input was found in MWC GM+, which was higher by −3% and −5% than ADGM+ and OWC GM+, respectively (Table 8). The fertilization strategy influenced C output and ADGM+ had the highest value, followed by MWC GM+ and OWC GM+ (Table 8).
Table 8. Carbon input (kg C eq. ha−1) and output (kg C eq. ha−1) in the different analyzed systems.AD = co-composted anaerobic digestate; OWC = re- composted olive wastes compost; MWC =
municipal solid waste compost; COF = commercial organic fertilizer; GM+ = green manure; GM− = nogreen manure.
Parameters AD GM+ OWC GM+ MWC GM+ MWC GM− COF GM−
Carbon input (CI) 1560 1522 1601 1336 1450carbon eq. during cropcultivation operations 861.5 843.3 895.9 852.3 928.5
carbon eq. N2O 698.5 679.1 705.3 483.9 521.9Carbon output (CO) 4620 3945 4174 1060 1780carbon in the products 1229 1157 1152 657.7 1213
carbon in the greenmanure and residues 3391 2788 3021 402.3 567.1
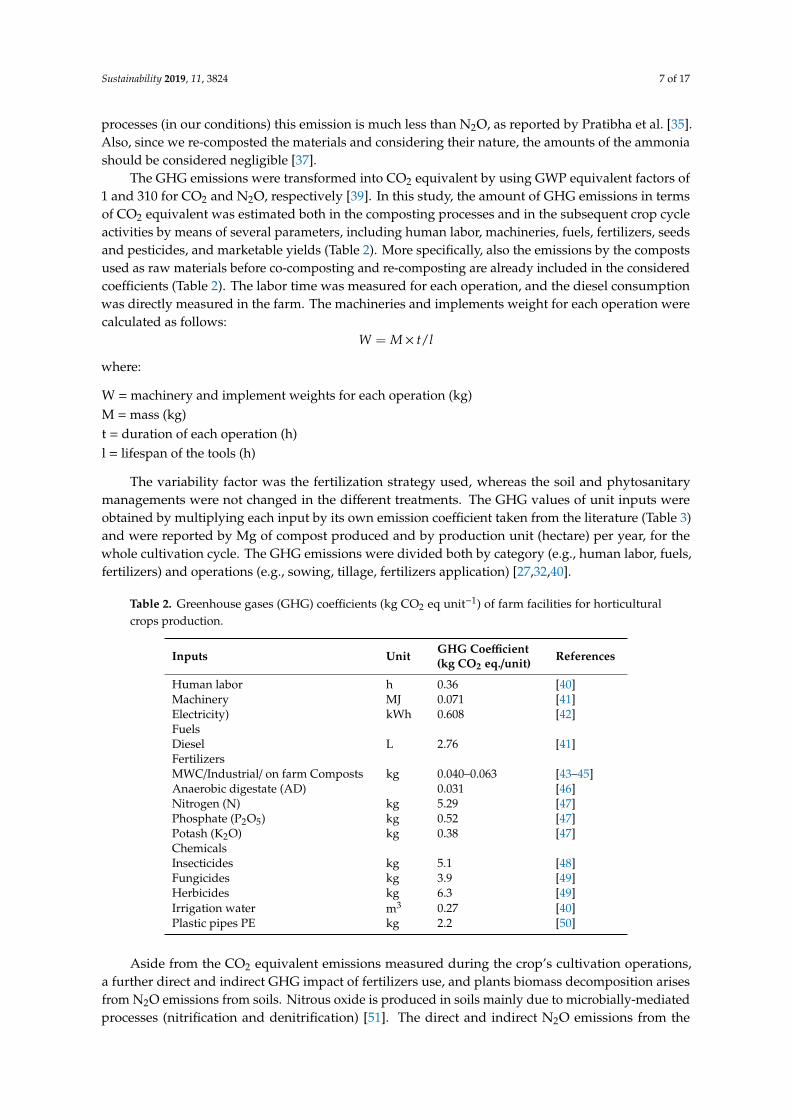
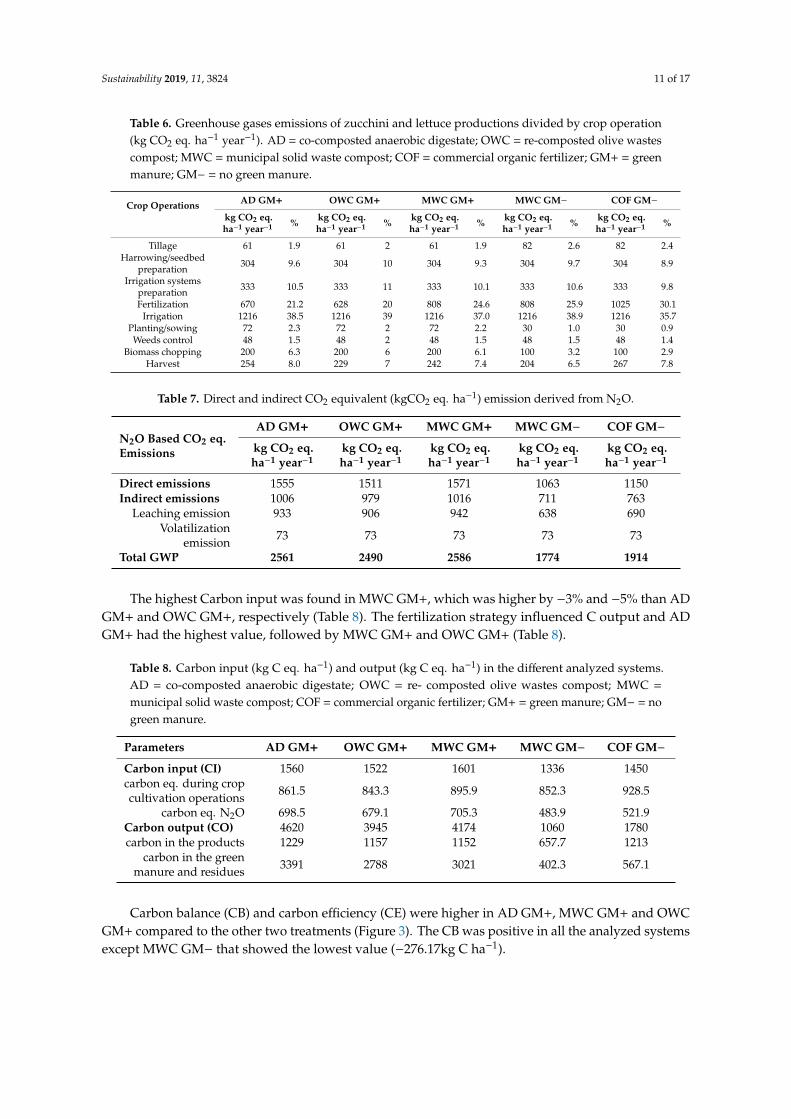
Carbon balance (CB) and carbon efficiency (CE) were higher in AD GM+, MWC GM+ and OWCGM+ compared to the other two treatments (Figure 3). The CB was positive in all the analyzed systemsexcept MWC GM− that showed the lowest value (−276.17kg C ha−1).
Sustainability 2019, 11, 3824 12 of 17
Sustainability 2019, 11, x FOR PEER REVIEW 12 of 18
Table 8. Carbon input (kg C eq. ha−1) and output (kg C eq. ha−1) in the different analyzed systems. AD= co-composted anaerobic digestate; OWC= re- composted olive wastes compost; MWC= municipal solid waste compost; COF= commercial organic fertilizer; GM+= green manure; GM-= no green manure.
Parameters AD
GM+ OWC GM+
MWC GM+
MWC GM-
COF GM-
Carbon input (CI) 1560 1522 1601 1336 1450
carbon eq. during crop cultivation operations 861.5 843.3 895.9 852.3 928.5
carbon eq. N2O 698.5 679.1 705.3 483.9 521.9
Carbon output (CO) 4620 3945 4174 1060 1780
carbon in the products 1229 1157 1152 657.7 1213
carbon in the green manure and residues 3391 2788 3021 402.3 567.1
Carbon balance (CB) and carbon efficiency (CE) were higher in AD GM+, MWC GM+ and OWC GM+ compared to the other two treatments (figure 3). The CB was positive in all the analyzed systems except MWC GM- that showed the lowest value (-276.17kg C ha−1).
Figure 3. Carbon balance (kg C eq ha−1) and carbon efficiency in the different analyzed systems.
3.3. Agronomic performances
The energy output assessment highlighted similar performance for all the selected treatments (Table 9). Zucchini showed no significant differences among treatments, even if a reduction trend was determined for OWC GM+ and MWC GM-. Results showed a different behavior in lettuce, for which the treatments without green manure (MWC GM- and COF GM-) had a significant reduction compared to treatments in presence of green manure (OWC GM+ and MWC GM+). By analyzing the total energy output, the MWC GM- showed the lowest output compared to all the other treatments, while the same compost showed the highest (absolute) value in GM presence.
-500.00
0.00
500.00
1000.00
1500.00
2000.00
2500.00
3000.00
3500.00
AD GM+ OWC GM+ MWC GM+ MWC GM- COF GM-
Car
bon
bala
nce (
kg C
eq. h
a-1)
0.00
0.50
1.00
1.50
2.00
2.50
3.00
3.50
AD GM+ OWC GM+ MWC GM+ MWC GM- COF GM-
Car
bon
effic
ienc
y
Figure 3. Carbon balance (kg C eq ha−1) and carbon efficiency in the different analyzed systems.
3.3. Agronomic Performances
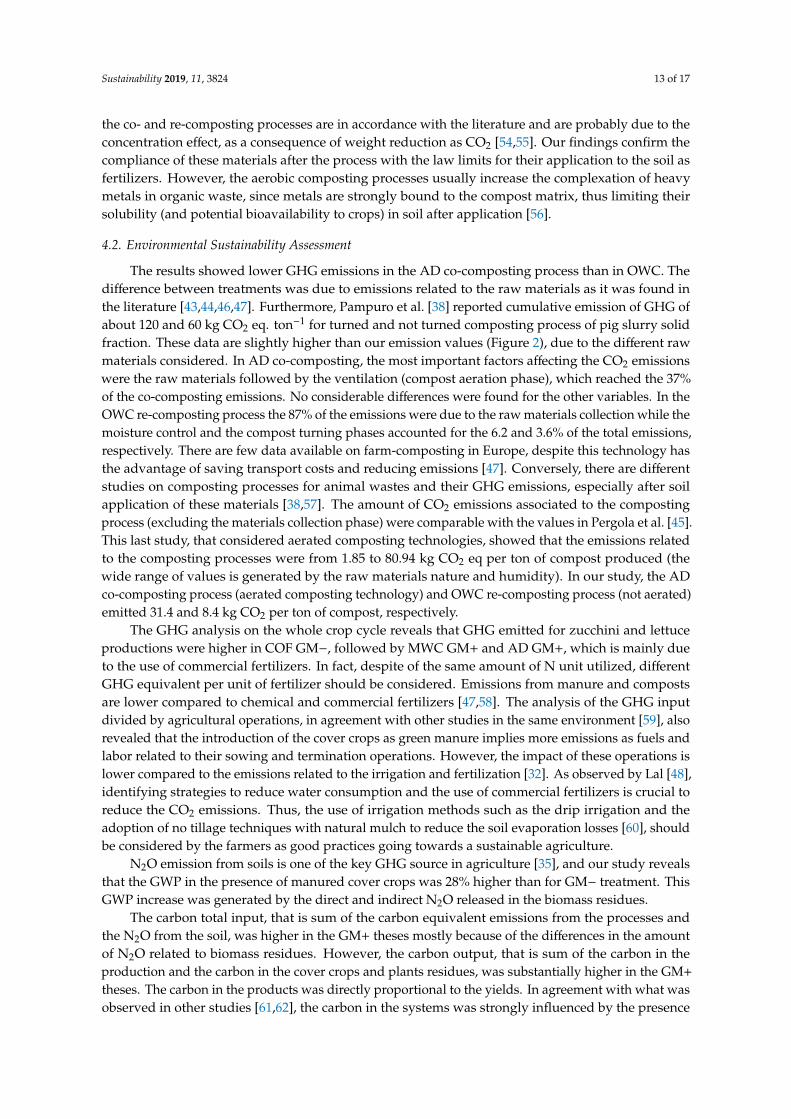
The energy output assessment highlighted similar performance for all the selected treatments(Table 9). Zucchini showed no significant differences among treatments, even if a reduction trendwas determined for OWC GM+ and MWC GM−. Results showed a different behavior in lettuce, forwhich the treatments without green manure (MWC GM− and COF GM−) had a significant reductioncompared to treatments in presence of green manure (OWC GM+ and MWC GM+). By analyzing thetotal energy output, the MWC GM− showed the lowest output compared to all the other treatments,while the same compost showed the highest (absolute) value in GM presence.
Table 9. Field energy output. AD = co-composted anaerobic digestate; OWC = re-composted olivewastes compost; MWC = municipal solid waste compost; COF = commercial organic fertilizer; GM+ =
green manure; GM− = no green manure.
Energy Output (MJ ha−1)Treatment Zucchini Lettuce Total
Mean St. dev Mean St. dev Mean St. devAD GM+ 11,426 4960.1 19,800 ab 1 4794.8 31,226 a 9544.9
OWC GM+ 8726.7 1925.6 21,633 a 3978.8 30,360 a 4546.5MWC GM+ 10,155 2658.5 22,000 a 1983.1 32,155 a 3374.0MWC GM− 6016.5 2413 11,183 b 3127.4 17,199 b 725.7COF GM− 12,757 6862.6 19,066 b 7487.5 31,823 a 9957.8
Level of significance n.s. * *
Note: n.s., not significant at the probability level p > 0.05. 1 Mean values in each column followed by a differentletter are significantly different according to p value ≤ 0.05.
4. Discussion
4.1. Composting Findings
The characteristics of the materials after the composting processes confirm the compliance of theiruse in organic farming with the EU and Italian regulations (EU 889/2008 and 834/2009 and ItalianDecree n. 217, 29/04/06). Since the raw materials that we have used in this research were chosen toaccomplish different level of agro-ecological intensification, our findings indicated that it is possible torecycle particularly in organic agriculture different wastes, following the idea of “circular economy”,which is relevant at European level [4].
The changes in chemical parameters after the processes confirm other studies, in which the TOCvalue decrease was mainly related to the organic matter degradation [52,53]. Furthermore, after theco-/re-composting processes the C/N ratio decreased both in the AD and OWC composts reaching 10.3and 19.2, respectively. This high difference of the two composts, due to the raw materials (11.8 and 21.4of C/N before process for AD and OWC, respectively), could influence the mineralization rate and,consequently, the zucchini and lettuce energy outputs. The increase in heavy metal contents due to
Sustainability 2019, 11, 3824 13 of 17
the co- and re-composting processes are in accordance with the literature and are probably due to theconcentration effect, as a consequence of weight reduction as CO2 [54,55]. Our findings confirm thecompliance of these materials after the process with the law limits for their application to the soil asfertilizers. However, the aerobic composting processes usually increase the complexation of heavymetals in organic waste, since metals are strongly bound to the compost matrix, thus limiting theirsolubility (and potential bioavailability to crops) in soil after application [56].
4.2. Environmental Sustainability Assessment
The results showed lower GHG emissions in the AD co-composting process than in OWC. Thedifference between treatments was due to emissions related to the raw materials as it was found inthe literature [43,44,46,47]. Furthermore, Pampuro et al. [38] reported cumulative emission of GHG ofabout 120 and 60 kg CO2 eq. ton−1 for turned and not turned composting process of pig slurry solidfraction. These data are slightly higher than our emission values (Figure 2), due to the different rawmaterials considered. In AD co-composting, the most important factors affecting the CO2 emissionswere the raw materials followed by the ventilation (compost aeration phase), which reached the 37%of the co-composting emissions. No considerable differences were found for the other variables. In theOWC re-composting process the 87% of the emissions were due to the raw materials collection while themoisture control and the compost turning phases accounted for the 6.2 and 3.6% of the total emissions,respectively. There are few data available on farm-composting in Europe, despite this technology hasthe advantage of saving transport costs and reducing emissions [47]. Conversely, there are differentstudies on composting processes for animal wastes and their GHG emissions, especially after soilapplication of these materials [38,57]. The amount of CO2 emissions associated to the compostingprocess (excluding the materials collection phase) were comparable with the values in Pergola et al. [45].This last study, that considered aerated composting technologies, showed that the emissions relatedto the composting processes were from 1.85 to 80.94 kg CO2 eq per ton of compost produced (thewide range of values is generated by the raw materials nature and humidity). In our study, the ADco-composting process (aerated composting technology) and OWC re-composting process (not aerated)emitted 31.4 and 8.4 kg CO2 per ton of compost, respectively.
The GHG analysis on the whole crop cycle reveals that GHG emitted for zucchini and lettuceproductions were higher in COF GM−, followed by MWC GM+ and AD GM+, which is mainly dueto the use of commercial fertilizers. In fact, despite of the same amount of N unit utilized, differentGHG equivalent per unit of fertilizer should be considered. Emissions from manure and compostsare lower compared to chemical and commercial fertilizers [47,58]. The analysis of the GHG inputdivided by agricultural operations, in agreement with other studies in the same environment [59], alsorevealed that the introduction of the cover crops as green manure implies more emissions as fuels andlabor related to their sowing and termination operations. However, the impact of these operations islower compared to the emissions related to the irrigation and fertilization [32]. As observed by Lal [48],identifying strategies to reduce water consumption and the use of commercial fertilizers is crucial toreduce the CO2 emissions. Thus, the use of irrigation methods such as the drip irrigation and theadoption of no tillage techniques with natural mulch to reduce the soil evaporation losses [60], shouldbe considered by the farmers as good practices going towards a sustainable agriculture.
N2O emission from soils is one of the key GHG source in agriculture [35], and our study revealsthat the GWP in the presence of manured cover crops was 28% higher than for GM− treatment. ThisGWP increase was generated by the direct and indirect N2O released in the biomass residues.
The carbon total input, that is sum of the carbon equivalent emissions from the processes andthe N2O from the soil, was higher in the GM+ theses mostly because of the differences in the amountof N2O related to biomass residues. However, the carbon output, that is sum of the carbon in theproduction and the carbon in the cover crops and plants residues, was substantially higher in the GM+
theses. The carbon in the products was directly proportional to the yields. In agreement with what wasobserved in other studies [61,62], the carbon in the systems was strongly influenced by the presence
Sustainability 2019, 11, 3824 14 of 17
of green manure. The data reveals that carbon balance was higher in GM+ theses and the AD GM+
was the most sustainable system. Although the carbon efficiency was higher in AD GM+, confirmingan increase of the ecosystem C pool by raising the carbon outputs with the introduction of the covercrops and the organic fertilizers, exploiting the use efficiency of carbon input and decreasing losses arecrucial for sustainable horticultural productions [32,35,48].
4.3. Agronomic Performances
Our findings highlighted similar results for all the selected treatments, pointing out the evidencethat all the studied combinations of green manure and fertilizers are equivalent in terms of energeticoutput of the system. More specifically, in the zucchini crop the energy output (absolute value) ofthe AD GM+ treatment was comparable with COF GM−. This would indicate that the co-compostedmaterial could be a possible alternative to commercial organic amendment without reducing the energyoutput, at least in the short-time period. In lettuce crop, the opposite trend of energy output wasfound, and in particular the OWC GM+ and MWC GM+ showed the statistically significant highestvalues. This result was a consequence of the residual fertilization effects of these composts comparedto commercial and AD treatments, probably due to the difference of mineralization rate (C/N ratio ofthe materials). Despite this, our results evidence a higher trend for combination of organic fertilizerswith green manure. This is in accordance with several authors, underlying the role of cover crops inyield production, limiting possible risks of nitrogen immobilization or delayed release of nutrients,often associated to application of soil amendments (e.g., compost) as fertilizers [18,63]. The absenceof differences among the combinations of organic fertilizer with green manure and the commercialorganic one (COF) highlighted the feasibility of co-composted AD and re-composted OWC to substitutethe standard system.
5. Conclusions
In a global climate change context and considering the increase of anthropogenic greenhouse gasemissions, the environmental sustainability of agricultural systems may be enhanced with increasedcarbon-based input use efficiency. Agro-industrial wastes and feedstock management throughcomposting processes have the potential to generate GHG emissions due to the composting processesand materials transportation. However, these processes generate positive effects both directly, throughthe carbon sequestration, and indirectly due to the avoided impacts of waste disposal, improved soilquality and minimized soil loss.
The findings of this study revealed that horticultural systems, if well managed in organic farmingfollowing an agro-ecological approach (combining green manuring and biofertilizers use), can haveconsiderable and positive effects on the control of GHG emissions, mainly due to a carbon sequestrationpotential. The holistic approach that considers not only the anthropogenic emissions but also the effecton the resources used in the systems and the outcome on the environment, represents the base for theimplementation of environmental-friendly organic horticultural productions. Moreover, the results onthe agronomic performances (total energy output) showed that the yield gaps between the theses withdifferent level of agro-ecological intensification and the control thesis with COF may be negligible.
Author Contributions: Conceptualization, M.D., A.P., E.T., F.M. and C.C.; Collection and analysis of the data,A.P., E.T. and C.C.; writing—original draft preparation, M.D., A.P., E.T., F.M. and C.C; writing—review andediting, M.D.
Funding: This research was funded by the European Commission’s Horizon 2020 Research and InnovationProgramme (2014–2020)—Sustainable techno-economic solutions for the agricultural value chain (AgroCycle),under Grant Agreement n. 690142.
Acknowledgments: The authors wish to acknowledge the work of Angelo Fiore, Rosalba Scazzarriello, MarcoFavale, and Angelo Raffaele Quaranta for technical assistance and field management.
Sustainability 2019, 11, 3824 15 of 17
Conflicts of Interest: The authors declare no conflict of interest. The funders had no role in the design of thestudy; in the collection, analyses, or interpretation of data; in the writing of the manuscript, or in the decision topublish the results.
References
1. Spiertz, J.H.J.; Ewert, F. Crop production and resource use to meet the growing demand for food, feed andfuel: Opportunities and constraints. NJAS Wagen. J. Life Sci. 2009, 56, 281–300. [CrossRef]
2. Tomich, T.P.; Brodt, S.; Ferris, H.; Galt, R.; Horwath, W.R.; Kebreab, E.; Leveau, J.H.J.; Liptzin, D.; Lubell, M.;Merel, P.; et al. Agroecology: A review from a global-change perspective. Annu. Rev. Environ. Resour. 2011,36, 193–222. [CrossRef]
3. Mirabella, N.; Castellani, V.; Sala, S. Current options for the valorization of food manufacturing waste:A review. J. Clean. Prod. 2014, 65, 28–41. [CrossRef]
4. European Commission. Closing the Loop—An. EU Action Plan for the Circular Economy; COM (2015) 614 Final;European Commission: Brussels, Belgium, 2015.
5. Corrado, S.; Sala, S. Food waste accounting along global and European food supply chains: State of the artand outlook. Waste Manag. 2018, 79, 120–131. [CrossRef] [PubMed]
6. Pavwelczyk, A. EU policy and legislation on recycling of organic wastes to agriculture. In Proceedings of the12th International Congress International Society for Animal Hygiene, Warsaw, Poland, 4–8 September 2005;Volume 1.
7. Kosseva, M.R. Processing of food wastes; Chapter 3. Adv. Food Nutr. Res. 2009, 58, 57–136.8. European Commission. Communication from the Commission to the European Parliament, the Council, the European
Economic and Social Committee and the Committee of the Regions Innovating for Sustainable Growth: A Bio Economyfor Europe; COM (2012) 60 Final; European Commission: Brussels, Belgium, 2012.
9. European Commission. A Sustainable Bioeconomy for Europe: Strengthening the Connection between Economy,Society and the Environment. Updated Bioeconomy Strategy; Directorate-General for Research and InnovationUnit F—Bioeconomy: Brussels, Belgium, 2018; ISBN 978-92-79-94145-0. [CrossRef]
10. Westerman, P.W.; Bicudo, J.R. Management considerations for organic waste use in agriculture. Bioresour.Technol. 2005, 96, 215–221. [CrossRef] [PubMed]
11. Kasapidou, E.; Sossidou, E.; Mitlianga, P. Fruit and vegetable co-products as functional feed ingredients infarm animal nutrition for improved product quality. Agriculture 2015, 5, 1020–1034. [CrossRef]
12. Toop, T.A.; Ward, S.; Oldfield, T.; Hull, M.; Kirby, M.E.; Theodorou, M.K. AgroCycle—Developing a circulareconomy in agriculture. Energy Proc. 2017, 123, 76–80. [CrossRef]
13. Möller, K.; Müller, T. Effects of anaerobic digestion on digestate nutrient availability and crop growth:A review. Eng. Life Sci. 2012, 12, 242–257. [CrossRef]
14. Hao, X.; Ben, W.T.; Nelson, V. Agronomic values of anaerobically digested cattle manure and the separatedsolids for barley forage production. Soil Sci. Soc. Am. J. 2016, 80, 1572–1584. [CrossRef]
15. Torres-Climent, A.; Martin-Mata, J.; Marhuenda-Egea, F.; Moral, R.; Barber, X.; Perez-Murcia, M.D.; Paredes, C.Composting of the solid phase of digestate from biogas production: Optimization of the moisture, C/N ratio,and pH conditions. Commun. Soil Sci. Plant. Anal. 2015, 46, 197–207. [CrossRef]
16. Oreopoulou, V.; Russ, W. Utilization of Byproducts and Treatment of Waste in the Food Industry; Springer: NewYork, NY, USA, 2007.
17. Pampuro, N.; Caffaro, F.; Cavallo, E. Reuse of animal manure: A case study on stakeholders’ perceptionsabout pelletized compost in northwestern Italy. Sustainability 2018, 10, 2028. [CrossRef]
18. Montemurro, F.; Ciaccia, C.; Leogrande, R.; Ceglie, F.; Diacono, M. Suitability of different organic amendmentsfrom agro-industrial wastes in organic lettuce crops. Nutr. Cycl. Agroecosyst. 2015, 102, 243–252. [CrossRef]
19. Diacono, M.; Ferri, D.; Ciaccia, C.; Tittarelli, F.; Ceglie, F.; Verrastro, V.; Ventrella, D.; Vitti, C.; Montemurro, F.Bioassays and application of olive pomace compost on emmer: Effects on yield and soil properties in organicfarming. Acta Agr. Scand. Sect. B Soil Plant Sci. 2012, 62, 510–518. [CrossRef]
20. Altieri, R.; Esposito, A. Evaluation of the fertilizing effect of olive mill waste compost in short-term crops.Int. Biodeterior. Biodegrad. 2010, 64, 124–128. [CrossRef]
Sustainability 2019, 11, 3824 16 of 17
21. Montemurro, F.; Vitti, C.; Diacono, M.; Canali, S.; Tittarelli, F.; Ferri, D. A three-year field anaerobic digestatesapplication: Effects on fodder crops performance and soil properties. Fresen. Environ. Bull. 2010, 19,2087–2093.
22. Montemurro, F.; Tittarelli, F.; Lopedota, O.; Verrastro, V.; Diacono, M. Agronomic performance of experimentalfertilizers on spinach (Spinacia oleracea L.) in organic farming. Nutr. Cycl. Agroecosyst. 2015, 102, 227–241.[CrossRef]
23. Toscano, P.; Casacchia, T.; Diacono, M.; Montemurro, F. Composted olive mill by-products: Compostcharacterization and application on olive orchards. J. Agr. Sci. Tech. Iran 2013, 15, 627–638.
24. Ciaccia, C.; Montemurro, F.; Campanelli, G.; Diacono, M.; Fiore, A.; Canali, S. Legume cover crop managementand organic amendments application: Effects on organic zucchini performance and weed competition.Sci. Hortic. 2015, 185, 48–58. [CrossRef]
25. Montemurro, F.; Fiore, A.; Campanelli, G.; Tittarelli, F.; Ledda, L.; Canali, S. Organic fertilization, greenmanure, and vetch mulch to improve organic zucchini yield and quality. HortScience 2013, 48, 1027–1033.[CrossRef]
26. Vandermeersch, T.; Alvarenga, R.A.F.; Ragaert, P.; Dewulf, J. Environment sustainability assessment of foodwaste valorization options. Resour. Conserv. Recycl. 2014, 87, 57–64. [CrossRef]
27. Mohammadi-Barsari, A.; Firouzi, S.; Aminpanah, H. Energy-use pattern and carbon footprint of rain-fedwatermelon production in Iran. Inf. Process. Agric. 2016, 3, 69–75. [CrossRef]
28. Wiedmann, T.; Minx, J. A definition of ‘carbon footprint’. In Ecological Economics Research Trends; Pertsova, C.C.,Ed.; Nova Science Publisher, Inc.: New York, NY, USA, 2007; pp. 1–11.
29. UNESCO-FAO. Bioclimatic Map of the Mediterranean Zone; NS162/III, 22A; UNESCO: Paris, France; FAO:Rome, Italy, 1963; p. 60.
30. USDA-NRCS. Soil Survey Staff, Soil Taxonomy. A Basic System of Soil Classification for Making and InterpretingSoil Surveys; Agriculture Handbook 436; USDA-NRCS: Washington, DC, USA, 1999.
31. LECO Corporation. Instruction Manual—CHN—600 Elemental Analyzer for Macro-Samples System; LECOCorporation: St. Joseph, MI, USA, 1987; p. 49085.
32. Persiani, A.; Diacono, M.; Monteforte, A.; Montemurro, F. Agronomic performance, energy analysis andcarbon balance comparing different fertilization strategies in horticulture under Mediterranean conditions.Env. Sci. Pollut. Res. 2019, 26, 19250–19260. [CrossRef] [PubMed]
33. Ozkan, B.; Akcaoz, H.; Fert, C. Energy input–output analysis in Turkish agriculture. Renew. Energy 2004, 29,39–51. [CrossRef]
34. USDA. United States Department of Agriculture Agricultural Research Service National Nutrient. Databasefor Standard Reference Legacy Release 2019. Available online: https://ndb.nal.usda.gov/ndb/ (accessed on11 July 2019).
35. Pratibha, G.; Srinivas, I.; Rao, K.V.; Raju, B.M.K.; Thyagaraj, C.R.; Korwar, G.R.; Venkateswarlu, B.; ArunShanker, K.; Deepak Choudhary, K.; Srinivas Rao, K.; et al. Impact of conservation agriculture practices onenergy use efficiency and global warming potential in rainfed pigeonpea-castor systems. Eur. J. Agron. 2015,66, 30–40. [CrossRef]
36. Luske, B. Reduced GHG Emissions Due to Compost Production and Compost use in Egypt Comparing Two Scenarios:2010–2016; LbD; Louis Bolk Instituut: Bunnik, The Netherlands, 2010; p. 30.
37. Broun, S.; Kruger, C.; Subler, S. Greenhouse gas balance for composting operations. J. Env. Qual 2008, 37,1396–1410. [CrossRef]
38. Pampuro, N.; Dinuccio, E.; Balsari, P.; Cavallo, E. Evaluation of two composting strategies for making pigslurry solid fraction suitable for pelletizing. Atmos. Pollut. Res. 2016, 7, 288–293. [CrossRef]
39. Intergovernmental Panel on Climate Change (IPCC). IPCC Guidelines for National Greenhouse Gas Inventories.Agriculture, Forestry and other Land Use; IPCC: Paris, France, 2006; Volume 4.
40. Ozalp, A.; Yilmaz, S.; Ertekin, C.; Yilmaz, I. Energy analysis and emissions of greenhouse gases of pomegranateproduction in Antalya province of Turkey. Erwerbs-Obstbau 2018, 60, 321–329. [CrossRef]
41. Dyer, J.A.; Desjardins, R.L. Simulated farm fieldwork, energy consumption and related greenhouse gasemissions in Canada. Biosyst. Eng. 2003, 85, 503–513. [CrossRef]
42. Khoshnevisan, B.; Rafiee, S.; Omid, M.; Yousefi, M.; Movahedi, M. Modeling of energy consumption andGHG (greenhouse gas) emissions in wheat production in Esfahan province of Iran using artificial neuralnetworks. Energy 2013, 52, 333–338. [CrossRef]
Sustainability 2019, 11, 3824 17 of 17
43. Cadena, E.; Colón, J.; Artola, A.; Sánchez, A.; Font, X. Environmental impact of two aerobic compostingtechnologies using life cycle assessment. Int. J. Life Cycle. Assess. 2009, 14, 401–410. [CrossRef]
44. Fiore, A.; Lardo, E.; Montanaro, G.; Laterza, D.; Loiudice, C.; Berloco, T.; Dichio, B.; Xiloyannis, C. Mitigationof global warming impact of fresh fruit production through climate smart management. J. Clean Prod. 2018,172, 3634–3643. [CrossRef]
45. Pergola, M.; Persiani, A.; Palese, A.M.; Di Meo, V.; Pastore, V.; D’Adamo, C.; Celano, C. Composting: Theway for a sustainable agriculture. Appl. Soil Ecol. 2018, 123, 744–750. [CrossRef]
46. Møller, J.; Boldrin, A.; Christensen, T.H. Anaerobic digestion and digestate use: Accounting of greenhousegases and global warming contribution. Waste Manag. Res. 2009, 27, 813–824. [CrossRef] [PubMed]
47. Smith, A.; Brown, K.; Bates, J.; Ogilvie, S.; Rushton, K. Waste Management Options and Climate Change. FinalReport to the European Commission; DG Environment, AEA Technology: Abingdon, UK, 2001; p. 224.
48. Lal, R. Carbon emission from farm operations. Environ. Int. 2004, 30, 981–990. [CrossRef] [PubMed]49. Graefe, S.; Tapasco, J.; Gonzalez, A. Resource use and greenhouse gas emissions of eight tropical fruits
species cultivated in Colombia. Fruits 2013, 68, 303–314. [CrossRef]50. Martinez-Mate, M.A.; Martin-Gorriz, B.; Martínez-Alvarez, V.; Soto-García, M.; Maestre-Valero, J.F.
Hydroponic system and desalinated seawater as an alternative farm productive proposal in water scarcityareas: Energy and greenhouse gas emissions analysis of lettuce production in southeast Spain. J. Clean Prod.2018, 172, 1298–1310. [CrossRef]
51. Mosier, A.R. Nitrous oxide emissions from agricultural soils. In Proceedings of Methane and Nitrous Oxide—Methodsof National Emissions Inventories and Options for Control; RIVM: Dordrecht, The Netherlands, 1994.
52. Montemurro, F.; Diacono, M.; Vitti, C.; Debiase, G. Biodegradation of olive husk mixed with other agriculturalwastes. Bioresour. Technol. 2009, 100, 2969–2974. [CrossRef]
53. Paredes, C.; Bernal, M.P.; Cegarra, J.; Roig, A. Bio-degradation of olive mill wastewater sludge by itsco-composting with agricultural wastes. Bioresour. Technol. 2002, 85, 1–8. [CrossRef]
54. Zheng, G.D.; Gao, D.; Chen, T.B.; Luo, W. Stabilization of nickel and chromium in sewage sludge duringaerobic composting. J. Hazard. Mater. 2007, 142, 216–221. [CrossRef]
55. Tandy, S.; Healey, J.R.; Nason, M.A.; Williamson, J.C.; Jones, D.L. Heavy metal fractionation during theco-composting of biosolids, deinking paper fibre and green waste. Bioresour. Technol. 2009, 100, 4220–4226.[CrossRef] [PubMed]
56. Smith, S.R. A critical review of the bioavailability and impacts of heavy metals in municipal solid wastecomposts compared to sewage sludge. Environ. Int. 2009, 35, 142–156. [CrossRef] [PubMed]
57. Pampuro, N.; Busato, P.; Cavallo, E. Gaseous emission after soil application of pellet made from compostedpig slurry solid fraction: Effect of application method and pellet diameter. Agriculture 2018, 8, 119. [CrossRef]
58. Stout, B.A. Handbook of Energy for World Agriculture; Elsevier: New York, NY, USA, 1990.59. Diacono, M.; Persiani, A.; Canali, S.; Montemurro, F. Agronomic performance and sustainability indicators
in organic tomato combining different agro-ecological practices. Nutr. Cycl. Agroecosyst. 2018, 112, 101–117.[CrossRef]
60. Diacono, M.; Ciaccia, C.; Canali, S.; Fiore, A.; Montemurro, F. Assessment of agro-ecological service cropmanagements combined with organic fertilisation strategies in organic melon crop. Ital. J. Agron. 2018, 13,951. [CrossRef]
61. Mandal, B.; Majumder, B.; Bandyopadhyay, P.K.; Hazra, G.C.; Gangopadhyay, A.; Samantaray, R.N.;Mishra, A.K.; Chaudhury, J.; Saha, M.N.; Kundu, S. The potential of cropping systems and soil amendmentsforcarbon sequestration in soils under long-term experiments in sub-tropical India. Glob. Chang. Biol. 2007,13, 357–369. [CrossRef]
62. Lardo, E.; Fiore, A.; Quinto, G.A.; Dichio, B.; Xiloyannis, C. Climate change mitigation role of orchardagroecosystems: Case studies in Southern Italy. Acta Hortic. 2018, 1216, 13–18. [CrossRef]
63. Diacono, M.; Montemurro, F. Long-term effects of organic amendments on soil fertility. A review.Agron. Sustain. Dev. 2010, 30, 401–422. [CrossRef]
© 2019 by the authors. Licensee MDPI, Basel, Switzerland. This article is an open accessarticle distributed under the terms and conditions of the Creative Commons Attribution(CC BY) license (http://creativecommons.org/licenses/by/4.0/).