Embed Size (px)
Citation preview
Recurrent, Robust and Scalable Patterns Underlie HumanApproach and AvoidanceByoung Woo Kim1,2., David N. Kennedy3", Joseph Lehar4", Myung Joo Lee1,2", Anne J. Blood1,2,5", Sang
Lee1,2", Roy H. Perlis6,7, Jordan W. Smoller7, Robert Morris1, Maurizio Fava6, Hans C. Breiter1,2,5*., for the
Phenotype Genotype Project in Addiction and Mood Disorders (PGP)
1 Motivation and Emotion Neuroscience Collaboration (MENC), Athinoula A. Martinos Center for Biomedical Imaging, Department of Radiology, Massachusetts General
Hospital and Harvard Medical School, Boston, Massachusetts, United States of America, 2 Laboratory of Neuroimaging and Genetics, Department of Psychiatry,
Massachusetts General Hospital and Harvard Medical School, Boston, Massachusetts, United States of America, 3 Center for Morphometric Analysis, Department of
Neurology, Massachusetts General Hospital and Harvard Medical School, Boston, Massachusetts, United States of America, 4 Department of Bioinformatics, Boston
University, Boston, Massachusetts, United States of America, 5 Mood and Motor Control Laboratory, Department of Psychiatry, Massachusetts General Hospital and
Harvard Medical School, Boston, Massachusetts, United States of America, 6 Depression Clinic and Research Program, Department of Psychiatry, Massachusetts General
Hospital and Harvard Medical School, Boston, Massachusetts, United States of America, 7 Psychiatric and Neurodevelopmental Genetics Unit of the Center for Human
Genetic Research, Massachusetts General Hospital and Harvard Medical School, Boston, Massachusetts, United States of America
Abstract
Background: Approach and avoidance behavior provide a means for assessing the rewarding or aversive value of stimuli,and can be quantified by a keypress procedure whereby subjects work to increase (approach), decrease (avoid), or donothing about time of exposure to a rewarding/aversive stimulus. To investigate whether approach/avoidance behaviormight be governed by quantitative principles that meet engineering criteria for lawfulness and that encode known featuresof reward/aversion function, we evaluated whether keypress responses toward pictures with potential motivational valueproduced any regular patterns, such as a trade-off between approach and avoidance, or recurrent lawful patterns asobserved with prospect theory.
Methodology/Principal Findings: Three sets of experiments employed this task with beautiful face images, a standardizedset of affective photographs, and pictures of food during controlled states of hunger and satiety. An iterative modelingapproach to data identified multiple law-like patterns, based on variables grounded in the individual. These patterns wereconsistent across stimulus types, robust to noise, describable by a simple power law, and scalable between individuals andgroups. Patterns included: (i) a preference trade-off counterbalancing approach and avoidance, (ii) a value function linkingpreference intensity to uncertainty about preference, and (iii) a saturation function linking preference intensity to itsstandard deviation, thereby setting limits to both.
Conclusions/Significance: These law-like patterns were compatible with critical features of prospect theory, the matchinglaw, and alliesthesia. Furthermore, they appeared consistent with both mean-variance and expected utility approaches tothe assessment of risk. Ordering of responses across categories of stimuli demonstrated three properties thought to berelevant for preference-based choice, suggesting these patterns might be grouped together as a relative preference theory.Since variables in these patterns have been associated with reward circuitry structure and function, they may provide amethod for quantitative phenotyping of normative and pathological function (e.g., psychiatric illness).
Citation: Kim BW, Kennedy DN, Lehar J, Lee MJ, Blood AJ, et al. (2010) Recurrent, Robust and Scalable Patterns Underlie Human Approach and Avoidance. PLoSONE 5(5): e10613. doi:10.1371/journal.pone.0010613
Editor: Jan Lauwereyns, Kyushu University, Japan
Received February 8, 2010; Accepted April 8, 2010; Published May 26, 2010
Copyright: � 2010 Kim et al. This is an open-access article distributed under the terms of the Creative Commons Attribution License, which permits unrestricteduse, distribution, and reproduction in any medium, provided the original author and source are credited.
Funding: This work was supported by grants to HCB (#14118, 026002, 026104) from the National Institute on Drug Abuse, and grants (DABK39-03-0098 &DABK39-03-C-0098; The MGH Phenotype Genotype Project in Addiction and Mood Disorder) from the Office of National Drug Control Policy - CounterdrugTechnology Assessment Center, Washington, D.C. Further support, in part, was provided to HCB by the MGH Department of Radiology, and the National Centerfor Research Resources (P41RR14075). Other support was provided to DNK by the National Institute of Neurological Disorders and Stroke (#34189), and to SJB bythe National Institute of Neurological Disorders and Stroke (#052368). The funders had no role in study design, data collection and analysis, decision to publish,or preparation of the manuscript.
PLoS ONE | www.plosone.org 1 May 2010 | Volume 5 | Issue 5 | e10613
Competing Interests: Dr. Perlis has has received research support, advisory or consulting fees, or speaking fees or honoraria from AstraZeneca, Bristol-Myers Squibb,Eli Lilly, Elan/Eisai, GlaxoSmithKline, Pfizer, and U.S. Pharmaceuticals Group and has equity holdings in and patents for Concordant Rater Systems, LLC. Dr. Smoller hasreceived honoraria from Hoffman-La Roche, Inc, and served on an advisory board for Roche Diagnostics Corporation. He has consulted to Eli Lilly, the Herman DanaTrust and RTI, International. Dr. Fava has received research support from: Abbott Laboratories, Alkermes, Aspect Medical Systems, Astra-Zeneca, BioResearch,BrainCells, Inc., Bristol-Myers Squibb Company, Cephalon, Clinical Trial Solutions,LLC, Eli Lilly & Company, EnVivo Pharmaceuticals, Inc., Forest Pharmaceuticals Inc.,Ganeden, GlaxoSmithkline, J & J Pharmaceuticals, Lichtwer Pharma GmbH, Lorex Pharmaceuticals, NARSAD, NCCAM, NIDA, NIMH, Novartis, Organon Inc., PamLab, LLC,Pfizer Inc, Pharmavite, Roche, Sanofi-Aventis, Shire, Solvay Pharmaceuticals, Inc., Synthelabo, Wyeth-Ayerst Laboratories. He has performed advising/consultation with:Abbott Laboratories, Affectis Pharmaceuticals AG, Amarin, Aspect Medical Systems, Astra-Zeneca, Auspex Pharmaceuticals, Bayer AG, Best Practice ProjectManagement, Inc, BioMarin Pharmaceuticals, Inc.,Biovail Pharmaceuticals, Inc., BrainCells, Inc, Bristol-Myers Squibb Company, Cephalon, Clinical Trials Solutions,LLC,CNS Response, Compellis, Cypress Pharmaceuticals, Dov Pharmaceuticals, Eisai, Inc., Eli Lilly & Company, EPIX Pharmaceuticals, Euthymics Bioscience, Inc., Fabre-Kramer, Pharmaceuticals, Inc., Forest Pharmaceuticals Inc., GlaxoSmithKline, Grunenthal GmBH, Janssen Pharmaceutica, Jazz Pharmaceuticals, J & J Pharmaceuticals,Knoll Pharmaceutical Company, Labopharm, Lorex Pharmaceuticals, Lundbeck, MedAvante Inc., Merck, Methylation Sciences, Neuronetics, Novartis, Nutrition 21,Organon Inc., PamLab, LLC, Pfizer Inc, PharmaStar, Pharmavite, Precision Human Biolaboratory, Prexa Pharmaceuticals, Inc., PsychoGenics, Psylin Neurosciences, Inc.,Ridge Diagnostics, Inc., Roche, Sanofi-Aventis, Sepracor, Schering-Plough, Solvay Pharmaceuticals, Inc., Somaxon, Somerset Pharmaceuticals, Synthelabo, Takeda,Tetragenex, TransForm Pharmaceuticals, Inc., Transcept Pharmaceuticals, Vanda Pharmaceuticals Inc, Wyeth-Ayerst Laboratories. He has performed speaking for:Adamed, Co., Advanced Meeting Partners, American Psychiatric Association, American Society of Clinical Psychopharmacology, Astra-Zeneca, Belvoir, Boehringer-Ingelheim, Bristol-Myers Squibb Company, Cephalon, Eli Lilly & Company, Forest Pharmaceuticals Inc., GlaxoSmithKline, Imedex, Novartis, Organon Inc., Pfizer Inc,PharmaStar, MGH Psychiatry Academy/Primedia, MGH Psychiatry Academy/Reed-Elsevier, UBC, Wyeth-Ayerst Laboratories. He has equity holdings in Compellis, andreceives royalties and patent license returns for: Patent for SPCD and patent application for a combination of azapirones and bupropion in MDD, copyright royaltiesfor the MGH CPFQ, SFI, ATRQ, DESS, and SAFER.
* E-mail: [email protected]
. These authors contributed equally to this work.
" These authors also contributed equally to this work.
Introduction
Intentional behavior, across a spectrum of healthy and
disordered conditions such as addiction, is hypothesized to reflect
differences in judgment and decision-making around relative
preference [1]. Relative preference is defined by the variable
extent an individual will approach or avoid [2–4] commodities
and events based on their rewarding or aversive features [5,6]. It
can be expressed by the payment an individual makes to avoid a
perceived bad outcome, or approach a positive one. Consumers
undertake such transactions to optimize their utility (i.e., overall
satisfaction or well-being) based on relative preferences [7–11].
Prior study of relative preference (with variable degrees of
uncertainty) has calibrated ratings of personal utility against a
global framework such as the macroeconomic pricing of
commodities. This calibration has produced a value function that
is recurrent and grounds modern prospect theory [12,13].
Prospect theory informs us that subjective value or relative
preference is modeled by a value function that is convex for losses,
concave for gains, and steeper for losses than gains. This value
function is modulated by probabilistic information [7,12,13].
Approach and avoidance behavior can also be modeled by data
from a validated keypress procedure [14–21] that is used within an
intrinsic motivation-like framework in which no external rewards
are provided [22,23], yet participants can produce variable
amounts of work [24,25] to modulate the time of stimulus
viewing. As a variant of approaches used to study effort-
based decision-making [26–28] the keypress procedure appears
to quantify (i) decision-making regarding the valence of be-
havior (i.e., positive valence = approach, and negative valence =
avoidance) and (ii) judgments determining its magnitude (Figure 1)
[15,20,29]. These analogies aside, this procedure is not easily
connected to a global framework pricing commodities and other
behavioral economic constructs as it operates only within a person-
or agent-centric context. Keypress measures of approach and
avoidance can be connected to neural systems [14–16,18–20], as
has been done with prospect theory [30,31], and represent an
important methodology for bridging animal and human research
of reward/aversion processing [14,32] and neuroeconomics
[10,11,33–37].
Despite research to date, we do not know if there is a balance or
‘‘trade-off’’ between keypress measures of approach and avoid-
ance. We do not know if there are ‘‘limits’’ to approach and
avoidance keypressing analogous to the saturation observed in
neurophysiology with variance-mean relationships whereby the
graph ramps up to a maximum and then returns to baseline
minimum [38]. We also do not know how approach and
avoidance might interact to produce lawful patterns underlying
valuation as observed with prospect theory [7,12] or other theories
such as the matching law [39–41]. Are there patterns to approach
and avoidance that meet engineering criteria for lawfulness and
are consistent with established features of reward/aversion
behavior such as (i) the overweighting of losses relative to gains
[7,13,31], (ii) the relative apportionment or allocation of behavior
between two categories of reinforcement [39,40,42], or (iii)
alliesthesia or hedonic deficit effects [43–46]? These questions
framed the goal for this work of determining whether approach/
avoidance behavior is governed by quantitative principles that
meet engineering criteria for lawfulness, and encoded by known
features of reward/aversion function. Such findings would have
relevance for quantitative phenotyping and subtyping of psychi-
atric disorders [47–49] that have been connected to reward/
aversion circuitry [5,8,20,31,33,35–37,50–52] such as addiction
[53–56] and major depressive disorder [57–59].
To meet this goal, we performed three sets of experiments in
three distinct cohorts of healthy subjects, and analyzed the data
following an iterative modeling schema adapted from Banks and
Tran [60]. These model-free procedures were first applied to data
collected while viewing pictures of ‘‘beautiful’’ and ‘‘average’’ faces
(Supporting Information Figure 1 or Figure S1) [14]. Behavioral
patterns observed with beauty stimuli were then tested for
recurrency using two other stimulus sets, including (a) a well-
validated stimulus set, the International Affective Picture System
(IAPS) [61,62] (Figure S2) in an independent cohort of subjects,
and (b) a stimulus set of food pictures tested during conditions of
hunger and satiation in a third cohort of healthy subjects (Figure
S3). The iterative modeling approach sought to (a) identify
quantitative patterns between variables describing approach and
avoidance, (b) determine if these patterns met criteria for
recurrency (i.e., consistency across stimuli), robustness to noise,
and scalability, (c) characterize whether these patterns were
consistent with established features of reward/aversion function,
and (d) rule out any experimental confounds to these patterns,
including the possibility of trial-by-trial interactions [63].
These procedures resulted in observation and validation of a set
of patterns underlying human approach and avoidance that are
Law-Like Reward Patterns
PLoS ONE | www.plosone.org 2 May 2010 | Volume 5 | Issue 5 | e10613
law-like, and are consistent with critical features of prospect
theory, the matching law, and alliesthesia. These patterns appear
to scale between groups and individuals.
Results
The keypress task was first conducted using a stimulus set
associated with strong reward/aversion behavior, namely a
picture set of faces of men and women who were models or
non-models [i.e., beautiful female (BF), average female (AF),
beautiful male (BM), average male (AM) faces [14]. Any
relationships found to be recurrent for all four conditions in the
‘‘beauty’’ stimulus set were subsequently tested for recurrency
using two other stimulus sets in separate cohorts of subjects.
Starting with data from the beauty keypress experiments, we
graphed the relationship between approach and avoidance
measures (using a number of variables described in the next
paragraph) to determine if a ‘‘trade-off’’ or ‘‘limit’’ function could
be identified. We then tested relationships between (i) trade-off
plot variables and (ii) independent variables related to keypress
intensity, which might share features with established theories of
valuation. We assessed the mathematical fit of any graphical
structure (i.e., pattern) observed, how this fit scaled between
group and individual data, and whether the structure demon-
strated the signature of a power law. Graphical structure was
compared to simulated hypothetical data to rule out that any
observed structure was mathematically trivial, and any trade-off
plots were tested for robustness against noise. A number of
control analyses were also performed to facilitate interpretation of
findings. One such control analysis sought to assure that keypress
responses for any one picture were not influencing subsequent
keypress responses to other pictures through an analysis of
variance of trial-by-trial interactions.
For these analyses, we assessed a range of descriptive statistical
variables. Location measures included mean, median, and mode
of positive (approach) and negative (avoidance) keypressing, along
with maximum and minimum values in the data set. Dispersion
estimates included standard deviation and median-absolute
deviation. Given these dispersion estimates take into account
the range of responses around a reference point, and not the
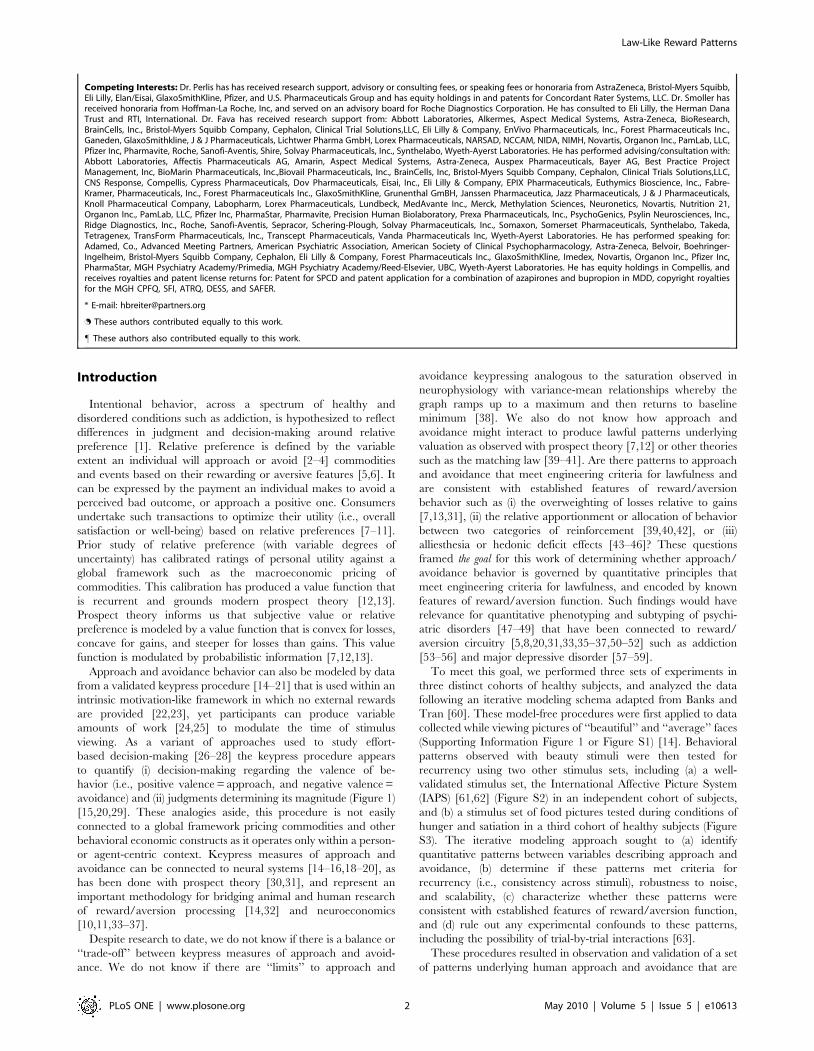
Figure 1. Experimental Design of Keypress Procedure. (a) This schematic illustrates the four potential responses to the stimuli: to increase, decrease,variably increase or decrease for the same image, or accept the default viewing time of 6 (+2) seconds. The default condition controls for subjects having anintention to keypress and alter viewing time, but not acting on this intention. (b) The traces of individual keypressing behavior to each picture are shown foran anonymous subject. Time intervals are color coded by experimental condition as follows: beautiful female (pink), average female (red), beautiful male(light blue), and average male (dark blue). Stimuli presentation was segregated by gender so that beautiful female faces did not bias all other responses (i.e.,responses to male faces). Each blue trace of actual keypress data is shown relative to the default baseline for viewing. (c) Viewing time relative to the defaulttime (location and standard errors) for the ensemble of BF, AF, BM, AM faces are shown as a bar graph.doi:10.1371/journal.pone.0010613.g001
Law-Like Reward Patterns
PLoS ONE | www.plosone.org 3 May 2010 | Volume 5 | Issue 5 | e10613
pattern of response within each experimental variable, such
measures may not be sensitive to qualitatively different behavioral
patterns. Entropy, signal-to-noise, and covariance variables were,
thus, assessed since they quantify the characteristics of response
pattern (e.g. the extent of irregularity/heterogeneity [64–66])
produced by underlying behavioral microvariables, and would
therefore be more sensitive to patterns in approach and
avoidance.
Approach/Avoidance Trade-offsFor group data, no consistent pattern was observed in the
graphs between location measures (e.g., mean, median, mode,
minimum, maximum) of positive (approach) and negative
(avoidance) keypressing across the four categories of faces (i.e.,
BF, AF, BM, AM faces). Nor were graphical patterns (e.g.,
manifold, function or envelope) observed for group data with the
standard deviation and median-absolute deviation. Absent pat-
terns at the level of group data for these variables, linear fitting of
individual data suggested patterns across the four experimental
conditions (i.e., categories of faces) for both the mean K+ð Þ and
standard deviation variables s+ð Þ. These patterns, though,
displayed significant heterogeneity (i.e., inconsistency), with a
broad range of values and both positive and negative slopes for
subsets of individuals. Hence, 12 of 77 subjects had positive slopes
for Kz,K{f g graphs, with a mean of 1.1662.11 and range of
5.50 (or an angle of 79.7u between minimum and maximum),
whereas 65 of 77 subjects had negative slopes for Kz,K{f ggraphs, with a mean of 22.8561.98 and range of 11.21 (or an
angle of 81.5u between minimum and maximum). For sz,s{f ggraphs, 50 of 77 had positive slopes, with a mean of 3.4163.04
and range of 14.56 (or an angle of 86.1u between minimum and
maximum), whereas 27 of 77 had negative slopes, with a mean of
23.4863.42 and range of 17.10 (or an angle of 82.7u between
minimum and maximum).
In contrast to these results with location and dispersion variables,
consistent patterns were observed for graphs with group data using
pattern variables such as (i) signal to noise ratios SNR+ð Þ, (ii)
covariance estimates CoV+ð Þ, and (iii) Shannon entropy H+ð Þestimates [67] (Figure 2a; Figure S4). All of these patterns for
SNRz,SNR{f g, CoVz,CoV{f g, and Hz,H{f g plots were
recurrent across BF, AF, BM, and AM face stimuli (representing
one simplex manifolds for H+ and CoV+ estimates, and a
boundary envelope for the SNR+ estimate). Spectra for the radial
distribution of the Hz,H{f g graphs for the BF, AF, BM, and AM
faces exhibited similar central tendencies when superimposed
(Figure 2b), and were amenable to Gaussian fitting, although t
location-scale fitting was the most accurate (Figure S5; Supporting
Information File S1 Section I). These SNRz,SNR{f g,CoVz,CoV{f g, and Hz,H{f g patterns were present both with
keypress data and with total view time data (Figure S6), ruling out
resistive function effects.
The mathematical description of the Hz,H{f g plot was the
simplest of the three pattern variables (i.e., easiest to parameterize),
with a central tendency approximated by r~ffiffiffiffiffiffiffiffiffiffiffiffiffiffiffiffiffiffiffiffiH2
zzH2{
p&log2N,
where r = radius from the origin and N = the number of pictures in
the experimental condition (Figure 2a; Supporting Information File
S1 Section II, Pattern 1). The mathematical descriptions of
SNRz,SNR{f g, CoVz,CoV{f g, and Hz,H{f g graphs were
similar at the scale of the group and at the scale of the individual for
the BF, AF, BM, and AM faces (Figure 2c), albeit with differing
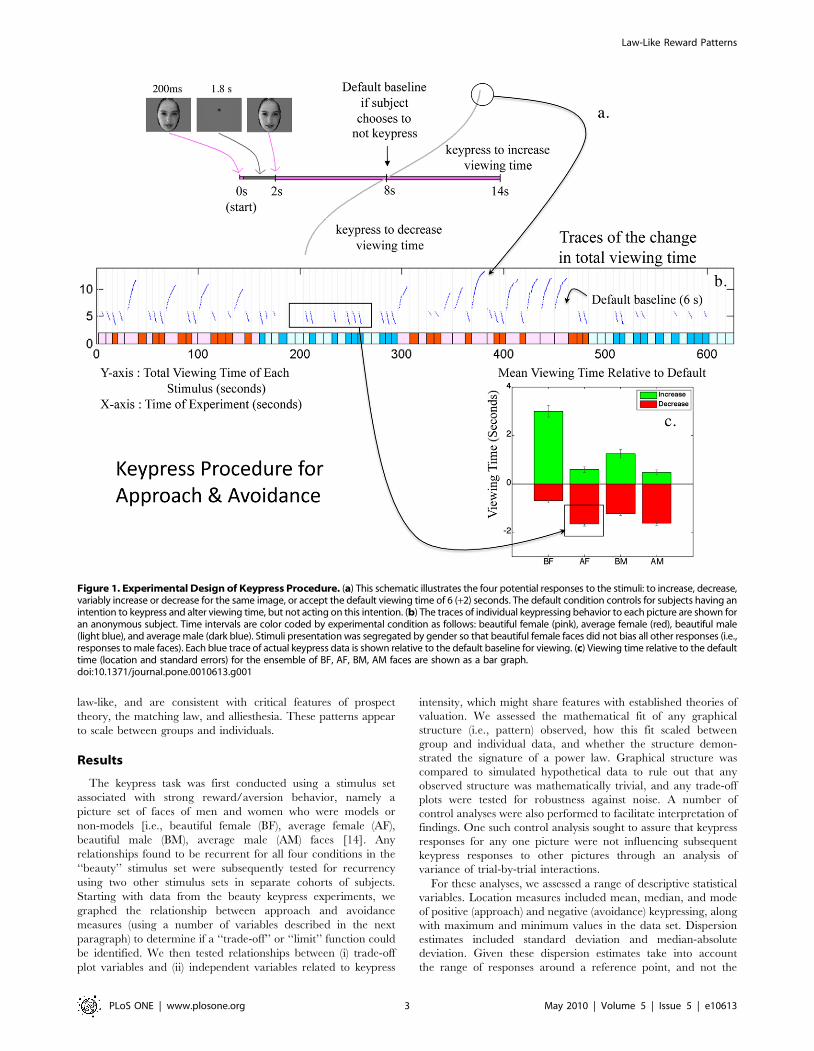
Figure 2. Preference Uncertainty Trade-off. (a) shows a graph of Hz (y axis) vs. H{ (x axis) for BF, AF, BM, AM faces in 77 healthy controlsubjects [experimental conditions (i.e., stimulus categories) are color coded as indicated in (b)]. The central tendency of the Hz,H{f g manifold is
approximated by a black quarter-circle, with its dispersion via crossbars and mathematical formulation as r~ffiffiffiffiffiffiffiffiffiffiffiffiffiffiffiffiffiffiffiffiffiH2
zzH2{
q&log2N , where N = the
number of items in the experimental condition. Spectra for the radial probability distributions of responses to the BF, AF, BM, AM faces aresuperimposed in (b). Given 20 items for each set of faces, this plot produces a distribution centered on 4.32 bits. In (c), the Hz,H{f g data for fourcategories of faces are plotted for one individual.doi:10.1371/journal.pone.0010613.g002
Law-Like Reward Patterns
PLoS ONE | www.plosone.org 4 May 2010 | Volume 5 | Issue 5 | e10613
parameter fits. With either group or individual data, angular
distribution along these manifolds signaled a trade-off in approach
and avoidance bias (Figure 3).
Simulation of behavior limited to only approach or avoid-
ance, and thus yoked between these two (i.e., a theoretical case
in which subjects could not accept the default position or switch
between approach and avoidance behaviors), showed that this
response profile would approximate the inner distribution of the
Hz,H{f g trade-off plot (Figure 3: red dashed line without dots;
see Supporting Information File S1 Section III). The outer
distribution of the Hz,H{f g trade-off plot was approximated
by variance-matched Gaussian noise (see below), and by subjects
(in the right upper corner of the plot) who used both increasing
and decreasing keypresses to variable extents for the same
stimulus item. Individuals falling far internal to the manifold
(i.e., on the H+ and H2 axes, or clustered far inside the arc of r)
represented individuals who accepted the default viewing time
at least once.
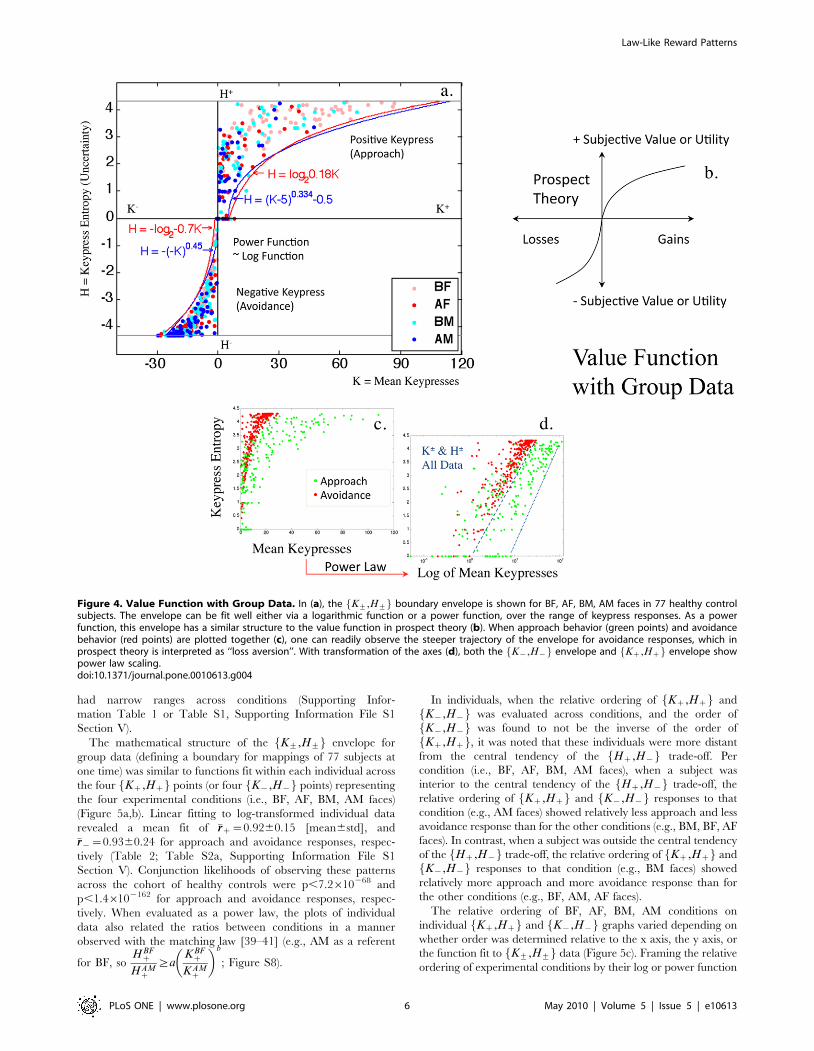
Other Relationships with Trade-off VariablesMean Keypress Intensity (K) and Trade-off
Variables. Graphs of group data for K+,SNR+f g, K+,CoV+f g,and K+,H+f g produced distributions with well-delineated
envelopes (Figure 4a; Figure S7a–d), that were recurrent for
BF, AF, BM, AM faces. Please see Methods, and Supporting
Information File S1 Section IV (for example with K+,H+f g)regarding the fitting of envelopes versus functions. The
K+,H+f g envelope resembled the value function for prospect
theory (Figure 4b), in that it encoded an increased steepness for
avoidance relative to approach responses, which is interpreted as
‘‘loss aversion’’ in prospect theory [7,13,31]. When the
coordinate system of the K+,H+f g ‘‘value function’’ was
converted to a semi-log scale (given the Shannon entropy
already included a logarithmic computation), it became linear
(Figure 4c,d), with the signature of a power law [68–70]. Linear
fits of the log-transformed group data revealed an �rrz that ranged
between 0.64 and 0.81, and an �rr{ that ranged between 0.81 and
0.92 for approach and avoidance responses, respectively (Table 1).
Although the K+,H+f g value function could be represented as a
logarithmic function (H+§azb log K+zcð Þ) or a power
function (H+§a K+zcð Þbzd) (Figure 4a; Supporting Infor-
mation File S1 Section II, Pattern 2; Supporting Information File
S1 Section IV), scaling the argument K by a constant factor in
H+§a K+zcð Þbzd caused a proportionate scaling of H
[71,72]. Furthermore, with power law scaling, the ratios of
slopes and intercept offsets for K+,H+f g envelopes
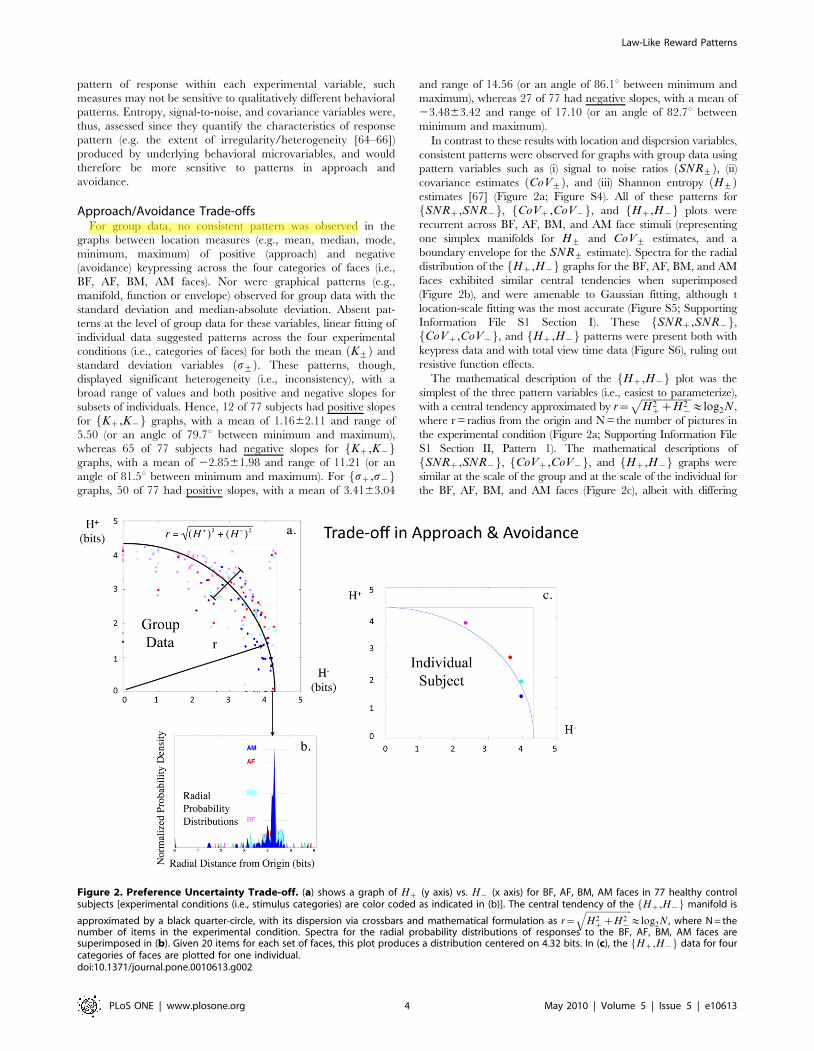
Figure 3. Interpretation of Trade-off Plot. This cartoon provides an example of possible keypress patterns that fall at six different positions onthe Hz,H{f g manifold, using data from six subjects toward the same 20 BM faces (F1–F20) for increasing viewing time (data are shown forapproach only). For the six approach graphs shown, the x-axis represents the 20 faces in an experimental condition (i.e. BF, AF, BM, AM), and the y-axis represents the number of keypresses toward that face picture. The Shannon entropy was computed using data in this format (see Methods,Analyses, Descriptive Statistical Measures). To schematize the balance of approach Hz and avoidance H{, one might imagine a matching of graphs#1 with #6, #2 with #5, and #3 with #4, where one graph represents the keypress responses for approach Hz and the other avoidance H{. Forthe purposes of illustration, we assigned zero values here to Hz in sub-figure #6. For each sub-figure (#1–6) above and to the right of theHz,H{f g manifold, data has been auto-scaled to optimize the pattern display. Overall, this graph represents relative approach or avoidance bias
along the polar angle, whereas the extent of indifference/conflict an individual feels toward an experimental condition (i.e. BF, AF, BM, or AM) isdistributed in radial fashion from the origin.doi:10.1371/journal.pone.0010613.g003
Law-Like Reward Patterns
PLoS ONE | www.plosone.org 5 May 2010 | Volume 5 | Issue 5 | e10613
had narrow ranges across conditions (Supporting Infor-
mation Table 1 or Table S1, Supporting Information File S1
Section V).
The mathematical structure of the K+,H+f g envelope for
group data (defining a boundary for mappings of 77 subjects at
one time) was similar to functions fit within each individual across
the four Kz,Hzf g points (or four K{,H{f g points) representing
the four experimental conditions (i.e., BF, AF, BM, AM faces)
(Figure 5a,b). Linear fitting to log-transformed individual data
revealed a mean fit of �rrz~0.9260.15 [mean6std], and
�rr{~0.9360.24 for approach and avoidance responses, respec-
tively (Table 2; Table S2a, Supporting Information File S1
Section V). Conjunction likelihoods of observing these patterns
across the cohort of healthy controls were p,7.2610268 and
p,1.46102162 for approach and avoidance responses, respec-
tively. When evaluated as a power law, the plots of individual
data also related the ratios between conditions in a manner
observed with the matching law [39–41] (e.g., AM as a referent
for BF, soHBF
z
HAMz
§aKBF
z
KAMz
� �b
; Figure S8).
In individuals, when the relative ordering of Kz,Hzf g and
K{,H{f g was evaluated across conditions, and the order of
K{,H{f g was found to not be the inverse of the order of
Kz,Hzf g, it was noted that these individuals were more distant
from the central tendency of the Hz,H{f g trade-off. Per
condition (i.e., BF, AF, BM, AM faces), when a subject was
interior to the central tendency of the Hz,H{f g trade-off, the
relative ordering of Kz,Hzf g and K{,H{f g responses to that
condition (e.g., AM faces) showed relatively less approach and less
avoidance response than for the other conditions (e.g., BM, BF, AF
faces). In contrast, when a subject was outside the central tendency
of the Hz,H{f g trade-off, the relative ordering of Kz,Hzf g and
K{,H{f g responses to that condition (e.g., BM faces) showed
relatively more approach and more avoidance response than for
the other conditions (e.g., BF, AM, AF faces).
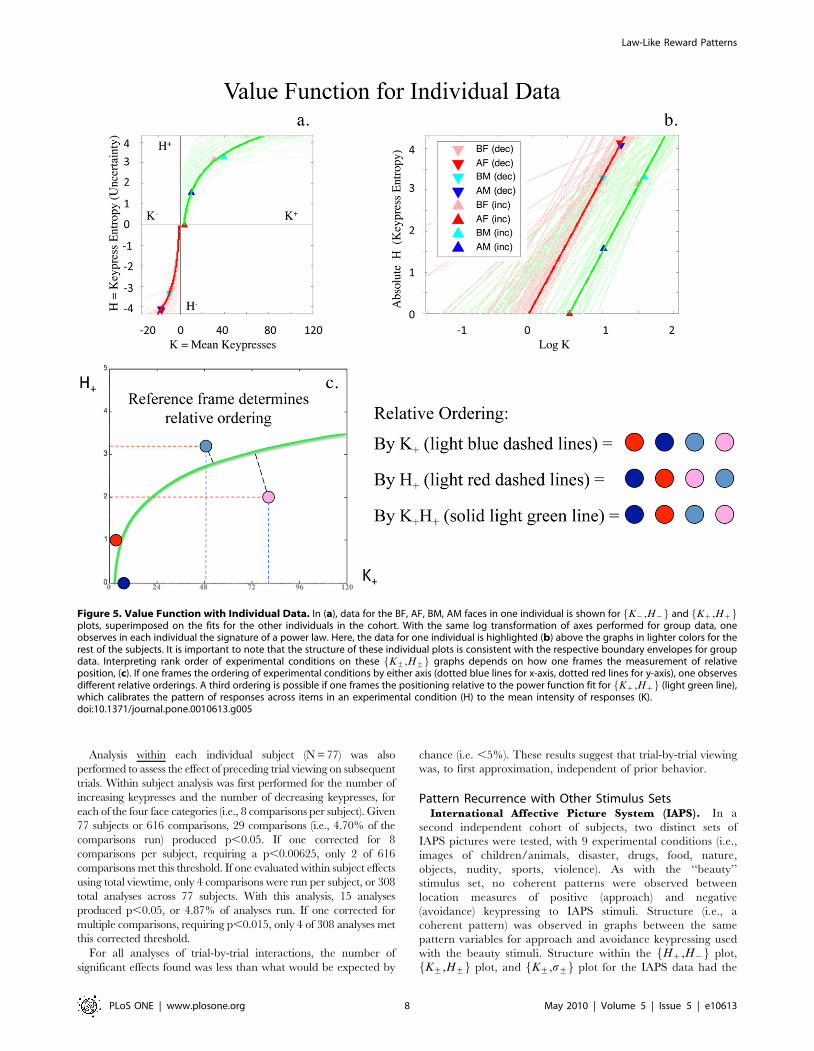
The relative ordering of BF, AF, BM, AM conditions on
individual Kz,Hzf g and K{,H{f g graphs varied depending on
whether order was determined relative to the x axis, the y axis, or
the function fit to K+,H+f g data (Figure 5c). Framing the relative
ordering of experimental conditions by their log or power function
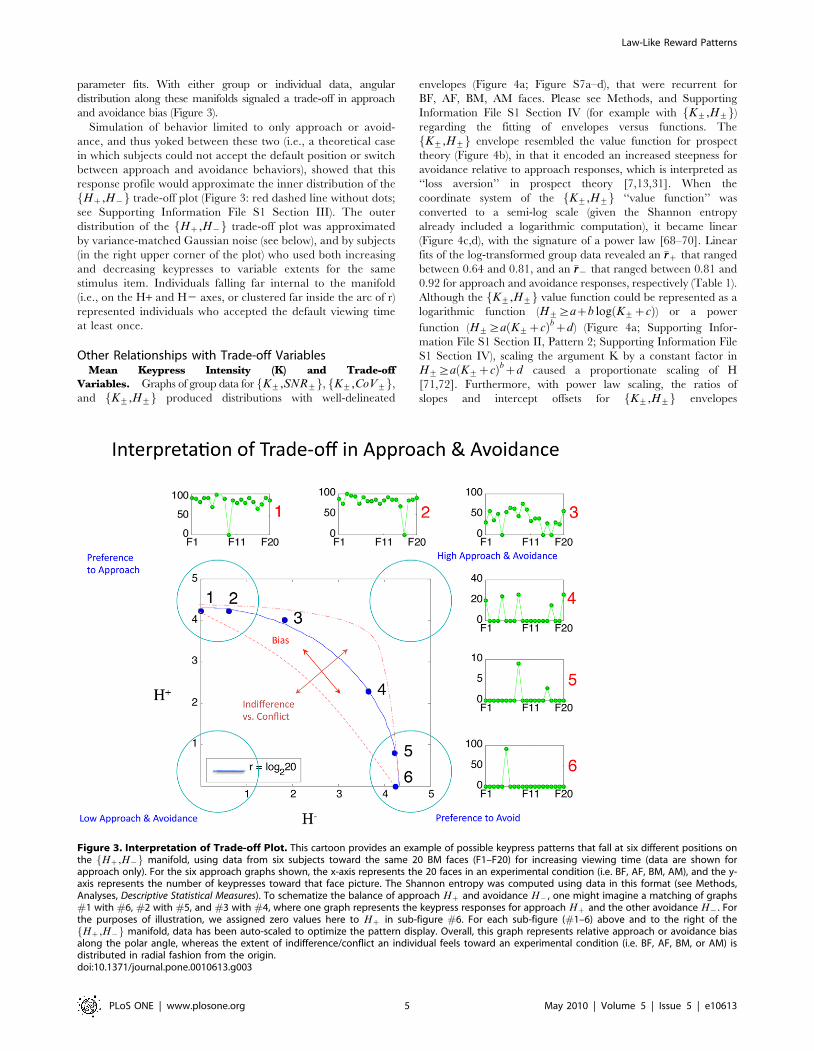
Figure 4. Value Function with Group Data. In (a), the K+,H+f g boundary envelope is shown for BF, AF, BM, AM faces in 77 healthy controlsubjects. The envelope can be fit well either via a logarithmic function or a power function, over the range of keypress responses. As a powerfunction, this envelope has a similar structure to the value function in prospect theory (b). When approach behavior (green points) and avoidancebehavior (red points) are plotted together (c), one can readily observe the steeper trajectory of the envelope for avoidance responses, which inprospect theory is interpreted as ‘‘loss aversion’’. With transformation of the axes (d), both the K{,H{f g envelope and Kz,Hzf g envelope showpower law scaling.doi:10.1371/journal.pone.0010613.g004
Law-Like Reward Patterns
PLoS ONE | www.plosone.org 6 May 2010 | Volume 5 | Issue 5 | e10613
fits could be determined by connecting each condition to their
K+,H+f g function over an absolute minimum distance. Using
this approach, three types of properties (i–iii) were observed in the
ordering across the BF, AF, BM, AM conditions. (i) For the
Kz,Hzf g graphs, each condition showed an asymmetry of
ordering such that for any two conditions A,Bð Þ, one observed
either AwB?: BwAð Þ (condition ‘‘A’’ was greater than ‘‘B’’
implied the opposite was also not true, namely it was not the case
that ‘‘B’’ was greater than ‘‘A’’) or A*B?B*A (condition ‘‘A’’
and ‘‘B’’ were similar if they were graphically superimposed). (ii)
Within the Kz,Hzf g pattern, all conditions showed
A§B _ B§A (there was a complete ordering so that either ‘‘A’’
was greater than or equal to ‘‘B’’, or ‘‘B’’ was greater than or equal
to ‘‘A’’, so that across all four face conditions there were 16
potential orderings). (iii) Within the Kz,Hzf g pattern, all
conditions showed transitivity of ordering in that
A§B ^ B§C?A§C (across all face conditions, if condition
‘‘A’’ was greater or equal to ‘‘B’’, and ‘‘B’’ equal to or greater than
‘‘C’’, then ‘‘A’’ was greater or equal to ‘‘C’’ given their Kz,Hzf grelationships). These properties of asymmetry, completeness, and
transitivity observed with each Kz,Hzf g graph, were also
observed for each K{,H{f g graph, and are considered properties
of preference relationships [73].
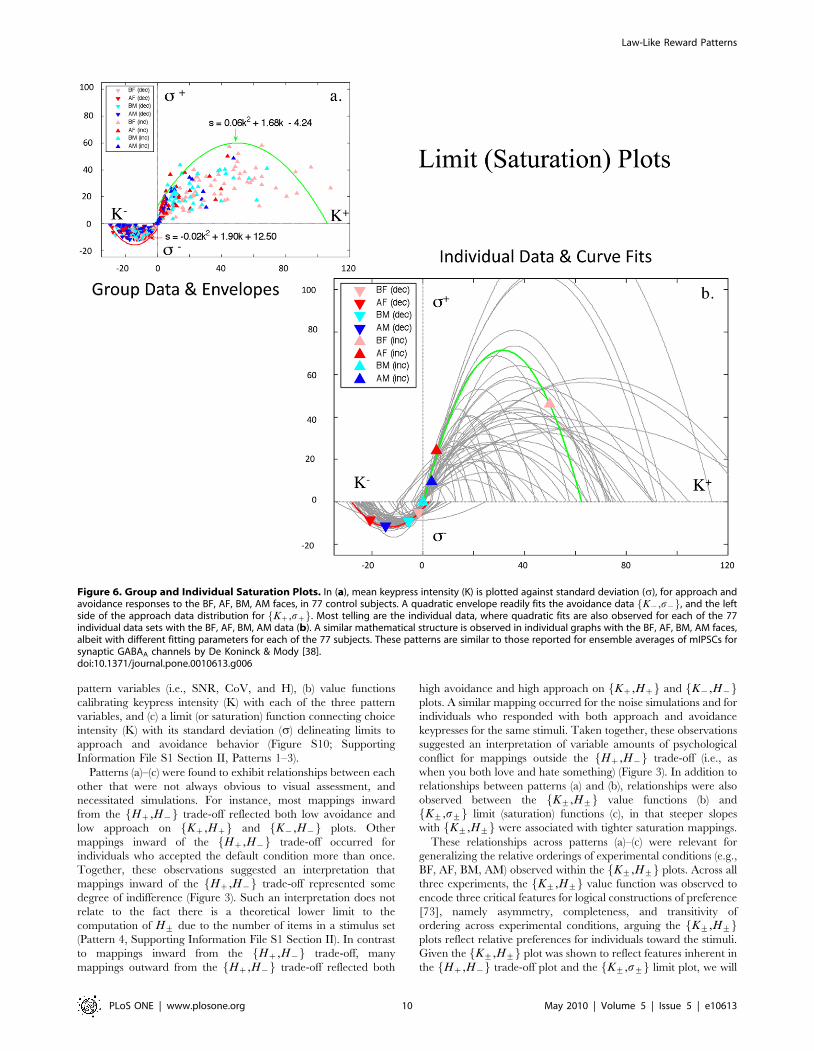
Mean Keypress Intensity (K) and Standard Deviation
(s). The pattern variables SNR, CoV, and H all have
relationships with the standard deviation (s), so we also
graphed s+ against K+, and other location measures. Graphs
of group data for K+,s+f g demonstrated envelopes (Figure 6a)
for BF, AF, BM, AM faces that were not due to ceiling/floor
effects in behavior, and could be fit with quadratic functions.
Quadratic fitting of group data revealed an �rrz that ranged
between 0.83 and 0.87, and an �rr{ that ranged between 0.57 and
0.78 for approach and avoidance responses, respectively (Table 3;
Table S3a, Supporting Information File S1 Section V). In these
graphs, Ds+D increased and then returned toward baseline,
indicating a saturation relationship. The avoidance saturation
envelope was more compact than the approach saturation
envelope, although the general description of both was similar
s+~a K++bð Þ2+c (Figure 6a; Supporting Information File S1
Section II, Pattern 3), and plots of K+,s+f g in the individual
resembled the group ‘‘saturation’’ envelope (Figure 6b). Fitting of
quadratic functions to individual data revealed a mean fit of
�rrz~0.9760.07, and �rr{~0.9560.09 for approach and
avoidance responses, respectively. Conjunction likelihoods of
observing these patterns across the cohort of healthy controls
were p,1.56102307 and p,1.3610292 for approach and
avoidance responses, respectively (Table 2; Table S3a,
Supporting Information File S1 Section V).
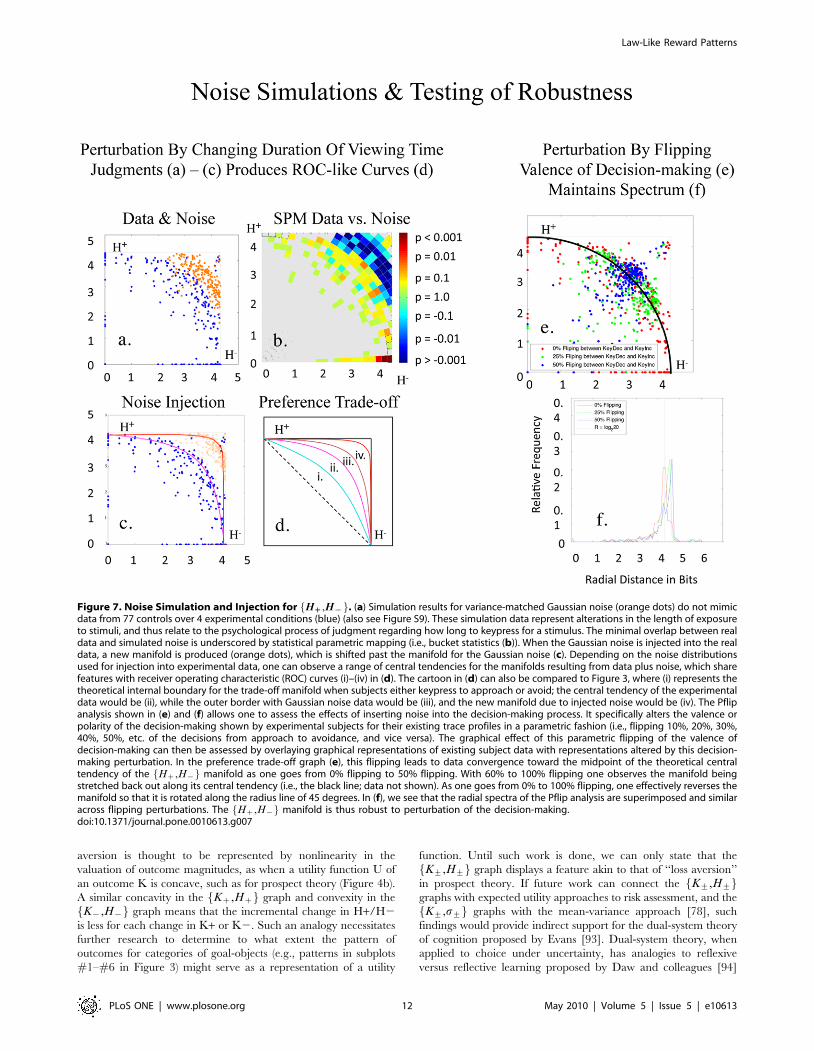
Robustness with NoiseNoise Simulation. Three noise distributions simulated in
hypothetical subjects did not co-localize with graphs of Hz,H{f gand K+,H+f g (Figure 7a; Figure S9; data not shown for
K+,H+f g), and could be segregated statistically from these
graphs (Figure 7b).
Noise Injection/Perturbation. When variance-matched
Gaussian noise was injected into Hz,H{f g, affecting judgments
of preference intensity, the manifold shifted past the simulated
noise (Figure 7c). Depending on the noise distribution used, one
observed ROC-like curves [74] (Figure 7d), with orderly radial
distributions after noise injection. In contrast, perturbations in the
valence of decision-making shifted the distribution of data along
the Hz,H{f g manifold, revising polar as opposed to radial
distributions (Figure 7e), and minimally affecting the spectra of the
manifold’s radial distribution (Figure 7f). The Hz,H{f g manifold
thus appeared to be robust to noise perturbation/injection.
Trial-By-Trial Response IndependenceIn this study, the duration for viewing each picture was
determined by participants, and adjustments were not made by the
experimental software to keep each trial of constant temporal
length. To assure that each action was not having an effect on the
following actions (e.g., whereby a subject pressing on a beautiful
image for a long period of time, may press for a lesser period in a
following trial), an analysis of variance was performed for the effect
of preceding trial behavior (independent variable) on each
subsequent trial (dependent variable) across and within subjects.
Across subjects, trials of AF or BF faces before BF faces produced
no effect on the duration of BF keypressing [F(1,1435) = 0.19,
p = 0.67]. Trials of AF or BF faces before AF faces produced no
effect on the duration of AF keypressing [F(1,1487) = 0.02,
p = 0.89]. Trials of AM or BM faces before BM faces produced
no effect on the duration of BM trials [F(1,1452) = 2.5, p = 0.12],
and trials of AM or BM faces before AM faces produced no effect
on the duration of AM trials [F(1,1470) = 0.001, p = 0.98].
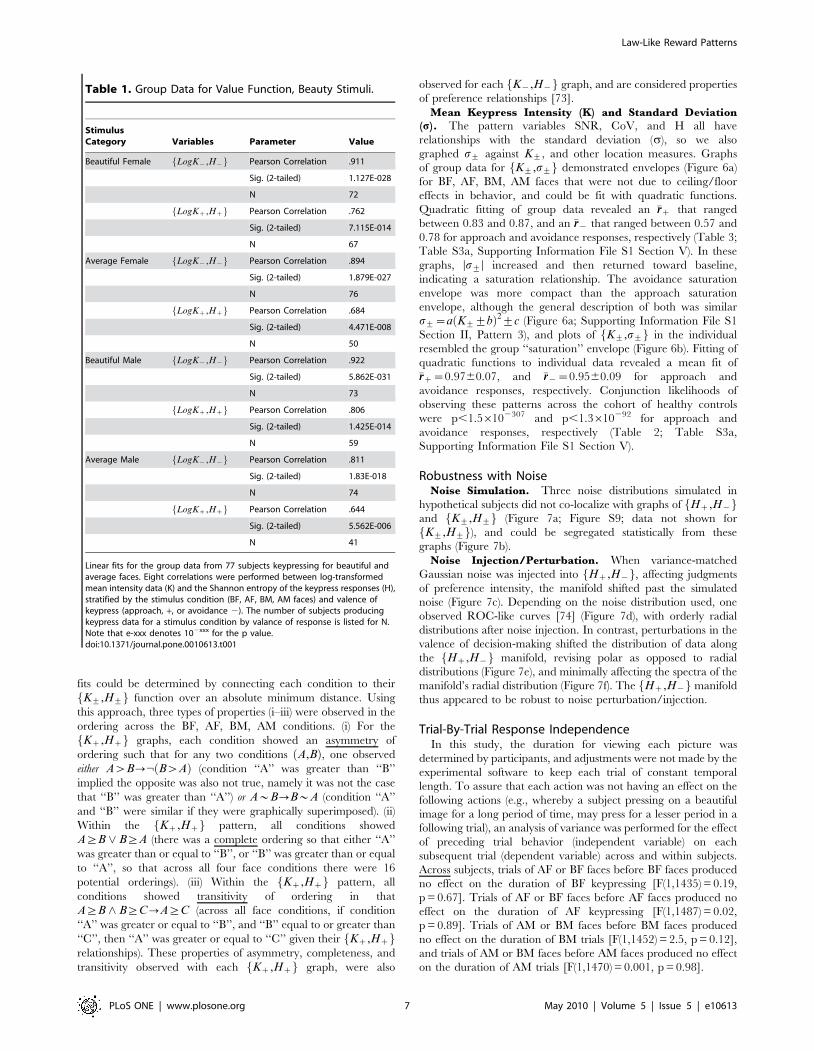
Table 1. Group Data for Value Function, Beauty Stimuli.
StimulusCategory Variables Parameter Value
Beautiful Female LogK{,H{f g Pearson Correlation .911
Sig. (2-tailed) 1.127E-028
N 72
LogKz,Hzf g Pearson Correlation .762
Sig. (2-tailed) 7.115E-014
N 67
Average Female LogK{,H{f g Pearson Correlation .894
Sig. (2-tailed) 1.879E-027
N 76
LogKz,Hzf g Pearson Correlation .684
Sig. (2-tailed) 4.471E-008
N 50
Beautiful Male LogK{,H{f g Pearson Correlation .922
Sig. (2-tailed) 5.862E-031
N 73
LogKz,Hzf g Pearson Correlation .806
Sig. (2-tailed) 1.425E-014
N 59
Average Male LogK{,H{f g Pearson Correlation .811
Sig. (2-tailed) 1.83E-018
N 74
LogKz,Hzf g Pearson Correlation .644
Sig. (2-tailed) 5.562E-006
N 41
Linear fits for the group data from 77 subjects keypressing for beautiful andaverage faces. Eight correlations were performed between log-transformedmean intensity data (K) and the Shannon entropy of the keypress responses (H),stratified by the stimulus condition (BF, AF, BM, AM faces) and valence ofkeypress (approach, +, or avoidance 2). The number of subjects producingkeypress data for a stimulus condition by valance of response is listed for N.Note that e-xxx denotes 102xxx for the p value.doi:10.1371/journal.pone.0010613.t001
Law-Like Reward Patterns
PLoS ONE | www.plosone.org 7 May 2010 | Volume 5 | Issue 5 | e10613
Analysis within each individual subject (N = 77) was also
performed to assess the effect of preceding trial viewing on subsequent
trials. Within subject analysis was first performed for the number of
increasing keypresses and the number of decreasing keypresses, for
each of the four face categories (i.e., 8 comparisons per subject). Given
77 subjects or 616 comparisons, 29 comparisons (i.e., 4.70% of the
comparisons run) produced p,0.05. If one corrected for 8
comparisons per subject, requiring a p,0.00625, only 2 of 616
comparisons met this threshold. If one evaluated within subject effects
using total viewtime, only 4 comparisons were run per subject, or 308
total analyses across 77 subjects. With this analysis, 15 analyses
produced p,0.05, or 4.87% of analyses run. If one corrected for
multiple comparisons, requiring p,0.015, only 4 of 308 analyses met
this corrected threshold.
For all analyses of trial-by-trial interactions, the number of
significant effects found was less than what would be expected by
chance (i.e. ,5%). These results suggest that trial-by-trial viewing
was, to first approximation, independent of prior behavior.
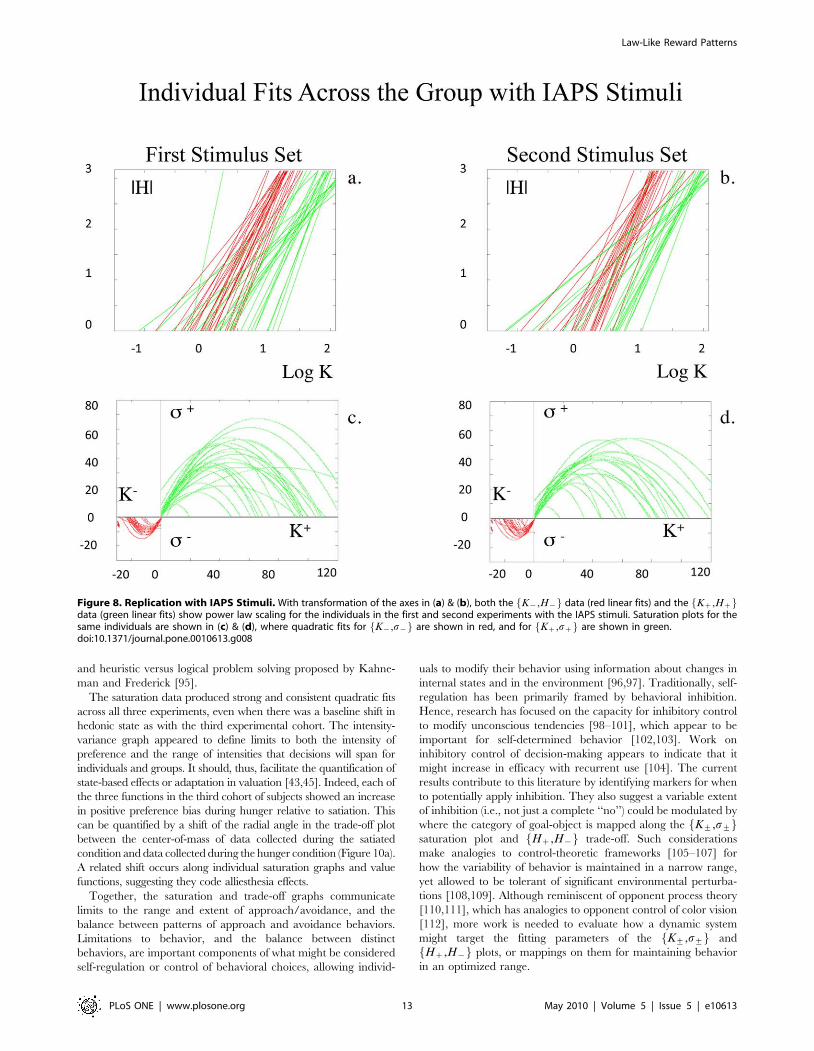
Pattern Recurrence with Other Stimulus SetsInternational Affective Picture System (IAPS). In a
second independent cohort of subjects, two distinct sets of
IAPS pictures were tested, with 9 experimental conditions (i.e.,
images of children/animals, disaster, drugs, food, nature,
objects, nudity, sports, violence). As with the ‘‘beauty’’
stimulus set, no coherent patterns were observed between
location measures of positive (approach) and negative
(avoidance) keypressing to IAPS stimuli. Structure (i.e., a
coherent pattern) was observed in graphs between the same
pattern variables for approach and avoidance keypressing used
with the beauty stimuli. Structure within the Hz,H{f g plot,
K+,H+f g plot, and K+,s+f g plot for the IAPS data had the
Figure 5. Value Function with Individual Data. In (a), data for the BF, AF, BM, AM faces in one individual is shown for K{,H{f g and Kz,Hzf gplots, superimposed on the fits for the other individuals in the cohort. With the same log transformation of axes performed for group data, oneobserves in each individual the signature of a power law. Here, the data for one individual is highlighted (b) above the graphs in lighter colors for therest of the subjects. It is important to note that the structure of these individual plots is consistent with the respective boundary envelopes for groupdata. Interpreting rank order of experimental conditions on these K+,H+f g graphs depends on how one frames the measurement of relativeposition, (c). If one frames the ordering of experimental conditions by either axis (dotted blue lines for x-axis, dotted red lines for y-axis), one observesdifferent relative orderings. A third ordering is possible if one frames the positioning relative to the power function fit for Kz,Hzf g (light green line),which calibrates the pattern of responses across items in an experimental condition (H) to the mean intensity of responses (K).doi:10.1371/journal.pone.0010613.g005
Law-Like Reward Patterns
PLoS ONE | www.plosone.org 8 May 2010 | Volume 5 | Issue 5 | e10613
same general mathematical formulation and signatures as that
observed with beauty stimuli (Figure 8a–d; Table S1,
Supporting Information File S1 Section V; group data for
trade-off plot not shown). These coherent patterns were also
clear for individual data (Figure 9a–d; Tables 4 & 5; Tables S2b
& S3b, Supporting Information File S1 Section V).
For K+,H+f g plots, linear fits to log-transformed individual
data revealed a mean fit of �rrz~0.9460.08 [mean6std], and
�rr{~0.9660.05 for approach and avoidance responses, for the
first IAPS experiment, and a mean fit of �rrz~0.9460.09, and
�rr{~0.9460.07 for approach and avoidance responses for the
second IAPS experiment, respectively (Tables 4 & 5; Table S2b,
Supporting Information File S1 Section V). Conjunction likeli-
hoods of observing these patterns across this cohort of healthy
controls were p,4.36102102 and p,5.06102113 for approach
and avoidance responses with the first IAPS experiment, and
p,2.8610278 and p,6.4610281 for approach and avoidance
responses with the second IAPS experiment, respectively. For both
the first and second IAPS experiments, Kz,Hzf g and K{,H{f ggraphs showed the asymmetry, completeness, and transitivity
relationships observed with the beauty data.
For the K+,s+f g plots, quadratic fitting to individual data
revealed a mean fit of �rrz~0.9560.05, and �rr{~0.9060.12 for
approach and avoidance responses with the first IAPS experiment,
and a mean fit of �rrz~0.9260.10, and �rr{~0.9160.11 for
approach and avoidance responses with the second IAPS
experiment, respectively (Tables 4 & 5; Table S3b, Supporting
Information File S1 Section V). Conjunction likelihoods of
observing these patterns across this cohort of healthy controls
were p,2.06610262 and p,2.87610231 for approach and
avoidance responses with the first IAPS experiment, and
p,8.72610235 and p,2.28610227 for approach and avoidance
responses with the second IAPS experiment, respectively.
Food Stimuli. In a third independent cohort of subjects,
subjects were tested twice with the same stimulus set, one week
apart, in the framework of hunger or satiation. Images for the
stimuli were of normal colored food, discolored food, prepared
food, and unprepared food ingredients, making a total of four
stimulus categories or experimental conditions. These four
conditions were assessed during states of hunger and satiation,
producing eight measures. As with the ‘‘beauty’’ stimulus set
and the IAPS stimulus sets, no coherent patterns (i.e., structures)
were observed between location measures of positive (approach)
and negative (avoidance) keypressing to food stimuli. Structure
was observed for graphs between the same pattern variables for
approach and avoidance keypressing used with the beauty and
the IAPS stimuli. Structure within the Hz,H{f g plot,
K+,H+f g plot, and K+,s+f g plot for the 8 food measures
had the same general mathematical formulation and signatures,
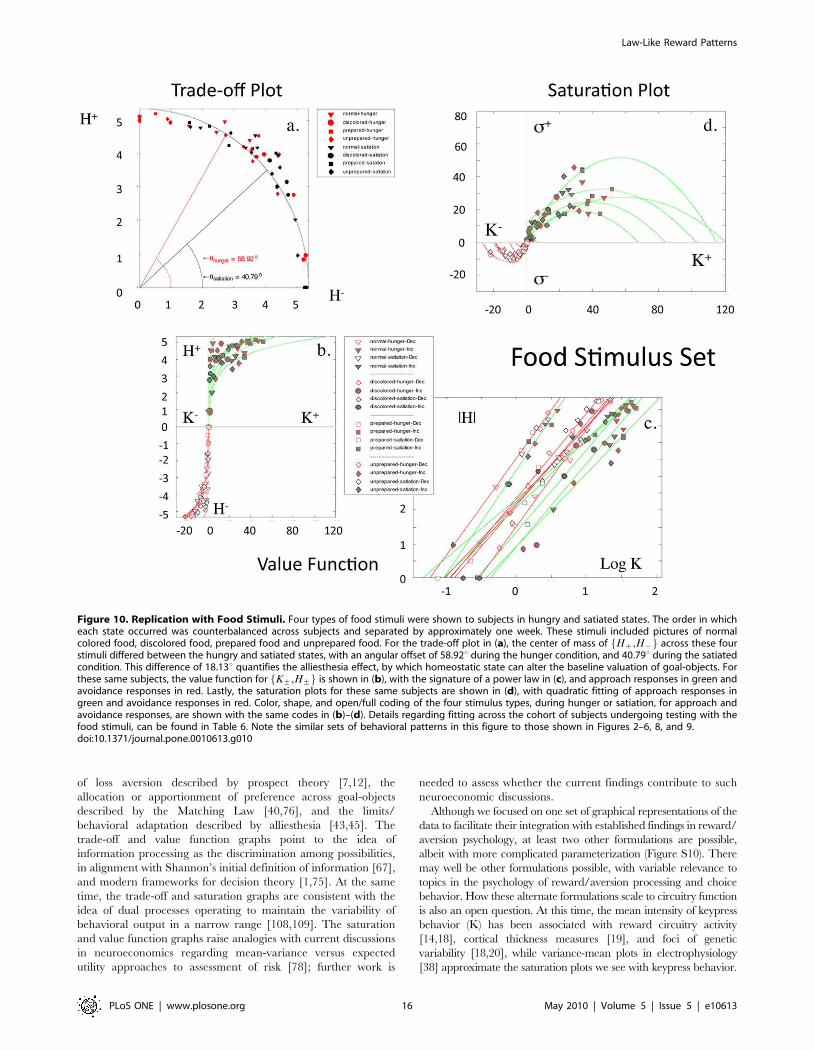
as that observed with beauty stimuli (Figure 10a–d). These
patterns were clear for both group and individual data.
Furthermore, there was a quantifiable differentiation of 18.13uin polar angle of the trade-off plot for hunger and satiation-
based keypress responses (Figure 10a), quantifying the hedonic
deficit state.
For K+,H+f g plots, linear fitting to log-transformed individual
data revealed a mean fit of �rrz~0.9560.03 [mean6std], and
�rr{~0.9860.01 for approach and avoidance responses, respec-
tively (Table 6; Table S2b, Supporting Information File S1 Section
V). Conjunction likelihoods of observing these patterns across this
cohort of healthy controls were p,8.6610224 and p,6.2610228
for approach and avoidance responses, respectively. As with
experiments run with the beauty and IAPS stimuli, Kz,Hzf g and
K{,H{f g graphs from the experiments with food stimuli showed
asymmetry, completeness, and transitivity relationships.
For the K+,s+f g plots, quadratic fitting to individual data
revealed a mean fit of �rrz~0.9160.08, and �rr{~0.9160.06 for
approach and avoidance responses, respectively (Table 6; Table
S3b, Supporting Information File S1 Section V). Conjunction
likelihoods of observing these patterns across this cohort of healthy
controls were p,3.2610214 and p,5.761028 for approach and
avoidance responses, respectively.
Given the exact same stimuli were tested one week apart, this
experiment allowed a quantitative assessment of test-retest reliability.
Evaluation of the relative ordering of the four food picture conditions
across test sessions was performed, compared for consistency across
test sessions, and tabulated across subjects. Of the four food
conditions, 3.6760.52 of them were ordered similarly between test
sessions (i.e., hunger and satiation) across subjects.
Discussion
This study found patterns connecting approach and avoidance
behavior, which were recurrent across three distinct sets of stimuli
(i.e., beautiful and average faces, IAPS, and food stimuli) and three
groups of subjects. These patterns were specific to a small subset of
behavioral variables. These patterns included (a) trade-offs that
counterbalanced approach and avoidance behavior for three
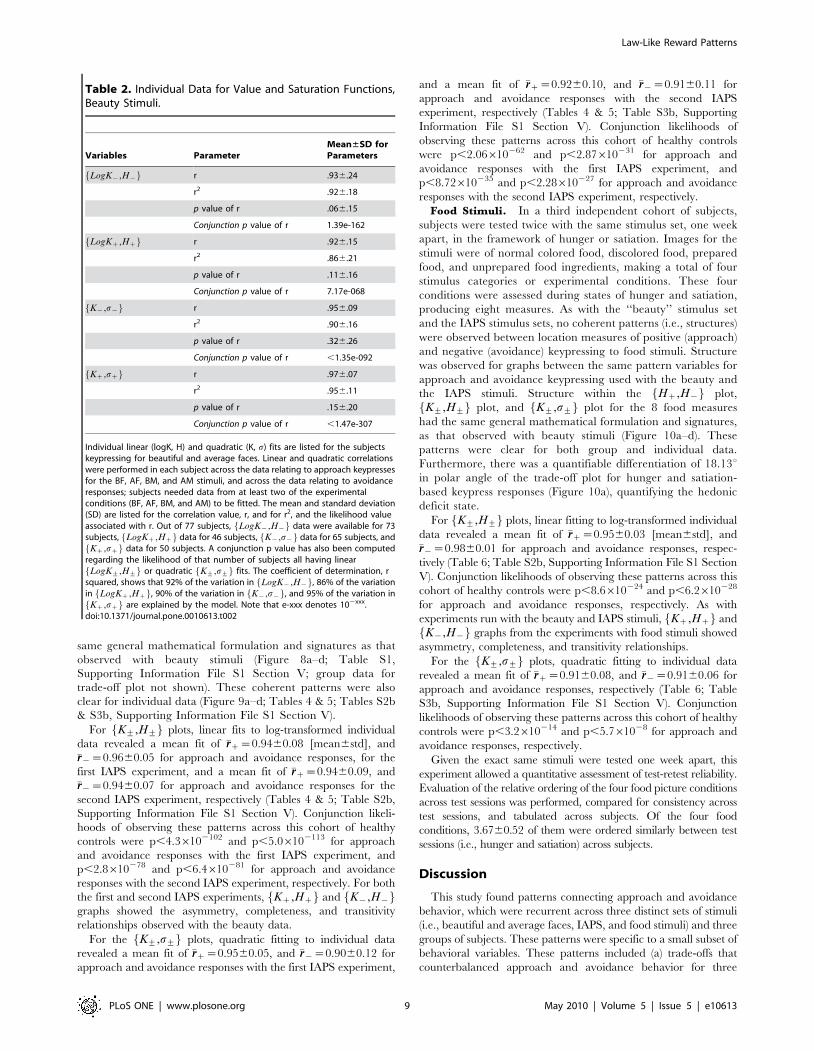
Table 2. Individual Data for Value and Saturation Functions,Beauty Stimuli.
Variables ParameterMean±SD forParameters
LogK{,H{f g r .936.24
r2 .926.18
p value of r .066.15
Conjunction p value of r 1.39e-162
LogKz,Hzf g r .926.15
r2 .866.21
p value of r .116.16
Conjunction p value of r 7.17e-068
K{,s{f g r .956.09
r2 .906.16
p value of r .326.26
Conjunction p value of r ,1.35e-092
Kz,szf g r .976.07
r2 .956.11
p value of r .156.20
Conjunction p value of r ,1.47e-307
Individual linear (logK, H) and quadratic (K, s) fits are listed for the subjectskeypressing for beautiful and average faces. Linear and quadratic correlationswere performed in each subject across the data relating to approach keypressesfor the BF, AF, BM, and AM stimuli, and across the data relating to avoidanceresponses; subjects needed data from at least two of the experimentalconditions (BF, AF, BM, and AM) to be fitted. The mean and standard deviation(SD) are listed for the correlation value, r, and for r2, and the likelihood valueassociated with r. Out of 77 subjects, LogK{,H{f g data were available for 73subjects, LogKz,Hzf g data for 46 subjects, K{,s{f g data for 65 subjects, andKz,szf g data for 50 subjects. A conjunction p value has also been computed
regarding the likelihood of that number of subjects all having linearLogK+,H+f g or quadratic K+,s+f g fits. The coefficient of determination, r
squared, shows that 92% of the variation in LogK{,H{f g, 86% of the variationin LogKz,Hzf g, 90% of the variation in K{,s{f g, and 95% of the variation inKz,szf g are explained by the model. Note that e-xxx denotes 102xxx.
doi:10.1371/journal.pone.0010613.t002
Law-Like Reward Patterns
PLoS ONE | www.plosone.org 9 May 2010 | Volume 5 | Issue 5 | e10613
pattern variables (i.e., SNR, CoV, and H), (b) value functions
calibrating keypress intensity (K) with each of the three pattern
variables, and (c) a limit (or saturation) function connecting choice
intensity (K) with its standard deviation (s) delineating limits to
approach and avoidance behavior (Figure S10; Supporting
Information File S1 Section II, Patterns 1–3).
Patterns (a)–(c) were found to exhibit relationships between each
other that were not always obvious to visual assessment, and
necessitated simulations. For instance, most mappings inward
from the Hz,H{f g trade-off reflected both low avoidance and
low approach on Kz,Hzf g and K{,H{f g plots. Other
mappings inward of the Hz,H{f g trade-off occurred for
individuals who accepted the default condition more than once.
Together, these observations suggested an interpretation that
mappings inward of the Hz,H{f g trade-off represented some
degree of indifference (Figure 3). Such an interpretation does not
relate to the fact there is a theoretical lower limit to the
computation of H+ due to the number of items in a stimulus set
(Pattern 4, Supporting Information File S1 Section II). In contrast
to mappings inward from the Hz,H{f g trade-off, many
mappings outward from the Hz,H{f g trade-off reflected both
high avoidance and high approach on Kz,Hzf g and K{,H{f gplots. A similar mapping occurred for the noise simulations and for
individuals who responded with both approach and avoidance
keypresses for the same stimuli. Taken together, these observations
suggested an interpretation of variable amounts of psychological
conflict for mappings outside the Hz,H{f g trade-off (i.e., as
when you both love and hate something) (Figure 3). In addition to
relationships between patterns (a) and (b), relationships were also
observed between the K+,H+f g value functions (b) and
K+,s+f g limit (saturation) functions (c), in that steeper slopes
with K+,H+f g were associated with tighter saturation mappings.
These relationships across patterns (a)–(c) were relevant for
generalizing the relative orderings of experimental conditions (e.g.,
BF, AF, BM, AM) observed within the K+,H+f g plots. Across all
three experiments, the K+,H+f g value function was observed to
encode three critical features for logical constructions of preference
[73], namely asymmetry, completeness, and transitivity of
ordering across experimental conditions, arguing the K+,H+f gplots reflect relative preferences for individuals toward the stimuli.
Given the K+,H+f g plot was shown to reflect features inherent in
the Hz,H{f g trade-off plot and the K+,s+f g limit plot, we will
Figure 6. Group and Individual Saturation Plots. In (a), mean keypress intensity (K) is plotted against standard deviation (s), for approach andavoidance responses to the BF, AF, BM, AM faces, in 77 control subjects. A quadratic envelope readily fits the avoidance data K{,s{f g, and the leftside of the approach data distribution for Kz,szf g. Most telling are the individual data, where quadratic fits are also observed for each of the 77individual data sets with the BF, AF, BM, AM data (b). A similar mathematical structure is observed in individual graphs with the BF, AF, BM, AM faces,albeit with different fitting parameters for each of the 77 subjects. These patterns are similar to those reported for ensemble averages of mIPSCs forsynaptic GABAA channels by De Koninck & Mody [38].doi:10.1371/journal.pone.0010613.g006
Law-Like Reward Patterns
PLoS ONE | www.plosone.org 10 May 2010 | Volume 5 | Issue 5 | e10613
use the phrase ‘‘relative preference’’ in subsequent text to refer to
the properties of asymmetry, completeness, and transitivity
observed across categories of stimuli in Hz,H{f g, K+,H+f gand K+,s+f g plots. Inclusion of the ‘‘relative’’ adjective is
important given test-retest comparison with the food stimuli
showed that 3.67 of 4 food conditions were similarly ordered
across test sessions with altered framing (i.e., hunger vs. satiation)
and were not perfectly identical. Each pattern, and what it
potentially communicates about relative preference, will be
discussed in the paragraphs that follow.
Trade-off plots were observed with each of the three pattern
variables, yet the Hz,H{f g plot was the simplest in mathematical
terms. The Hz,H{f g plot suggests that relative preference
represents a balance between approach and avoidance choices,
where bundles of approach behaviors are balanced against bundles
of avoidance behaviors. Of the trade-off plots observed, the trade-
off between Hzð Þ and H{ð Þ could not be simulated or produced
from noise, was recurrent across all variables tested, and was
robust to noise injected into the judgment and the decision-making
components of the task. Shannon defined information as the
uncertainty related to making a choice [67], so the preference
trade-off plots between Hzð Þ and H{ð Þ show how uncertainties
regarding approach choices might be balanced against uncertain-
ties regarding avoidance choices.
Shannon’s insight has relevance for one of the value functions
observed (i.e., K+,H+f g vs. K+,SNR+f g or K+,CoV+f g), in
that the K+,H+f g plot appears to relate preference intensity to
the uncertainty associated with preference choices. These
‘intensity-uncertainty’ (i.e., K+,H+f g) envelopes for group data
(Figure 4a,c) and functions for individual graphs (Figure 5a,b)
showed a relationship between approach and avoidance graphs
that was similar to the positive and negative components of the
value function for prospect theory (Figure 4b). The slopes for
avoidance responses were steeper than the slopes for approach,
which in prospect theory (Figure 4b) is interpreted as ‘‘loss
aversion’’ [7,12]. In prospect theory, the value function graphs a
relationship between (i) the value of gains and losses in the larger
economic system and (ii) subjective value or utility defined by
individuals, and thus depends on a global or universal framework.
In contrast, the intensity-uncertainty relationship shows a
predictable pattern between two measurements within the same
individual. Personal utility, the dependent variable in the value
function of prospect theory [13], has been hypothesized to contain
a probabilistic measure of choice [75], so that preference
magnitude is connected to an estimate of the uncertainty
associated with that preference. The intensity-uncertainty rela-
tionship observed in these experiments supports such a hypothesis,
and places this calibration of value within a ‘‘relative’’ construct
(please also see Figure 5c).
The intensity-uncertainty envelopes for group data and
functions within individuals appeared consistent with power law
scaling, producing linear correlations that were recurrent and
strong. In such a framework, the plots of individual data also
related the ratios of measures, which resemble the Matching Law
(Figure S8). Matching describes the relative apportionment of
value between reinforcers [41,76]. Originally conceived as a linear
relationship between ratios [39,42], it has been observed to follow
a power function in some cases [40]. The current data suggest that
apportionment of uncertainty related to preferences (i.e., the ratio
of uncertainty toward discrete experimental conditions such as BF
and AM faces), was quantitatively related to the relative
apportionment of preference intensity across categories of
experimental stimuli. Such an interpretation would not apply to
value functions that calibrated SNR or CoV to the intensity (K) of
relative preference. Such an interpretation would also not apply to
the strictly logarithmic interpretation of the intensity-uncertainty
patterns (see Figure 4a), which ignored the presence of a logarithm
in computing the Shannon entropy.
Although the K+,s+f g (i.e., intensity-variance) graph can be
considered as derived from the intensity-uncertainty graph, the
saturation relationship observed has its own implications. Humans
do not act like molecules for which increased temperature
(analogous to K) leads to increased variance s+f g. The saturation
observed in the intensity-variance graph (Figures 6a,b) can be
analogized to the issue of easy versus hard decision-making
described by Koechlin and Hyafil [77]. Namely, decisions
involving low or high preference magnitude will be easy and
therefore have low variance associated with them. Goal-objects
with intermediate magnitudes of preference will have high
variance estimates, indicating potentially hard decisions.
These considerations regarding the K+,s+f g graph and
decision-making may have relevance for current discussions in
neuroeconomics regarding risk assessment [78]. A number of
neuroimaging studies have reported neural evidence for a mean-
variance approach to risk assessment [79–84], whereas others have
provided neural evidence for an expected utility approach [30,85–
88]. The K+,s+f g graph observed in the current study appears to
be consistent with the mean-variance approach to the assessment
of risky gambles [89,90] within individuals or across groups, where
risk is described by the outcome variance (i.e., the standard
deviation, s). By the mean-variance approach, valuation V is
computed by a difference between the mean transaction outcome
and variance estimate: V~K{ds, where d is the penalty imposed
for risk, which increases with increasing risk aversion [78]. As
illustrated in Figure S11, the K+,s+f g graph encodes low values
of K as s increases to a maximum, and higher values of K as sdiminishes back to baseline. With K increasing as s quadratically
decreases, valuation V points to choices that are more likely to be
preferred by the individual.
At the same time that the K+,s+f g graph appears to support
use of a mean-variance approach to decisions under conditions of
risk, the K+,H+f g graph could be argued to support use of the
expected utility approach [12,91,92]. For expected utility, risk
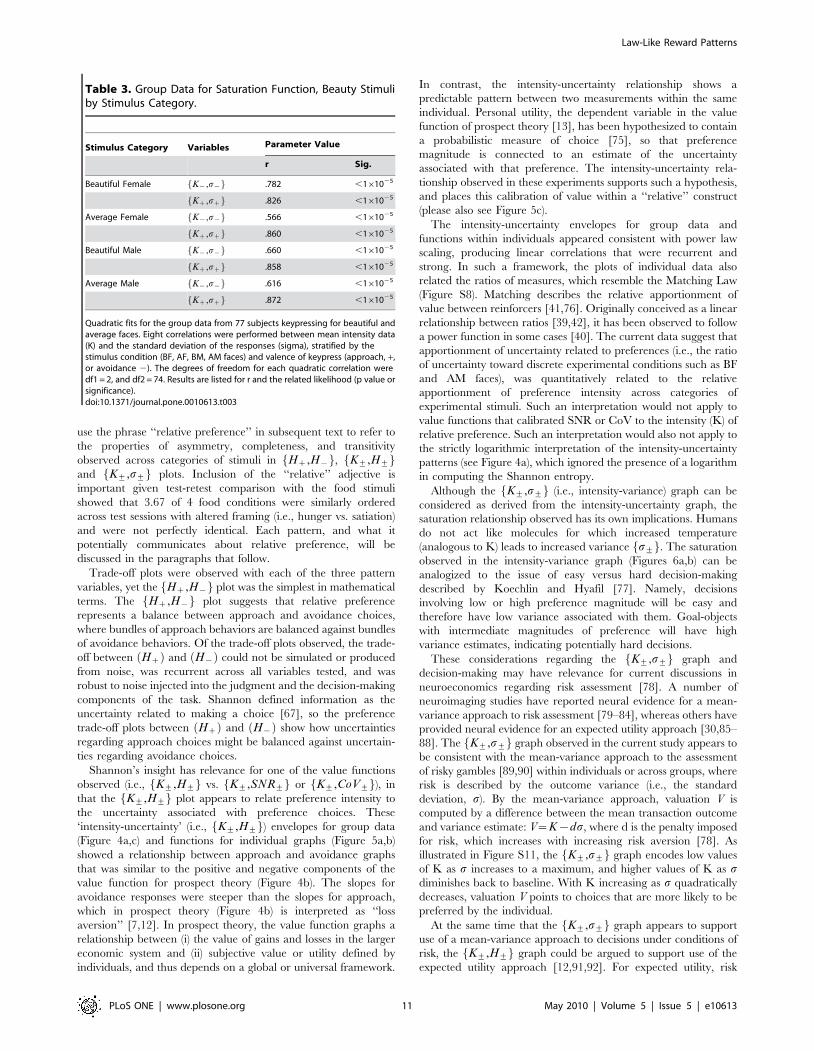
Table 3. Group Data for Saturation Function, Beauty Stimuliby Stimulus Category.
Stimulus Category Variables Parameter Value
r Sig.
Beautiful Female K{,s{f g .782 ,161025
Kz,szf g .826 ,161025
Average Female K{,s{f g .566 ,161025
Kz,szf g .860 ,161025
Beautiful Male K{,s{f g .660 ,161025
Kz,szf g .858 ,161025
Average Male K{,s{f g .616 ,161025
Kz,szf g .872 ,161025
Quadratic fits for the group data from 77 subjects keypressing for beautiful andaverage faces. Eight correlations were performed between mean intensity data(K) and the standard deviation of the responses (sigma), stratified by thestimulus condition (BF, AF, BM, AM faces) and valence of keypress (approach, +,or avoidance 2). The degrees of freedom for each quadratic correlation weredf1 = 2, and df2 = 74. Results are listed for r and the related likelihood (p value orsignificance).doi:10.1371/journal.pone.0010613.t003
Law-Like Reward Patterns
PLoS ONE | www.plosone.org 11 May 2010 | Volume 5 | Issue 5 | e10613
aversion is thought to be represented by nonlinearity in the
valuation of outcome magnitudes, as when a utility function U of
an outcome K is concave, such as for prospect theory (Figure 4b).
A similar concavity in the Kz,Hzf g graph and convexity in the
K{,H{f g graph means that the incremental change in H+/H2
is less for each change in K+ or K2. Such an analogy necessitates
further research to determine to what extent the pattern of
outcomes for categories of goal-objects (e.g., patterns in subplots
#1–#6 in Figure 3) might serve as a representation of a utility
function. Until such work is done, we can only state that the
K+,H+f g graph displays a feature akin to that of ‘‘loss aversion’’
in prospect theory. If future work can connect the K+,H+f ggraphs with expected utility approaches to risk assessment, and the
K+,s+f g graphs with the mean-variance approach [78], such
findings would provide indirect support for the dual-system theory
of cognition proposed by Evans [93]. Dual-system theory, when
applied to choice under uncertainty, has analogies to reflexive
versus reflective learning proposed by Daw and colleagues [94]
Figure 7. Noise Simulation and Injection for Hzz,H{{f g. (a) Simulation results for variance-matched Gaussian noise (orange dots) do not mimicdata from 77 controls over 4 experimental conditions (blue) (also see Figure S9). These simulation data represent alterations in the length of exposureto stimuli, and thus relate to the psychological process of judgment regarding how long to keypress for a stimulus. The minimal overlap between realdata and simulated noise is underscored by statistical parametric mapping (i.e., bucket statistics (b)). When the Gaussian noise is injected into the realdata, a new manifold is produced (orange dots), which is shifted past the manifold for the Gaussian noise (c). Depending on the noise distributionsused for injection into experimental data, one can observe a range of central tendencies for the manifolds resulting from data plus noise, which sharefeatures with receiver operating characteristic (ROC) curves (i)–(iv) in (d). The cartoon in (d) can also be compared to Figure 3, where (i) represents thetheoretical internal boundary for the trade-off manifold when subjects either keypress to approach or avoid; the central tendency of the experimentaldata would be (ii), while the outer border with Gaussian noise data would be (iii), and the new manifold due to injected noise would be (iv). The Pflipanalysis shown in (e) and (f) allows one to assess the effects of inserting noise into the decision-making process. It specifically alters the valence orpolarity of the decision-making shown by experimental subjects for their existing trace profiles in a parametric fashion (i.e., flipping 10%, 20%, 30%,40%, 50%, etc. of the decisions from approach to avoidance, and vice versa). The graphical effect of this parametric flipping of the valence ofdecision-making can then be assessed by overlaying graphical representations of existing subject data with representations altered by this decision-making perturbation. In the preference trade-off graph (e), this flipping leads to data convergence toward the midpoint of the theoretical centraltendency of the Hz,H{f g manifold as one goes from 0% flipping to 50% flipping. With 60% to 100% flipping one observes the manifold beingstretched back out along its central tendency (i.e., the black line; data not shown). As one goes from 0% to 100% flipping, one effectively reverses themanifold so that it is rotated along the radius line of 45 degrees. In (f), we see that the radial spectra of the Pflip analysis are superimposed and similaracross flipping perturbations. The Hz,H{f g manifold is thus robust to perturbation of the decision-making.doi:10.1371/journal.pone.0010613.g007
Law-Like Reward Patterns
PLoS ONE | www.plosone.org 12 May 2010 | Volume 5 | Issue 5 | e10613
and heuristic versus logical problem solving proposed by Kahne-
man and Frederick [95].
The saturation data produced strong and consistent quadratic fits
across all three experiments, even when there was a baseline shift in
hedonic state as with the third experimental cohort. The intensity-
variance graph appeared to define limits to both the intensity of
preference and the range of intensities that decisions will span for
individuals and groups. It should, thus, facilitate the quantification of
state-based effects or adaptation in valuation [43,45]. Indeed, each of
the three functions in the third cohort of subjects showed an increase
in positive preference bias during hunger relative to satiation. This
can be quantified by a shift of the radial angle in the trade-off plot
between the center-of-mass of data collected during the satiated
condition and data collected during the hunger condition (Figure 10a).
A related shift occurs along individual saturation graphs and value
functions, suggesting they code alliesthesia effects.
Together, the saturation and trade-off graphs communicate
limits to the range and extent of approach/avoidance, and the
balance between patterns of approach and avoidance behaviors.
Limitations to behavior, and the balance between distinct
behaviors, are important components of what might be considered
self-regulation or control of behavioral choices, allowing individ-
uals to modify their behavior using information about changes in
internal states and in the environment [96,97]. Traditionally, self-
regulation has been primarily framed by behavioral inhibition.
Hence, research has focused on the capacity for inhibitory control
to modify unconscious tendencies [98–101], which appear to be
important for self-determined behavior [102,103]. Work on
inhibitory control of decision-making appears to indicate that it
might increase in efficacy with recurrent use [104]. The current
results contribute to this literature by identifying markers for when
to potentially apply inhibition. They also suggest a variable extent
of inhibition (i.e., not just a complete ‘‘no’’) could be modulated by
where the category of goal-object is mapped along the K+,s+f gsaturation plot and Hz,H{f g trade-off. Such considerations
make analogies to control-theoretic frameworks [105–107] for
how the variability of behavior is maintained in a narrow range,
yet allowed to be tolerant of significant environmental perturba-
tions [108,109]. Although reminiscent of opponent process theory
[110,111], which has analogies to opponent control of color vision
[112], more work is needed to evaluate how a dynamic system
might target the fitting parameters of the K+,s+f g and
Hz,H{f g plots, or mappings on them for maintaining behavior
in an optimized range.
Figure 8. Replication with IAPS Stimuli. With transformation of the axes in (a) & (b), both the K{,H{f g data (red linear fits) and the Kz,Hzf gdata (green linear fits) show power law scaling for the individuals in the first and second experiments with the IAPS stimuli. Saturation plots for thesame individuals are shown in (c) & (d), where quadratic fits for K{,s{f g are shown in red, and for Kz,szf g are shown in green.doi:10.1371/journal.pone.0010613.g008
Law-Like Reward Patterns
PLoS ONE | www.plosone.org 13 May 2010 | Volume 5 | Issue 5 | e10613
All three patterns, the preference tradeoff, preference value
function, and preference saturation function, suggested scaling
between group and individual data in that they had consistent
mathematical formulations across groups (as central tendencies of
manifolds or boundary envelopes) and individuals (as fitted functions).
In general, connections between one layer of organization and
another specify the information that one has about the other
[113,114]. Statistically framed connections between scales, or
graphical representations preserved across scales, directly reflect the
degree to which the principles regulating organization at one scale are
preserved at another [115–117]. This presumptive scaling between
individual and group data point to a potential mechanism by which
individual choice behavior in a microeconomic framework might
aggregate as group behavior in a macroeconomic framework [118].
Such an interpretation is tempered by the common observation in
biology [119], mathematics [120] and economics [121] of emergent
behavior across layers of organization with implications that cannot
readily be connected to initial conditions. Further study with a high
number of experimental conditions and a very large cohort, to
optimally fit individual data, would facilitate testing whether the
scaling observed here between group and individual graphs can be
extrapolated, as done in other studies [122], to interpret the
interaction of individual preferences with the behavior of groups/
markets.
Parallel research in neuroscience argues for the relevance of
these findings at both the group and individual scales of
measurement. Keypress intensity measures (i.e., K) have been
associated (a) with reward circuitry ‘‘activation’’ [31,33,35–37,50–
52] by functional magnetic resonance imaging (fMRI) [14], and (b)
with both reward circuitry activation and genetic polymorphisms
connected to CREB1 [18] and BDNF [20]. Patterns similar to the
K+,s+f g saturation plots have been produced as ‘‘variance-
mean’’ graphs for noise analysis in electrophysiology [38], raising
the prospect that the same patterns might be observed during
fMRI of preference-based judgment and decision-making given
the current status of knowledge regarding the basis of the blood
oxygen level dependent signal [123; reviewed in 29]. Altogether,
these findings argue for the ‘‘biological plausibility’’ [124,125] of a
number of the K+,H+,s+f g findings. Given their association
with brain circuitry and genetic measures, these findings raise the
question of their relevance for phenotyping psychiatric illnesses
[47–49]. Recent work has shown that keypress intensity (K) for the
four beauty face conditions was reduced in cocaine dependent
subjects relative to controls [19]. The addicts also showed a
restricted range in their keypress responses, and this behavior was
significantly associated with reduced cortical thickness in the
dorsolateral prefrontal cortex of these addicts. The restricted range
in behavior is one representation of the reduced repertoire of
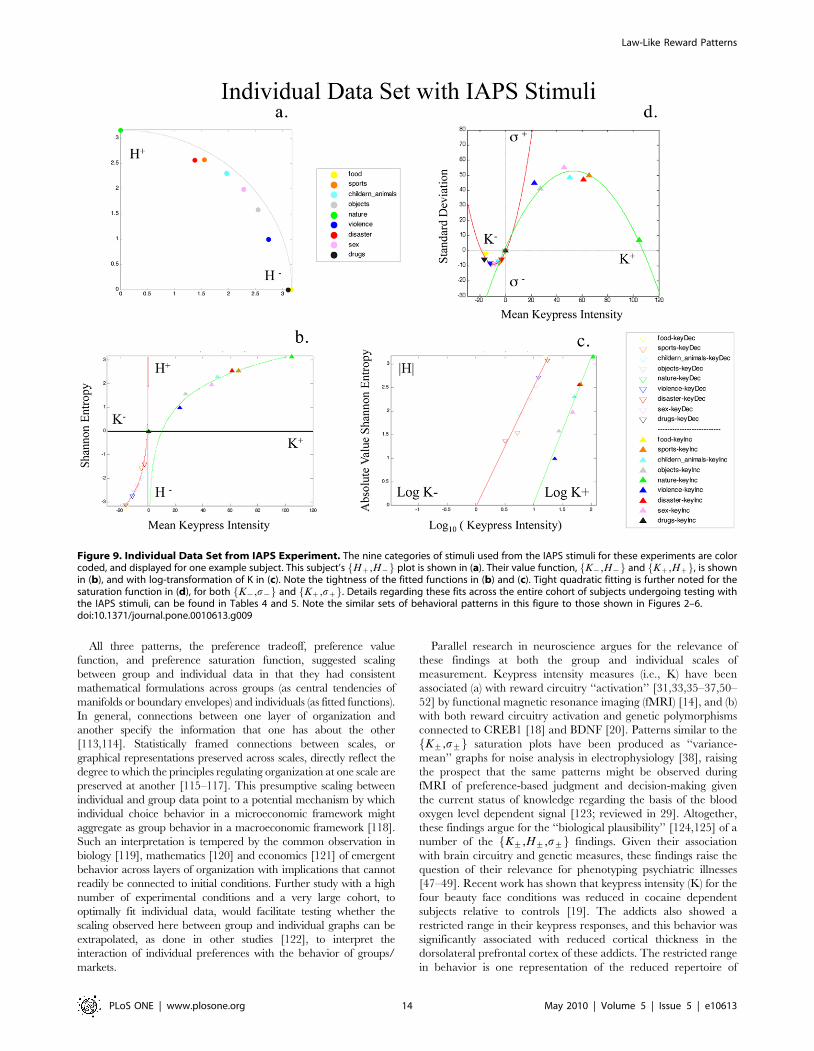
Figure 9. Individual Data Set from IAPS Experiment. The nine categories of stimuli used from the IAPS stimuli for these experiments are colorcoded, and displayed for one example subject. This subject’s Hz,H{f g plot is shown in (a). Their value function, K{,H{f g and Kz,Hzf g, is shownin (b), and with log-transformation of K in (c). Note the tightness of the fitted functions in (b) and (c). Tight quadratic fitting is further noted for thesaturation function in (d), for both K{,s{f g and Kz,szf g. Details regarding these fits across the entire cohort of subjects undergoing testing withthe IAPS stimuli, can be found in Tables 4 and 5. Note the similar sets of behavioral patterns in this figure to those shown in Figures 2–6.doi:10.1371/journal.pone.0010613.g009
Law-Like Reward Patterns
PLoS ONE | www.plosone.org 14 May 2010 | Volume 5 | Issue 5 | e10613
behavior that is a defining feature of addiction in general. These
findings of Makris and colleagues [19] suggest the need for further
work to assess if alterations in the relationships between
K+,H+,s+f g encode other quantitative features of addiction or
might represent phenotypes for other psychiatric illnesses [47,48].
Given the prospect of such applications, it is also important to
consider limitations to the current work in the form of further
studies needed to determine how general the findings might be.
For instance, the K+,H+,s+f g patterns appear to reflect
alliesthesia effects between states of hunger and satiation, but
analysis with a larger cohort is needed to quantify the consistency
of such effects, and to connect them to established clinical
measures of appetitive motivation [126]. Further investigation of
how experimental framing might alter the ordering of items
across the K+,H+,s+f g patterns, as might be expected, for
instance, with sleep deprivation on carbohydrate vs. protein
appetite, will be helpful to quantify the ‘‘relative’’ character of
preference. The K+,H+,s+f g patterns were observed with a
keypress procedure so it is not yet known if these patterns will be
observed using data collected by other experimental methods
such as ratings. Also, the length of trials was not fixed, raising the
question of whether or not K+,H+,s+f g patterns would be
observed if they were kept constant. The current paradigm did
not show consistent dependencies between trials across subjects or
within subject, but this does not rule out nonlinear effects being
observed with subsequent dynamic analyses. The current
paradigm used intrinsic as opposed to extrinsic goal-objects
[22,23], raising the question of whether these patterns to
approach and avoidance apply to stimuli that actually meliorate
a deficit state. The relevance of this last concern might be
mitigated if genetic polymorphsims can be shown to directly
predict variance in features of the trade-off plot, K+,H+f g plot,
or K+,s+f g plot, or if variance in neuroimaging signals could do
the same. The K+,H+,s+f g patterns were quite consistent
across experiments, yet more work is needed to assess if they are
mathematically closed under certain operations and thus form a
function space, or might be supplemented by other relationships
to form a function space. Lastly, the observation of important
features from prospect theory and the matching law within the
K+,H+f g plot raises the question of a deeper relationship
between the K+,H+,s+f g patterns, and validated constructs of
reward-based judgment and decision-making. Can the
K+,H+,s+f g patterns be derived from prospect theory and
the matching law, or vice versa? Pending studies of the issues
raised above, the findings reported herein must be considered
specific to the experimental paradigm used.
In summary, this study found recurrent, robust, and scalable
patterns to approach and avoidance behavior. The law-like
graphical patterns observed in this study are consistent with
salient features from a number of established constructs regarding
reward-based choice behavior. The patterns evidence the feature
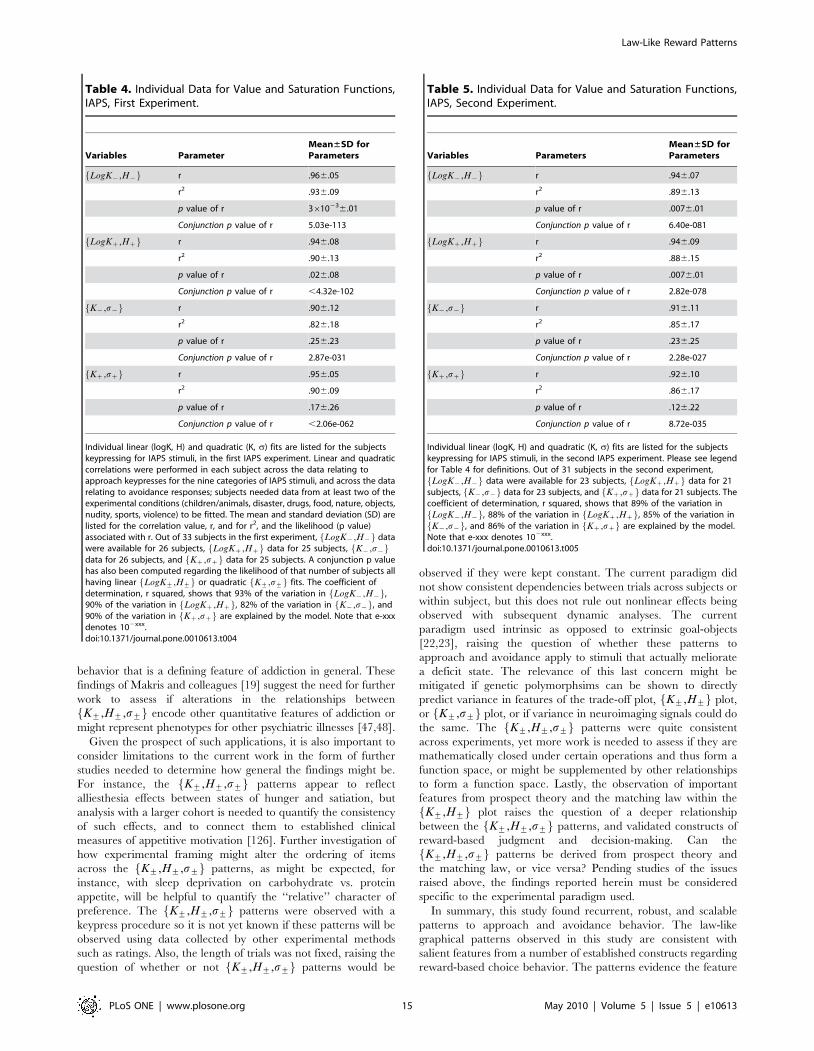
Table 4. Individual Data for Value and Saturation Functions,IAPS, First Experiment.
Variables ParameterMean±SD forParameters
LogK{,H{f g r .966.05
r2 .936.09
p value of r 3610236.01
Conjunction p value of r 5.03e-113
LogKz,Hzf g r .946.08
r2 .906.13
p value of r .026.08
Conjunction p value of r ,4.32e-102
K{,s{f g r .906.12
r2 .826.18
p value of r .256.23
Conjunction p value of r 2.87e-031
Kz,szf g r .956.05
r2 .906.09
p value of r .176.26
Conjunction p value of r ,2.06e-062
Individual linear (logK, H) and quadratic (K, s) fits are listed for the subjectskeypressing for IAPS stimuli, in the first IAPS experiment. Linear and quadraticcorrelations were performed in each subject across the data relating toapproach keypresses for the nine categories of IAPS stimuli, and across the datarelating to avoidance responses; subjects needed data from at least two of theexperimental conditions (children/animals, disaster, drugs, food, nature, objects,nudity, sports, violence) to be fitted. The mean and standard deviation (SD) arelisted for the correlation value, r, and for r2, and the likelihood (p value)associated with r. Out of 33 subjects in the first experiment, LogK{,H{f g datawere available for 26 subjects, LogKz,Hzf g data for 25 subjects, K{,s{f gdata for 26 subjects, and Kz,szf g data for 25 subjects. A conjunction p valuehas also been computed regarding the likelihood of that number of subjects allhaving linear LogK+,H+f g or quadratic K+,s+f g fits. The coefficient ofdetermination, r squared, shows that 93% of the variation in LogK{,H{f g,90% of the variation in LogKz,Hzf g, 82% of the variation in K{,s{f g, and90% of the variation in Kz,szf g are explained by the model. Note that e-xxxdenotes 102xxx.doi:10.1371/journal.pone.0010613.t004
Table 5. Individual Data for Value and Saturation Functions,IAPS, Second Experiment.
Variables ParametersMean±SD forParameters
LogK{,H{f g r .946.07
r2 .896.13
p value of r .0076.01
Conjunction p value of r 6.40e-081
LogKz,Hzf g r .946.09
r2 .886.15
p value of r .0076.01
Conjunction p value of r 2.82e-078
K{,s{f g r .916.11
r2 .856.17
p value of r .236.25
Conjunction p value of r 2.28e-027
Kz,szf g r .926.10
r2 .866.17
p value of r .126.22
Conjunction p value of r 8.72e-035
Individual linear (logK, H) and quadratic (K, s) fits are listed for the subjectskeypressing for IAPS stimuli, in the second IAPS experiment. Please see legendfor Table 4 for definitions. Out of 31 subjects in the second experiment,LogK{,H{f g data were available for 23 subjects, LogKz,Hzf g data for 21
subjects, K{,s{f g data for 23 subjects, and Kz,szf g data for 21 subjects. Thecoefficient of determination, r squared, shows that 89% of the variation inLogK{,H{f g, 88% of the variation in LogKz,Hzf g, 85% of the variation inK{,s{f g, and 86% of the variation in Kz,szf g are explained by the model.
Note that e-xxx denotes 102xxx.doi:10.1371/journal.pone.0010613.t005
Law-Like Reward Patterns
PLoS ONE | www.plosone.org 15 May 2010 | Volume 5 | Issue 5 | e10613
of loss aversion described by prospect theory [7,12], the
allocation or apportionment of preference across goal-objects
described by the Matching Law [40,76], and the limits/
behavioral adaptation described by alliesthesia [43,45]. The
trade-off and value function graphs point to the idea of
information processing as the discrimination among possibilities,
in alignment with Shannon’s initial definition of information [67],
and modern frameworks for decision theory [1,75]. At the same
time, the trade-off and saturation graphs are consistent with the
idea of dual processes operating to maintain the variability of
behavioral output in a narrow range [108,109]. The saturation
and value function graphs raise analogies with current discussions
in neuroeconomics regarding mean-variance versus expected
utility approaches to assessment of risk [78]; further work is
needed to assess whether the current findings contribute to such
neuroeconomic discussions.
Although we focused on one set of graphical representations of the
data to facilitate their integration with established findings in reward/
aversion psychology, at least two other formulations are possible,
albeit with more complicated parameterization (Figure S10). There
may well be other formulations possible, with variable relevance to
topics in the psychology of reward/aversion processing and choice
behavior. How these alternate formulations scale to circuitry function
is also an open question. At this time, the mean intensity of keypress
behavior (K) has been associated with reward circuitry activity
[14,18], cortical thickness measures [19], and foci of genetic
variability [18,20], while variance-mean plots in electrophysiology
[38] approximate the saturation plots we see with keypress behavior.
Figure 10. Replication with Food Stimuli. Four types of food stimuli were shown to subjects in hungry and satiated states. The order in whicheach state occurred was counterbalanced across subjects and separated by approximately one week. These stimuli included pictures of normalcolored food, discolored food, prepared food and unprepared food. For the trade-off plot in (a), the center of mass of Hz,H{f g across these fourstimuli differed between the hungry and satiated states, with an angular offset of 58.92u during the hunger condition, and 40.79u during the satiatedcondition. This difference of 18.13u quantifies the alliesthesia effect, by which homeostatic state can alter the baseline valuation of goal-objects. Forthese same subjects, the value function for K+,H+f g is shown in (b), with the signature of a power law in (c), and approach responses in green andavoidance responses in red. Lastly, the saturation plots for these same subjects are shown in (d), with quadratic fitting of approach responses ingreen and avoidance responses in red. Color, shape, and open/full coding of the four stimulus types, during hunger or satiation, for approach andavoidance responses, are shown with the same codes in (b)–(d). Details regarding fitting across the cohort of subjects undergoing testing with thefood stimuli, can be found in Table 6. Note the similar sets of behavioral patterns in this figure to those shown in Figures 2–6, 8, and 9.doi:10.1371/journal.pone.0010613.g010
Law-Like Reward Patterns
PLoS ONE | www.plosone.org 16 May 2010 | Volume 5 | Issue 5 | e10613
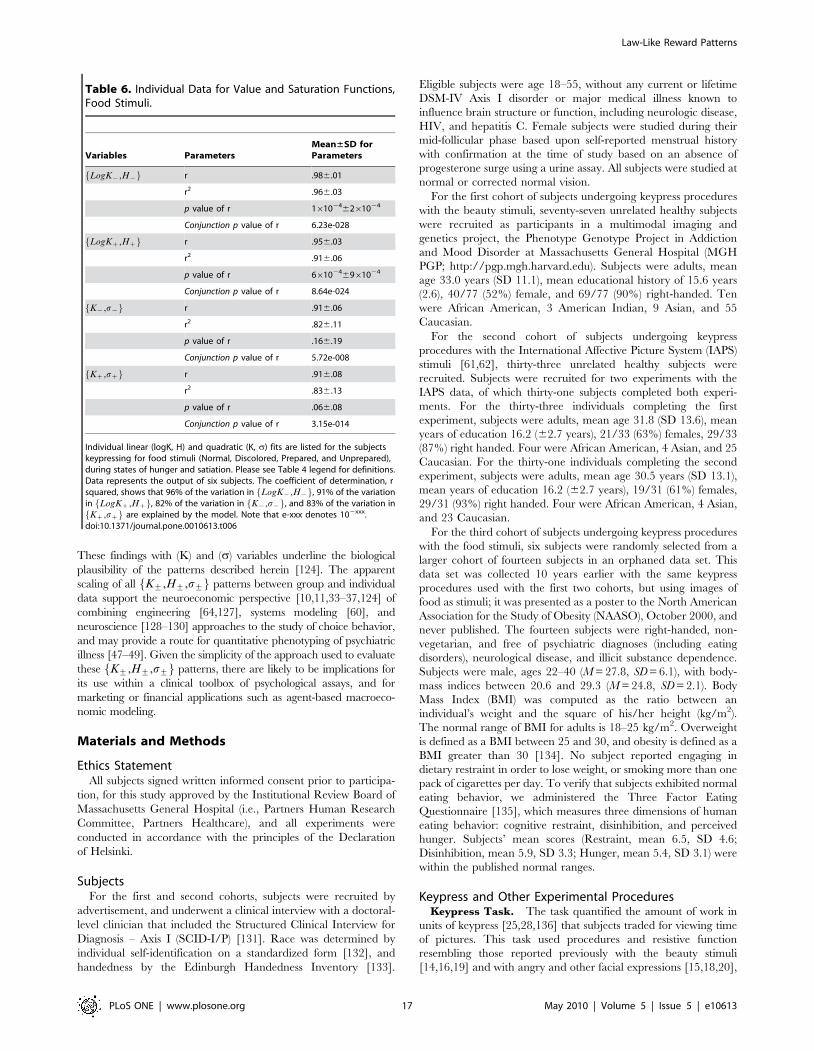
These findings with (K) and (s) variables underline the biological
plausibility of the patterns described herein [124]. The apparent
scaling of all K+,H+,s+f g patterns between group and individual
data support the neuroeconomic perspective [10,11,33–37,124] of
combining engineering [64,127], systems modeling [60], and
neuroscience [128–130] approaches to the study of choice behavior,
and may provide a route for quantitative phenotyping of psychiatric
illness [47–49]. Given the simplicity of the approach used to evaluate
these K+,H+,s+f g patterns, there are likely to be implications for
its use within a clinical toolbox of psychological assays, and for
marketing or financial applications such as agent-based macroeco-
nomic modeling.
Materials and Methods
Ethics StatementAll subjects signed written informed consent prior to participa-
tion, for this study approved by the Institutional Review Board of
Massachusetts General Hospital (i.e., Partners Human Research
Committee, Partners Healthcare), and all experiments were
conducted in accordance with the principles of the Declaration
of Helsinki.
SubjectsFor the first and second cohorts, subjects were recruited by
advertisement, and underwent a clinical interview with a doctoral-
level clinician that included the Structured Clinical Interview for
Diagnosis – Axis I (SCID-I/P) [131]. Race was determined by
individual self-identification on a standardized form [132], and
handedness by the Edinburgh Handedness Inventory [133].
Eligible subjects were age 18–55, without any current or lifetime
DSM-IV Axis I disorder or major medical illness known to
influence brain structure or function, including neurologic disease,
HIV, and hepatitis C. Female subjects were studied during their
mid-follicular phase based upon self-reported menstrual history
with confirmation at the time of study based on an absence of
progesterone surge using a urine assay. All subjects were studied at
normal or corrected normal vision.
For the first cohort of subjects undergoing keypress procedures
with the beauty stimuli, seventy-seven unrelated healthy subjects
were recruited as participants in a multimodal imaging and
genetics project, the Phenotype Genotype Project in Addiction
and Mood Disorder at Massachusetts General Hospital (MGH
PGP; http://pgp.mgh.harvard.edu). Subjects were adults, mean
age 33.0 years (SD 11.1), mean educational history of 15.6 years
(2.6), 40/77 (52%) female, and 69/77 (90%) right-handed. Ten
were African American, 3 American Indian, 9 Asian, and 55
Caucasian.
For the second cohort of subjects undergoing keypress
procedures with the International Affective Picture System (IAPS)
stimuli [61,62], thirty-three unrelated healthy subjects were
recruited. Subjects were recruited for two experiments with the
IAPS data, of which thirty-one subjects completed both experi-
ments. For the thirty-three individuals completing the first
experiment, subjects were adults, mean age 31.8 (SD 13.6), mean
years of education 16.2 (62.7 years), 21/33 (63%) females, 29/33
(87%) right handed. Four were African American, 4 Asian, and 25
Caucasian. For the thirty-one individuals completing the second
experiment, subjects were adults, mean age 30.5 years (SD 13.1),
mean years of education 16.2 (62.7 years), 19/31 (61%) females,
29/31 (93%) right handed. Four were African American, 4 Asian,
and 23 Caucasian.
For the third cohort of subjects undergoing keypress procedures
with the food stimuli, six subjects were randomly selected from a
larger cohort of fourteen subjects in an orphaned data set. This
data set was collected 10 years earlier with the same keypress
procedures used with the first two cohorts, but using images of
food as stimuli; it was presented as a poster to the North American
Association for the Study of Obesity (NAASO), October 2000, and
never published. The fourteen subjects were right-handed, non-
vegetarian, and free of psychiatric diagnoses (including eating
disorders), neurological disease, and illicit substance dependence.
Subjects were male, ages 22–40 (M = 27.8, SD = 6.1), with body-
mass indices between 20.6 and 29.3 (M = 24.8, SD = 2.1). Body
Mass Index (BMI) was computed as the ratio between an
individual’s weight and the square of his/her height (kg/m2).
The normal range of BMI for adults is 18–25 kg/m2. Overweight
is defined as a BMI between 25 and 30, and obesity is defined as a
BMI greater than 30 [134]. No subject reported engaging in
dietary restraint in order to lose weight, or smoking more than one
pack of cigarettes per day. To verify that subjects exhibited normal
eating behavior, we administered the Three Factor Eating
Questionnaire [135], which measures three dimensions of human
eating behavior: cognitive restraint, disinhibition, and perceived
hunger. Subjects’ mean scores (Restraint, mean 6.5, SD 4.6;
Disinhibition, mean 5.9, SD 3.3; Hunger, mean 5.4, SD 3.1) were
within the published normal ranges.
Keypress and Other Experimental ProceduresKeypress Task. The task quantified the amount of work in
units of keypress [25,28,136] that subjects traded for viewing time
of pictures. This task used procedures and resistive function
resembling those reported previously with the beauty stimuli
[14,16,19] and with angry and other facial expressions [15,18,20],
Table 6. Individual Data for Value and Saturation Functions,Food Stimuli.
Variables ParametersMean±SD forParameters
LogK{,H{f g r .986.01
r2 .966.03
p value of r 1610246261024
Conjunction p value of r 6.23e-028
LogKz,Hzf g r .956.03
r2 .916.06
p value of r 6610246961024
Conjunction p value of r 8.64e-024
K{,s{f g r .916.06
r2 .826.11
p value of r .166.19
Conjunction p value of r 5.72e-008
Kz,szf g r .916.08
r2 .836.13
p value of r .066.08
Conjunction p value of r 3.15e-014
Individual linear (logK, H) and quadratic (K, s) fits are listed for the subjectskeypressing for food stimuli (Normal, Discolored, Prepared, and Unprepared),during states of hunger and satiation. Please see Table 4 legend for definitions.Data represents the output of six subjects. The coefficient of determination, rsquared, shows that 96% of the variation in LogK{,H{f g, 91% of the variationin LogKz,Hzf g, 82% of the variation in K{,s{f g, and 83% of the variation inKz,szf g are explained by the model. Note that e-xxx denotes 102xxx.
doi:10.1371/journal.pone.0010613.t006
Law-Like Reward Patterns
PLoS ONE | www.plosone.org 17 May 2010 | Volume 5 | Issue 5 | e10613
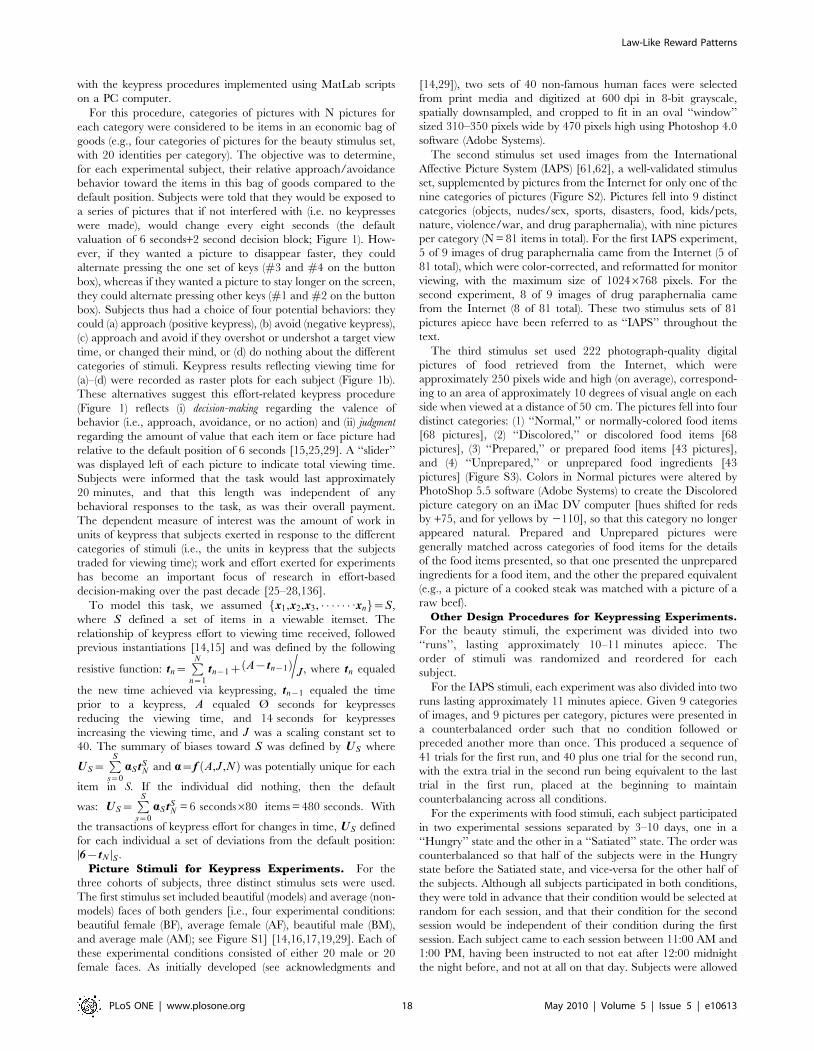
with the keypress procedures implemented using MatLab scripts
on a PC computer.
For this procedure, categories of pictures with N pictures for
each category were considered to be items in an economic bag of
goods (e.g., four categories of pictures for the beauty stimulus set,
with 20 identities per category). The objective was to determine,
for each experimental subject, their relative approach/avoidance
behavior toward the items in this bag of goods compared to the
default position. Subjects were told that they would be exposed to
a series of pictures that if not interfered with (i.e. no keypresses
were made), would change every eight seconds (the default
valuation of 6 seconds+2 second decision block; Figure 1). How-
ever, if they wanted a picture to disappear faster, they could
alternate pressing the one set of keys (#3 and #4 on the button
box), whereas if they wanted a picture to stay longer on the screen,
they could alternate pressing other keys (#1 and #2 on the button
box). Subjects thus had a choice of four potential behaviors: they
could (a) approach (positive keypress), (b) avoid (negative keypress),
(c) approach and avoid if they overshot or undershot a target view
time, or changed their mind, or (d) do nothing about the different
categories of stimuli. Keypress results reflecting viewing time for
(a)–(d) were recorded as raster plots for each subject (Figure 1b).
These alternatives suggest this effort-related keypress procedure
(Figure 1) reflects (i) decision-making regarding the valence of
behavior (i.e., approach, avoidance, or no action) and (ii) judgment
regarding the amount of value that each item or face picture had
relative to the default position of 6 seconds [15,25,29]. A ‘‘slider’’
was displayed left of each picture to indicate total viewing time.
Subjects were informed that the task would last approximately
20 minutes, and that this length was independent of any
behavioral responses to the task, as was their overall payment.
The dependent measure of interest was the amount of work in
units of keypress that subjects exerted in response to the different
categories of stimuli (i.e., the units in keypress that the subjects
traded for viewing time); work and effort exerted for experiments
has become an important focus of research in effort-based
decision-making over the past decade [25–28,136].
To model this task, we assumed x1,x2,x3, � � � � � � :xnf g~S,
where S defined a set of items in a viewable itemset. The
relationship of keypress effort to viewing time received, followed
previous instantiations [14,15] and was defined by the following
resistive function: tn~PN
n~1
tn{1z A{tn{1ð Þ=J, where tn equaled
the new time achieved via keypressing, tn{1 equaled the time
prior to a keypress, A equaled Ø seconds for keypresses
reducing the viewing time, and 14 seconds for keypresses
increasing the viewing time, and J was a scaling constant set to
40. The summary of biases toward S was defined by US where
US~PSs~0
aStSN and a~f A,J,Nð Þ was potentially unique for each
item in S. If the individual did nothing, then the default
was: US~PSs~0
aStSN = 6 seconds680 items = 480 seconds. With
the transactions of keypress effort for changes in time, US defined
for each individual a set of deviations from the default position:
D6{tN DS .
Picture Stimuli for Keypress Experiments. For the
three cohorts of subjects, three distinct stimulus sets were used.
The first stimulus set included beautiful (models) and average (non-
models) faces of both genders [i.e., four experimental conditions:
beautiful female (BF), average female (AF), beautiful male (BM),
and average male (AM); see Figure S1] [14,16,17,19,29]. Each of
these experimental conditions consisted of either 20 male or 20
female faces. As initially developed (see acknowledgments and
[14,29]), two sets of 40 non-famous human faces were selected
from print media and digitized at 600 dpi in 8-bit grayscale,
spatially downsampled, and cropped to fit in an oval ‘‘window’’
sized 310–350 pixels wide by 470 pixels high using Photoshop 4.0
software (Adobe Systems).
The second stimulus set used images from the International
Affective Picture System (IAPS) [61,62], a well-validated stimulus
set, supplemented by pictures from the Internet for only one of the
nine categories of pictures (Figure S2). Pictures fell into 9 distinct
categories (objects, nudes/sex, sports, disasters, food, kids/pets,
nature, violence/war, and drug paraphernalia), with nine pictures
per category (N = 81 items in total). For the first IAPS experiment,
5 of 9 images of drug paraphernalia came from the Internet (5 of
81 total), which were color-corrected, and reformatted for monitor
viewing, with the maximum size of 10246768 pixels. For the
second experiment, 8 of 9 images of drug paraphernalia came
from the Internet (8 of 81 total). These two stimulus sets of 81
pictures apiece have been referred to as ‘‘IAPS’’ throughout the
text.
The third stimulus set used 222 photograph-quality digital
pictures of food retrieved from the Internet, which were
approximately 250 pixels wide and high (on average), correspond-
ing to an area of approximately 10 degrees of visual angle on each
side when viewed at a distance of 50 cm. The pictures fell into four
distinct categories: (1) ‘‘Normal,’’ or normally-colored food items
[68 pictures], (2) ‘‘Discolored,’’ or discolored food items [68
pictures], (3) ‘‘Prepared,’’ or prepared food items [43 pictures],
and (4) ‘‘Unprepared,’’ or unprepared food ingredients [43
pictures] (Figure S3). Colors in Normal pictures were altered by
PhotoShop 5.5 software (Adobe Systems) to create the Discolored
picture category on an iMac DV computer [hues shifted for reds
by +75, and for yellows by 2110], so that this category no longer
appeared natural. Prepared and Unprepared pictures were
generally matched across categories of food items for the details
of the food items presented, so that one presented the unprepared
ingredients for a food item, and the other the prepared equivalent
(e.g., a picture of a cooked steak was matched with a picture of a
raw beef).
Other Design Procedures for Keypressing Experiments.
For the beauty stimuli, the experiment was divided into two
‘‘runs’’, lasting approximately 10–11 minutes apiece. The
order of stimuli was randomized and reordered for each
subject.
For the IAPS stimuli, each experiment was also divided into two
runs lasting approximately 11 minutes apiece. Given 9 categories
of images, and 9 pictures per category, pictures were presented in
a counterbalanced order such that no condition followed or
preceded another more than once. This produced a sequence of
41 trials for the first run, and 40 plus one trial for the second run,
with the extra trial in the second run being equivalent to the last
trial in the first run, placed at the beginning to maintain
counterbalancing across all conditions.
For the experiments with food stimuli, each subject participated
in two experimental sessions separated by 3–10 days, one in a
‘‘Hungry’’ state and the other in a ‘‘Satiated’’ state. The order was
counterbalanced so that half of the subjects were in the Hungry
state before the Satiated state, and vice-versa for the other half of
the subjects. Although all subjects participated in both conditions,
they were told in advance that their condition would be selected at
random for each session, and that their condition for the second
session would be independent of their condition during the first
session. Each subject came to each session between 11:00 AM and
1:00 PM, having been instructed to not eat after 12:00 midnight
the night before, and not at all on that day. Subjects were allowed
Law-Like Reward Patterns
PLoS ONE | www.plosone.org 18 May 2010 | Volume 5 | Issue 5 | e10613
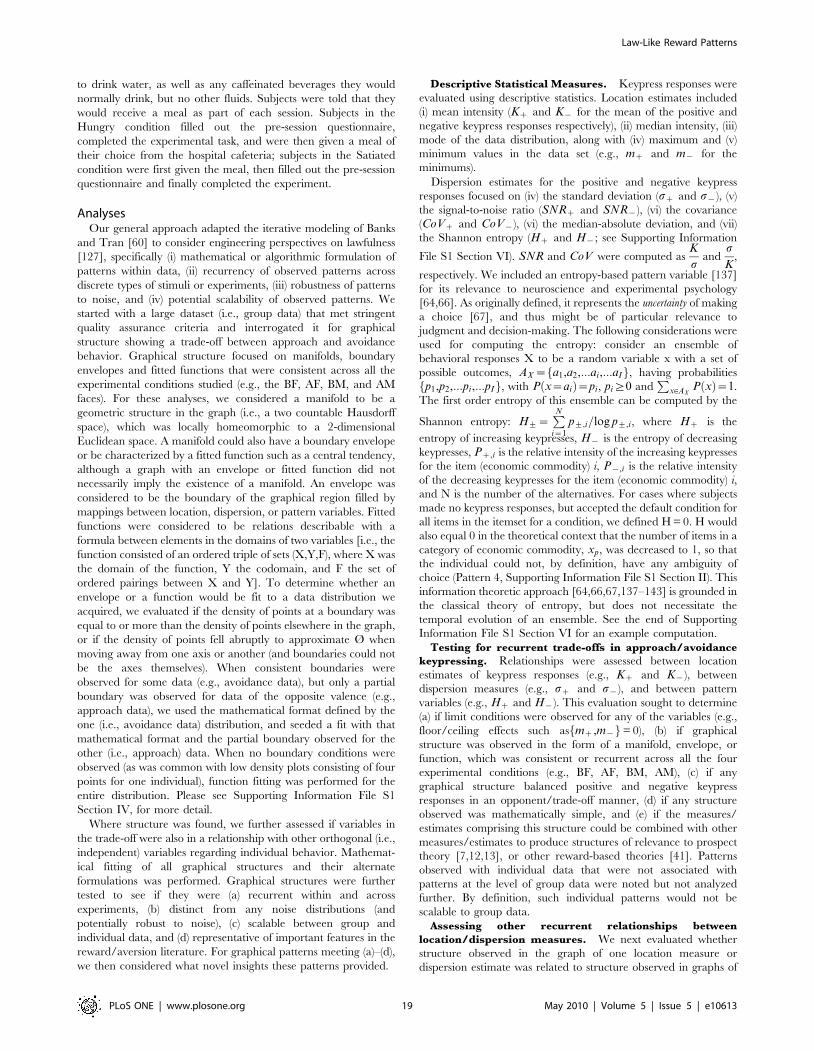
to drink water, as well as any caffeinated beverages they would
normally drink, but no other fluids. Subjects were told that they
would receive a meal as part of each session. Subjects in the
Hungry condition filled out the pre-session questionnaire,
completed the experimental task, and were then given a meal of
their choice from the hospital cafeteria; subjects in the Satiated
condition were first given the meal, then filled out the pre-session
questionnaire and finally completed the experiment.
AnalysesOur general approach adapted the iterative modeling of Banks
and Tran [60] to consider engineering perspectives on lawfulness
[127], specifically (i) mathematical or algorithmic formulation of
patterns within data, (ii) recurrency of observed patterns across
discrete types of stimuli or experiments, (iii) robustness of patterns
to noise, and (iv) potential scalability of observed patterns. We
started with a large dataset (i.e., group data) that met stringent
quality assurance criteria and interrogated it for graphical
structure showing a trade-off between approach and avoidance
behavior. Graphical structure focused on manifolds, boundary
envelopes and fitted functions that were consistent across all the
experimental conditions studied (e.g., the BF, AF, BM, and AM
faces). For these analyses, we considered a manifold to be a
geometric structure in the graph (i.e., a two countable Hausdorff
space), which was locally homeomorphic to a 2-dimensional
Euclidean space. A manifold could also have a boundary envelope
or be characterized by a fitted function such as a central tendency,
although a graph with an envelope or fitted function did not
necessarily imply the existence of a manifold. An envelope was
considered to be the boundary of the graphical region filled by
mappings between location, dispersion, or pattern variables. Fitted
functions were considered to be relations describable with a
formula between elements in the domains of two variables [i.e., the
function consisted of an ordered triple of sets (X,Y,F), where X was
the domain of the function, Y the codomain, and F the set of
ordered pairings between X and Y]. To determine whether an
envelope or a function would be fit to a data distribution we
acquired, we evaluated if the density of points at a boundary was
equal to or more than the density of points elsewhere in the graph,
or if the density of points fell abruptly to approximate Ø when
moving away from one axis or another (and boundaries could not
be the axes themselves). When consistent boundaries were
observed for some data (e.g., avoidance data), but only a partial
boundary was observed for data of the opposite valence (e.g.,
approach data), we used the mathematical format defined by the
one (i.e., avoidance data) distribution, and seeded a fit with that
mathematical format and the partial boundary observed for the
other (i.e., approach) data. When no boundary conditions were
observed (as was common with low density plots consisting of four
points for one individual), function fitting was performed for the
entire distribution. Please see Supporting Information File S1
Section IV, for more detail.
Where structure was found, we further assessed if variables in
the trade-off were also in a relationship with other orthogonal (i.e.,
independent) variables regarding individual behavior. Mathemat-
ical fitting of all graphical structures and their alternate
formulations was performed. Graphical structures were further
tested to see if they were (a) recurrent within and across
experiments, (b) distinct from any noise distributions (and
potentially robust to noise), (c) scalable between group and
individual data, and (d) representative of important features in the
reward/aversion literature. For graphical patterns meeting (a)–(d),
we then considered what novel insights these patterns provided.
Descriptive Statistical Measures. Keypress responses were
evaluated using descriptive statistics. Location estimates included
(i) mean intensity (Kz and K{ for the mean of the positive and
negative keypress responses respectively), (ii) median intensity, (iii)
mode of the data distribution, along with (iv) maximum and (v)
minimum values in the data set (e.g., mz and m{ for the
minimums).
Dispersion estimates for the positive and negative keypress
responses focused on (iv) the standard deviation (sz and s{), (v)
the signal-to-noise ratio (SNRz and SNR{), (vi) the covariance
(CoVz and CoV{), (vi) the median-absolute deviation, and (vii)
the Shannon entropy (Hz and H{; see Supporting Information
File S1 Section VI). SNR and CoV were computed asK
sand
s
K,
respectively. We included an entropy-based pattern variable [137]
for its relevance to neuroscience and experimental psychology
[64,66]. As originally defined, it represents the uncertainty of making
a choice [67], and thus might be of particular relevance to
judgment and decision-making. The following considerations were
used for computing the entropy: consider an ensemble of
behavioral responses X to be a random variable x with a set of
possible outcomes, AX ~ a1,a2,:::ai,:::aIf g, having probabilities
p1,p2,:::pi,:::pIf g, with P x~aið Þ~pi, pi§0 andP
x[AXP xð Þ~1.
The first order entropy of this ensemble can be computed by the
Shannon entropy: H+~PNi~1
p+,i=log p+,i, where Hz is the
entropy of increasing keypresses, H{ is the entropy of decreasing
keypresses, Pz,i is the relative intensity of the increasing keypresses
for the item (economic commodity) i, P{,i is the relative intensity
of the decreasing keypresses for the item (economic commodity) i,
and N is the number of the alternatives. For cases where subjects
made no keypress responses, but accepted the default condition for
all items in the itemset for a condition, we defined H = 0. H would
also equal 0 in the theoretical context that the number of items in a
category of economic commodity, xp, was decreased to 1, so that
the individual could not, by definition, have any ambiguity of
choice (Pattern 4, Supporting Information File S1 Section II). This
information theoretic approach [64,66,67,137–143] is grounded in
the classical theory of entropy, but does not necessitate the
temporal evolution of an ensemble. See the end of Supporting
Information File S1 Section VI for an example computation.
Testing for recurrent trade-offs in approach/avoidance
keypressing. Relationships were assessed between location
estimates of keypress responses (e.g., Kz and K{), between
dispersion measures (e.g., sz and s{), and between pattern
variables (e.g., Hz and H{). This evaluation sought to determine
(a) if limit conditions were observed for any of the variables (e.g.,
floor/ceiling effects such as mz,m{f g= 0), (b) if graphical
structure was observed in the form of a manifold, envelope, or
function, which was consistent or recurrent across all the four
experimental conditions (e.g., BF, AF, BM, AM), (c) if any
graphical structure balanced positive and negative keypress
responses in an opponent/trade-off manner, (d) if any structure
observed was mathematically simple, and (e) if the measures/
estimates comprising this structure could be combined with other
measures/estimates to produce structures of relevance to prospect
theory [7,12,13], or other reward-based theories [41]. Patterns
observed with individual data that were not associated with
patterns at the level of group data were noted but not analyzed
further. By definition, such individual patterns would not be
scalable to group data.
Assessing other recurrent relationships between
location/dispersion measures. We next evaluated whether
structure observed in the graph of one location measure or
dispersion estimate was related to structure observed in graphs of
Law-Like Reward Patterns
PLoS ONE | www.plosone.org 19 May 2010 | Volume 5 | Issue 5 | e10613
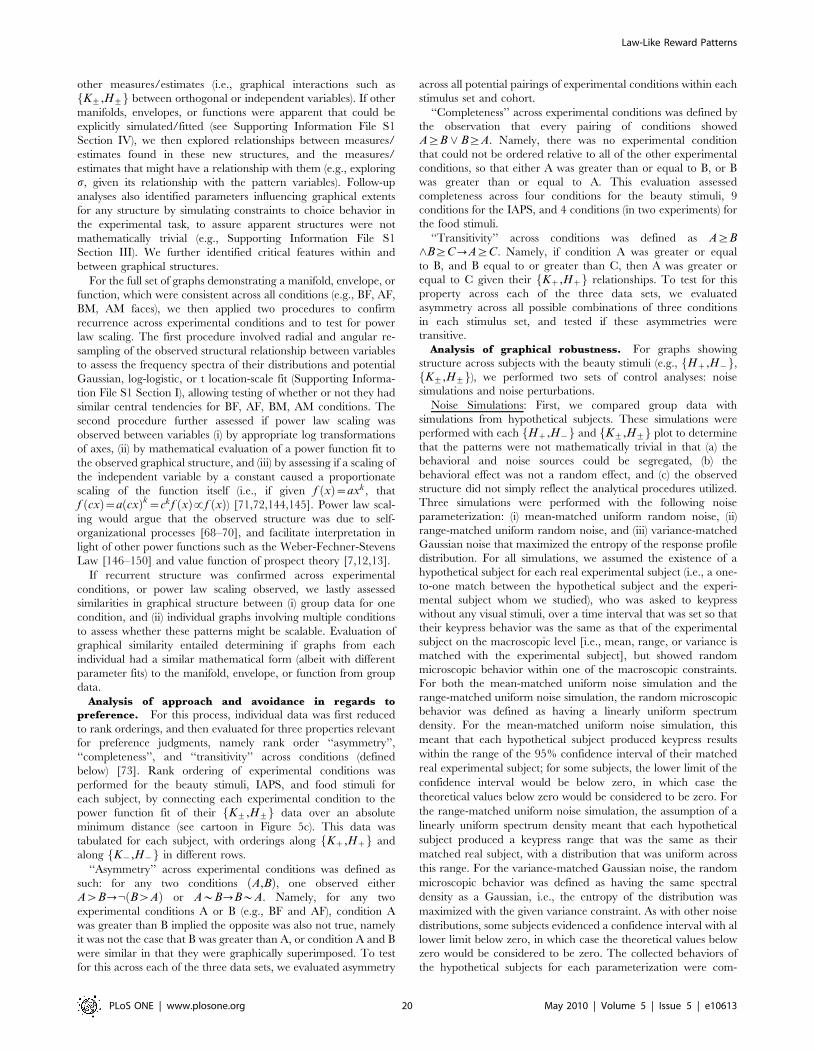
other measures/estimates (i.e., graphical interactions such as
K+,H+f g between orthogonal or independent variables). If other
manifolds, envelopes, or functions were apparent that could be
explicitly simulated/fitted (see Supporting Information File S1
Section IV), we then explored relationships between measures/
estimates found in these new structures, and the measures/
estimates that might have a relationship with them (e.g., exploring
s, given its relationship with the pattern variables). Follow-up
analyses also identified parameters influencing graphical extents
for any structure by simulating constraints to choice behavior in
the experimental task, to assure apparent structures were not
mathematically trivial (e.g., Supporting Information File S1
Section III). We further identified critical features within and
between graphical structures.
For the full set of graphs demonstrating a manifold, envelope, or
function, which were consistent across all conditions (e.g., BF, AF,
BM, AM faces), we then applied two procedures to confirm
recurrence across experimental conditions and to test for power
law scaling. The first procedure involved radial and angular re-
sampling of the observed structural relationship between variables
to assess the frequency spectra of their distributions and potential
Gaussian, log-logistic, or t location-scale fit (Supporting Informa-
tion File S1 Section I), allowing testing of whether or not they had
similar central tendencies for BF, AF, BM, AM conditions. The
second procedure further assessed if power law scaling was
observed between variables (i) by appropriate log transformations
of axes, (ii) by mathematical evaluation of a power function fit to
the observed graphical structure, and (iii) by assessing if a scaling of
the independent variable by a constant caused a proportionate
scaling of the function itself (i.e., if given f xð Þ~axk, that
f cxð Þ~a cxð Þk~ckf xð Þ!f xð Þ) [71,72,144,145]. Power law scal-
ing would argue that the observed structure was due to self-
organizational processes [68–70], and facilitate interpretation in
light of other power functions such as the Weber-Fechner-Stevens
Law [146–150] and value function of prospect theory [7,12,13].
If recurrent structure was confirmed across experimental
conditions, or power law scaling observed, we lastly assessed
similarities in graphical structure between (i) group data for one
condition, and (ii) individual graphs involving multiple conditions
to assess whether these patterns might be scalable. Evaluation of
graphical similarity entailed determining if graphs from each
individual had a similar mathematical form (albeit with different
parameter fits) to the manifold, envelope, or function from group
data.
Analysis of approach and avoidance in regards to
preference. For this process, individual data was first reduced
to rank orderings, and then evaluated for three properties relevant
for preference judgments, namely rank order ‘‘asymmetry’’,
‘‘completeness’’, and ‘‘transitivity’’ across conditions (defined
below) [73]. Rank ordering of experimental conditions was
performed for the beauty stimuli, IAPS, and food stimuli for
each subject, by connecting each experimental condition to the
power function fit of their K+,H+f g data over an absolute
minimum distance (see cartoon in Figure 5c). This data was
tabulated for each subject, with orderings along Kz,Hzf g and
along K{,H{f g in different rows.
‘‘Asymmetry’’ across experimental conditions was defined as
such: for any two conditions A,Bð Þ, one observed either
AwB?: BwAð Þ or A*B?B*A. Namely, for any two
experimental conditions A or B (e.g., BF and AF), condition A
was greater than B implied the opposite was also not true, namely
it was not the case that B was greater than A, or condition A and B
were similar in that they were graphically superimposed. To test
for this across each of the three data sets, we evaluated asymmetry
across all potential pairings of experimental conditions within each
stimulus set and cohort.
‘‘Completeness’’ across experimental conditions was defined by
the observation that every pairing of conditions showed
A§B _ B§A. Namely, there was no experimental condition
that could not be ordered relative to all of the other experimental
conditions, so that either A was greater than or equal to B, or B
was greater than or equal to A. This evaluation assessed
completeness across four conditions for the beauty stimuli, 9
conditions for the IAPS, and 4 conditions (in two experiments) for
the food stimuli.
‘‘Transitivity’’ across conditions was defined as A§B^B§C?A§C. Namely, if condition A was greater or equal
to B, and B equal to or greater than C, then A was greater or
equal to C given their Kz,Hzf g relationships. To test for this
property across each of the three data sets, we evaluated
asymmetry across all possible combinations of three conditions
in each stimulus set, and tested if these asymmetries were
transitive.
Analysis of graphical robustness. For graphs showing
structure across subjects with the beauty stimuli (e.g., Hz,H{f g,K+,H+f g), we performed two sets of control analyses: noise
simulations and noise perturbations.
Noise Simulations: First, we compared group data with
simulations from hypothetical subjects. These simulations were
performed with each Hz,H{f g and K+,H+f g plot to determine
that the patterns were not mathematically trivial in that (a) the
behavioral and noise sources could be segregated, (b) the
behavioral effect was not a random effect, and (c) the observed
structure did not simply reflect the analytical procedures utilized.
Three simulations were performed with the following noise
parameterization: (i) mean-matched uniform random noise, (ii)
range-matched uniform random noise, and (iii) variance-matched
Gaussian noise that maximized the entropy of the response profile
distribution. For all simulations, we assumed the existence of a
hypothetical subject for each real experimental subject (i.e., a one-
to-one match between the hypothetical subject and the experi-
mental subject whom we studied), who was asked to keypress
without any visual stimuli, over a time interval that was set so that
their keypress behavior was the same as that of the experimental
subject on the macroscopic level [i.e., mean, range, or variance is
matched with the experimental subject], but showed random
microscopic behavior within one of the macroscopic constraints.
For both the mean-matched uniform noise simulation and the
range-matched uniform noise simulation, the random microscopic
behavior was defined as having a linearly uniform spectrum
density. For the mean-matched uniform noise simulation, this
meant that each hypothetical subject produced keypress results
within the range of the 95% confidence interval of their matched
real experimental subject; for some subjects, the lower limit of the
confidence interval would be below zero, in which case the
theoretical values below zero would be considered to be zero. For
the range-matched uniform noise simulation, the assumption of a
linearly uniform spectrum density meant that each hypothetical
subject produced a keypress range that was the same as their
matched real subject, with a distribution that was uniform across
this range. For the variance-matched Gaussian noise, the random
microscopic behavior was defined as having the same spectral
density as a Gaussian, i.e., the entropy of the distribution was
maximized with the given variance constraint. As with other noise
distributions, some subjects evidenced a confidence interval with al
lower limit below zero, in which case the theoretical values below
zero would be considered to be zero. The collected behaviors of
the hypothetical subjects for each parameterization were com-
Law-Like Reward Patterns
PLoS ONE | www.plosone.org 20 May 2010 | Volume 5 | Issue 5 | e10613
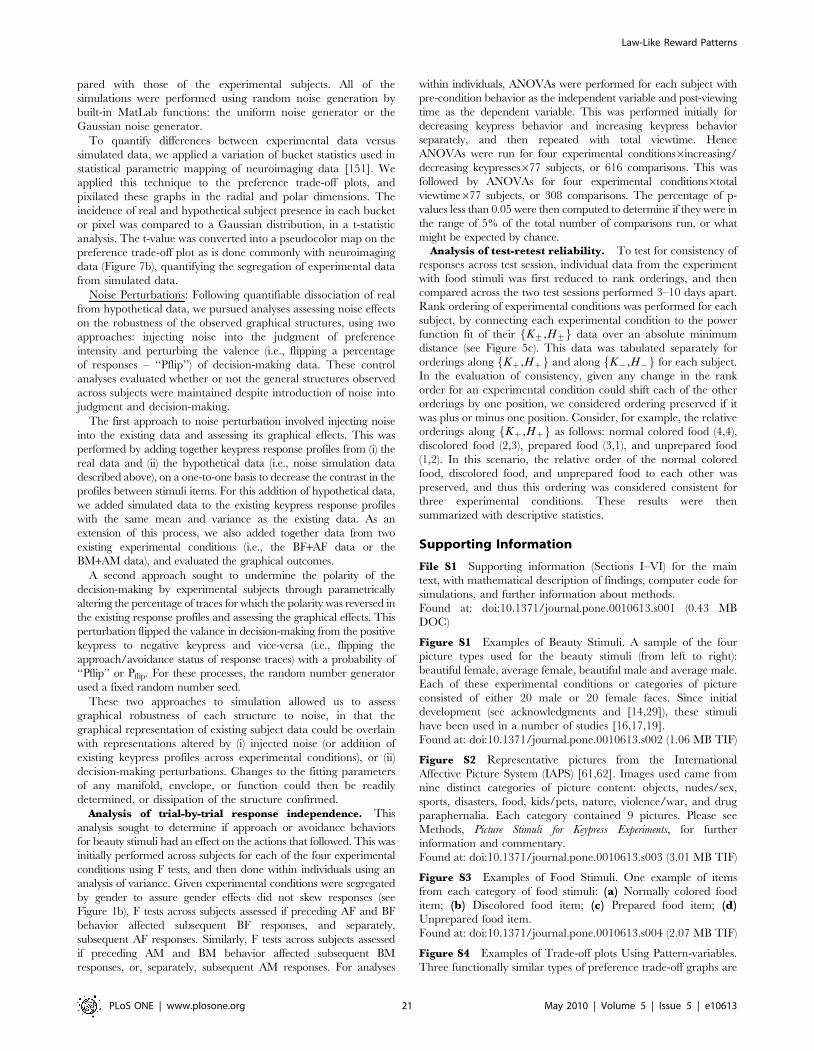
pared with those of the experimental subjects. All of the
simulations were performed using random noise generation by
built-in MatLab functions: the uniform noise generator or the
Gaussian noise generator.
To quantify differences between experimental data versus
simulated data, we applied a variation of bucket statistics used in
statistical parametric mapping of neuroimaging data [151]. We
applied this technique to the preference trade-off plots, and
pixilated these graphs in the radial and polar dimensions. The
incidence of real and hypothetical subject presence in each bucket
or pixel was compared to a Gaussian distribution, in a t-statistic
analysis. The t-value was converted into a pseudocolor map on the
preference trade-off plot as is done commonly with neuroimaging
data (Figure 7b), quantifying the segregation of experimental data
from simulated data.
Noise Perturbations: Following quantifiable dissociation of real
from hypothetical data, we pursued analyses assessing noise effects
on the robustness of the observed graphical structures, using two
approaches: injecting noise into the judgment of preference
intensity and perturbing the valence (i.e., flipping a percentage
of responses – ‘‘Pflip’’) of decision-making data. These control
analyses evaluated whether or not the general structures observed
across subjects were maintained despite introduction of noise into
judgment and decision-making.
The first approach to noise perturbation involved injecting noise
into the existing data and assessing its graphical effects. This was
performed by adding together keypress response profiles from (i) the
real data and (ii) the hypothetical data (i.e., noise simulation data
described above), on a one-to-one basis to decrease the contrast in the
profiles between stimuli items. For this addition of hypothetical data,
we added simulated data to the existing keypress response profiles
with the same mean and variance as the existing data. As an
extension of this process, we also added together data from two
existing experimental conditions (i.e., the BF+AF data or the
BM+AM data), and evaluated the graphical outcomes.
A second approach sought to undermine the polarity of the
decision-making by experimental subjects through parametrically
altering the percentage of traces for which the polarity was reversed in
the existing response profiles and assessing the graphical effects. This
perturbation flipped the valance in decision-making from the positive
keypress to negative keypress and vice-versa (i.e., flipping the
approach/avoidance status of response traces) with a probability of
‘‘Pflip’’ or Pflip. For these processes, the random number generator
used a fixed random number seed.
These two approaches to simulation allowed us to assess
graphical robustness of each structure to noise, in that the
graphical representation of existing subject data could be overlain
with representations altered by (i) injected noise (or addition of
existing keypress profiles across experimental conditions), or (ii)
decision-making perturbations. Changes to the fitting parameters
of any manifold, envelope, or function could then be readily
determined, or dissipation of the structure confirmed.
Analysis of trial-by-trial response independence. This
analysis sought to determine if approach or avoidance behaviors
for beauty stimuli had an effect on the actions that followed. This was
initially performed across subjects for each of the four experimental
conditions using F tests, and then done within individuals using an
analysis of variance. Given experimental conditions were segregated
by gender to assure gender effects did not skew responses (see
Figure 1b), F tests across subjects assessed if preceding AF and BF
behavior affected subsequent BF responses, and separately,
subsequent AF responses. Similarly, F tests across subjects assessed
if preceding AM and BM behavior affected subsequent BM
responses, or, separately, subsequent AM responses. For analyses
within individuals, ANOVAs were performed for each subject with
pre-condition behavior as the independent variable and post-viewing
time as the dependent variable. This was performed initially for
decreasing keypress behavior and increasing keypress behavior
separately, and then repeated with total viewtime. Hence
ANOVAs were run for four experimental conditions6increasing/
decreasing keypresses677 subjects, or 616 comparisons. This was
followed by ANOVAs for four experimental conditions6total
viewtime677 subjects, or 308 comparisons. The percentage of p-
values less than 0.05 were then computed to determine if they were in
the range of 5% of the total number of comparisons run, or what
might be expected by chance.Analysis of test-retest reliability. To test for consistency of
responses across test session, individual data from the experiment
with food stimuli was first reduced to rank orderings, and then
compared across the two test sessions performed 3–10 days apart.
Rank ordering of experimental conditions was performed for each
subject, by connecting each experimental condition to the power
function fit of their K+,H+f g data over an absolute minimum
distance (see Figure 5c). This data was tabulated separately for
orderings along Kz,Hzf g and along K{,H{f g for each subject.
In the evaluation of consistency, given any change in the rank
order for an experimental condition could shift each of the other
orderings by one position, we considered ordering preserved if it
was plus or minus one position. Consider, for example, the relative
orderings along Kz,Hzf g as follows: normal colored food (4,4),
discolored food (2,3), prepared food (3,1), and unprepared food
(1,2). In this scenario, the relative order of the normal colored
food, discolored food, and unprepared food to each other was
preserved, and thus this ordering was considered consistent for
three experimental conditions. These results were then
summarized with descriptive statistics.
Supporting Information
File S1 Supporting information (Sections I–VI) for the main
text, with mathematical description of findings, computer code for
simulations, and further information about methods.
Found at: doi:10.1371/journal.pone.0010613.s001 (0.43 MB
DOC)
Figure S1 Examples of Beauty Stimuli. A sample of the four
picture types used for the beauty stimuli (from left to right):
beautiful female, average female, beautiful male and average male.
Each of these experimental conditions or categories of picture
consisted of either 20 male or 20 female faces. Since initial
development (see acknowledgments and [14,29]), these stimuli
have been used in a number of studies [16,17,19].
Found at: doi:10.1371/journal.pone.0010613.s002 (1.06 MB TIF)
Figure S2 Representative pictures from the International
Affective Picture System (IAPS) [61,62]. Images used came from
nine distinct categories of picture content: objects, nudes/sex,
sports, disasters, food, kids/pets, nature, violence/war, and drug
paraphernalia. Each category contained 9 pictures. Please see
Methods, Picture Stimuli for Keypress Experiments, for further
information and commentary.
Found at: doi:10.1371/journal.pone.0010613.s003 (3.01 MB TIF)
Figure S3 Examples of Food Stimuli. One example of items
from each category of food stimuli: (a) Normally colored food
item; (b) Discolored food item; (c) Prepared food item; (d)Unprepared food item.
Found at: doi:10.1371/journal.pone.0010613.s004 (2.07 MB TIF)
Figure S4 Examples of Trade-off plots Using Pattern-variables.
Three functionally similar types of preference trade-off graphs are
Law-Like Reward Patterns
PLoS ONE | www.plosone.org 21 May 2010 | Volume 5 | Issue 5 | e10613
displayed for H, SNR, and CoV estimates. In (a), a graph is
displayed of the Shannon entropy for increasing keypress
responses (y axis) versus the entropy for decreasing keypress
responses (x axis) for responses to BF, AF, AM, AM faces in 77
healthy control subjects. For the same set of experimental subjects,
we show in (b) a graph for the CoVz,CoV{f g manifold, and in
(c) a graph for SNRz,SNR{f g, which represents a boundary
envelope.
Found at: doi:10.1371/journal.pone.0010613.s005 (0.25 MB TIF)
Figure S5 Radial Distributions from Trade-off Plots. Each
graph represents the data from 77 healthy controls, for one
experimental condition (i.e., BF, AF, BM, AM faces), with three
types of fitting of the radial distribution from the trade-off plot of
that experimental condition. Radial sampling of the preference
trade-off graphs for these four experimental conditions were
tabulated using bins of 0.2 bits (in gray-tone lines off the x-axis).
Bin height reflected the normalized number of data points across
77 subjects. Fitting through three methods (see Supporting
Information File S1 Section I) was performed, so that each of
the resulting curves contains the same area or number of samples.
Qualitatively, the best fit is observed with the t location-scale
distribution.
Found at: doi:10.1371/journal.pone.0010613.s006 (0.46 MB TIF)
Figure S6 Trade-off Plots for Total Viewtime Versus Keypress
Number. The resistive function used to translate keypress effort
into viewing time theoretically might influence the form of the
preference trade-off, the value function or the saturation function.
To rule this out, we analyzed total viewtime data (symbolized by
T(K+) or T(K2) for viewtimes resulting from pressing the positive
keys or the negative keys respectively), to determine if the same set
of patterns was observed with group data, or whether there were
discrete functions with individual data. The resulting graphs of the
preference trade-off, value function, and saturation function
exhibited the same patterns whether or not using keypress number
or viewtime data. In this figure, the CoVz,CoV{f g manifold is
shown for keypress data (a) and for viewtime data (b). To further
support the observation shown in Figure S4, the same comparison
of keypress versus total viewtime data (again using the symboli-
zation of T(K+) or T(K2) for viewtimes resulting from pressing
the positive keys or the negative keys respectively) is shown using
SNR estimates. The SNRz,SNR{f g plot is shown for keypress
number (c) and total veiwtime (d). This observation further
supports the potential for these analyses to be used for other
frequency data besides that acquired using keypress procedures.
Found at: doi:10.1371/journal.pone.0010613.s007 (0.32 MB TIF)
Figure S7 Examples of Value Function Graphs Using Pattern-
variables. Three types of value function graphs are displayed for
H, SNR, and CoV estimates. In (a), graphs of K+,H+f g are
shown in red for the negative (avoidance) keypress and green for
the positive (approach) keypress for 77 healthy controls, with no
color-coding between BF, AF, BM, AM stimulus conditions. The
approach and avoidance keypress data are displayed on the same
axes to illustrate the difference in curvature between approach and
avoidance responses, which approximates the observation of ‘‘loss
aversion’’ described in prospect theory. Similar differences
between approach and avoidance slopes are also observed for
value functions using SNR and CoV estimates. The boundary
envelopes for K+,SNR+f g graphs (b), and for K+,CoV+f ggraphs (c) are also shown for BF, AF, BM, AM faces in 77 healthy
control subjects. In (d), a cartoon of the differences in boundary
envelopes observed across value functions with H, SNR, and CoV
estimates is illustrated. Note that a similar graphical structure to
that observed with the K+,H+f g plot is also observed with a very
different psychological phenomenon, namely the Weber-Fechner-
Stevens Law in sensory psychophysics [146–150], underscoring
the pervasiveness of power functions in nature [68–72].
Found at: doi:10.1371/journal.pone.0010613.s008 (0.37 MB TIF)
Figure S8 Comparing the Value Function with the Matching
Law. The matching law as described by Herrnstein [39] was
initially approximated by ratios. Later work by Baum [40]
suggested that matching could be better described by a power
function, although modern research regarding matching works
elegantly with the initial formulation of Herrnstein [39]. These
issues are of interest given the observation of power law scaling
with the K+,H+f g value function, which allows ratios to be
represented with the same mathematical structure (equation at
bottom) for individual data (two plots on right).
Found at: doi:10.1371/journal.pone.0010613.s009 (0.35 MB TIF)
Figure S9 Noise Simulations. Three noise simulations were run
for each of the four experimental conditions, and combined in the
illustrated graphs (real subject data with filled circles, and
hypothetical subject data with x’s or open circles). These three
simulations include: (a) mean-matched uniform random noise, (b)range-matched uniform random noise, and (c) variance-matched
Gaussian noise. Procedures for these simulations are described in
the main text methods section. Note that across these three graphs,
no simulation duplicates the human experimental data, or a subset
thereof.
Found at: doi:10.1371/journal.pone.0010613.s010 (0.30 MB TIF)
Figure S10 Alternate Sets of Patterns Characterizing Approach
and Avoidance. There appear to be at least three alternate
formulations of the relationships organizing relative preference in
humans. These three formulations are illustrated schematically in
three columns of graphs, with a trade-off relationship on top of
each, a value function in the middle, and a saturation function on
the bottom. With group data, the trade-off relationships represent
manifolds for the Hz,H{f g plot (a) and CoVz,CoV{f g plot
(c), and a boundary envelope for the SNRz,SNR{f g plot (b).The central tendency of the Hz,H{f g plot has a similar
mathematical form to the graphs of individual data across
experimental conditions tested, although there can be significant
variability across individuals. For all of the value functions
assessed, group data reveals an envelope for the K+,H+f g,K+,CoV+f g, and K+,SNR+f g plots. In individuals, K+,H+f g
plots reveal striking functional fits. Lastly, one can associate the
K+,s+f g plot with each of the graphs produced using the three
pattern variables.
Found at: doi:10.1371/journal.pone.0010613.s011 (0.39 MB TIF)
Figure S11 K+,s+f g Plot and Mean-Variance Model of
Choice. The K+,s+f g plot may have relevance for mean-
variance approaches to decision making under risk. As described
by D’Acremont and Bossaerts [78], the mean-variance approach
describes risk by the outcome variance (i.e., standard deviation, s),
and computes a valuation V by the difference between the mean
transaction outcome and variance estimate: V~K{ds, where d is
the penalty imposed for risk. As d increases, the individual shows
increasing risk aversion. In the quadratic fitting of K+,s+f g, the
computation of V is not likely to show that the individual prefers
mappings on the K+,s+f g plot until after s has reached a
maximum and is decreasing (while K continues to increase). This
might not be necessary if d is quite low, in which case one could
imagine preferred choices being represented on the K+,s+f g plot
by mappings with low s, and either high or low K. Given the
K+,s+f g plot involves both approach (positive) and avoidance
(negative) components, one might also imagine adapting the
Law-Like Reward Patterns
PLoS ONE | www.plosone.org 22 May 2010 | Volume 5 | Issue 5 | e10613
mean-variance framework to include both components in the
valuation computation (e.g., so that Kz, K{, sz, and s{ are all
incorporated in the computation).
Found at: doi:10.1371/journal.pone.0010613.s012 (0.33 MB
TIF)
Acknowledgments
We would like to thank Reza Jamei, PhD (Stanford University), Thomas
Deisboeck, MD (Massachusetts General Hospital (MGH) and Harvard
Medical School (HMS)), Martin Paulus, MD, PhD (University of
California, San Diego), and Ezio Marchi, PhD (Institute for Mathemat-
ics and Its Applications, University of Minnesota) for critical commen-
tary regarding data analysis, Alan Sinai, PhD (Decision Economics, Inc)
for economic guidance, Nancy Etcoff, PhD (MGH, HMS) and HCB for
use of the beauty face stimuli (Etcoff developed the concept, and Etcoff
and Breiter validated them), Elizabeth Huffman and Lee Kaplan, MD
(MGH) for collection of alliesthesia data and alliesthesia experiment
planning, Arnold Modell, MD (Boston Institute of Psychoanalysis) and
Steven Grant, PhD (National Institute of Drug Abuse) for helpful
conversations, Namik Kirlic (MGH) and Valerie Loehr (MGH) for
editorial assistance, and several anonymous reviewers for sections of
computer code testing various features of the results (in Supplementary
Information Sections).
Author Contributions
Conceived and designed the experiments: BWK RHP JWS RM MF HCB.
Performed the experiments: BWK MJL AJB SL RHP JWS RM MF HCB.
Analyzed the data: BWK DNK JL MJL AJB SL RHP HCB. Contributed
reagents/materials/analysis tools: BWK DNK JL MJL AJB JWS HCB.
Wrote the paper: HCB. Planned analyses: HCB. Programmed primary
analysis tools and simulations: BWK. Advised HCB and BWK with initial
data analysis, and then worked with HCB and JL to integrate data results:
DNK. Independently analyzed and confirmed analysis results from HCB
and BWK: JL. Worked with HCB and DNK to integrate data results, and
guided noise analyses: JL. Managed the database for all three experiments:
MJL. Guided the integration of results with the neuroscience and reward/
aversion literature, and interpretation thereof: AJB. Significantly involved
with data acquisition, quality assurance, and Institutional Review Board
compliance: SL. Chaired the project Publications Committee, which
included HCB, AJB, JWS, and MF: RHP. Chaired the Project
Management Group, which included HCB, AJB, RHP, and MF: JWS.
Made important contributions to data acquisition, and optimization of the
experimental protocol: RM. Provided management guidance for the
overall project, along with departmental support and infrastructure: MF.
Primary contact with the project Scientific Advisory Board: MF. PI of the
project, and primary contributor of concepts in the paper along with
integration of effort across the 11 authors: HCB. Involved with revising and
editing numerous paper drafts: BWK DNK JL MJL AJB SL RHP JWS
RM MF. Project effort was similar for: (1) BWK HCB (2) DNK JL MJL
AJB SL (3) RHP JWS RM MF.
References
1. Paulus MP (2007) Decision-making dysfunctions in psychiatry–altered
homeostatic processing? Science 318: 602–606.
2. Lewin K (1935) A Dynamic Theory of Personality: Selected Papers of Kurt
Lewin. New York: McGraw-Hill Inc. 286 p.
3. Schneirla TC (1959) An evolutionary and developmental theory of biphasic
processes underlying approach and withdrawal. In: MRJones, ed. Nebraska
Symposium on Motivation. Nebraska: University of Nebraska Press. pp 1–42.
4. Warren RP (1963) Preference aversion in mice to bitter substance. Science 140:
808–809.
5. Kable JW, Glimcher PW (2007) The neural correlates of subjective value
during intertemporal choice. Nature Neuroscience 10: 1625–1633.
6. Lau B, Glimcher PW (2008) Value representations in the primate striatum
during matching behavior. Neuron 58(3): 451–463.
7. Kahneman D, Tversky A (1979) Prospect theory: an analysis of decision under
risk. Econometrica 47(2): 263–291.
8. Shizgal P (1999) On the neural computation of utility: implications from studies
of brain stimulation reward. In: Kahneman, EDiener, NSchwarz, eds. Well-
being: the foundations of hedonic psychology. New York: Russell Sage. pp
502–506.
9. Berns GS, Chappelow J, Cekic M, Zink CF, Pagnoni G, et al. (2006)
Neurobiological substrates of dread. Science 312(5774): 754–758.
10. Loewenstein G, Rick S, Cohen JD (2008) Neuroeconomics. Annu Rev Psychol
59: 647–672.
11. Zak PJ, Kurzban R, Matzner W (2004) The neurobiology of trust.
Ann N Y Acad Sci 1032: 224–7.
12. Tversky A, Kahneman D (1992) Advances in prospect theory: cumulative
representation of uncertainty. Journal of Risk and Uncertainty 5: 297–
323.
13. Trepel C, Fox CR, Poldrack RA (2005) Prospect theory on the brain? Toward
a cognitive neuroscience of decision under risk. Brain Res Cogn Brain Res
23(1): 34–50.
14. Aharon I, Etcoff N, Ariely D, Chabris CF, O’Connor E, et al. (2001) Beautiful
faces have variable reward value: fMRI and behavioral evidence. Neuron 32(3):
537–551.
15. Strauss M, Aharon I, Vangel MG, Goodman J, Kennedy DN, et al. (2005)
fMRI of sensitization to angry faces. Neuroimage 26(2): 289–413.
16. Elman I, Ariely D, Mazar N, Aharon I, Lasko NB, et al. (2005) Probing reward
function in post-traumatic stress disorder with beautiful facial images.
Psychiatry Res 135(3): 179–183.
17. Levy B, Ariely D, Mazar N, Chi W, Lukas S, et al. (2008) Gender differences in
the motivational processing of facial beauty. Learning and Motivation 39(2):
136–145.
18. Perlis RH, Hold DJ, Smoller JW, Blood AJ, Lee S, et al. (2008) Association of a
polymorphism near CREB1 with differential aversion processing in the insula
of healthy participants. Arch Gen Psychiatry 65(8): 882–892.
19. Makris N, Gasic GP, Kennedy DN, Hodge SM, Kaiser JR, et al. (2008)
Cortical thickness abnormalities in cocaine addiction–a reflection of both drug
use and a pre-existing disposition to drug abuse? Neuron 60(1): 174–188.
20. Gasic G, Smoller JW, Perlis RH, Sun M, Lee S, et al. (2009) BDNF, relative
preference, and reward circuitry responses to emotional communication.
Am J Med Genet B Neuropsychiatr Genet, Available: http://
www3intersciencewileycom/journal/122350266/abstract?CRETRY =
1&SRETRY = 0 Accessed 22 April 2009.
21. Yamamoto R, Ariely D, Chi W, Langleben DD, Elman I (2009) Gender
differences in the motivational processing of babies are determined by their facial
attractiveness. PLos One 24: 4(6): e6042. Available: http://wwwplosoneorg/
article/info:doi/101371/journalpone0006042.
22. Deci EL, Ryan RM (1985) Intrinsic motivation and self-determination in
human behavior. New York: Plenum Press. 371 p.
23. Bandura A (1997) Self-efficacy: The exercise of control. New York: Freeman.
pp 604. Available: http://booksgooglecom/books?id = mXoYHAAACAAJ.
24. Walton M, Rudebeck P, Bannerman D, Rushworth M (2007) Calculating the
cost of acting in frontal cortex. Ann NY Acad Sci 1104: 340–356.
25. Croxson P, Walton M, O-Reilly J, Behrens E, Rushworth M (2009) Effort-
based Cost-Benefit Valuation and the Human Brain. J Neurosci 29(14):
4531–4541.
26. Walton M, Bannerman D, Rushworth M (2002) The role of rat medial frontal
cortex in effort-based decision-making. J Neurosci 22: 10996–11003.
27. Walton M, Bannerman D, Alterescu K, Rushworth M (2003) Functional
specialization within medial frontal cortex of the anterior cingulated for
evaluating effort-related decisions. J Neurosci 23: 6475–6479.
28. Walton M, Kennerley S, Bannerman D, Phillips P, Rushworth M (2006)
Weighing up the benefits of work: behavioral and neural analyses of effort-
related decision making. Neural Netw 19: 1302–1314.
29. Breiter HC, Gasic GP, Makris N (2006) Imaging the Neural Systems for
Motivated Behavior and Their Dysfunction in Neuropsychiatric Illness. In:
Deisboeck TS, Kresh JY, eds. Complex Systems Science in Biomedicine.
Massachusetts: Kluwer Academic Publishers. pp 763–810.
30. Breiter HC, Aharon I, Kahneman D, Dale A, Shizgal P (2001) Functional
imaging of neural responses to expectancy and experience of monetary gains
and losses. Neuron 30(2): 619–639.
31. Tom SM, Fox CR, Trepel C, Poldrack RA (2007) The neural basis of loss
aversion in decision-making under risk. Science 315(5811): 515–518.
32. White NM, Messier C, Carr GD (1987) Operationalizing and measuring the
organizing influence of drugs on behavior. In: Bozarth MA, ed. Methods of
Assessing the Reinforcing Properties of Abused Drugs. New York: Springer-
Verlag. pp 591–617.
33. Glimcher PW, Rustichini A (2004) Neuroeconomics: the consilience of brain
and decision. Science 306: 447–452.
34. Camerer CF, Loewenstein G, Prelec D (2004) Neuroeconomics: why
economics needs brains. Scandinavian Journal of Economics 106(3): 555–579.
35. Zak PJ (2004) Neuroeconomics. Philos Trans R Soc Lond B Biol Sci 359(1451):
1737–48.
36. Delgado MR, Schotter A, Ozbay EY, Phelps EA (2008) Understanding
overbidding: using the neural circuitry of reward to design economic auctions.
Science 321(5897): 1849–52.
Law-Like Reward Patterns
PLoS ONE | www.plosone.org 23 May 2010 | Volume 5 | Issue 5 | e10613
37. Montague PR, Berns GS (2002) Neural economics and the biological substratesof valuation. Neuron 36(2): 265–84.
38. De Koninck Y, Mody I (1994) Noise analysis of miniature IPSCs in adult rat
brain slices: properties and modulation of synaptic GABAA receptor channels.
J Neurophysiol 71(4): 1318–1335.
39. Herrnstein RJ (1961) Relative and absolute strength of responses as a functionof frequency of reinforcement. J Exp Anal Behav 4(3): 267–272.
40. Baum WM (1974) On two types of deviation from the matching law: Bias andundermatching. J Exp Anal Behav 22(1): 231–242.
41. Gallistel CR, King AP, Gottlieb D, Balci F, Papachristos EB, et al. (2007) Is
matching innate? J Exp Anal Behav 87(2): 161–199.
42. Herrnstein RJ (1970) On the law of effect. Journal of the Experimental Analysis
of Behavior 13: 243–266.
43. Cabanac M (1971) Physiological role of pleasure. Science 173(4002):1103–1107.
44. Cabanac M, Duclaux R (1973) Allie(acent)sie olfacto-gustative et prisealimentaire chez l’homme. J Physiol (Paris) 66(2): 113–135.
45. Cabanac M, Pruvost M, Fantino M (1973) Alliesthesie negative pour des
stimulus sucres apres diverses ingestions de glucose. Physiology and Behavior
11: 345–348.
46. Berridge KC (1991) Modulation of taste affect by hunger, caloric satiety, andsensory-specific satiety in the rat. Appetite 16(2): 103–120.
47. Breiter H, Gasic G (2004) A General Circuitry Processing Reward/AversionInformation and Its Implications for Neuropsychiatric Illness. In:
Gazzaniga MS, ed. The Cognitive Neurosciences III. Massachusetts: TheMIT Press. pp 1043–1065.
48. Heinz A, Friedel E, Muller DJ, Puls I, Wrase J (2007) Genetic research withintermediate phenotypes: phenocopies, perspectives, and pitfalls. Addiction
102(11): 1696–7.
49. Gallinat J, Bauer M, Heinz A (2008) Genes and neuroimaging: advances in
psychiatric research. Neurodegener Dis 5(5): 277–85.
50. Breiter HC, Gollub RL, Weisskoff RM, Kennedy DN, Makris N, et al. (1997)Acute effects of cocaine on human brain activity and emotion. Neuron 19(3):
591–611.
51. Haxby JV, Hoffman EA, Gobbini MI (2002) Human neural systems for face
recognition and social communication. Biol Psychiatry 51(1): 59–67.
52. Wrase J, Kahnt T, Schlagenhauf F, Beck A, Cohen MX, et al. (2007) Different
neural systems adjust motor behavior in response to reward and punishment.Neuroimage 36(4): 1253–62.
53. Heinz A, Beck A, Grusser SM, Grace AA, Wrase J (2009) Identifying the neural
circuitry of alcohol craving and relapse vulnerability. Addict Biol 14(1): 108–18.
54. Makris N, Gasic GP, Seidman LJ, Goldstein JM, Gastfriend DR, et al. (2004)
Decreased absolute amygdala volume in cocaine addicts. Neuron 44(4):729–740.
55. Goldstein RZ, Craig AD, Bechara A, Garavan H, Childress AR, et al. (2009)
The neurocircuitry of impaired insight in drug addiction. Trends in Cogn Sci
13(9): 372–380.
56. Wise RA (2009) Roles for nigrostriatal–not just mesocorticolimbic–dopamine inreward and addiction. Trends in Neurosciences 32(10): 517–524.
57. Ressler KJ, Mayberg HS (2007) Targeting abnormal neural circuits in moodand anxiety disorders: from the laboratory to the clinic. Nature Neurosci 10:
1116–1124.
58. Price JL, Drevets WC (2010) Neurocircuitry of mood disorders. Neuropsycho-
pharmacology 35: 192–216.
59. Wacker J, Dillon DG, Pizzagalli DA (2009) The role of the nucleus accumbensand rostral anterior cingulate cortex in anhedonia: integration of resting EEG,
fMRI, and volumetric techniques. Neuroimage 46(1): 327–337.
60. Banks HT, Tran HT (2009) Mathematical and Experimental Modeling of
Physical and Biological Processes. Florida: CRC Press. 298 p.
61. Lang PJ, Bradley MM, Cuthbert BN (2008) International affective picture
system (IAPS): Affective ratings of pictures and instruction manual TechnicalReport A-8. Florida: University of Florida.
62. Lang PJ, Ohman DV (1998) The international affective system [photographic
slides] Technical report. Florida: University of Florida.
63. Schweighofer N, Shishida K, Han CE, Okamoto Y, Tanaka SC, et al. (2006)
Humans can adopt optimal discounting strategy under real-time constraints.PLoS Comput Biol 11: 1349–1356.
64. Viola PA, Schraudolph NN, Sejnowski TJ (1996) Empirical Entropy
Manipulation for Real-World Problems .In: Touretzky DS, Mozer M,
Hasselmo M, eds. Advances in Neural Information Processing Systems 8.Massachusetts: The MIT Press. pp 851–857.
65. Tiesinga PH, Fellous JM, Jose JV, Sejnowski TJ (2002) Information transfer in
entrained cortical neurons. Network 13(1): 41–66.
66. Reeke GN, Coop AD (2004) Estimating the temporal interval entropy of
neuronal discharge. Neural Computation 16(5): 941–970.
67. Shannon CE, Weaver W (1949) The mathematical theory of communication
Volume 1. Illinois: University of Illinois Press. 117 p.
68. Bak P (1996) How nature works: The science of self-organized criticality. NewYork: Springer-Verlag New York Inc. 212 p.
69. Pascual M, Roy M, Guichard F, Flierl G (2002) Cluster size distributions:signatures of self-organization in spatial ecologies. Philos Trans R Soc
Lond B Biol Sci 357(1421): 657–666.
70. Vandermeer J, Perfecto I (2006) A keystone mutualism drives pattern in a
power function. Science 311(5753): 1000–1002.
71. Mitzenmacher M (2003) A brief history of generative models for power law andlognormal distributions. Internet Mathematics 1(2): 226–251.
72. Newman MEJ (2005) Power laws, Pareto distributions and Zipf’s law.
Contemporary Physics 46: 323–351.
73. Hansson SO, Grune-Yanoff T (2009) Preferences. In: Zalta EN, ed. Stanford
Encyclopedia of Philosophy. California: Stanford University The MetaphysicsResearch Lab.
74. Lasko TA, Bhagwat JG, Zou KH, Ohno-Machado L (2005) The use of receiveroperating characteristic curves in biomedical informatics. J Biomed Inform
38(5): 404–415.
75. Kording K (2007) Decision Theory: What ‘‘should’’ the nervous system do?Science 318(5850): 606–610.
76. Herrnstein RJ, Vaughan WJ (1980) Melioration and behavioral allocation. In:Staddon J, ed. Limits to action: The allocation of individual behavior. New
York: Academic Press. pp 143–176.
77. Koechlin E, Hyafil A (2007) Anterior prefrontal function and the limits ofhuman decision-making. Science 318(5850): 594–598.
78. D’Acremont M, Bossaerts P (2008) Neurobiological studies of risk assessment:A comparison of expected utility and mean-variance approaches. Cog Affective
& Behav Neurosci 8(4): 363–374.
79. Huettel SA, Song AW, McCarthy G (2005) Decisions under Uncertainty:Probabilistic Context Influences Activation of Prefrontal and Parietal Cortices.
The Journal of Neuroscience 25(13): 3304–3311.
80. Paulus MP, Rogalsky C, Simmons A, Feinstein JS, Stein MB (2003) Increased
activation in the right insula during risk-taking decision making is related to
harm avoidance and neuroticism. NeuroImage 19: 1439–1448.
81. Preuschoff K, Bossaerts P, Quartz SR (2006) Neural differentiation of expected
reward and risk in human subcortical structures. Neuron 51: 381–390.
82. Rolls ET, McCabe C, Redoute J (2008) Expected value, reward outcome, and
temporal difference error representations in a probabilistic decision task.
Cerebral Cortex 18: 652–663.
83. Tobler PN, O’Doherty JP, Dolan RJ, Schultz W (2007) Reward value coding
distinct from risk attitude-related uncertainty coding in human reward systems.J Neurosphysiol 97: 1621–1632.
84. Tobler PN, Christopoulos GI, O’Doherty JP, Dolan RJ, Schultz W (2009)Risk-dependent reward value signal in human prefrontal cortex. PNAS
106(17): 7185–7190.
85. Knutson B, Taylor J, Kaufman M, Peterson R, Glover G (2007) DistributedNeural Representation of Expected Value J. Neurosci 2005 25: 4806–4812.
86. Knutson B, Bossaerts P (2007) Neural antecedents of financial decisions.J Neurosci 27: 8174–8177.
87. Yacobian J, Glascher J, Schroeder K, Sommer T, Braus DF, et al. (2006)
Dissociable systems for gain- and loss-related value predictions and errors ofprediction in the human brain. J Neurosci 26: 9530–9537.
88. Yacobian J, Sommer T, Schroeder K, Glascher J, Braus DF, et al. (2007)Subregions of the ventral striatum show preferential coding of reward
magnitude and probability. NeuroImage 38: 557–563.
89. Black F, Scholes M (1973) The pricing of options and corporate liabilities.J Political Economy 81: 637–654.
90. Markowitz H (1952) Portfolio selection. J Finance 7: 77–91.
91. Von Neumann J, Morgenstern O (1947) Theory of games and economic
behavior. New Jersey: Princeton University Press. 641 p.
92. Savage LJ (1972) The foundations of statistics. New York: Dover Pulications,INC. 310 p.
93. Evans J (2003) In two minds: Dual-process accounts of reasoning. Trends inCognit Sci 7: 454–459.
94. Daw N, Niv Y, Dayan P (2005) Uncertainty-based competition between
prefrontal and dorsolateral striatal systems for behavioral control. NatureNeurosci 8: 1704–1711.
95. Kahneman D, Frederick S (2002) Representativeness revisited: Attributesubstitution in intuitive judgment. In: Gilovich T, Griffin D, Kahneman D, eds.
Heuristics and biases: The psychology of intuitive judgment. Cambridge:
Cambridge University Press. pp 48–81.
96. Boker SM (2001) Differential structural equation modeling of intraindividual
variability. In: Collins LM, Sayer AG, eds. New methods for the analysis ofbehavior change. Washington DC: APA. pp 5–27.
97. Boker SM, Laurenceau JP (2006) Dynamical systems modeling: An applicationto regulation of intimacy. In: Walls TA, Schafer JL, eds. Models for intensive
longitudinal data. New York: Oxford University Press. pp 195–218.
98. Ainslie G (2001) Breakdown of Will. New York: Cambridge University Press.272 p.
99. Everitt BJ, Robbins TW (2005) Neural systems of reinforcement for drugaddiction: from actions to habits to compulsion. Nature Neurosci 8:
1481–1489.
100. Mischel W, Ebbesen EB, Zeiss AR (1972) Cognitive and attentionalmechanisms in delay of gratification. J Pers Soc Psychol 21(2): 204–218.
101. Haggard P, et al. (2004) Anomalous control: when ‘free-will’ is not conscious.Consc Cogn 13(3): 646–654.
102. Libet B, Gleason CA, Wright EW, Pearl DK (1983) Time of conscious
intention to act in relation to onset of cerebral activity (readiness-potential). Theunconscious initiation of a freely voluntary act. Brain 106: 623–642.
103. Libet B (1985) Unconscious cerebral initiative and the role of conscious will involuntary action. Behavioral and Brain Sciences 8: 529–566.
Law-Like Reward Patterns
PLoS ONE | www.plosone.org 24 May 2010 | Volume 5 | Issue 5 | e10613
104. Baumeister R, Gailliot M, DeWall C, Oaten M (2006) Self-regulation and
personality: how interventions increase regulatory success, and how depletionmoderates the effects of traits on behavior. J Pers 74(6): 1773–1801.
105. Doyle JC, Francis BA, Tannenbaum A (1992) Feedback Control Theory. New
York: Macmillan Coll Div. 240 p.106. Franklin GF, Powel JD, Emami-Naeini A (2005) Feedback Control of Dynamic
Systems (5th ed). New Jersey: Pearson Prentice Hall. 928 p.107. Friedland B (2005) Control System Design: An Introduction to State-Space
Methods. New York: Dover Publications. 528 p.
108. Brookings T, Carlson J, Doyle J (2005) Three mechanisms for power laws onthe Cayley tree. Physical Review E 72(5 Pt 2): 056120. Available: http://
authorslibrarycaltechedu/1516/1/BROpre05pdf. Accessed 16 November2005.
109. Moritz M, Morais M, Summerell L, Carlson J, Doyle J (2005) Wildfires,complexity, and highly optimized tolerance. Proc Natl Acad Sci U S A 102(50):
17912–17917.
110. Solomon RL, Corbit JD (1973) Journal of Abnormal Psychology 81(2):158–171.
111. Solomon RL, Corbitt JD (1974) An opponent process theory of motivation: ITemporal dynamics of affect. Psychol Rev 81: 119–145.
112. Hering E (1964) Outlines of a Theory of the Light Sense. Massachusetts:
Harvard University Press. 344 p.113. Szostak JW (2003) Functional information: Molecular messages. Nature
423(6941): 689.114. Adami C (2004) Information theory in molecular biology. Physics of Life
Reviews 1: 3–22.115. Sutton J, Breiter HC (1994) Neural scale invariance: An integrative model with
implications for neuropathology. In: Inns, Szu H, eds. World Congress on
Neural Networks: 1994 International Neural Network Society. New Jersey:Lawrence Erlbaum Associates, Inc IV: 667–672.
116. Savage VM, West GB (2006) Biological Scaling and Physiological Time:Biomedical Applications. In: Deisboeck TS, Kresh YJ, eds. Complex Systems
Science in Biomedicine. New York: Springer. pp 141–163.
117. Perelson AS, Bragg JG, Wiegel FW (2006) The Complexity of the ImmuneSystems: Scalling Laws. In: Deisboeck TS, Kresh JY, eds. Complex Systems
Science in Biomedicine. New York: Springer. pp 451–463.118. Mas-Colell A, Whinston MD, Green JR (1995) Microeconomic theory. New
York: Oxford University Press. 1008 p.119. Huang S, Sultan C, Ingber DE (2006) Tensegrity, Dynamic Networks, and
Complex Systems Biology: Emergence in Structural and Information Networks
within Living Cells. In: Deisboeck TS, Kresh JY, eds. Complex SystemsScience in Biomedicine. New York: Springer. pp 283–311.
120. Foote R (2007) Mathematics and complex systems. Science 318: 410–412.121. Friedman M (1953) Essays in positive economics. Illinois: University of Chicago
Press. 328 p.
122. Bossaerts P, Plott C, Zame WR (2007) Prices and portfolio choices in financialmarkets: Theory, econometrics, experiments. Econometrica 75(4): 993–1038.
123. Logothetis NK, Pauls J, Augath M, Trinath T, Oeltermann A (2001)Neurophysiological investigation of the basis of the fMRI signal. Nature 412:
150–157.124. Clithero JA, Tankersley D, Huettel SA (2008) Foundations of Neuroeconomics:
From Philosophy to Practice. PLoS Biol 6(11): e298. doi:101371/
journalpbio0060298.125. Bernheim BD (2009) Neuroeconomics: A sober (but hopeful) appraisal National
Bureau of Economics Research Working paper. Available: http://wwwnberorg/papers/w13954. Accessed June 10, 2009.
126. Uher R, Treasure J, Heining M, Brammer MJ, Campbell IC (2006) Cerebral
processing of food-related stimuli: effects of fasting and gender. Behav BrainRes 169: 111–119.
127. Mitra PP, Bokil H (2008) Observed Brain Dynamics, Oxford University Press,
NY.128. Winstanley CA, Bachtell RK, Theobald DE, Laali S, Green TA, et al. (2009)
Increased impulsivity during withdrawal from cocaine self-administration: role
for DeltaFosB in the orbitofrontal cortex. Cereb Cortex 19(2): 435–444.129. Boettiger CA, Kelley EA, Mitchell JM, D’Esposito M, Fields HL (2009) Now or
Later? An fMRI study of the effects of endogenous opioid blockade on adecision-making network. Pharmacol Biochem Behav 93(3): 291–299.
130. Whitlow CT, Liguori A, Livengood LB, Hart SL, Mussat-Whitlow BJ, et al.
(2004) Long-term heavy marijuana users make costly decisions on a gamblingtask. Drug Alcohol Depend 76(1): 107–111.
131. First MB, Spitzer R, Gibbon M (1996) Structured Clinical Interview for DSM-IV Axis I Disorders. New York: Biometrics Research Department, New York
State Psychiatric Institute.132. Benson V, Marano MA (1998) Current Estimates from the National Health
Interview Survey, 1995 National Center for Health Statistics. Vital and Health
Stat 10 199: 1–428.133. Oldfield R (1971) The assessment and analysis of handedness: the Edinburgh
inventory. Neuropsychologia 9(1): 97–113.134. WHO (1995) Physical status: the use and interpretation of anthropometry.
Report of a WHO Expert Committee. WHO Technical Report Series 854.
Geneva: World Health Organization. 47 p.135. Stunkard AJ, Messick S (1985) The three-factor questionnaire to measure
dietary restraint, disinhibition and hunger. J Psychosom Res 29(1): 71–83.136. Walton ME, Rudebeck PH, Bannerman DM, Rushworth MF (2007)
Calculating the cost of acting in frontal cortex. Ann NY Acad Sci 1104:340–356.
137. Mulenbein H, Hons R (2005) The estimation of distributions and the minimum
relative entropy principle. Evolutionary Comput 13(1): 1–27.138. Kennel M, Shlens J, Abarbanel H, Chichilnisky E (2005) Estimating entropy
rates with Bayesian confidence intervals. Neural Computation 17(7):1531–1576.
139. Rieke F, Warland D, de Ruyter van Steveninck R, Bialek W (1999) Spikes:
exploring the neural code. Massachusetts: The MIT Press. 416 p.140. Paninski L (2003) Estimation of entropy and mutual information. Neural
Computation 15: 1191–1253.141. Young M, Wasserman E (2001) Entropy and variability discrimination. J Exp
Psychol Learn Mem Cogn 27(1): 278–293.142. Borst A, Theunissen F (1999) Information theory and neural coding. Nature
Neurosci 2(11): 947–957.
143. Cover T, Thomas J (1991) Elements of information theory (99th ed). NewYork: Wiley-Interscience. 542 p.
144. Warton DI, Wright IJ, Falster DS, Westoby M (2006) Bivariate line-fittingmethods for allometry. Bio Rev Camb Philos Soc 81(2): 259–291.
145. Zinn-Justin J (2002) Quantum Field Theory and Critical Phenomena (4th ed).
New York: Oxford University Press. 1074 p.146. Stevens SS (1961) To honor Fechner and repeal his law. Science 133(3446):
80–86.147. Fechner G (1907) Elemente der Psychophysik I u II. Leipzig: Breitkopf &
Hartel.148. Weber E (1834) De Pulsu, resorptione, audita et tactu – Annotationesvana-
tomicae et physiologicae. Lipsiae: Koehler. 175 p.
149. Mountcastle V, Poggio G, Werner G (1963) The relation of thalamic cellresponse to peripheral stimuli varied over an intensive continuum.
J Neurophysiol 26: 807–834.150. MacKay D (1963) Pyschophysics of perceived intensity: a theoretical basis for
Fechner’s and Steven’s laws. Science 139(3560): 1213–1216.
151. Friston KJ (1995) Commentary and opinion: II Statistical parametric mapping:ontology and current issues. J Cereb Blood Flow Metab 15(3): 361–370.
Law-Like Reward Patterns
PLoS ONE | www.plosone.org 25 May 2010 | Volume 5 | Issue 5 | e10613