Embed Size (px)
Citation preview
Recruitment of Seemingly Overeducated Personnel:
Insider-Outsider Effects on Fair Employee Selection
Practices∗
Oliver Fabel†
Department of Business Administration
University of Vienna, Austria
Razvan Pascalau‡
Department of Economics, Finance & Legal Studies
University of Alabama, USA
May 15, 2008
∗We thank M. Rauber and A. Flossmann, Konstanz, and J. Lee, Alabama, as well as partic-
ipants of the 10th Colloquium on Personnel Economics 2007 at the University of Tubingen, and
of research seminars at the universities of Alabama, Konstanz, Southern Mississippi, Vienna,
and Wuppertal for very helpful comments on earlier versions of this paper.†Prof. Dr. Oliver Fabel, University of Vienna, Faculty of Business, Economics and Statis-
tics, Department of Business Administration, Chair for International Personnel Management,
Brunner Str. 72, 1210 Vienna, Austria; Tel: 43-1-4277-38161, Fax: 43-1-4277-38164, E-mail:
[email protected].‡Razvan Pascalau, PhD, Department of Economics, Finance & Legal Studies, Culverhouse
College of Commerce and Business Administration, University of Alabama, 200 Alston Hall Box
87-0224, Tuscaloosa, AL, 35487, USA; Tel.:+1-205-348-7592; E-Mail: [email protected].
Abstract
We analyze a standard employee selection model given two institutional constraints:
first, professional experience perfectly substitutes insufficient formal education for in-
siders while this substitution is imperfect for outsiders. Second, in the latter case the
respective substitution rate increases with the advertised minimum educational require-
ment. Optimal selection implies that the expected level of formal education is higher for
outsider than for insider recruits. Moreover, this difference in educational attainments
increases with lower optimal minimum educational job requirements. Investigating data
of a large US public employer confirms both of the above theoretical implications. Gen-
erally, the econometric model exhibits a “good fit”.
Keywords: employee selection, overeducation, adverse impact, insiders vs outsiders.
JEL-Classifications: M51 (Firm Employment Decisions; Promotions), J53 (Labor-
Management Relations; Jurisprudence), J78 (Labor Discrimination; Public Policy), I21
(Analysis of Education).
1 Introduction
Our analysis augments the standard textbook “utility analysis”1 of personnel selection
to include three predictors: educational attainment, professional experience, and test
scores. To account for fair employee selection rules, we further assume that the firm
substitutes professional experience for formal education. Yet, since job requirements
and their corresponding descriptions always contain some firm-specific elements, this
substitution is less than perfect for applicants from outside the firm. Due to increased
legal risk, the respective substitution rate applied to outsider applications then increases
with higher minimum educational requirements.
With informative signals the probability of being hired monotonically increases in
all three signal values. However, given the constraints above, the expected educational
attainment of outsider recruits exceeds that of current employees. Further, the wedge
between the two groups’ expected educational levels widens with decreasing minimum
educational requirements. We then subject this selection model to empirical testing us-
ing a data set supplied by a large US public employer. The data allows to control for
a number of characteristics that are specific to a particular job-opening, selection pro-
cess, and individual applicant. The empirical analysis strongly supports our theoretical
predictions.
While every US employer is generally free to employ individuals at his will, qualifi-
cation requirements should be reasonable to avoid disparate impact charges under Title
VII of the Civil Rights Act of 1964.2 To the extent that members of minority groups,
women, or disabled individuals are socially excluded from formal education or profes-
sional training such requirements could else be ruled excessively restrictive - i. e. set to
preclude successful applications from these groups.3 In such cases, the Civil Rights Act
of 1991 introduces the right to a jury trial and to rely on statistical information as evi-
dence. Moreover, punitive damages in addition to back-pay increase the potential costs
1Holling (1998) provides a survey of model structures that originated in assessment psychology.
Schmidt and Hunter (1998) discuss further developments of this approach.2See Carlson (2005, p. 126 - 132) for an account of origins and consequences of non-discrimination
law and precedence court decisions concerning the employee selection process.3In the original case - see Griggs v. Duke Power Co., 401 U.S. 424 (1971) - the company required a
highschool diploma and a certain score on a general aptitude test to qualify for internal promotion. The
court found that these requirements disparately impact ethnic minority groups. Specifically, African-
Americans were less likely to hold a highschool degree and averaged lower test scores and were, therefore,
selected at a much a lower rate.
1
per case.4 Since charges can concern wrongful non-hirings as well as non-promotions,
this legal risk applies to all employee selection processes within firms.5
Thus, the Equal Employment Opportunity Commission (EEOC ) advises to state
qualification requirements in terms of necessary skills and abilities rather than formal
educational degrees or years of experience.6 This advice meets with a second set of rules
that is rooted in the employer’s duty to provide job security and career development:7
fair selection standards should be alternatively phrased in terms of formal educational
requirements and substitute professional experience criteria. In this respect, public sec-
tor employees are additionally covered by the Fourteenth Amendment right to Equal
Protection.8 The federal government itself therefore commits to a set of rules laid out in
the Operating Manual: Qualification Standards for General Schedule Positions.9 This
manual lists the required educational degree and equivalent professional experience for
specified hierarchical positions.10
The disparate impact issue has received repeated attention by economists.11 Yet,
such analyses typically address the effects on groups that are protected under this leg-
islation. To our knowledge, only Oyer and Schaefer (2002) so far show that, since pop-
ulation groups differ in their propensities to press charges, the Civil Rights Act of 1991
induces significant distributional consequences as well. However, the risk of disparate
impact suits is also job-specific: first, the standards themselves must be reasonable such
as not to exclude qualified individuals. Second, professional experience gained in simi-
lar - typically, reflecting career tracks, hierarchically inferior - positions within the firm
can substitute for a lack of formal education. Jointly these two sets of institutional
constraints then induce a differential treatment of insider and outsider applications.
Since the seminal work of Freeman (1976) and Duncan and Hoffman (1981), nu-
4Oyer and Schaefer (2002).5See Gutman (2003, 2004) for an overview of precedence cases and court decisions.6See section 15-IX “Proactive Prevention” EEOC (2006).7Clardy (2003).8See Carlson (2005, p. 753 - 756).9This manual is updated and published (without publication date) by the US Office of Personnel
Management, Washington D. C.10The New York State Department of Civil Services’ view of Knowledge-Skill-Ability-Based Minimum
Qualifications - see Martin (2005) - provides an interesting second example since it sets out to define
an “equivalence equation” to compute substitute professional experience requirements.11Respective contributions to annual meetings of the American Economic Association include Welch
(1981), Ashenfelter and Oaxaca (1987), Abram (1993), Coates and Loury (1993), and Betsey (1994).
2
merous empirical studies report that overeducation increases wages and employment
probabilities. Also, this effect is stronger for unskilled or lower-skilled than for skilled
jobs.12 However, explanations are mostly labor-market oriented.13 The career mobility
approach developed by Sicherman and Galor (1990) constitutes the notable exception:
responding to their firm’s human resources development strategy, individuals enhance
their career progress by accepting “underqualified work” in early career stages. So far,
only Groeneveld and Hartog (2004) provide an empirical test. Investigating jobs shel-
tered in a protected internal labor market, they conclude that the overeducation effect
on wages reflects such strategic behavior.
Our contribution is then threefold: first, we empirically confirm the existence of an
overeducation effect on hiring probabilities. However, since this effect is confined to out-
sider recruits, it does not support the career mobility argument. Second, we therefore
provide a simple but novel model of personnel selection that explicitly accounts for the
institutional constraints above. Since these constraints restrict the use of informative
signals, the firm’s outsider recruits are only seemingly overeducated - i.e. without the
constraints the firm would have advertised higher standards. Hence, third, our argu-
ments highlight the informational inefficiency induced by the threat of disparate impact
charges.
The remainder of this paper is organized as follows: the next section develops the
theoretical model and derives testable hypotheses. Section 3 provides a description of the
data, develops the econometric approach, and reports our empirical findings. The paper
concludes with a summary and discussion - the latter also addressing new regulations
currently emerging in the European educational systems.
12See the survey included in Groot and Maasen van den Brink (2000).13Hence, emphasizing inefficient investment in ability signals, arguments derived from Spence’s (1973)
theory of labor market signaling and Thurow’s (1975) theory of job competition compete with Sattinger’s
(1993) assignment theory. See, for instance, Hartog (2000), Bauer (2002), and Chevalier (2003) for
literature surveys and respective applications.
3
2 The model
2.1 Basic assumptions and notations
We have conducted extensive interviews within the firm to verify the following sequence
of screening and selection activities: all applicants who pass the advertised educational
and professional selection criteria are pooled and subjected to the same set of job-specific
ability tests. These tests always include job interviews with and formally evaluated by
the Department of Employment (DoE). Conditional on the job type, other tests of
cognitive abilities and/or non-cognitive skills may be added. Appreciating the results of
these tests, DoE makes its hiring choices to be implemented by Human Resources (HR).
For theoretical analysis then, let on-the-job ability a be identically and indepen-
dently distributed N(μ, σ2a) over the two populations of applicants denoted insiders and
outsiders. Further, the degree of formal schooling s, professional experience x, and po-
tential test scores z are known to be identically, independently, and standard normally
distributed over these two populations. As usual, Φ(y) and φ(y), y ∈ s, x, z, denotethe standard normal distribution and density functions.
HR has carried out pre-tests to validate that
a = α+ βss+ βxx+ βzz + ε (1)
where ε ∼ N(0, σ2ε) is a measurement error with Cov(ε, y) = 0 for y ∈ s, x, z. Real-istically, the predictors are correlated. For instance, holding age constant, the duration
of formal education and professional experience should be negatively correlated.14 How-
ever, assuming stochastic independence between signals serves to identify the economic
mechanisms driving the outcome of this process of screening and testing. Hence, we
assume that Cov(s, x) = Cov(s, z) = Cov(x, z) = 0.
In contrast, ray ≥ 0 denotes the coefficient of correlation between ability and the
predictor y, y ∈ s, x, z. Then, α = μ and βy =rayσaσy
. To (significantly) economize
on space and notation, we assume that rax = ras = ρ in the following. Hence, the two
signals concerning educational and professional qualifications derived at no costs from
the applicant’s documents serve equally well as ability predictors. Further simplifying
notations, raz = r.
14Empirically, we can control for this effect by entering age as an explanatory variable. See Anderson
et al. (2004) concerning the interaction of commonly used predictors.
4

HR is mainly concerned with minimizing the legal costs. Specifically, our firm being
a public employer observes that screening applications on grounds of formal education
bears the risk of disparate impact charges. Although the firm encourages its employees to
enroll in further education programs and obtain formal degrees, it therefore also accepts
that professional experience can substitute for lacking educational degrees.
Taken to its theoretic extreme, we assume that applicants from within the firm cannot
be screened out if the sum of their educational and professional achievements exceeds
the sum of the respective two minimum requirements. Thus, suppose that the job
advertisement requires minimum educational qualification S and professional experience
X . Let ωI ≡ s+ x and Ω ≡ S +X. Note that ωI ∼ N(0, 2) and denote the respective
distribution and density functions by ΨI(ωI) and ψI(ωI). Also, all applicants whose test
score satisfies z ≥ Z will actually be hired. The expected ability of insider recruits can
then be derived as
EIa;S,X,Z = (2)
μ+ σa£rasEs | ωI ≥ Ω+ raxEx | ωI ≥ Ω+ razEz | z ≥ Z
¤=
μ+ σa
∙√2ρ
Z ∞
ΩωI
dΨI(ωI)
(1−ΨI (Ω))+ r
Z ∞
Zz
dΦ(z)
(1−Φ (Z))
¸.
In principle, the substitution rule above applies to all applications. Yet, job require-
ments and their corresponding descriptions always contain some firm-specific elements.
Hence, the legal risk of screening on grounds of formal education is lower when deal-
ing with applications from outside the firm. We therefore assume that the substitute
professional experience claimed by outsiders is discounted. Given the argument that
educational standards may conceal discriminatory practises, the rate of substitution is
then perceived as increasing with minimum educational requirements.15
Thus, let τ ∈ (0, 1) denote the “discount” factor measuring the fraction of an out-sider’s documented professional experience that qualifies for the job opening.16 To focus
on the informational aspects of the screening process, we assume that this “discounting”
15To put it more blankly, if a gardener’s job would be advertised to require a PhD in botanics, every
less educated member of a socially disadvantaged group who could prove to have experience in lawn
mowing could successfully claim to have been discriminated.16Obviously, it would be more adequate to assume that an individual outsider’s professional experience
is subject to a discount factor t where t constitutes a random variable with expected value τ . Thus,
accounting only for the expected value of discounting implies that the distribution of t is independent of
the individual’s signal profile (s, x, z).
5
of an outsider’s professional experience only affects the possibility to enforce the screen-
ing criteria S and X. As discussed above, we specifically assume that τ = τ(S), with
τ0(S) > 0 and limS→∞ τ(S) = 1.
Letting ωO = s + τ(S)x, note that ωO ∼ N(0, 1 + (τ(S))2). Then, denote the
respective distribution and density functions by ΨO(ωO; τ(S)) and ψO(ωO; τ(S)). The
expected ability of outsider recruits can thus be obtained as
EOa;S,X,Z = (3)
μ+ σa£rasEs | ωO ≥ Ω+ raxEx | ωO ≥ Ω+ razEz | z ≥ Z
¤=
μ+ σa
⎡⎣ 2ρq1 + (τ(S))2
Z ∞
ΩωO
dΨO(ωO; τ(S))
(1−ΨO(Ω; τ(S)))+ r
Z ∞
Zz
dΦ(z)
(1−Φ (Z))
⎤⎦ .
Obviously, the above calculations of expected abilities demand that both groups
of applicants are sufficiently large. For simplicity, we further assume that they are of
identical size N . Given that there are M openings, the recruitment process must then
ensure that
(1−Φ (Z))
⎡⎣ XA=I,O
¡1−ΨA(Ω)
¢⎤⎦ = M
N(4)
where MN < 1. DoE ’s objective, implemented by HR, is to maximize the expected ability
EF a;S,X,Z =P
A=I,O
¡1−ΨA(Ω)
¢EAa;S,X,ZP
A=I,O (1−ΨA(Ω))(5)
of its new recruits net of the costs C associated with the ability tests. Following the
literature on testing for recruitment, these costs are fixed and reflect HR’s choice of the
test design. No such costs must be incurred if recruitment decisions are based only on
the educational and professional information documented by the applicants themselves.
2.2 Screening and testing with homogeneous groups of applicants
Focussing on recruiting from only one group of applicants highlights the economic mech-
anism governing the particular recruitment process. Hence, suppose that there are only
internal applications and set ΨO(Ω) = 1 in (5) and (4) above. The respective Lagrange-
6
function can be derived as
ÃLI = η(Z)£EIa;S,X,Z− C
¤+ (1− η(Z))
µlim
Z−→−∞EIa;S,X,Z
¶−λI
∙(1−Φ (Z))
¡1−ΨI(Ω)
¢− M
N
¸(6)
where
η(Z) =
(1 if Φ(Z) ∈ (0, 1]0 if Φ(Z) = 0
(7)
denotes an indicator function that captures the opportunity cost nature of C.
The first-order conditions can be rearranged to yield:
η(Z) : EIa;S,X,Z− C − limZ−→−∞
EIa;S,X,Z(=
≤
)0 , (8)
if Φ(Z)
(≥=
)0 ;
Y ∈ S,X : λI (1−Φ (Z)) + η(Z)
ψI (Ω)C = (9)
σa√2ρ
(1−ΨI (Ω))
"Ω−
Z ∞
ΩωI
dΨI¡ωI¢
(1−ΨI (Ω))
#;
Z : λI¡1−ΨI (Ω)
¢= (10)
σar
(1−Φ (Z))
µZ −
Z ∞
Zz
dΦ(z)
(1−Φ (Z))
¶, if η(Z) = 1 .
These conditions immediately reveal two important properties: first, according to (9),
HR will never set separate educational and professional minimum requirements if appli-
cations can only come from within the firm. Second, only if HR decides on additional
testing, the optimum recruitment policy balances the marginal returns from setting ap-
plication and testing standards. Otherwise, expected ability is simply determined by
choosing Ω such as to satisfy (4) for Φ (Z) = 0.
Investigating (8) then reveals
∆EI ≡ EIa;S,X,Z− C − limZ−→−∞
EIa;S,X,Z = (11)
−C + σar
Z ∞
Zz
dΦ(z)
(1−Φ (Z)) − σa√2ρ
Z Ω
ΩωI
dΨI¡ωI¢
ΨI³eΩ´−ΨI (Ω)
7
where eΩ is defined by ³1−ΨI(eΩ)´ = MN . Accounting for (4) given the above assumption
that ΨO = 1, limZ−→−∞∆EI = −C < 0. Thus, additional testing can is optimal if the
respective costs are low. Also, the coefficient of correlation r between ability and the
test score should be large relative to ρ.
Job interviews are likely to qualify in this respect.17 For the remainder, we will
therefore assume such an interior solution. This solution then implies
rhZ −
R∞Z z dΦ(z)
(1−Φ(Z))
iρhΩ−
R∞Ω ωI dΨI(ωI)
(1−ΨI(Ω))
i = 1− C¡1−ΨI (Ω)
¢ψI (Ω)σa
hΩ−
R∞Ω ωI dΨI(ωI)
(1−ΨI(Ω))
i > 1. (12)
As expected, the testing costs induce a distortion: selection according to test scores is
“over-restrictive”.
Setting ΨI(Ω) = 1 in (5) and (4) then allows to characterize the alternative scenario
of hiring only from a pool of outsiders. Switching superscripts, the first-order conditions
with respect to η(Z) and Z then restate (8) and (10) from above. Yet, (9) is replaced
by,
X : λO (1−Φ (Z)) + η(Z)
ψO (Ω)C = (13)
2σaρ
(1−ΨO (Ω))q1 + (τ(S))2
"Ω−
Z ∞
ΩωO
dΨO¡ωO¢
(1−ΨO (Ω))
#;
S : λO (1−Φ (Z)) + η(Z)
ψO (Ω)C = (14)
2σaρ
(1−ΨO (Ω))q1 + (τ(S))2
"Ω−
Z ∞
ΩωO
dΨO¡ωO¢
(1−ΨO (Ω))
#
+2σaρτ
0(S)τ(S)
ψO (Ω)³1 + (τ(S))2
´ 32
Z ∞
ΩωO
dΨO¡ωO¢
(1−ΨO (Ω)),
where we have made use of the properties of the normal distribution to obtain (14).
Taking the limits S →∞ of the RHS of (13) and (14), this corner solution violates (4)
since all applicants would be screened out. Further, taking the respective limits S → −∞17See e. g. Dakin and Armstrong (1989) and, distinguishing selection criteria in great detail, Robertson
and Smith (2001).
8

implies that the expected signal values are zero. Hence, the applicants’ documents would
not be used for screening at all. However, since this information is costless for the firm,
this corner solution can also be ruled out. Again, an interior solution is ensured if it is
optimal to test the applicants. The preceding arguments then imply that this solution
must be characterized by 0 < τ(S) < 1.
Comparing (13) and (14) with (9) reveals that the interior solution implies distinctly
separate minimum educational and professional experience requirements in the outsider-
recruitment case. From a purely informational economics perspective, “discounting” the
professional experience of outsiders increases the precision of the signal ωO which is
subjected to the cut-off criterion Ω.
Two effects then determine optimal precision: first, as τ(S) decreases, the two signals
x and s contained in ωO are increasingly used separately to predict on-the-job ability.
Yet, the positive effect of this signal separation on the precision of ωO is traded-off
against the fact that professional experience also receives less weight as a predictor of
ability. In the extreme, for τ(S) = 0, experience would not be used for screening at all.
2.3 Recruiting from two independent pools of insiders and outsiders
Since the firm is subject to mandatory public job advertisements, HR organizes the actual
recruitment process to maximize (5) subject to (4). Yet, characterizing the solution does
not add further analytic insights. The respective first-order conditions with respect to
the minimum educational and professional experience requirements, S and X, merely
contain weighted sums of the terms in (13), (14), and (9). The weights are given byPA=I,O ψA(Ω)/
PA=I,O
¡1−ΨA(Ω)
¢.
Hence, the characterizations above carry over in the sense that, if - given the costs
of testing - the test scores are used for selection, the solution balances the marginal re-
turns from using all three signals for recruitment. Separate educational and professional
experience standards will then be advertised but only enforced in screening outsider
applications. These analytic conclusions imply the following hypotheses for empirical
testing:
H1: Outsider recruits are characterized by higher educational levels than insider re-
cruits.
9

Since insider applications resemble the current structure of educational attainments
in the firm’s labor force, new employees therefore appear to be overeducated. However,
they are only seemingly overeducated: suppose the threat of disparate impact charges
would not constrain HR in advertising and enforcing educational requirements. Then, it
would require higher educational standards to economize on the respective signal value.
The insider-outsider difference thus reflects that HR cannot use this signal when dealing
with insiders.
Further, recall that lower minimum educational requirements S ceteris paribus in-
crease the possibility of “discounting” the professional experience of outsiders.18 This
policy is optimal because it increases the precision of the screening process. Since the
effect only applies to outsider applications, recruiting for jobs that are advertised to
require rather low educational degrees yields relatively more “overeducation” of outsider
recruits. Hence, it also follows:
H2: The overeducation effect on the group of outsider recruits increases with lower
minimum educational standards advertised by the firm.
3 Empirical analysis
3.1 The data
In May 2003, the firm - a large US public employer - introduced an online recruiting
system. Starting with this date, all job applicants are required to (also) file an electronic
application and obtain log-in user-names and passwords. Our data then covers the period
from the introduction of this system to February 2006. During this phase HR assigned
a team to provide assistance for potential applicants. The data is further restricted to
rank-and-file employee and laborer positions; we exclude recruitment processes to fill
executive positions. Our data set comprises 33780 observations of individuals who (a)
filed complete applications during this time-span and (b) entered a recruitment process
that reached a final decision by the end of our observation period. There are 1244 of
such processes (see Table 1).
18Within the current framework, the typical “ceteris paribus” clause particularly implies that other
job characteristics (technical vs. administrative, superior vs. inferior hierarchical position etc.) are held
constant.
10
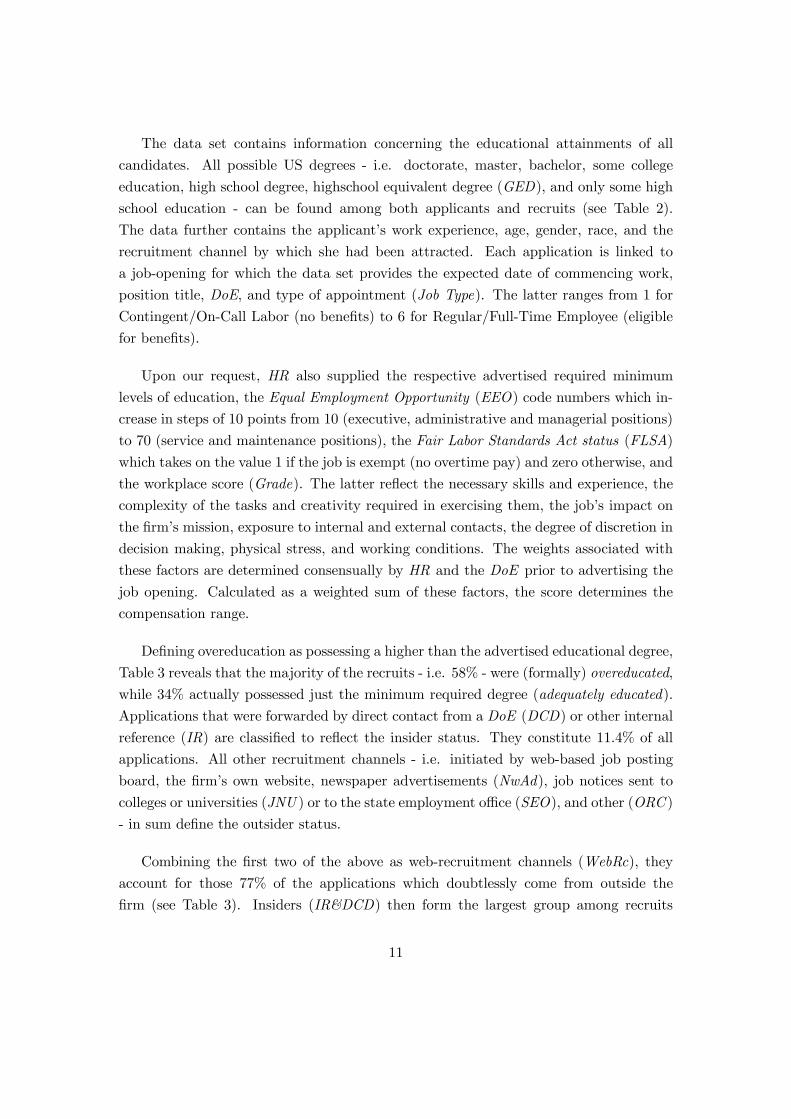
The data set contains information concerning the educational attainments of all
candidates. All possible US degrees - i.e. doctorate, master, bachelor, some college
education, high school degree, highschool equivalent degree (GED), and only some high
school education - can be found among both applicants and recruits (see Table 2).
The data further contains the applicant’s work experience, age, gender, race, and the
recruitment channel by which she had been attracted. Each application is linked to
a job-opening for which the data set provides the expected date of commencing work,
position title, DoE, and type of appointment (Job Type). The latter ranges from 1 for
Contingent/On-Call Labor (no benefits) to 6 for Regular/Full-Time Employee (eligible
for benefits).
Upon our request, HR also supplied the respective advertised required minimum
levels of education, the Equal Employment Opportunity (EEO) code numbers which in-
crease in steps of 10 points from 10 (executive, administrative and managerial positions)
to 70 (service and maintenance positions), the Fair Labor Standards Act status (FLSA)
which takes on the value 1 if the job is exempt (no overtime pay) and zero otherwise, and
the workplace score (Grade). The latter reflect the necessary skills and experience, the
complexity of the tasks and creativity required in exercising them, the job’s impact on
the firm’s mission, exposure to internal and external contacts, the degree of discretion in
decision making, physical stress, and working conditions. The weights associated with
these factors are determined consensually by HR and the DoE prior to advertising the
job opening. Calculated as a weighted sum of these factors, the score determines the
compensation range.
Defining overeducation as possessing a higher than the advertised educational degree,
Table 3 reveals that the majority of the recruits - i.e. 58% - were (formally) overeducated,
while 34% actually possessed just the minimum required degree (adequately educated).
Applications that were forwarded by direct contact from a DoE (DCD) or other internal
reference (IR) are classified to reflect the insider status. They constitute 11.4% of all
applications. All other recruitment channels - i.e. initiated by web-based job posting
board, the firm’s own website, newspaper advertisements (NwAd), job notices sent to
colleges or universities (JNU ) or to the state employment office (SEO), and other (ORC )
- in sum define the outsider status.
Combining the first two of the above as web-recruitment channels (WebRc), they
account for those 77% of the applications which doubtlessly come from outside the
firm (see Table 3). Insiders (IR&DCD) then form the largest group among recruits
11

who are undereducated regarding their educational attainments. In contrast, outsiders
constitute the largest group among the overeducated recruits. This observation already
suggests that insider and outsider applications receive rather different appraisals during
the recruitment process.
3.2 Definitions of variables and OLS-estimation
The dependent variable Status in the regression reported in Table 4 takes on the value
1 if the applicant is hired and zero otherwise. Characterizing the particular job open-
ing, Grade, the EEO code number, the FLSA status variable, and Job Type serve as
explanatory variables. The characteristics of the recruitment processes are captured
by the total number of job-candidates (Applications) per job. In addition, the num-
ber of applications which used the same recruitment channel (Appl.’s Rc) reflects the
individual’s competitive environment.
As explained above, an insider application is defined by the use of internal references.
Including the recruitment channel used by a particular outsider applicant then serves to
examine whether there exists a dominant form of attracting successful candidates from
outside the firm. Other variables characterizing the individual applicant are Age, Sex
(equal to 1 if the applicant is male), professional Experience, and the minority status
(Non-White).19 Unfortunately, the data only allows to identify whether the individual
possesses (1) or does not possess (0) adequate professional experiences as judged by HR.
As usual, we also include the square of the individual’s age to allow for a non-linear
age-productivity profile.
Clearly, the variables reflecting the applicant’s educational background are of key
interest. The variable Education ranges from 0 for completed first grade to 19 for
a doctorate degree. This coding thus mirrors the individual’s time spent in formal
education. To capture a possible non-linear education-productivity relationship we also
include the square of this variable. Exact Qual takes on the value 1 if the applicant is just
qualified relative to the advertised minimum educational level. Over Qual and Less Qual
then indicate over and undereducated applicants, respectively. The reference category
is Over Qual. Given our model above, the insider effect on the hiring probability is
reflected in professional experience substituting for a lack of formal education. Thus, we
include the respective interaction variables Exp Ins. and Educ Ins. between Experience
19More detailed ethnic classifications did not prove statistically significant.
12
and Education and the insider status.
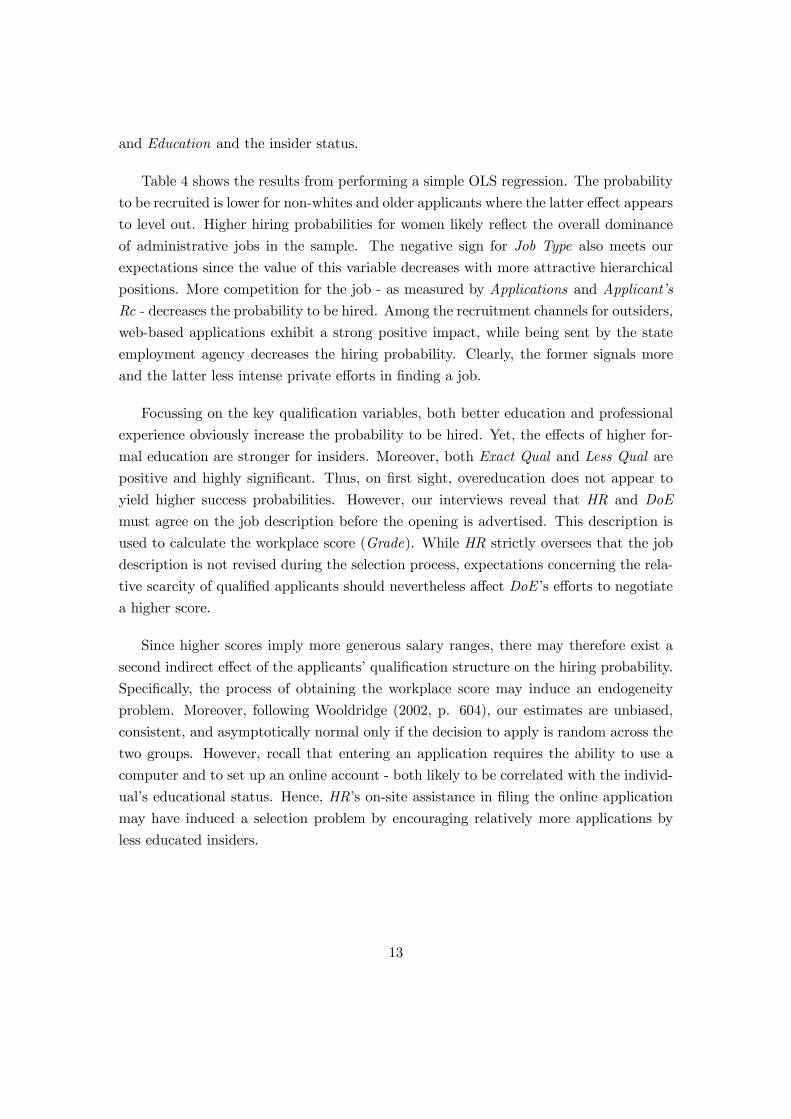
Table 4 shows the results from performing a simple OLS regression. The probability
to be recruited is lower for non-whites and older applicants where the latter effect appears
to level out. Higher hiring probabilities for women likely reflect the overall dominance
of administrative jobs in the sample. The negative sign for Job Type also meets our
expectations since the value of this variable decreases with more attractive hierarchical
positions. More competition for the job - as measured by Applications and Applicant’s
Rc - decreases the probability to be hired. Among the recruitment channels for outsiders,
web-based applications exhibit a strong positive impact, while being sent by the state
employment agency decreases the hiring probability. Clearly, the former signals more
and the latter less intense private efforts in finding a job.
Focussing on the key qualification variables, both better education and professional
experience obviously increase the probability to be hired. Yet, the effects of higher for-
mal education are stronger for insiders. Moreover, both Exact Qual and Less Qual are
positive and highly significant. Thus, on first sight, overeducation does not appear to
yield higher success probabilities. However, our interviews reveal that HR and DoE
must agree on the job description before the opening is advertised. This description is
used to calculate the workplace score (Grade). While HR strictly oversees that the job
description is not revised during the selection process, expectations concerning the rela-
tive scarcity of qualified applicants should nevertheless affect DoE ’s efforts to negotiate
a higher score.
Since higher scores imply more generous salary ranges, there may therefore exist a
second indirect effect of the applicants’ qualification structure on the hiring probability.
Specifically, the process of obtaining the workplace score may induce an endogeneity
problem. Moreover, following Wooldridge (2002, p. 604), our estimates are unbiased,
consistent, and asymptotically normal only if the decision to apply is random across the
two groups. However, recall that entering an application requires the ability to use a
computer and to set up an online account - both likely to be correlated with the individ-
ual’s educational status. Hence, HR’s on-site assistance in filing the online application
may have induced a selection problem by encouraging relatively more applications by
less educated insiders.
13

3.3 The IV-regression
Both the endogeneity and the selection problem warrant the use of instrumental vari-
ables. Hence, we instrument Grade to account for the endogeneity of the job specifica-
tion mechanism. Our interviews suggest that the three DoE -types within the firm (i.e.,
central administration, DoE staff positions, and technical support and services), face dif-
ferent labor market characteristics and, consequently, determine workplace scores such
as to generate attractive salary ranges. Hence, the department-types qualify as adequate
instruments. We set technical support and services as the reference department.
Furthermore, the number of applications by individuals who possess a higher than
the minimum required educational degree - denoted Overeducated - proxies the firm’s
expectation concerning the scarcity of the respective personnel. Given the above, the
decision to file an application should be a function of the recruiting channel reflecting an
applicant’s access to on-site assistance. Conditional on this covariate, the participation
decisions should be independent between the two groups. Controlling for the recruit-
ing channel in a Two-Stage Least Squares (2SLS) approach then appears sufficient to
overcome this problem.
First, we perform the Hausman test for endogeneity to address the quality of our
arguments above. Following Wooldridge (2002, p. 361 and p. 471), we insert the
predicted residuals from the reduced form into the main regression equation and test
whether the respective coefficient is statistically different from zero. The left hand side
of Table 5 reports the results from the first stage. The respective F -statistic attains the
value of 17.1320. Given that the Hausman test strongly rejects the null of no endogeneity,
we next implement Murphy and Topel’s (2002) approach to correct the standard errors
and report the results for the linear probability model (LPM ) in the right-hand side of
Table 5.
Further, in the reduced form (i.e. the left column of Table 5) the coefficient on
the number of overeducated applicants is positive and highly significant. This finding
confirms that HR and DoE agree on higher workplace scores when they expect more job
candidates with higher educational degrees.21 However, to achieve a correct inference
in the 2SLS framework, we check the correlation between the endogenous variable and
20To economize on space, we do not report the second step of the Hausman test.21Within our sample, Grade varies in between 50 and 65. Hence, one more overeducated applicant
per job increases this score by 0.002 points.
14
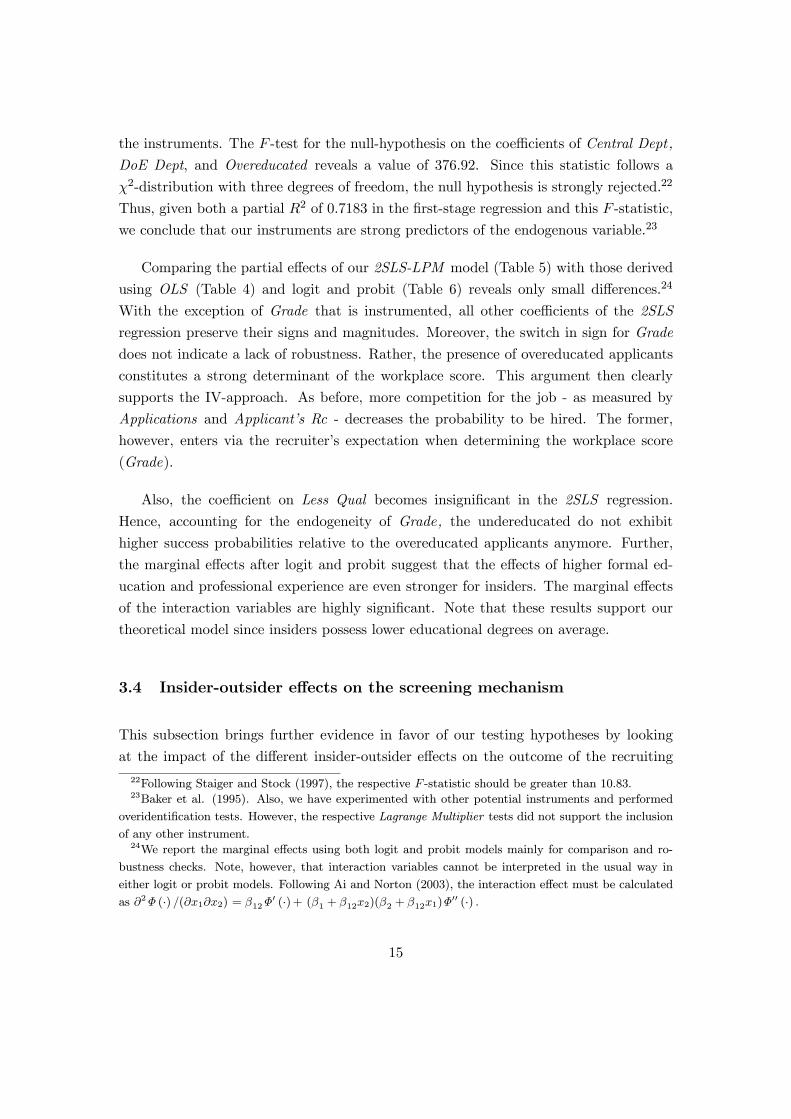
the instruments. The F -test for the null-hypothesis on the coefficients of Central Dept,
DoE Dept, and Overeducated reveals a value of 376.92. Since this statistic follows a
χ2-distribution with three degrees of freedom, the null hypothesis is strongly rejected.22
Thus, given both a partial R2 of 0.7183 in the first-stage regression and this F -statistic,
we conclude that our instruments are strong predictors of the endogenous variable.23
Comparing the partial effects of our 2SLS-LPM model (Table 5) with those derived
using OLS (Table 4) and logit and probit (Table 6) reveals only small differences.24
With the exception of Grade that is instrumented, all other coefficients of the 2SLS
regression preserve their signs and magnitudes. Moreover, the switch in sign for Grade
does not indicate a lack of robustness. Rather, the presence of overeducated applicants
constitutes a strong determinant of the workplace score. This argument then clearly
supports the IV-approach. As before, more competition for the job - as measured by
Applications and Applicant’s Rc - decreases the probability to be hired. The former,
however, enters via the recruiter’s expectation when determining the workplace score
(Grade).
Also, the coefficient on Less Qual becomes insignificant in the 2SLS regression.
Hence, accounting for the endogeneity of Grade, the undereducated do not exhibit
higher success probabilities relative to the overeducated applicants anymore. Further,
the marginal effects after logit and probit suggest that the effects of higher formal ed-
ucation and professional experience are even stronger for insiders. The marginal effects
of the interaction variables are highly significant. Note that these results support our
theoretical model since insiders possess lower educational degrees on average.
3.4 Insider-outsider effects on the screening mechanism
This subsection brings further evidence in favor of our testing hypotheses by looking
at the impact of the different insider-outsider effects on the outcome of the recruiting
22Following Staiger and Stock (1997), the respective F -statistic should be greater than 10.83.23Baker et al. (1995). Also, we have experimented with other potential instruments and performed
overidentification tests. However, the respective Lagrange Multiplier tests did not support the inclusion
of any other instrument.24We report the marginal effects using both logit and probit models mainly for comparison and ro-
bustness checks. Note, however, that interaction variables cannot be interpreted in the usual way in
either logit or probit models. Following Ai and Norton (2003), the interaction effect must be calculated
as ∂2Φ (·) /(∂x1∂x2) = β12Φ0 (·)+ (β1 + β12x2)(β2 + β12x1)Φ
00 (·) .
15
process. First, Table 7 considers three separate regressions across over (N=10923 ob-
servations), adequately (N=10945 observations), and less educated applicants (N=3362
observations) where as before, Status denotes the dependent variable.
Due to space considerations, we only report the estimates for the key variables of
interest. Several findings emerge. As expected, having work experience increases the
probability of being hired both for insider and outsider applicants. However, the coeffi-
cient on Experience for insiders is statistically higher than that for outsiders across all
types of applicants (for details, see the F-tests in Table 7). This finding confirms the
implications of our theoretical and empirical results so far, showing that the ”discount”
rate applied to professional experience is lower for the insider applicants. In contrast, the
coefficients on Education for insiders, while positive do not appear to be significant. The
positive impact of outsiders’ Education is strongest for the overeducated applicants. At
the 1% level, the coefficient on outsiders’ Education is statistically higher than that on
the insiders’ Education. For the less and adequately educated applicants, the impact of
Education appears the same for both insider and outsider applicants. This fact further
strengthens hypothesis H1.
Table 8 concerns the testing of our second hypothesis. It reports the results of
two separate regressions estimating the hiring probabilities for applicants who apply
for jobs that require a High-School and a Bachelor diploma, respectively. These two
types of jobs comprise the largest pools of applicants with 18,412 applications in the
first and 10,923 applications in the second case. Hypothesis H2 appears verified as well.
Thus, the coefficient on outsiders’ Education is positive and significant for the HS -type
jobs, while for the jobs that require a BA degree, it does not appear to be statistically
different from zero. This finding implies that that the overeducation effect on the group
of outsider recruits increases with lower minimum educational standards advertised by
the firm. Further, the positive impact of having work experience is statistically higher
for insider than for outsider applicants (see the F-tests for details). These results align
with previous findings in Table 3. More importantly, however, they clearly contradict
the validity of the career mobility approach within the current context.
Finally, Table 9 further strengthens the second hypothesis by analyzing the predicted
average hiring probabilities for over, adequately, and less educated applicants, across the
two types of jobs. The LPM, logit, and probit estimates are almost identical. This anal-
ysis uses the LPM-results to derive the average hiring probabilities conditional on the
advertised educational requirement for the full sample and a sample excluding all the
16
insider applicants. Across the advertised degree requirements, the decrease in the pre-
dicted average hiring probabilities is largest for the less educated applicants. This result
highlights again that, when competing for the same job, successful outsider recruits are
characterized by higher educational attainments than insiders. Yet, the latter are gen-
erally more successful in becoming hired/promoted. Hence, our findings do not support
the career mobility approach.
3.5 Goodness of fit
Since we are using firm-level data, an immediate question concerns whether our empirical
results are also descriptive for the HR’s activities and choices. Hence, we carry out the
Hosmer-Lemeshow (1982) goodness-of-fit test. We divide our sample into six subsamples
to compare observed and predicted counts of outcome events. This number of subgroups
corresponds to the number of different minimum levels of education advertised: jobs
which require (1) the ability to read and write, (2) a highschool diploma, (3) a post-
secondary (i.e. two-year college) degree, (4) a bachelor’s degree, (5) a master degree,
and (6) a doctorate degree.
Thus, the first sextile corresponds to the 1/6-sample of applicants who are charac-
terized by the lowest while the sixth sextile is defined for the subgroup with the highest
probability to be hired. The Hosmer-Lemeshow (HL) statistic is then computed as
HL =6X
i=1
∙(observed counts (i) − predicted counts (i))2
predicted counts (i)
¸. (15)
If the null hypothesis of a “good fit” is true, this statistic is distributed χ2 with four
degrees of freedom. The overall value of HL of 4.77 implies that the null hypothesis of
a “good fit” cannot be rejected with reasonable statistical significance.
Although the model therefore seems to fit well, there may still be a large number
of cases where it fails to predict individual outcomes correctly. Given that a predicted
hiring is defined by a predicted probability of being hired exceeding 0.5, we compare
this predicted with the actual outcome (“hired” or “not hired”) for every applicant. In
96.4% of all cases the predictions are correct. Specifically, we correctly predict 99.82%
of all non-hiring cases. However, a hiring decision is correctly predicted in only 6.75%
of the respective cases.
17
Of course, this share of correctly predicted hirings can be increased by lowering
the cut-off probability defining this incidence. The functional relationship between the
percentage of correctly predicted recruitments and the cut-off probability is denoted
sensitivity. Yet, increasing the cut-off probability comes at the expense of increasing the
probability of predicting a hiring when the actual outcome is “not hired”. The respective
functional relationship between the percentage of falsely predicted recruitments and the
cut-off probability is denoted 1-specificity.
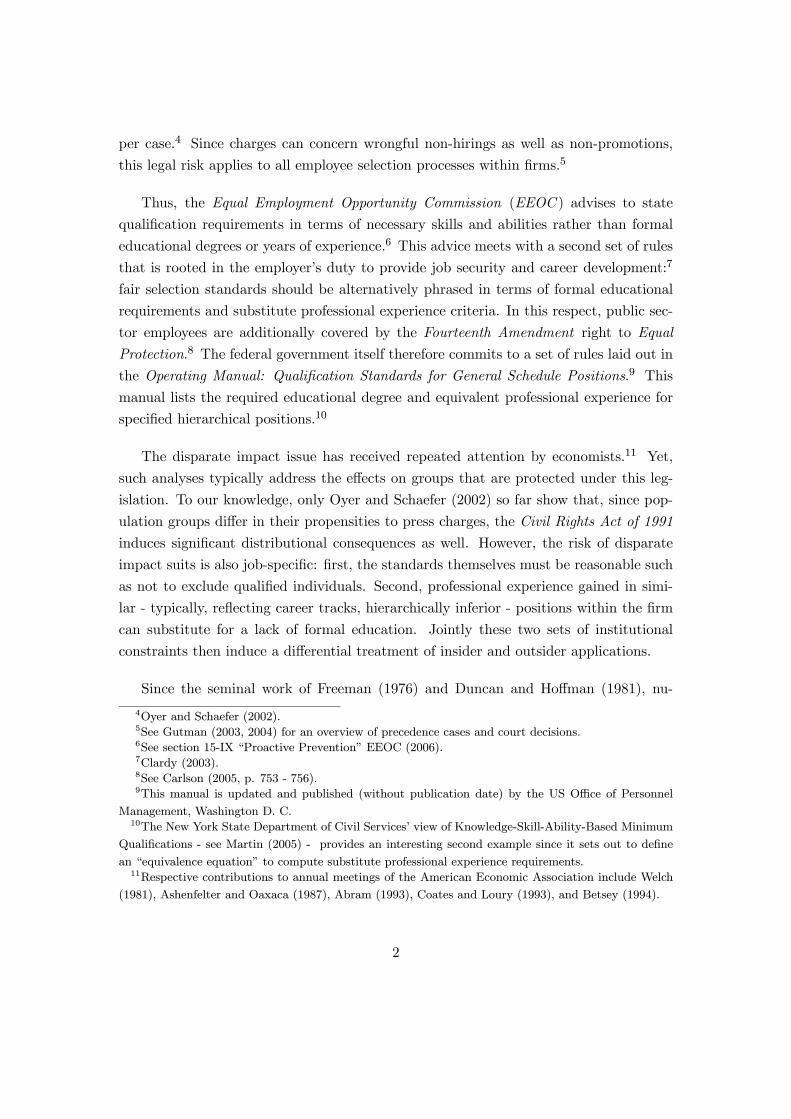
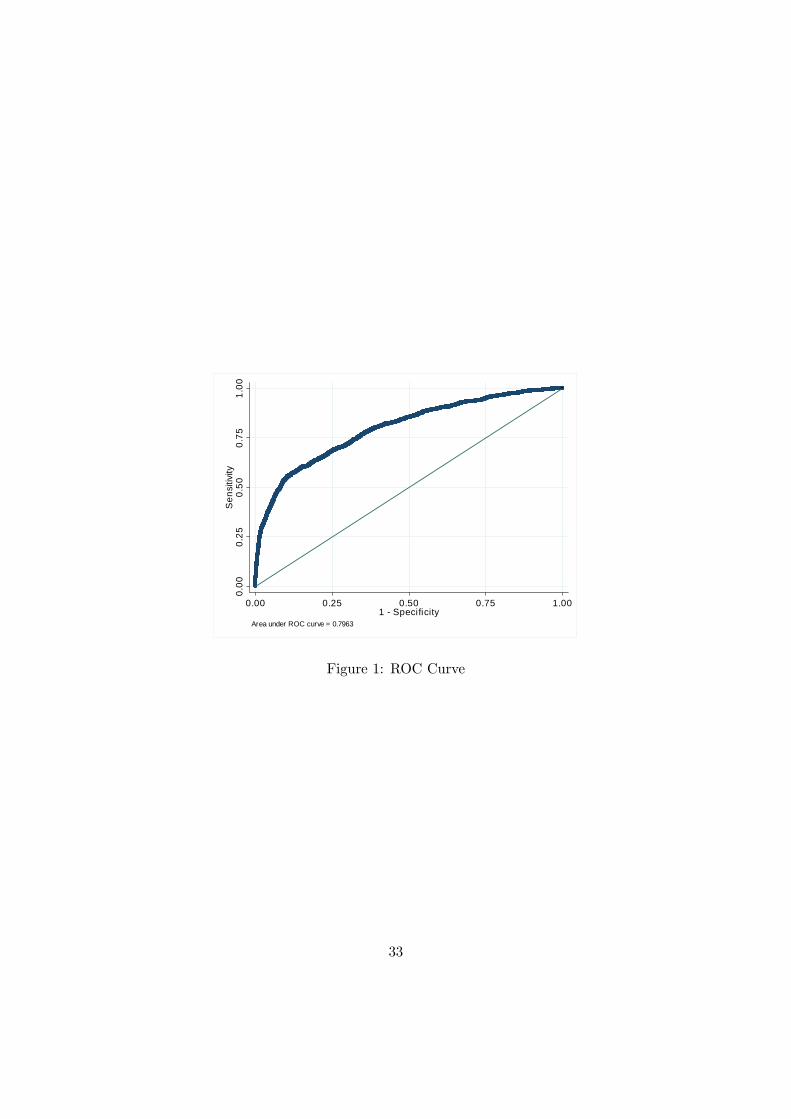
The so-calledROC-curve25 draws out the sensitivity-specificity trade-off and provides
a benchmark: the predictive power of a model is better the higher the curve arches above
the 45-degree line. The ROC-curve would coincide with this line if the model would both
correctly and falsely predict 50% of all recruitments for all cut-off probabilities. In our
case, the area under the ROC-curve is 0.7960 when we include all observations. However,
we also calculate this curve using “out-of-sample”-forecasts. Specifically, we randomly
exclude 10% of the successful applicants and re-estimate the model. Given the newly
estimated coefficients, we compute the hiring probabilities of the recruits previously
excluded. In this case, the area under the respective ROC-curve - depicted in Figure 1
- equals 0.7963. The model thus exhibits rather strong predictive power.26
4 Summary and policy discussion
We analyze a standard employee selection model given two stylized institutional con-
straints: first, professional experience can perfectly substitute for a lack of formal ed-
ucation for insiders while this substitution is imperfect for applications from outside
the firm. Second, due to increased legal risk, the respective “discount rate” applied to
outsiders’ professional experience increases with the advertised minimum educational
requirement. The optimal selection policy then implies that the expected level of formal
education is higher for outsider than for insider recruits. However, such recruits are only
seemingly overeducated: in absence of these constraints restricting the signal value of
education, the respective standards would be set higher and identically equal for both
groups.
25I. e. the “Receiver Operating Characteristic” curve. See DeLong et al. (1988) for a discussion.26Given a χ2(1)-distribution, the test statistic of 2.78 indicates no significant difference (at a 5% -level)
between the full sample and the out-of-sample forecasts.
18
Moreover, the difference in educational attainments between the two groups of re-
cruits increases with lower educational job requirements. These insider-outsider effects
are very specific to our theoretic approach and are strongly supported by our empirical
results. At the same time, the results are also generally consistent with previous empir-
ical work on the overeducation effect on the probability to be hired from the external
labor market. Yet, in strong contrast with the career mobility approach as the alterna-
tive theoretic framework, overeducation does not increase the hiring probabilities - i. e.
enhance the promotion chances - of insider recruits.
Our case concerns employee selection by a large US public employer that is subjected
to constitutional restraints and self-regulated by manuals of fair employment practises.27
Currently, however, a set of similar regulations emerges in Europe: the Commission of
the European Communities (2000) and the Council of Europe (2001) have initiated a
process to establish the formal equivalence of educational degrees and professional ex-
perience gained in occupational training programs. This policy intends to foster life-
long learning and, mirroring the US disparate impact experience, to include population
groups that are socially excluded from obtaining adequate education. The EU member
states must establish systems of Accreditation of Prior Learning (APEL) that involve
firms offering vocational training programs as well as non-governmental organizations
representing such disadvantaged groups.28
The current states of implementation vary widely across the European countries.
By virtue of the Validation des Acquis Professionneles (VAP) and the Validation des
Acquis de l’Experience (VAE) decrees, however, french employees can already obtain a
perfect university degree equivalent certificate without attending university at all.29 Such
legal equivalence rules ultimately constitute binding constraints on employee selection
processes in all firms, public and private. Thus, the rate of substitution between formal
education and professional experience should be equalized between insider and outsider
applicants. This development will reduce the overeducation effect on hiring probabilities.
However, it then also reduces the predictor value of formal education and, consequently,
precision in recruitment processes.
27Obviously, we agree with Groeneveld and Hartog (2004) who caution that, unless reconfirmed reg-
ularly, case study results should not be generalized.28See Davies (2003) for an overview of the origins and implemenation steps of this action plan.29In contrast, the development in the United Kingdom is still much in the state of an initiating political
debate, for instance. Hence, it may be particularly interesting, to refer to Gallagher and Feutrie (2003)
as a combined French and Anglo-Saxon source for further insights.
19
5 References
Abram, T.G. (1993). The Law, Its Interpretation, Levels of Enforcement, and Effect
on Employer Behavior. American Economic Review, vol. 83, p. 62-66.
Ai, C. and E.C. Norton. (2003). Interaction Terms in Logit and Probit Models.
Economics Letters, vol. 80, p. 123-129.
Anderson, N., F. Lievens, K. van Dam and A.M. Ryan. (2004) Future Perspectives
on Employee Selection: Key Directions for Future Research and Practise. Applied
Psychology: An International Review, vol. 53, p. 487-501.
Ashenfelter, O. and R. Oaxaca. (1987). The Economics of Discrimination. American
Economic Review, vol. 77, p. 321-325.
Baker, R.M., J. Bound and D.A. Jaeger. (1995). Problems with Instrumental Variables
Estimation When the Correlation between the Instruments and the Endogeneous
Variable is Weak. Journal of the American Statistical Association, vol. 90, p.
443-450.
Bauer, T. (2002) Educational Mismatch and Wages: A Panel Approach. Economics
of Education Review, vol. 21, p. 221-229.
Betsey, C.L. (1994). Litigation of Employment Discrimination under Title VII: the
Case of African-AmericanWomen. American Economic Review, vol. 84, p. 98-102.
Carlson, R. (2005). Employment Law, New York, N.Y.: Aspen Publishers.
Chevalier, A. (2003). Measuring Over-Education. Economica, vol. 70, p. 509-531.
Chor, D. and R.B. Freeman. (2005). The 2004 Global Labor Survey: Workplace
Institutions and Practices Around the World. Cambridge, Ma: National Bureau
for Economic Research - NBER, Working Paper 11598.
Clardy, A. (2003). The Legal Framework of Human Resources Development, Part
II: Fair Employment, Negligence, and Implications for Scholars and Practioners.
Human Resources Development Review, vol. 2, p. 130-154.
Coate, S. and G. Loury. (1993). Antidiscrimination Enforcement and the Problem of
Patronization. American Economic Review, vol. 83, p. 92-98.
20
Commission of the European Communities. (2000). A Memorandum on Lifelong
Learning. Luxembourg: OOPEC, Staff Working Paper, SEC 1832.
Council of Europe. (2001). Lifelong Learning and Social Cohesion: A New Challenge
to Higher Education. Strasbourg: Council of Europe, Final Conference Report.
Dakin, S. and J. S. Armstrong. (1989). Predicting Job Performance: Comparison of
Expert Opinions and Research Findings. International Journal of Forecasting, vol.
5, p. 187-194.
Davies, P. (2003). Widening Participation and the European Union: Direct Action -
Indirect Policy? European Journal of Education, vol. 38, p. 99-116.
DeLong, E.R., D.M. DeLong and D.L. Clarke-Pearson. (1988). Comparing the Areas
under Two or More Correlated Receiver Operating Characteristic Curves: A Non-
Parametric Approach. Biometrics, vol. 44, p. 837-845.
Duncan, G.J. and S.D. Hoffman. (1981). The Incidence and Wage Effects of Overed-
ucation. Economics of Education Review, vol. 1, p. 75-86.
Freeman, R.B. (1976). The Overeducated American, New York: Academic Press.
Gallagher, J. and M. Feutrie. (2003). Recognising and Accrediting Informal and Non-
Formal Learning in Higher Education: An Analysis of the Issues Emerging from a
Study of France and Scotland. European Journal of Education, vol. 38, p. 71-83.
Godard, J. (2002). Institutional Environments, Employer Practices, and States in
Liberal Market Economies. Industrial Relations, vol. 41, p. 249-286.
Groeneveld, S. and J. Hartog. (2003). Overeducation, Wages and Promotions Within
the Firm. Labour Economics, vol. 11, p. 701-714.
Groot, W. and H. Maasen van den Brink. (2000). Overeducation in the Labor Market:
A Meta Analysis. Economics of Education Review, vol. 19, p. 149-158.
Gutman, A. (2003). On the Legal Front: Adverse Impact - Why Is It So Difficult to
Understand. The Industrial-Psychologist, vol. 40, p. 42-50.
Gutman, A. (2004). On the Legal Front: Ground Rules for Adverse Impact. The
Industrial-Psychologist, vol. 41, p. 109-119.
Han, C. and P.C.B. Phillips (2006). GMM with Many Moment Conditions. Econo-
metrica, vol. 74, p. 147-192.
21
Hartog, J. (2000). Over-Education and Earnings: Where Are We and Where Should
We Go? Economics of Education Review, vol. 19, p. 131-147.
Holling, H. (1998). Utility Analysis of Personnel Selection: An Overview and Empir-
ical Study Based on Objective Performance Methods. Methods of Psychological
Research Online, vol. 3, p. 5-24.
Lemeshow, S. and Hosmer, D. W. (1982). A Review of Goodness of Fit Statistics
for Use in the Development of Logistic Regression Models. American Journal of
Epidemiology, vol. 115, p. 92-106.
Martin, W. (2005). KSA-Based Minimum Qualification Standards. Paper presented
at the Mid-Atlantic Personnel Assessment Consortium - MAPAC, May 13, 2005.
Murphy, K. M. and Topel, R. H. (2002). Estimation and Inference in Two-Step Econo-
metric Models. Journal of Business and Economic Statistics, vol. 20, 88-97.
Oyer, P. and S. Schafer. (2002). Litigation Costs and Returns to Experience. Ameri-
can Economic Review, vol. 92, p. 683-705.
Phillips, P.C.B. (2006). A Remark on Bimodality and Weak Instrumentation in Struc-
tural Equation Estimation. Econometric Theory, vol. 22, p. 947-960.
Robertson, I.T. and M. Smith. (2001). Personnel Selection. Journal of Occupational
and Organizational Psychology, vol. 74, p. 441-472.
Sattinger, M. (1993). Assignment Models of Distribution of Earnings. Journal of
Economic Literature, vol. 31, p. 851-880.
Schmidt, F.L. and J.E. Hunter. (1998). The Validity and Utility of Selection Methods
in Personnel Psychology: Practical and Theoretical Implications of 85 Years of
Research Findings. Psychological Bulletin, vol. 124, p. 262-274.
Sicherman, N. and O. Galor. (1990). A Theory of Career Mobility. Journal of Political
Economy, vol. 98, p. 169-192.
Spence, M. (1973). Job Market Signaling. Quarterly Journal of Economics, vol. 87,
p. 355-374.
Staiger, D. and Stock, J. H. (1997). Instrumental Variables Regression with Weak
Instruments. Econometrica, vol. 65, p. 557-586.
22
Thurow, L. C. (1975). Generating Inequality: Mechanisms of Distribution in the US
Economy. New York, N.Y.: Basic Books.
US Equal Employment Opportunity Commission - EEOC, Civil Service Commission,
(1978). Uniform Guidelines on Employee Selection Procedures. Washington, D.C.:
Federal Register, Vol. 43.
US Equal Employment Opportunity Commission - EEOC. (2006). EEOC Compliance
Manual, Section 15: Race & Color Discrimination, Washington, D.C.: EEOC
4/9/2006, Directives Transmittal No. 915.003.
Welch, F. (1981). Affirmative Action and Its Enforcement. American Economic Re-
view, vol. 71, p. 127-133.
Wooldridge, J. M. (2002). Econometric Analysis of Cross Section and Panel Data.
Cambridge, Ma.: MIT Press.
23
Appendix A: Variables Description
The set of dependent variables
Status = indicates hiring status: 1 if hired, 0 if not hired
Variables which concern the recruiting channel
SEO = is 1 if the recruiting channel is State Employment O¢ ce; 0 elsewhere
JNU = is 1 if the recruiting channel is A job notice sent to my organization;0 elsewhere
DCD = is 1 if the recruiting channel is Direct contact from department; 0
elsewhere
ORC = is 1 if the recruiting channel is Other Recruiting Channels; 0 else-where
NWAd = is 1 if the recruiting channel is print-ad type - Newspaper Adver-tisement, Professional journal, newsletter, list-serve, or registry; 0 elsewhere
IntRe¤ered = is 1 if the recruiting channel is Referred by a current em-
ployee; 0 elsewhere
WebRC = is 1 if the recruiting channel is web-based; 0 elsewhere
Insiders = DCD & IntRe¤ered
Variables which concern the type of each department where job positions areopened
Centr. Admin. = is 1 if the job is in the Central Administration; 0 elsewhere
DoE Admin. = is 1 if the job is in a Department of Employment; 0 elsewhere
TechDept = is 1 if job is in the technical department; 0 elsewhere
Variables which concern job specications
Grade = numerical value determined on the basis of six factors and it indicatesthe payment range of a position title. It increases with job requirements.
EEO = stands for Equal Employment Opportunity. It has a value of 10 for
executive and managerial positions and increases up to 70 for service and
maintenance positions.
24

FLSA = indicates the Fair Labor Standard Status; it is 1 if employees are
exempt (i.e. do not get paid if they do over time work) and 0 if they are not
exempt (i.e. they are paid if they work overtime)
JobType = it is a ranking variable that takes value in between 1 and 6; 1
is the lowest ranked and corresponds to Contingent/On-Call (No Benets)
while highest job type is Regular - Full-Time (Benets Eligible)
Quantitative variables regarding each type and number of applicants
Applications = total number of applications per position title
Less Qual. = dummy that is 1 if undereducated; 0 otherwise
Exact Qual. = dummy that is 1 if adequately educated; 0 otherwise
Over Qual. = dummy that is 1 if overeducated; 0 otherwise
Overqualied = number of overeducated applicants for each position title
Appl.s Rc = number of applicants per recruiting channel
Variables which are applicantscharacteristic
Age = Each applicants age; Age Sq. = square of Age
Experience = is 1 if the applicant has work experience and 0 if he does not
Exp. Ins. = interaction variable between Experience and Insiders
Education = Ranking variable that goes from 0 (i.e. 1st grade) until the
highest level of 19 (i.e. doctorate); Educ. Sq. = square of Education
Educ. Ins. = interaction variable between Education and Insiders.
Sex = 1 if Male, 0 if Female
NonWhite = is 1 if White/Non-Hispanic; 0 elsewhere.
25

Appendix B: Tables and Figures
Table 1: Descriptive statistics of the online-recruitment systemTotal number of applications 33780 100%
Qualied applicants forwarded to departments 26641 78.86%
Disqualied applicants 4469 13.22%
Applications cancelled 828 2.45%
Applications withdrawn 837 2.47%
Applications led but failed to maintain contact 1005 2.97%
Number of jobs lled using on-line system 1244 3.68%
Table 2: Educational attainments of applicants and recruitsYear Doct. Mast. Bach. Some Coll. Highsch. Some High. GED n.a. Total
All applicants
2003 135 883 2208 2615 789 42 116 13 6801
2004 274 2068 4031 3850 1031 55 165 9 11483
2005 410 2271 4648 4804 1338 30 156 9 13666
2006 30 255 714 589 201 8 32 1 1830
Recruits
2003 7 24 51 84 29 1 3 0 199
2004 13 73 158 143 57 2 6 0 452
2005 19 84 181 180 50 1 7 0 522
2006 1 16 29 20 5 0 0 0 71
26
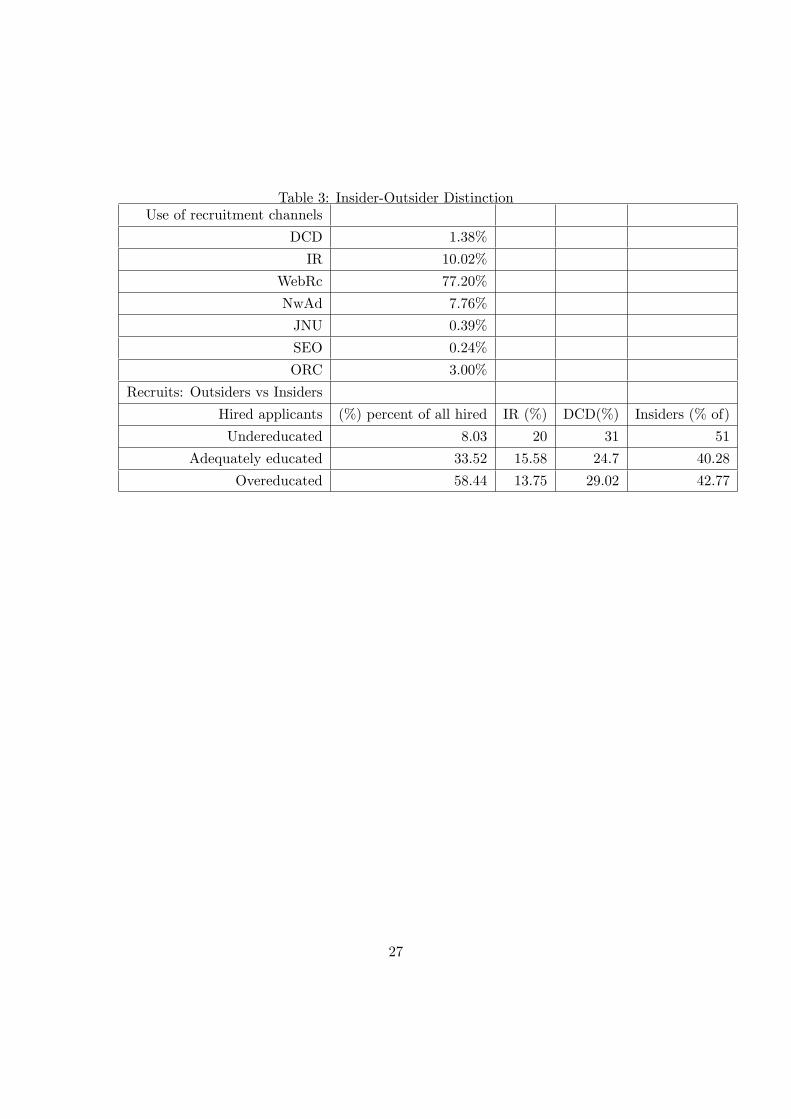
Table 3: Insider-Outsider DistinctionUse of recruitment channels
DCD 1.38%
IR 10.02%
WebRc 77.20%
NwAd 7.76%
JNU 0.39%
SEO 0.24%
ORC 3.00%
Recruits: Outsiders vs Insiders
Hired applicants (%) percent of all hired IR (%) DCD(%) Insiders (% of)
Undereducated 8.03 20 31 51
Adequately educated 33.52 15.58 24.7 40.28
Overeducated 58.44 13.75 29.02 42.77
27
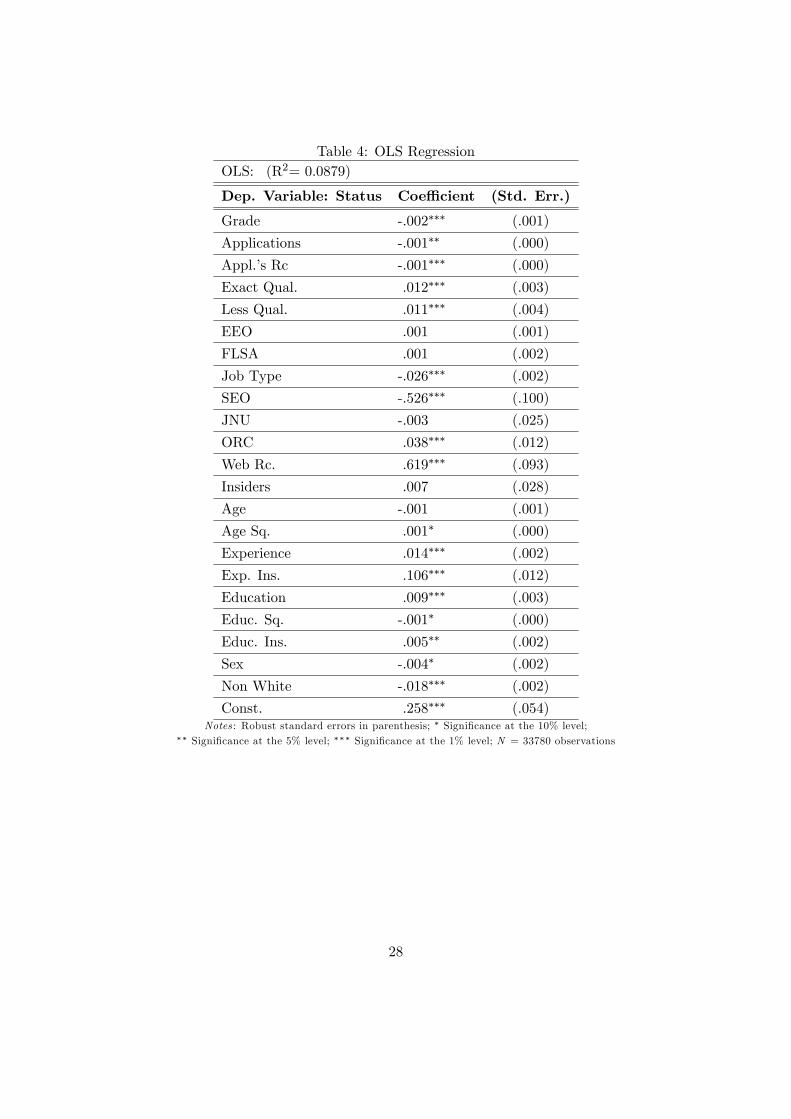
Table 4: OLS RegressionOLS: (R2= 0.0879)
Dep. Variable: Status Coe¢ cient (Std. Err.)
Grade -.002 (.001)
Applications -.001 (.000)
Appl.s Rc -.001 (.000)
Exact Qual. .012 (.003)
Less Qual. .011 (.004)
EEO .001 (.001)
FLSA .001 (.002)
Job Type -.026 (.002)
SEO -.526 (.100)
JNU -.003 (.025)
ORC .038 (.012)
Web Rc. .619 (.093)
Insiders .007 (.028)
Age -.001 (.001)
Age Sq. .001 (.000)
Experience .014 (.002)
Exp. Ins. .106 (.012)
Education .009 (.003)
Educ. Sq. -.001 (.000)
Educ. Ins. .005 (.002)
Sex -.004 (.002)
Non White -.018 (.002)
Const. .258 (.054)Notes : Robust standard errors in parenthesis; Signicance at the 10% level;
Signicance at the 5% level; Signicance at the 1% level; N = 33780 observations
28
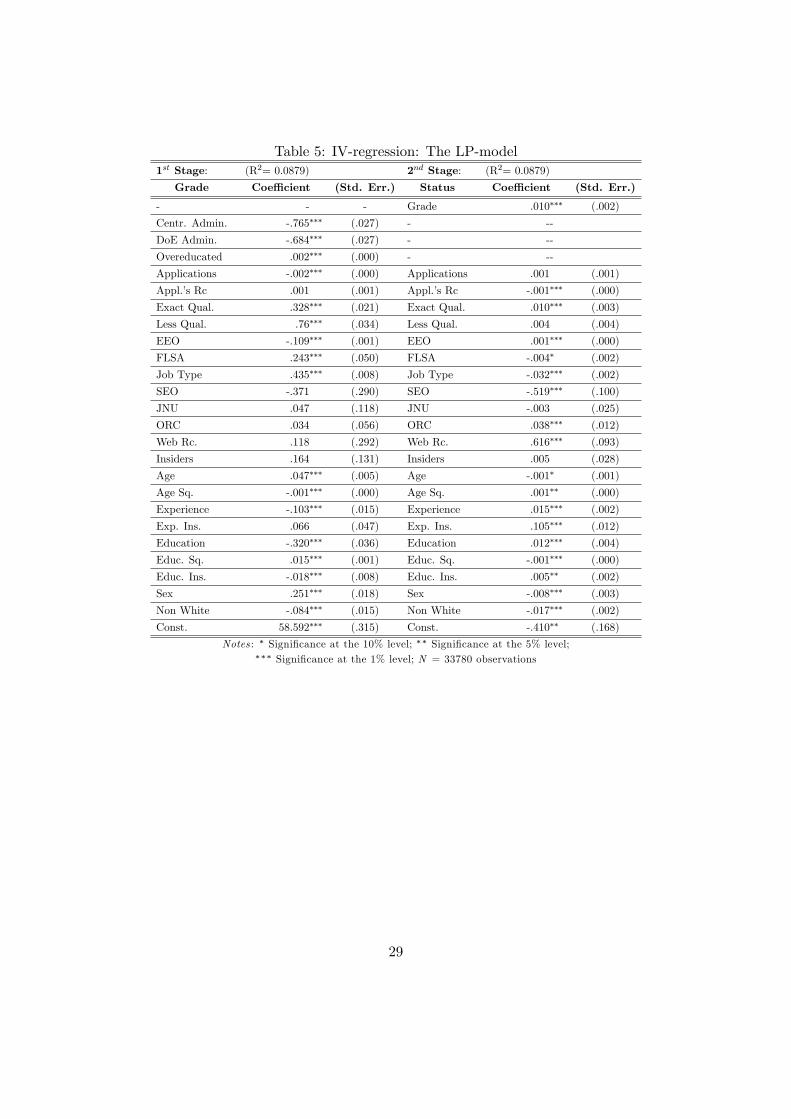
Table 5: IV-regression: The LP-model1st Stage: (R2= 0.0879) 2nd Stage: (R2= 0.0879)
Grade Coe¢ cient (Std. Err.) Status Coe¢ cient (Std. Err.)
- - - Grade .010 (.002)
Centr. Admin. -.765 (.027) - --
DoE Admin. -.684 (.027) - --
Overeducated .002 (.000) - --
Applications -.002 (.000) Applications .001 (.001)
Appl.s Rc .001 (.001) Appl.s Rc -.001 (.000)
Exact Qual. .328 (.021) Exact Qual. .010 (.003)
Less Qual. .76 (.034) Less Qual. .004 (.004)
EEO -.109 (.001) EEO .001 (.000)
FLSA .243 (.050) FLSA -.004 (.002)
Job Type .435 (.008) Job Type -.032 (.002)
SEO -.371 (.290) SEO -.519 (.100)
JNU .047 (.118) JNU -.003 (.025)
ORC .034 (.056) ORC .038 (.012)
Web Rc. .118 (.292) Web Rc. .616 (.093)
Insiders .164 (.131) Insiders .005 (.028)
Age .047 (.005) Age -.001 (.001)
Age Sq. -.001 (.000) Age Sq. .001 (.000)
Experience -.103 (.015) Experience .015 (.002)
Exp. Ins. .066 (.047) Exp. Ins. .105 (.012)
Education -.320 (.036) Education .012 (.004)
Educ. Sq. .015 (.001) Educ. Sq. -.001 (.000)
Educ. Ins. -.018 (.008) Educ. Ins. .005 (.002)
Sex .251 (.018) Sex -.008 (.003)
Non White -.084 (.015) Non White -.017 (.002)
Const. 58.592 (.315) Const. -.410 (.168)
Notes : Signicance at the 10% level; Signicance at the 5% level; Signicance at the 1% level; N = 33780 observations
29
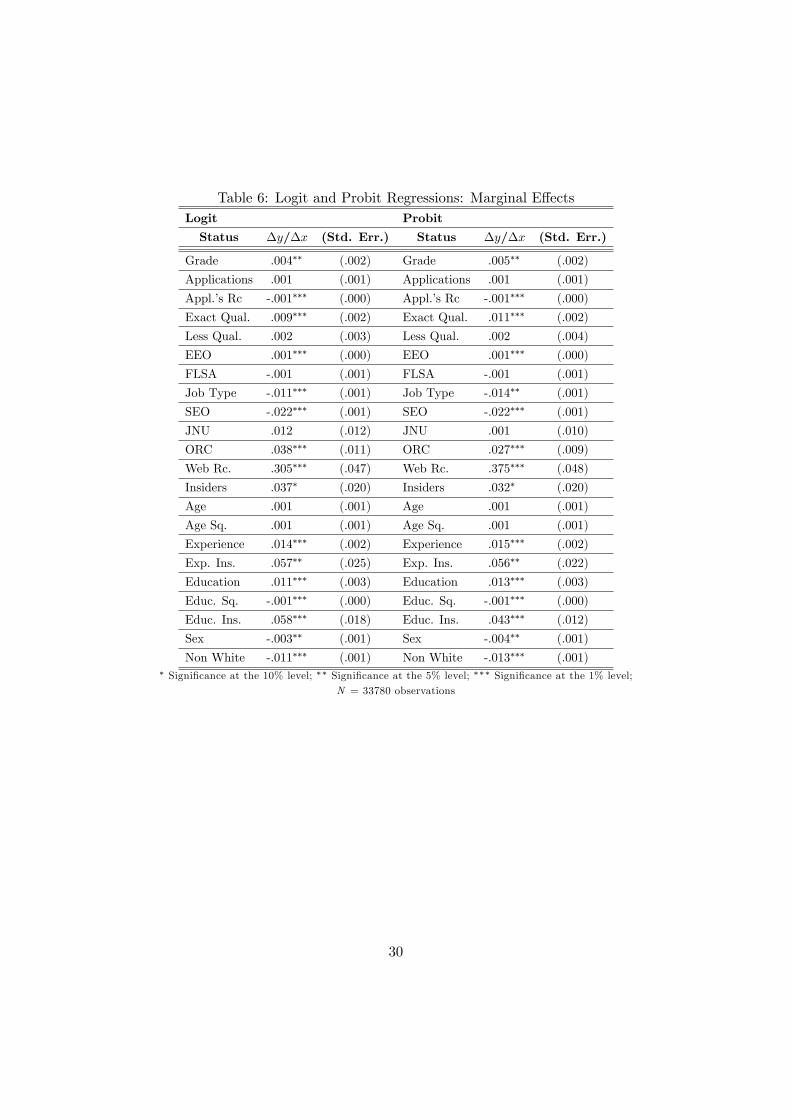
Table 6: Logit and Probit Regressions: Marginal E¤ectsLogit Probit
Status y/x (Std. Err.) Status y/x (Std. Err.)
Grade .004 (.002) Grade .005 (.002)
Applications .001 (.001) Applications .001 (.001)
Appl.s Rc -.001 (.000) Appl.s Rc -.001 (.000)
Exact Qual. .009 (.002) Exact Qual. .011 (.002)
Less Qual. .002 (.003) Less Qual. .002 (.004)
EEO .001 (.000) EEO .001 (.000)
FLSA -.001 (.001) FLSA -.001 (.001)
Job Type -.011 (.001) Job Type -.014 (.001)
SEO -.022 (.001) SEO -.022 (.001)
JNU .012 (.012) JNU .001 (.010)
ORC .038 (.011) ORC .027 (.009)
Web Rc. .305 (.047) Web Rc. .375 (.048)
Insiders .037 (.020) Insiders .032 (.020)
Age .001 (.001) Age .001 (.001)
Age Sq. .001 (.001) Age Sq. .001 (.001)
Experience .014 (.002) Experience .015 (.002)
Exp. Ins. .057 (.025) Exp. Ins. .056 (.022)
Education .011 (.003) Education .013 (.003)
Educ. Sq. -.001 (.000) Educ. Sq. -.001 (.000)
Educ. Ins. .058 (.018) Educ. Ins. .043 (.012)
Sex -.003 (.001) Sex -.004 (.001)
Non White -.011 (.001) Non White -.013 (.001) Signicance at the 10% level; Signicance at the 5% level; Signicance at the 1% level;
N = 33780 observations
30
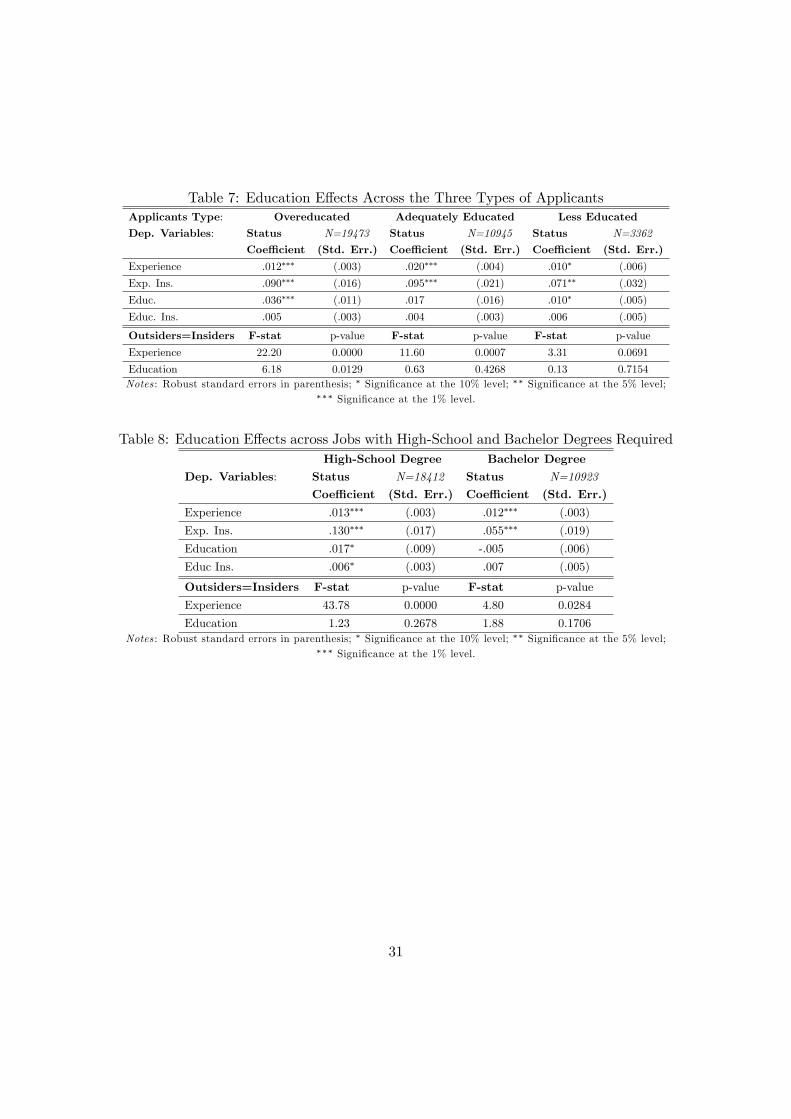
Table 7: Education E¤ects Across the Three Types of ApplicantsApplicants Type: Overeducated Adequately Educated Less EducatedDep. Variables: Status N=19473 Status N=10945 Status N=3362
Coe¢ cient (Std. Err.) Coe¢ cient (Std. Err.) Coe¢ cient (Std. Err.)
Experience .012 (.003) .020 (.004) .010 (.006)
Exp. Ins. .090 (.016) .095 (.021) .071 (.032)
Educ. .036 (.011) .017 (.016) .010 (.005)
Educ. Ins. .005 (.003) .004 (.003) .006 (.005)
Outsiders=Insiders F-stat p-value F-stat p-value F-stat p-value
Experience 22.20 0.0000 11.60 0.0007 3.31 0.0691
Education 6.18 0.0129 0.63 0.4268 0.13 0.7154Notes : Robust standard errors in parenthesis; Signicance at the 10% level; Signicance at the 5% level;
Signicance at the 1% level.
Table 8: Education E¤ects across Jobs with High-School and Bachelor Degrees RequiredHigh-School Degree Bachelor Degree
Dep. Variables: Status N=18412 Status N=10923
Coe¢ cient (Std. Err.) Coe¢ cient (Std. Err.)
Experience .013 (.003) .012 (.003)
Exp. Ins. .130 (.017) .055 (.019)
Education .017 (.009) -.005 (.006)
Educ Ins. .006 (.003) .007 (.005)
Outsiders=Insiders F-stat p-value F-stat p-value
Experience 43.78 0.0000 4.80 0.0284
Education 1.23 0.2678 1.88 0.1706Notes : Robust standard errors in parenthesis; Signicance at the 10% level; Signicance at the 5% level;
Signicance at the 1% level.
31
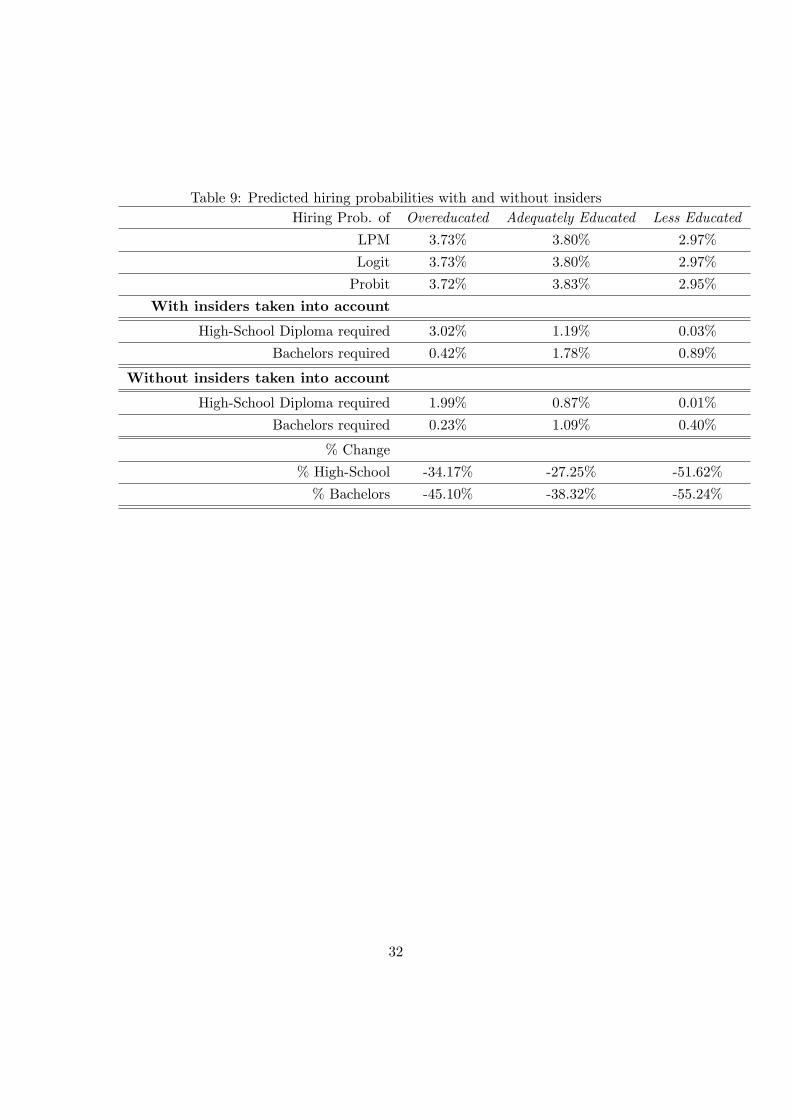
Table 9: Predicted hiring probabilities with and without insidersHiring Prob. of Overeducated Adequately Educated Less Educated
LPM 3.73% 3.80% 2.97%
Logit 3.73% 3.80% 2.97%
Probit 3.72% 3.83% 2.95%
With insiders taken into account
High-School Diploma required 3.02% 1.19% 0.03%
Bachelors required 0.42% 1.78% 0.89%
Without insiders taken into account
High-School Diploma required 1.99% 0.87% 0.01%
Bachelors required 0.23% 1.09% 0.40%
% Change
% High-School -34.17% -27.25% -51.62%
% Bachelors -45.10% -38.32% -55.24%
32
0.00
0.25
0.50
0.75
1.00
Sen
sitiv
ity
0.00 0.25 0.50 0.75 1.001 Specificity
Area under ROC curve = 0.7963
Figure 1: ROC Curve
33


![[CRISIL] Literature review on insider trading and insider ... · Literature review on Insider Trading and Insider Trading Regulation Abstract Views on insider trading and its effects](https://img.pdfslide.us/doc/110x75/5ad077037f8b9a71028de0eb/crisil-literature-review-on-insider-trading-and-insider-review-on-insider.jpg)