Embed Size (px)
Citation preview
Recruitment of faster motor units is associated with greater rates of fascicle strain and rapid changes in muscle force during locomotion
CitationLee, S. S. M., M. de Boef Miara, A. S. Arnold, A. A. Biewener, and J. M. Wakeling. 2013. “Recruitment of Faster Motor Units Is Associated with Greater Rates of Fascicle Strain and Rapid Changes in Muscle Force During Locomotion.” Journal of Experimental Biology 216, no. 2: 198–207.
Published Versiondoi:10.1242/jeb.072637
Permanent linkhttp://nrs.harvard.edu/urn-3:HUL.InstRepos:12560996
Terms of UseThis article was downloaded from Harvard University’s DASH repository, and is made available under the terms and conditions applicable to Open Access Policy Articles, as set forth at http://nrs.harvard.edu/urn-3:HUL.InstRepos:dash.current.terms-of-use#OAP
Share Your StoryThe Harvard community has made this article openly available.Please share how this access benefits you. Submit a story .
Accessibility
1
2
3
4
5
6
7
Recruitment of faster motor units is associated with greater rates of fascicle 8
strain and rapid changes in muscle force during locomotion 9
10
Sabrina S.M. Lee1, Maria de Boef Miara2, Allison S. Arnold2, 11
Andrew A. Biewener2, James M. Wakeling1 12
13
1 Department of Biomedical Physiology and Kinesiology, Simon Fraser University, 14
Burnaby, BC, Canada 15
2 Concord Field Station, Harvard University, Bedford, MA, USA 16
17
18
19
20
21
Word count: 5645 22
Keywords: Electromyography, motor unit, muscle force, fascicle strain, activation 23
24
2
Abstract 1
2
Animals modulate the power output needed for different locomotor tasks through 3
changes in muscle force production and fascicle strain rate. To generate sufficient force, 4
appropriate motor unit recruitment must occur. Given that faster motor units contract with faster 5
strain rates and have faster activation-deactivation rates, it is therefore likely that faster motor 6
units are recruited for more rapid movements. The goals of this study were to 1) describe 7
changes in motor unit recruitment patterns that occur with changes in locomotor dynamics and 2) 8
test whether motor unit recruitment can be directly related to in vivo measures of muscle force 9
and fascicle strain and strain rate, and thus mechanical work. Myoelectric, sonomicrometric, and 10
muscle-tendon force data were collected from the lateral and medial gastrocnemius muscles of 11
the goat hind limb during level and incline walking and trotting, and level galloping. Myoelectric 12
signals were analyzed using wavelet and principal component analysis in order to quantify 13
changes to the myoelectric frequency spectra across locomotor conditions. Fascicle strain and 14
strain rate were calculated from the sonomicrometric data, and force rate was calculated from the 15
tendon force data. The results of this study demonstrate that, under certain locomotor conditions 16
such as level galloping and incline walking, where EMG activity were similar but had different 17
frequency components, faster and slower motor units are recruited in patterns that were task-18
specific. The study also shows that the recruitment patterns of different motor unit types are 19
related to in vivo fascicle strain rates in addition to myoelectric intensity and force. Together, 20
these data provide evidence that changes in motor unit recruitment have an underlying 21
mechanical basis, at least for certain locomotor tasks. 22
23
24
3
Introduction 1
2
Mammalian skeletal muscles are composed of multiple motor unit types, each of which 3
has defined physiological and mechanical properties. This enables these muscles to produce the 4
mechanical output required to perform a wide range of locomotor tasks with variable force and 5
velocity requirements. For example, fast fibres have strain rates and activation-deactivation rates 6
that are two to three times faster than those of slow fibers (He et al., 2000). It seems likely that 7
these differences influence the way motor units are recruited within individual muscles and 8
among synergistic muscles. Many studies have made indirect assessments of muscle force, 9
length, and shortening velocity (e.g. Hodson-Tole and Wakeling, 2008; Lichtwark et al., 2003; 10
Gillis et al., 2005). However, few studies have measured muscle force and strain together 11
directly during differing locomotor tasks due, in part, to methodological challenges. 12
Furthermore, the possible link between motor unit recruitment patterns and task-dependent 13
factors, such as muscle fascicle strain rate, has only been explored in a limited number of studies 14
(Hodson-Tole and Wakeling, 2009, Wakeling et al., 2006). Thus, whether the manner in which 15
recruitment patterns change with the force- or strain-related demands of different locomotor 16
tasks remains largely unknown. 17
Recent in vivo studies have established that muscles modulate their work output to meet 18
the changing mechanical demands associated with various locomotor tasks (Roberts et al. 1997, 19
Daley and Biewener, 2003; Gabaldon et al., 2004; McGuigan et al. 2009). For example, when an 20
animal runs uphill, the net output of the muscles must be increased to raise the body’s center of 21
mass. Across a variety of species, in those muscles examined, muscle fascicle strain, strain rate 22
and force have been shown to vary substantially when animals and humans walk, hop, and run at 23
different speeds, or over different terrain (e.g. Roberts et al., 1997; Biewener, 1998; Biewener et 24
al., 1998; Daley and Biewener, 2003; Gillis and Biewener, 2002; Fukunaga et al., 2001; 25
Lichtwark et al., 2006, 2007; McGuigan et al., 2009). However, the manner in which work 26
output is modulated by recruiting different motor unit types remains largely unknown. 27
When there is a requirement for an increased level of muscle force output from a muscle, 28
motor units are typically recruited in an orderly fashion from slowest to fastest, originally 29
formulated as the size principle of motor unit recruitment by Henneman et al. (1965, 1974) and 30
others (Freund et al., 1975, Fedde et al., 1969). Different motor unit types innervate a range of 31
4
muscle fibres: type 1 – slow-twitch and type IIA-IIB fast twitch-fibres (Burket et al., 1973). 1
However, evidence for alternative, task-dependent recruitment patterns has emerged for muscles 2
operating across a range of species (e.g. Gillespie et al., 1974; Grimby et al., 1981; Nardone et 3
al., 1989; Sokoloff and Cope, 1996; Wakeling et al., 2006; Hodson-Tole and Wakeling, 2007, 4
2008, 2010). For example, there is evidence of preferential recruitment of faster motor unit types 5
during rapid locomotor tasks. This evidence is based, in large part, on analyzing the time-6
varying frequency spectra of myoelectric signals (reviews: Hodson-Tole and Wakeling, 2009; 7
Reaz et al., 2006). Different motor unit types have muscle fibres with different electrical 8
membrane properties (Luff and Atwood, 1972), and there is an intrinsic speed dependence of the 9
EMG frequency such that faster fibers generate higher-frequency signals (Wakeling et al., 2002; 10
Hodson and Wakeling, 2008; Lee et al., 2011). Recently, Wakeling et al. (2006) demonstrated 11
during cycling in humans that EMG signals shifted to higher frequencies when humans cycle at 12
higher pedaling frequencies and muscle fascicle strain rates, consistent with an earlier cycling 13
study that suggested preferential recruitment of the faster quadriceps muscle fibres at faster 14
contraction speeds during locomotion (Citterio and Agostoni, 1984). Hodson-Tole and Wakeling 15
(2008) similarly showed that myoelectric frequency content was associated with changes in 16
fascicle strain rate in rat hindlimb muscles over a range of gait velocities and inclines. 17
Other factors, such as the force magnitude and the force rise and relaxation rates of 18
different fibres, may also influence motor unit recruitment. Since activation-deactivation rates 19
vary for different motor unit types (Burke et al., 1973; Lee et al., 2011), it is logical that 20
locomotor tasks that have short shortening-lengthening cycles, such as a cat paw-shake, require 21
fast activation-deactivation rates and thus, recruitment of faster motor units (Smith et al., 1980). 22
Roberts and Gabaldon (2008) observed an increased electromechanical delay for force relaxation 23
in turkey ankle muscles during slow walking than during running. Because the delay was not 24
correlated with the muscle’s shortening velocity, they hypothesized that the shorter relaxation 25
times during fast walking reflect the shorter relaxation times of faster muscle fibres. Hodson-26
Tole and Wakeling (2008) reported similar observations during incline walking where rat muscle 27
strain rates were slower during level walking and were associated with the recruitment of slower 28
motor units despite increased total EMG intensity. Preferential recruitment of motor units types 29
was further supported when comparing the EMG frequency content during level running and 30
incline walking where the EMG intensity was similar, but the EMG frequency content was 31
5
significantly lower during incline walking. It is possible that when rapid force production and 1
relaxation are required, recruitment of faster motor units — independent of slow units — is 2
needed. If slower motor units are activated, then faster cycle rates may be hindered. During tasks 3
where sustained force at low to moderate levels is needed, or where rapid force generation and 4
relaxation are not required, orderly motor unit recruitment according to the size principle is more 5
likely to be sufficient to meet the mechanical demands of the muscle. 6
In this paper, we explore whether force rise and relaxation rates, along with fascicle strain 7
rates, are associated with orderly recruitment patterns from slow to faster motor units of the 8
lateral and medial gastrocnemius (LG and MG) muscles of goats during different in vivo 9
locomotor tasks, or whether there are conditions in which faster units are preferentially recruited 10
in a task-specific fashion. In goats and other mammals, the LG and MG muscles are composed 11
of both slow and fast fibres. Goats were selected for this study because they allowed EMG, 12
fascicle length and strain rate, as well as tendon force to be measured directly under in vivo 13
conditions. The purposes of this study were to 1) describe changes in motor unit recruitment 14
patterns due to changes in locomotor dynamics associated with speed, and grade; and 2) examine 15
whether these motor unit recruitment patterns potentially tune or enhance the muscle’s 16
contractile properties for a specific motor task by characterizing the relationships between motor 17
unit activity, fascicle strain rate, and force profiles. Given that the recruitment of faster motor 18
units results in a higher frequency content of the EMG with the same or less intensity, we 19
hypothesized that 1) faster gait speed leads to an increase in the high frequency component of the 20
EMG signal and that 2) for similar EMG intensities, increased surface grade leads to an increase 21
in the low frequency component of the EMG signal compared with fast level locomotion. We 22
also hypothesized that 3) there is a significant association between myoelectric frequency 23
content, force, and force rise and relaxation rates, as well as 4) there is a significant positive 24
correlation between EMG frequency content and muscle fascicle shortening strain rate. These 25
associations are anticipated because increases in muscle force likely depend on the recruitment 26
of faster motor units within a muscle (in addition to slow units), with faster speeds (and higher 27
fascicle strain rates) being linked to faster rates of force rise and relaxation. 28
29
30
31
6
Methods 1
2
Six African pygmy goats (Capra hircus L; 3 males, 3 females; mean ± standard 3
deviation; age: 21.0 ± 15.5 months, body mass: 25.85 ± 6.20 kg) were tested at Harvard 4
University’s Concord Field Station. EMG, fascicle strain, and tendon force data were recorded in 5
vivo during a variety of locomotor tasks, as detailed below. The experimental protocol was 6
conducted over a three-day period, which included surgical implantation of transducers, in vivo 7
testing, and in situ testing (Lee et al., 2011). The results of the in situ experiments have been 8
previously reported (Lee et al., 2011). All surgical and experimental procedures followed 9
IACUC approval. 10
11
Surgical implantation of transducers 12
13
Initially, animals were sedated with a mixed injection of ketamine and xylazine (8mg/kg 14
body mass and 0.05 mg/kg body mass, respectively) into the jugular vein. The animals were 15
then intubated and maintained on a closed system anesthesia machine (Matrix, Orchard Park, 16
NY, USA) at 0.5 – 1.0 % isoflurane. 17
Offset twist-hook bipolar silver-wire electrodes (0.1 mm, California Fine Wire Inc., 18
Grover Beach, USA), with tips bared of 0.5 mm of insulation and an offset of 2 mm, were 19
implanted about 3 mm deep into proximal, mid-belly, and distal regions of the lateral and medial 20
gastrocnemius muscles (Lee et al., 2011). 21
Sonomicrometry crystals (2 mm, Sonometrics Inc., London, Ontario, Canada) were 22
implanted into the mid-belly region of the lateral and medial gastrocnemius muscles in either 23
paired or triad configurations (Lee et al., 2011). For the paired configuration, the crystals were 24
inserted parallel to the fascicles (proximo-superficial to distal-deep ~25 ° pennation angle), 25
which allowed length changes of the fascicles to be estimated. For the triad configuration, an 26
additional crystal was implanted directly below the superficial crystal to measure muscle depth, 27
which also allowed changes in pennation angle to be estimated (these results will be reported 28
elsewhere). The signal output was amplified (Triton 120.2; Triton Technology, San Diego, CA, 29
USA) and monitored on an oscilloscope (2245A; Tektronix, Beaverton, OR, USA). The 30
alignment of the crystals was optimized to maximize the signal-to-noise ratio. 31
7
A lateral incision proximal to the ankle joint was made to expose the underlying tendons. 1
The common tendon sheath was then exposed to separate the gastrocnemius tendon from the 2
superficial digital flexor tendon. Gas-sterilized “E”-shaped stainless-steel buckle transducers, 3
equipped with a metal foil strain gauge (type FLA-1, Tokyo Sokki Kenkyujo) bonded to the 4
central arm (Biewener & Baudinette, 1995), were attached to the Achilles tendon. On several 5
goats, a longer 2 cm incision was made along the distal portion of the Achilles tendon and two 6
separate tendon buckles were attached to the lateral and medial portions of the Achilles tendon, 7
enabling separate recordings of LG and MG force (Lee et al., 2011). 8
Lead wires from all transducers were passed through a subcutaneous tunnel to a 9
connector that was sutured to the skin proximal to the hip. Animals received post-operative 10
analgesia (buprenorphine 0.1 to 0.5 mg/kg, subcutaneously) every 12 hrs during the following 40 11
hr recovery and in vivo recording periods. 12
13
In vivo testing 14
15
Goats were allowed 20-24 hrs for recovery following surgery. The animals had been 16
previously trained to walk, trot, and gallop on a large, motorized treadmill (belt, 2.50 m long and 17
0.75 m wide) on the level and 15 ° incline. The gait speeds ranged from 1.1 – 1.4 ms-1, 1.7 – 2.8 18
ms-1, and 3.3 – 4.9 ms-1 across all goats. For each goat, the same speed was kept for the level and 19
incline conditions. Recordings were therefore collected at typical walking and running speeds 20
such that three trials of at least 15-20 strides each were collected for each condition. Sufficient 21
rest was given to the goats between trials to ensure that they could complete the experiments. 22
Myoelectric signals were amplified (gain of 100-1000) and recorded with minimal filtering 23
(bandpass 30-3000 Hz, notch filtered at 60 Hz, P511 amplifier, Grass, West Warwick, USA). 24
Tendon buckle signals were connected to a bridge amplifier (Vishay 2120, Micro-Measurements, 25
Raleigh, NC). All signals were recorded at 5000 Hz using a 16-channel acquisition device (NI-26
6259, National Instruments, Austin, TX). 27
Tendon buckle transducers were calibrated the following day, after the in situ 28
experiments were completed and the animals euthanized (sodium pentobarbital, 150 mg kg-1). 29
For these calibrations, a cut was made across the distal aponeurosis of the LG and MG to free a 30
portion of the Achilles tendon with the buckles intact. The cut end was clamped and frozen with 31
8
liquid nitrogen. A series of cyclical loads were imposed using a force transducer (model 9203, 1
Kistler, Amherst, MA), and the relationship between buckle voltage and applied force was 2
determined. 3
4
Data Analysis 5
6
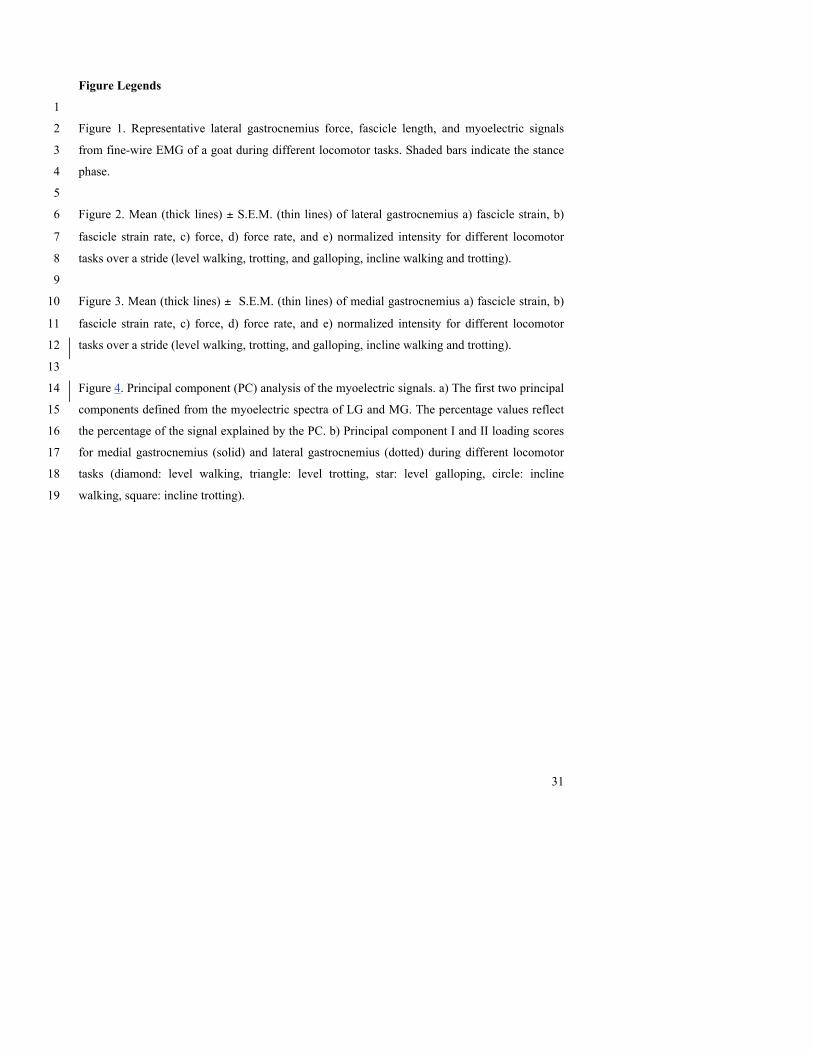
Stride times were determined from the tendon force profiles of each trial. The beginning 7
and end of each stride were defined as 60 ms prior to when the force began to increase (Fig. 1). 8
This ensured that our analysis captured the entire muscle activation profile. 9
10
Analysis of force data 11
12
Tendon forces were filtered using a low-pass third-order Butterworth filter with a cut-off 13
frequency of 115 Hz and notch filter at 60 Hz. The cut-off frequency was chosen to 14
accommodate testing the models against in situ experiments where we had 40 Hz tetanic 15
stimulations (Wakeling et al., 2012). Force rise and relaxation rates were calculated as the first 16
derivative of tendon force with respect to time. Data from each condition were partitioned into 17
20 equal time windows, and mean force and force rates were calculated for each time window 18
(Fig. 1). 19
20
Analysis of sonomicrometric data 21
22
Raw sonomicrometry signals were converted to a distance measurement between the 23
crystals based on the speed of sound through skeletal muscles, adjusted by a +0.82 mm 24
correction due to differences between the speed of sound through the epoxy coating of the 25
crystals and the speed of sound through muscle (Daley and Biewener, 2003). Sonomicrometry 26
signals were first filtered using a low-pass, second-order Butterworth filter with a cut-off 27
frequency of 30 Hz. Filters with different parameters were tested, but these parameters were best 28
in smoothing out noise, while still capturing time-varying features of the signal. A custom-29
written program was used to identify and remove “extraneous” peaks, after which the signals 30
were fit with a 4th order polynomial using a 200-point (40 ms) size window. Extraneous peaks 31
9
would occasionally occur in the signal when one or two values deviated greatly from the signal. 1
Fascicle lengths were converted to strain by subtracting the resting length (distance measured 2
between the crystals during quiet stance) then dividing by the resting length (Gillis et al., 2005). 3
Strain rate was calculated as the first derivative of strain with respect to time. Data from each 4
condition were partitioned into 20 equal time windows and mean strain and strain rate were 5
calculated for each time window (Fig. 1). 6
7
Analysis of EMG data 8
9
EMG signals from the LG and MG were analyzed using wavelet analysis, a time-10
frequency decomposition technique, similar to previously published methods (von Tscharner, 11
2000; Wakeling, 2002; Wakeling and Syme, 2002; Lee et al., 2011). A filter bank of 24 wavelets 12
0 ≤ k ≤ 23 was used to decompose the myoelectric signals into intensities as a function of time 13
and frequency. To exclude low frequency noise, the first four wavelet domains were excluded 14
from further analysis ((≤ 70 Hz) such that the data were analyzed for wavelets 3 to 23, Hodson-15
Tole and Wakeling, 2007). Thus, the frequency band of 70–1857 Hz is presented in this analysis. 16
This ensures that the signals of the slow motor units (central frequencies of ~150 Hz, Lee et al., 17
2011) are included in the analysis and are consistent with the cut-off frequency used in other 18
fine-wire myoelectric studies (Daley and Biewener, 2003; Gabaldon et al., 2004; Gillis and 19
Biewener, 2001 & 2002). As with the force data, myoelectric signals were partitioned into 20 20
equal-time windows and the mean intensity for each wavelet for each time window was 21
calculated. Total intensity of the signal was calculated as the sum of the intensities determined 22
using wavelets 3 ≤ k ≤ 23. 23
We used principal component analysis (PCA) to identify the major features of the 24
intensity spectra (Wakeling, 2004; Hodson-Tole 2008; Lee et al., 2011). We randomly selected 25
30 strides per gait condition for statistical analysis. The spectra were compiled into a p x N 26
matrix A, where p = 20 wavelets and N = 36,000 (6 goats x 2 muscles x 5 gait conditions x 30 27
strides x 20 partitioned time windows). The principal components of the intensity spectra, PCs, 28
defined in terms of eigenvector-eigenvalue pairs, were calculated from the covariance matrix B 29
of the data matrix A without prior subtraction of the mean (Wakeling and Rozitis, 2004). This 30
ensured that the whole signal, and not just its variance, was described. The principal component 31
10
weightings of each PC were given by the eigenvectors ξ of covariance matrix B and the amount 1
of the signal explained by each PC was determined from the eigenvalues. The PC loading scores 2
were calculated from ξ’A, the product of the transpose of the weighting matrix and matrix A. We 3
calculated the angle, θ, as the angle formed between the vector of the first and second principal 4
component, PCI-PCII, loading scores and PCII loading score axis (Wakeling and Rozitis, 2004). 5
This measure describes the contribution of high and low frequency content in the signal. A small 6
θ has a positive contribution of the PCII loading scores and indicates relatively high frequency 7
content. Mean PCI and PCII loading scores were calculated for each of the 20 time windows of 8
the stride, thus allowing changes in their contributions to be quantified throughout each stride for 9
each gait condition. 10
11
Statistical analysis 12
13
Differences in myoelectric intensity, muscle force, force rise and relaxation rates, muscle 14
fascicle strain and strain rate between muscles, activity (walk, trot, and gallop), and grade 15
(incline and level) were determined using general linear model ANOVA. Tukey post hoc tests 16
were conducted if significant differences were identified to locate differences within each factor. 17
A general linear model ANCOVA was conducted to identify significant associations between θ 18
and intensity, θ and muscle fascicle strain rate, and θ and force rise and decline rates, with strain, 19
strain rate, force, force rate, and myoelectric intensity as covariates. Myoelectric intensity was 20
included as a covariate so that associations between θ and strain rate could be detected that were 21
independent from the effect of myoelectric intensity. Muscle fascicle strain was also included as 22
a covariate so that changes in strain would not confound the results (Wakeling et al., 2006), as 23
strain can influence myoelectric frequency content (Doud and Walsh, 1995). Greater strains can 24
be associated with decreased frequency content, so if muscle fascicle strain and θ were 25
significantly positively correlated, no further analysis was conducted. The analyses were 26
conducted for time periods corresponding to concentric contraction, when the strain rate was 27
negative. Separate analyses were done for force-rise and force-relaxation periods so that the 28
association between angle θ and force rise and relaxation rates could be calculated since these 29
rates were positive and negative, respectively. 30
31
11
1
2
Results 3
4
General changes in EMG intensity and frequency content in relation to muscle contractile 5
patterns across differing locomotor tasks 6
7
Across all gait conditions, the LG and MG showed a single shortening cycle during limb 8
support with typically one burst of muscle activity and period of active force production per 9
stride (e.g., Fig. 1). In general, total EMG intensity, force, and force rise and relaxation rates, as 10
well as fascicle strain and strain rate, all tended to increase as speed increased from walking to 11
trotting to galloping. These measures were even higher when animals walked and trotted uphill 12
(Tables 2 to 5, Figs. 2 and 3). 13
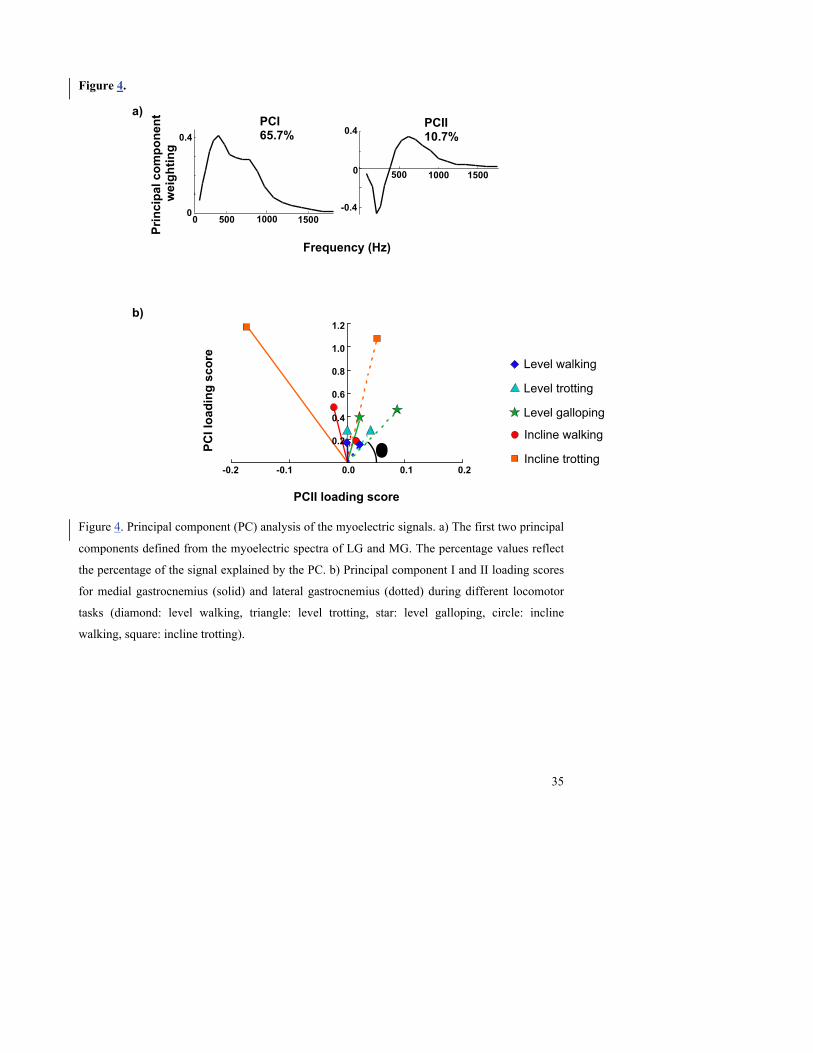
From the PCA, the first two principal components explained about 76% of the 14
myoelectric signal (Fig. 4). The first PC had positive weightings for all frequencies and had a 15
shape that was similar to the mean intensity spectrum (r2 = 0.98). The second PC contained 16
positive and negative weightings with a transition occurring at 387 Hz. In general, θ tended to 17
decrease as speed increased from level walking to trotting to galloping, indicating an increase in 18
the high frequency component of the EMG signal with locomotor speed. By contrast, θ tended 19
to increase as surface grade increased (Tables 2 to 5, Fig. 4), indicating an increase in the low 20
frequency component of the EMG signal with surface grade 21
22
Association between myoelectric frequency content and myoelectric intensity and force 23
24
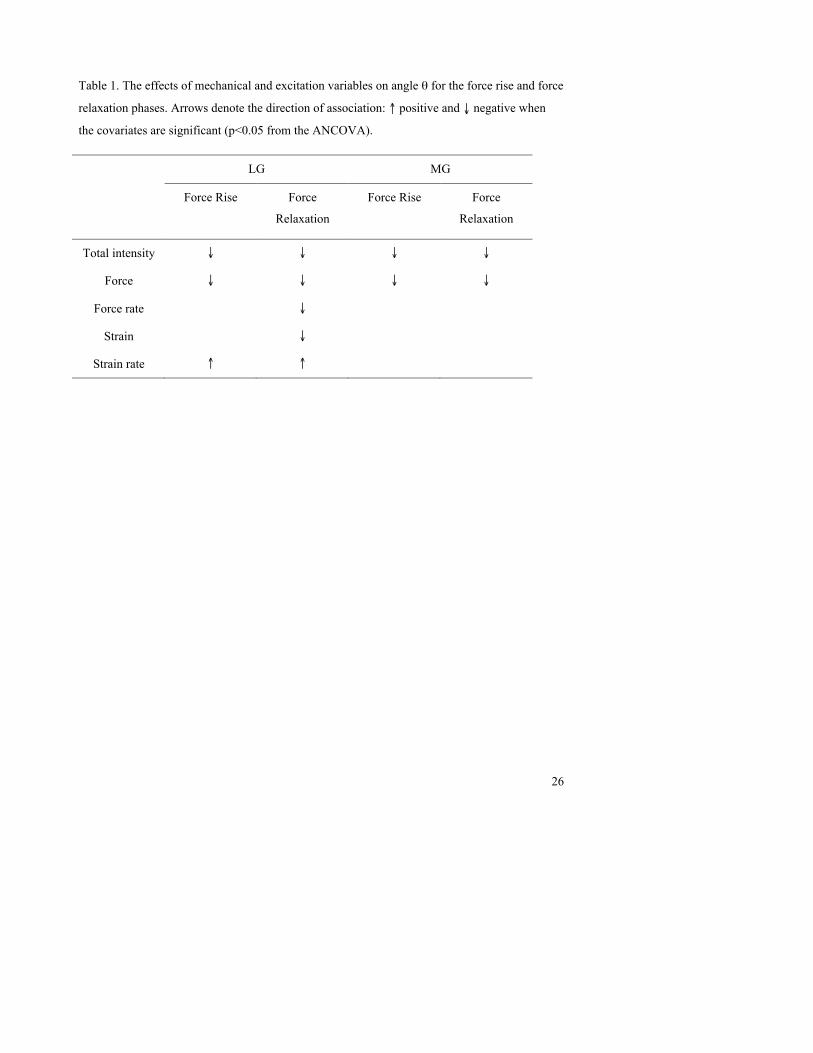
A significant negative association was observed between θ and myoelectric intensity (all 25
p < 0.001) (Table 1), as well as between θ and force (all p < 0.001) for both LG and MG force 26
rise and relaxation rates. Thus, as myoelectric intensity increased, the high frequency component 27
of the EMG signal increased and force increased. 28
29
Association between myoelectric frequency content and force rate 30
31
12
A significant negative association was observed between θ and force rate during LG 1
relaxation (p = 0.031) (Table 1), but not during LG force rise, MG force rise, or MG force 2
relaxation. Thus, except for LG relaxation, these data do not support the hypothesis that 3
myoelectric frequency content is associated with rates of force rise and relaxation. 4
5
Association between myoelectric frequency content and fascicle strain and fascicle strain rate 6
A significant negative association was observed between θ and fascicle strain for LG 7
force relaxation (p < 0.001), but not for LG force rise, MG force rise, or MG force relaxation 8
(Table 1). Consequently, except during LG relaxation, our interpretations of recruitment are not 9
confounded by fascicle strain, as changes in the myoelectric frequency content were not affected 10
by strain. 11
For the LG, a significant positive association was observed between θ and shortening 12
strain rate, during both force rise and force relaxation (p < 0.001, Table 1). Since negative strain 13
rates represent shortening, a positive association between θ and strain rate indicates that higher 14
frequency signals are associated with faster shortening strain rates. This supports our hypothesis 15
that the frequency content of the EMG signal increases with faster shorting strain rates. For the 16
MG, the association between θ and strain rate was not statistically significant (p = 0.198 during 17
rise and p = 0.256 during relaxation). 18
19
Discussion 20
21
Our study was designed to detect associations between myoelectric frequency and 22
myoelectic intensity, force rise and relaxation rates, fascicle strain, and fascicle strain rate, all 23
measured in vivo during different locomotor tasks. Myoelectric frequency properties were 24
characterized by the variable θ, which emerged from the PCA, with higher θ corresponding to 25
lower frequency content (and lower θ corresponding to higher frequency content). In general, 26
the results for goat LG and MG muscles revealed a positive association between θ and 27
shortening strain rate and a negative association between θ and myoelectric intensity, 28
demonstrating that faster motor units associated with higher myoelectric frequency content are 29
correlated with increased fascicle shortening strain rates and increased myoelectric intensity. 30
Although this was the case for level locomotion, shifts in recruitment (increased θ) during incline 31
13
gait were less clear and failed to correlate with reduced fascicle strain rates. Increases in 1
myoelectric intensity, force, force rate, fascicle strain, and fascicle strain rate were also generally 2
observed as exercise demand increased from level walking to trotting to galloping, and from 3
level walking and trotting to incline walking and trotting. 4
5
General changes in total EMG intensity, muscle force and rate, and fascicle strain and rate 6
across different locomotor tasks 7
8
Several of our findings are consistent with previous in vivo experiments. For example, 9
total EMG intensity increased with locomotor speed and surface grade (Tables 2 to 5, Figs. 2 and 10
3to 4), consistent with previous studies of goats (McGuigan et al., 2009), rats (Gillis and 11
Biewener, 2002), turkeys (Gabaldon et al., 2004), and horses (Wicker et al., 2005). This was 12
linked to increases in LG and MG force as goats increased speed from level walking to trotting 13
to galloping, and when they moved from the level to the inclined surface (Tables 2 to 5, Figs. 2 14
and 3). These results are again consistent with data from goats reported by McGuigan et al. 15
(2009) and with data from guinea fowl reported by Daley and Biewener (2003). Our measures of 16
increased fascicle shortening strain and strain rate during incline walking and trotting (Tables 2 17
to 5, Figs. 2 and 3) are also consistent with previous studies. For example, Roberts et al. (2007) 18
reported increased shortening strain and strain rates when turkeys switched from level running to 19
incline running, concluding that muscle fascicle strain was less affected by speed than by slope. 20
Using ultrasound to track human MG fascicles, Lichtwark and Wilson (2006) also reported 21
increased fascicle strain during walking and running as surface grade was increased. These 22
previous studies have shown that the work output of individual muscles may be modulated by 23
changes in force or fascicle shortening, or both. The timing of muscle force relative to fascicle 24
strain also contributes to changes in work output (Daley and Biewener, 2003; Gabaldon et al., 25
2004). Consequently, muscle activation and motor unit recruitment likely play important roles in 26
modulating muscle work across different locomotor tasks (McGuigan et al., 2009). Our current 27
study extends previous research and by demonstrating that the net work performed by muscles 28
may also be modulated by recruiting different motor unit types. 29
30
31
14
1
2
Differences in the EMG frequency spectra across gait conditions and between muscles 3
4
Our results support previous work in which locomotor tasks associated with increasing 5
speed (walking to trotting to galloping) elicit decreasing θ values (Hodson-Tole and Wakeling, 6
2009), indicative of higher myoelectric frequency components at higher locomotor speeds 7
(Tables 2 to 5, Fig. 4). Our results also agree with previous work showing a significant increase 8
in low frequency myoelectric signal component (increasing θ) from level to incline locomotion 9
(Hodson-Tole and Wakeling, 2009) (Tables 2 to 5, Fig. 4). Higher myoelectric frequencies occur 10
when there is an increase in the activation level and proportion of faster fibres recruited, 11
however, this could occur with either recruitment in an orderly pattern of recruitment from slow-12
to-fast fibres, or with preferential recruitment of faster fibres (Wakeling, 2009). Therefore, the 13
observation of a higher myoelectric frequency alone is insufficient to detect differences in 14
recruitment patterns between gaits. In order to make such a distinction, situations are needed that 15
have similar levels of myoelectric intensity (corresponding to similar activation levels), but 16
differing myoelectric frequencies (indicating a shift in recruitment). 17
Our experiment was designed to test for task-specific recruitment by comparing 18
recruitment at high speed (reduced θ, indicative of increased fast motor unit recruitment) versus 19
slower speed inclined gait (increased θ, indicative of increased slow motor unit recruitment) as 20
two conditions with similar overall EMG intensities (and force requirements). However, the 21
comparison between gaits revealed that in general the gaits with greater muscle activation 22
(myoelectric intensity) also resulted in higher myoelectric frequency, and so comparisons 23
between gaits are unable to resolve differences in recruitment patterns (Table 2-5) due to the 24
manner in which myoelectric intensity covaried with frequency. For this reason it was necessary 25
to conduct an analysis of covariance (Table 1, and discussed in the following two sections), in 26
which the intensity effect was accounted for as a covariate, and in which we could test the 27
associations of myoelectric frequency with fascicle strain rates and forces. The EMG intensities 28
for galloping were comparable to those measured during incline walking and/or trotting and in 29
these specific instances we observed significant associations between θ and gait condition 30
consistent with increased slow unit recruitment for slower speed incline gait relative to faster unit 31
15
recruitment at a gallop (Tables 2-5), However, these shifts in motor unit recruitment were 1
inconsistent with measured LG and MG fascicle strain rates (Tables 2-5) with the incline walk 2
and trot resulting in greater fascicle strain rates than those during level walk and trot due to the 3
need for increased muscle shortening and work output while moving up an incline. Nevertheless, 4
shifts in motor recruitment were observed between incline walking and level galloping where 5
strain rates were similar. 6
Although similar shifts in myoelectric frequency content between gait conditions were 7
found for the LG and MG, EMG recordings from the LG yielded smaller values of θ for all gait 8
conditions (Fig. 4), indicating that LG myoelectric signals contained a higher frequency content 9
than MG signals for any given condition. This finding is consistent with previously reported 10
patterns of in situ motor unit recruitment from these muscles (Lee et al., 2011), and is likely 11
caused by the higher proportion of fast fibres within the goat LG (which is supported by 12
unpublished immunohistochemistry observations, Carr, Miara, Lee, Wakeling and Biewener). 13
This finding also likely explains the larger total EMG intensity and faster fascicle strain rate of 14
the LG compared with the MG during level galloping, when faster shortening is required. In 15
addition, this difference in θ and the supporting evidence that MG contains a higher proportion 16
of slow fibres may explain why myoelectric intensity was higher for MG during incline walking 17
and trotting, for which recruitment of slower motor units was dominant. McGuigan et al. (2009) 18
also reported higher myoelectric intensity in the MG during incline walking and trotting versus 19
higher intensity in the LG during level walking and trotting in goats. 20
Principal component analysis of motor unit recruitment temporal profiles allowed us to 21
test our proposed hypotheses regarding motor unit recruitment across different locomotor tasks. 22
PCI loading scores correlated closely to the total myoelectric intensity (r2=0.98) and so can be 23
used as a measure of muscle excitation. Negative and positive PCII loading scores indicate 24
greater low and high frequency components, respectively, corresponding to activation of faster 25
and slower motor units, respectively (Fig. 4). The angle θ between the vector of the PCI-PCII 26
loading score and PCII loading score axis (Fig. 4) can therefore be used to indicate the relative 27
frequency component of the myoelectric signal which corresponds to the different motor unit 28
type recruitment (Wakeling and Rozitis, 2004, Lee et al., 2011). Our in situ results from a 29
previous study of the same goats, where we stimulated the tibial nerve to illicit single twitches 30
recruiting either slow motor units or fast motor units or both, validates this method of EMG 31
16
analysis to signify frequency content and the corresponding motor unit recruitment (Lee et al., 1
2011). A higher θ value is interpreted as having a relatively greater low frequency signal content 2
associated with slower motor unit recruitment. Conversely, a smaller θ value is interpreted as 3
having a relatively higher frequency signal content associated with faster motor unit recruitment. 4
Preferential recruitment, where faster motor units are recruited in the absence of or decreased 5
slow motor unit activation, can only be distinguished from orderly recruitment if the level of 6
muscle excitation and thus PCI loading score is the same, but there is a different θ. Hence, PCI 7
(or total intensity) was included as a covariate in the ANCOVA, allowing θ to be characterized 8
independent of intensity. 9
When evaluating myoelectric signals, it is important to consider fatigue, which can affect 10
the frequency content. Past studies have most commonly investigated the effect of fatigue until 11
exhaustion (e.g. Naeije and Zorn, 1982). However, this was not done in our study. Instead, we 12
adopted an experimental design that involved five short recording intervals of approximately 20 13
seconds each for trot and gallop to avoid fatiguing the animal. In addition, the order of 14
presenting incline versus level and speed of locomotion was varied among animals to minimize 15
any bias that fatigue may have had on these factors. Therefore, we believe our results are not 16
affected by fatigue. 17
One challenge in determining associations between myoelectric frequency content and 18
strain rate relative to force rate is examining appropriate locomotor tasks. In this study, the 19
incline locomotor tasks elicited an increase in θ (slower frequency content), but also a 20
simultaneous increase in strain rates. An activity like jumping is also not an ideal locomotor task 21
because the total myoelectric intensity increases, in addition to strain rate and force. Thus, it is 22
difficult to uncouple force, strain rate, and myoelectric intensity during most locomotor tasks. 23
Identifying a locomotor task that requires rapid, but small muscle forces would be ideal, and this 24
challenge has been acknowledged in previous studies (Smith et al., 1980; Hodson-Tole and 25
Wakeling, 2008, Wakeling et al., 2006). 26
27
Association between myoelectric frequency and force rise and relaxation rates 28
29
For single twitch contractions, both the contraction time, the time from an action 30
potential to peak force (Burke et al., 1973), and the activation-deactivation rates (Lee et al., 31
17
2011) differ between slow and fast motor units, and these properties affect the mechanical output 1
of a muscle. Roberts and Gabaldon (2008) examined the relaxation electromechanical delay of 2
the turkey LG (from the end of EMG to the end of force and found that this delay varied 3
inversely with locomotor speed). However, they found no association with fascicle velocity, and 4
therefore suggested that changes in the muscle fibre recruitment pattern might explain the 5
association between the observed electromechanical relaxation delay and locomotor speed. 6
Preferential recruitment of faster motor units — with reduced recruitment of slower motor units 7
— could explain why slow activation-deactivation rates and slow strain rates may not dominate 8
at all speeds. Muscles need to generate force and relax at rates that are appropriate for the speed 9
of the movement to be most effective. Since faster motor units have faster activation and 10
relaxation rates (Burke et al., 1973), it seems likely that the rate of muscle force development or 11
relaxation could be an influential factor related to motor unit recruitment. To our knowledge, our 12
study is the first to test this hypothesis. However, our results for the goat LG and MG provide 13
little evidence to support this hypothesis. However, we observed a negative association between 14
θ and LG force relaxation rate, suggesting that lower frequency content is associated with fast 15
relaxation rates for this one muscle during relaxation, in contrast to what we predicted. 16
However, increased force rise and relaxation rates may simply be a reflection of the 17
increased force due to an increase in the number of motor units recruited and not due to 18
recruitment of different motor unit types. Thus, we tested force rise and relaxation rates 19
calculated from forces normalized to peak forces, but also did not find a significant association 20
between the force rise and relaxation rates and angle θ. 21
22
Association between myoelectric frequency and strain rate 23
24
A major finding of our study was a shift from lower to higher EMG frequencies during 25
faster muscle strain rates during LG shortening during locomotion on a level surface. Using 26
wavelets and PCA, and accounting for EMG intensity, we determined that this shift was not of 27
the mean frequency; rather, this shift was due to a decrease in low frequency components and an 28
increase in high frequency components of the spectra. A significant positive association between 29
fascicle strain rate and θ was found for LG shortening during force rise and relaxation periods. 30
As LG shortening rates increased for faster gaits (Figs. 2 and 3), θ decreased indicating that there 31
18
were greater high frequency components. However, because this association was not observed 1
in the MG muscle during shortening, we conducted further analysis to assess the association 2
between θ and strain rate. Muscle fascicle strain was included as a covariate so that changes in 3
strain would not confound the results (Wakeling et al., 2006), as strain can influence myoelectric 4
frequency content (Doud and Walsh, 1995). Greater strains can be associated with decreased 5
frequency content, ANCOVA was only conducted if muscle fascicle strain and θ were 6
significantly negatively correlated. Given that θ decreased while strain increased from level to 7
incline walking and trotting, and the possibility of strain being a confounding factor, we repeated 8
the PCA and ANCOVA for only the level gait conditions. This yielded a positive association 9
between θ and strain rate during MG force development, similar to the results obtained for LG, 10
suggesting that preferential recruitment of faster motor units may allow for faster MG strain rates 11
as needed, when gait velocity increases on a level surface. Our results are supported by similar 12
findings in the MG, soleus, and plantaris muscles in rats (Hodson-Tole and Wakeling, 2008) and 13
in the MG muscles in humans (Wakeling et al., 2006) where increases in gait velocity (rats) and 14
cycling frequency (humans) and increased strain rates were associated with shifts to high 15
frequencies in the EMG signal. One advantage of preferentially recruiting faster motor units 16
during rapid movements is that maximum mechanical power and maximum mechanical 17
efficiency occur at higher strain rates in faster motor units (He et al., 2000). A positive 18
association between recruitment of faster motor units and fascicle shortening rate may therefore 19
be driven by the necessity of generating high mechanical power at high efficiency. Preferential 20
recruitment of faster motor units at faster gait speeds would also favor rates of muscle shortening 21
better suited to necessary increases in limb segment velocity. 22
23
Conclusions 24
25
Our results for the goat LG and MG support previous observations in other animals and 26
man that different motor units may be recruited in a pattern that is task-specific during 27
locomotion. In particular, our analyses of myoelectric patterns related to in vivo muscle fascicle 28
strain and force showed that there are times where preferential recruitment of faster fibres is 29
related to faster shortening strain rates of the muscle fascicles. The shift to higher myoelectric 30
frequencies is due to a decrease in low frequency components and an increase in high frequency 31

19
components of the spectra, providing evidence that a greater number of fast motor units are 1
recruited while fewer slow motor units are recruited. These results support other evidence 2
suggesting motor units form task groups that are selectively recruited for rapid tasks (Hodson-3
Tole and Wakeling, 2008, Wakeling, 2004; Wakeling et al., 2001; Loeb, 1985) and has 4
implications for muscle modeling where independent slow and fast contractile elements can be 5
incorporated into novel, more complex muscle models (Wakeling et al., 2012). To our 6
knowledge, this is only the third report that has identified and quantified the influence of 7
myoelectric intensity, strain rate, and force on motor unit recruitment and investigated if there is 8
a mechanical basis for preferential recruitment of different motor unit types. Further work is 9
therefore needed to determine if an association between preferential motor unit recruitment and 10
strain rate exists across species and whether other biomechanical factors drive motor unit 11
recruitment strategies. 12
13
Acknowledgements 14
We thank Pedro Ramirez for animal care and assistance during training, and Drs. Jennifer Carr 15
and Carlos Moreno for assistance during data collection. 16
17
Funding 18
This work was supported by the National Institutes of Health [R01AR055648]. 19
20
20
References
Biewener, A.A. (1998). Muscle-tendon stresses and elastic energy storage during locomotion in
the horse. Comp. Biochem. Physiol. B 120, 73-87.
Biewener, A. A. and Baudinette, R. (1995). In vivo muscle force and elastic energy storage
during steady-speed hopping of tammar wallabies (Macropus eugenii). J. Exp. Biol. 198, 1829-
41.
Biewener, A.A., Konieczynski, D.D., and Baudinette, R.V. (1998). In vivo muscle force-length
behavior during steady-speed hopping in tammar wallabies. J. Exp. Biol. 201, 1681-1694.
Biewener, A.A., McGowan, C., Card, G.M., and Baudinette, R.V. (2004). Dynamics of leg
muscle function in tammar wallabies (M. eugeni) during level versus incline hopping. J. Exp.
Biol.B. 207, 211-223.
Buchtal, F., Guld, C. and Rosenfalk, P. (1955). Innervation zone and propagation velocity in
human muscles. Acta Physiol. Scand. 35, 174-190.
Burke, R.E., Levine, D.N., Tsairis, P., and Zajac, F.E. (1973). Physiological types and
histochemical profiles in motor units of the cat gastrocnemius. J. Physiol. 234, 723-748.
Citterio, G and Agostoni, E. (1984). Selective activation of quadriceps muscle fibers according
to bicycling rate. Journal of Applied Physiology, 57, 371-379.
Daley, M.A. and Biewener, A.A. (2003). Muscle force-length dynamics during level versus
incline locomotion: a comparison of in vivo performance of two guinea fowl ankle extensors. J.
Exp. Biol. 206, 2941-2958.
Doud, J.R. and Walsh, J.M. (1995). Muscle fatigue and muscle length interaction: effect on the
EMG frequency components. Electromyography Clinical Neruophysiology. 35, 331-339.
21
Fedde, M.R., DeWet, P.D., and Kitchell, R.L. (1969). Motor unit recruitment pattern and tonic
activity in respiratory muscles of Gallus domesticus. J. Neurophysiol. 35, 331-339.
Freund H.J., Büdingen, H.J., and Dietz V. (1975). Activity of single motor units from human
forearm muscles during voluntary isometric contractions. J Neurophysiology 38(4), 933-46.
Fukunaga, T., Ichinose, Y., Ito, M., Kawakami, Y. and Fukashiro, S. (1997). Determination
of fascicle length and pennation in a contracting human muscle in vivo. J. Appl. Physiol, 82,
3540358.
Gabaldon, A.M., Nelson, F.E. and Roberts, T.J. (2004). Mechanical function of two ankle
extensors in wild turkeys: shifts form energy production to energy absorption during incline
versus decline running. J. Exp. Biol. 207, 2277-2288.
Gerdle, B., Karlsson, S., Crenshaw, A.G., Elert, J. and Friden, J. (2000). The influences of
muscle fibre proportions and areas upon EMG during maximal dynamic knee extensions. Eur. J.
Appl. Physiol. 81, 2-10.
Gillespie, C.A., Simpson, D.R., and Edgerton, V.R. (1974). Motor unit recruitment as reflected
by muscle fibre glycogen loss in a prosimian (bushbaby) after running and jumping. Journal of
Neurology, Neurosurgery & Psychiatry 37, 817-824.
Gillis, G.B. and Biewener, A.A. (2001). Hindlimb muscle function in relation to speed and gait:
in vivo patterns of strain and activation in a hip and knee extensor of the rat (Rattus norvegicus).
J. Exp. Biol. 204, 2717-2731.
Gillis, G.B. and Biewener, A.A. (2002). Effects of surface grade on proximal hindlimb muscle
strain and activation during rat locomotion. J. Appl. Physiol., 93, 1731-1743.
22
Grimby L, Hannerz J, and Hedman B. (1981). The fatigue and voluntary discharge properties
of single motor units in man. J Physiol. 316(1), 545-554.
He, Z.H, Bottinelli R., Pellegrino, MA, Ferenczi, MA, and Reggiani, C. (2000). ATP
consumption and efficiency of human single muscle fibres with differenct myosin isoform
composition. Biophys. J. 79. 945-961.
Henneman, E., Somjen, G. and Carpenter, D.O. (1965). Excitability and inhibitability of
motoneurons of different sizes. J. Neurophysiol. 28, 599-620.
Henneman, E., Somjen, G. and Carpenter, D.O. (1965b). Functional significance of cell size
in spinal motoneurons. J. Neurophysiol. 28, 560-580.
Henneman E and Olson CB. (1965c). Relations Between Structure and Function in the Design
of Skeletal Muscles. J Neurophysiology 28, 581-98.
Henneman, E., Clamann, H.P., Gillies, J.D. and Skinner, R.D. (1974). Rank order of
motorneurons withn a pool: law of combination. J. Neurophysiol. 37, 1338-1349.
Higham, T., Biewener, A.A. and Wakeling, J.M. (2008). Functional diversification within and
between muscle synergists during locomotion. Biology Letters 4, 41-44.
Hodson-Tole, E.F. and Wakeling, J.M. (2007). Variations in motor unit recruitment patterns
occur within and between muscles in the running rat (Rattus norvegicus). Journal Experimental
Biology. 210, 2333-45.
Hodson-Tole, E.F. and Wakeling, J.M. (2008). Motor unit recruitment patterns 2: the influence
of myoelectric intensity and muscle fascicle strain rate. Journal Experimental Biology 211, 1893-
902.
Hodson-Tole, E.F. and Wakeling, J.M. (2010). The influence of strain and activation on the
locomotor function of rat ankle extensor muscles. Journal Experimental Biology 213, 318-30.
23
Ker, R.F., and Bennett, M.B., Bibby, S.R., Kester, R.C., and Alexander, R.M. (1987). The
spring in the arch of the human foot. Nature 325, 147-149.
Kupa, E.J., Roy, S.H., Kandarian, S.C. and de Luca, C.J. (1995). Effects of muscle fibre type
and size on EMG median frequency and conduction velocity. J. Appl. Physiol. 79, 23-32.
Lee, S.S.M., de Boef Miara, M., Arnold, A.S., Biewener, A.A. and Wakeling J.M. (2011).
EMG analysis for determining the timing and level of activation in different motor units. J.
Electromyography and Kinesioloy 21, 557-565.
Lichtwark, G.A. and Wilson, A.M. (2006). Interaction between the human gastrocnemius
muscle and the Achilles tendon during incline, level, and decline locomotion. J. Exp. Biol. 209,
4379-4388.
Lichtwark, G.A., Bougoulias, K., and Wilson, A.M. (2007). Muscle fascicle and series elastic
element length changes along the length of the human gastroncemius during walking and
running. J. Biomechanics. 40, 157-164.
Lindstrom, L.H. and Magnusson, R.I. (1977). Interpretation of myoelectric power spectra: a
model and its applications. Proceedings of the IEEE, 65(5), 653-662.
Luff, A.R. and Atwood, H.L. (1972). Membrane properties and contraction of single muscle
fiber in the mouse. Am. J. Physiol. 222, 1435-1440.
McGowan, C.P., Baudinette, R.V. and Biewener, A.A. (2007). Modulation of proximal
muscle function during level versus incline hopping in tammar wallabies (Macropus eugenii). J.
Exp. Biol. 210, 1255-1265.
McGuigan, M.P., Yoo, E., Lee, D.V., and Biewener, A.A. (2009). Dynamics of goat distal
hind-limb muscle-tendon function in response to locomotor grade. J. Exp. Biol. 212, 2092-2104.
24
Minetti, A.E., Ardigo, L.P. and Saibene, F. (1994). Mechanical determinants of the minimum
energy cost of gradient running in humans. J. Exp. Biol., 195, 211-225.
Naeije, M. and Zorn, H. (1982). Relation between EMG power spectrum shifts and muscle
fibre action potential conduction velocity changes during local muscular fatigue in man.
European Journal of Applied Physiology, 50, 23-33.
Nardone, A., Romano, C., and Schieppati, M. (1989). Selective recruitment of high-threshold
human motor units during voluntary isotonic lengthening of active muscles. J Physiol. 409, 451-
471.
Reaz, M.B.I., Hussain, M.S., and Mohd-Yasin F. (2006). Techniques of EMG signal analysis:
detection, processing, classification, and applications. Biol Proceedings Online, 8, 11-35.
Roberts, T.J., Marsh, R.L., Weyand, P.G., and Taylor, C. R. (1997). Muscular force in
running turkeys: the economy of minimizing work. Science 275, 1113-1115.
Roberts, T.J., Higginson, B.K., Nelson, F.E., and Gabaldon, A.M. (2007). Muscle strain is
modulated more with running slope than speed in wild turkey knee and hip extensors. Journal of
Experimental Biology, 210, 2510-2517.
Roberts, T.J. and Gabaldon, A. (2008). Interpreting muscle function from EMG-lessons
learned from direct measurements of muscle force. Integrative and Comparative Biology, 48,
312-320.
Rome, L.C., Funke, R.P., Alexander, R.M., Lutz, G., Aldridge, H., Scott, F., and Freadman,
M. (1988). Why animals have different muscle fibre types. Letters to Nature 335, 824-827.
Sadoyama, T., Masuda, T., Miyata, H. and Katsuta, S. (1988). Fibre conduction velocity and
fibre composition in human vastus lateralis. Eur. J. Appl. Physiol. Occup. Physiol. 57, 767-771.
25
Smith, J.L., Betts, B., Edgerton, V.R. and Zernicke, R.F. (1980). Rapid ankle extension
during paw shakes: selective recruitment of fast ankle extensors. J. Neurophysiology 43, 612-
620.
Sokoloff, A.J. and Cope, T.C. (1996). Recruitment of triceps surae motor units in the
decerebrate cat. II. Heterogeneity among soleus motor units. J Neurophysiol. 75, 2005-2016.
Von Tscharner, V. (2000). Intensity analysis in time-frequency space of surface myoelectric
signals by wavelets of specified resolution. Journal Electromyography and Kinesiology 10, 433-
445.
Wakeling, J.M., Kaya, M., Temple, G.K., Johnston, and W., Herzog, W. (2002).
Determining patterns of motor recruitment during locomotion. J Exp Biol. 205, 359-369.
Wakeling, J.M. (2004). Motor units are recruited in a task dependent fashion during locomotion.
J. Exp. Biol. 207, 3883-3890.
Wakeling, J.M. and Rozitis, A. I. (2004). Spectral properties of myoelectric signals from
different motor units distinguished during ramped contractions of the leg extensors. J. Exp. Biol.
207, 2519-2528.
Wakeling, J.M., Uehil, K, Rozitis, A.I. (2006). Muscle fibre recruitment can responds to the
mechanics of the muscle contraction. J. R. Soc. Interface 3, 533-544.
Wakeling, J.M., Lee, S.S.M., de Boef Miara, M., Arnold, A.S., and Biewener, A.A. (2012). A
Muscle’s force depends on the recruitment patterns of its fibers. Annals of Biomedical
Engineering DOI 10.1007/s10439-012-0531-6.
26
Table 1. The effects of mechanical and excitation variables on angle θ for the force rise and force
relaxation phases. Arrows denote the direction of association: ↑ positive and ↓ negative when
the covariates are significant (p<0.05 from the ANCOVA).
LG MG
Force Rise Force
Relaxation
Force Rise Force
Relaxation
Total intensity ↓ ↓ ↓ ↓
Force ↓ ↓ ↓ ↓
Force rate ↓
Strain ↓
Strain rate ↑ ↑
27
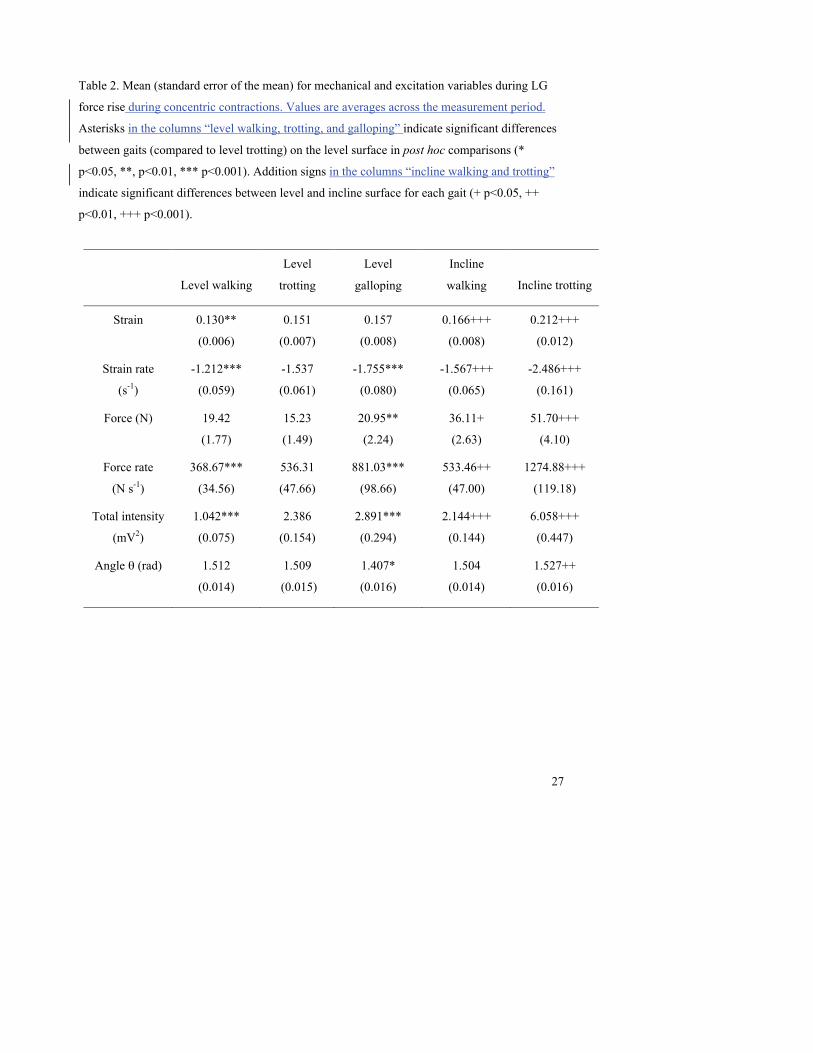
Table 2. Mean (standard error of the mean) for mechanical and excitation variables during LG
force rise during concentric contractions. Values are averages across the measurement period.
Asterisks in the columns “level walking, trotting, and galloping” indicate significant differences
between gaits (compared to level trotting) on the level surface in post hoc comparisons (*
p<0.05, **, p<0.01, *** p<0.001). Addition signs in the columns “incline walking and trotting”
indicate significant differences between level and incline surface for each gait (+ p<0.05, ++
p<0.01, +++ p<0.001).
Level walking
Level
trotting
Level
galloping
Incline
walking Incline trotting
Strain 0.130**
(0.006)
0.151
(0.007)
0.157
(0.008)
0.166+++
(0.008)
0.212+++
(0.012)
Strain rate
(s-1)
-1.212***
(0.059)
-1.537
(0.061)
-1.755***
(0.080)
-1.567+++
(0.065)
-2.486+++
(0.161)
Force (N) 19.42
(1.77)
15.23
(1.49)
20.95**
(2.24)
36.11+
(2.63)
51.70+++
(4.10)
Force rate
(N s-1)
368.67***
(34.56)
536.31
(47.66)
881.03***
(98.66)
533.46++
(47.00)
1274.88+++
(119.18)
Total intensity
(mV2)
1.042***
(0.075)
2.386
(0.154)
2.891***
(0.294)
2.144+++
(0.144)
6.058+++
(0.447)
Angle θ (rad) 1.512
(0.014)
1.509
(0.015)
1.407*
(0.016)
1.504
(0.014)
1.527++
(0.016)
28
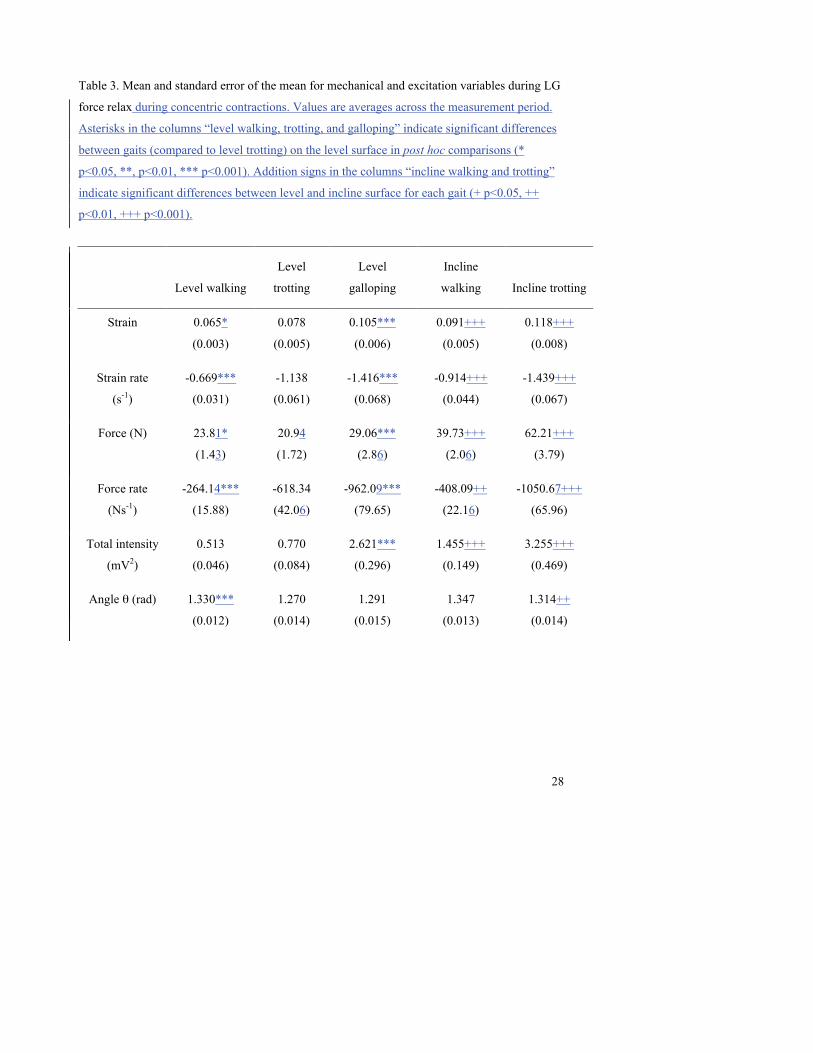
Table 3. Mean and standard error of the mean for mechanical and excitation variables during LG
force relax during concentric contractions. Values are averages across the measurement period.
Asterisks in the columns “level walking, trotting, and galloping” indicate significant differences
between gaits (compared to level trotting) on the level surface in post hoc comparisons (*
p<0.05, **, p<0.01, *** p<0.001). Addition signs in the columns “incline walking and trotting”
indicate significant differences between level and incline surface for each gait (+ p<0.05, ++
p<0.01, +++ p<0.001).
Level walking
Level
trotting
Level
galloping
Incline
walking Incline trotting
Strain 0.065*
(0.003)
0.078
(0.005)
0.105***
(0.006)
0.091+++
(0.005)
0.118+++
(0.008)
Strain rate
(s-1)
-0.669***
(0.031)
-1.138
(0.061)
-1.416***
(0.068)
-0.914+++
(0.044)
-1.439+++
(0.067)
Force (N) 23.81*
(1.43)
20.94
(1.72)
29.06***
(2.86)
39.73+++
(2.06)
62.21+++
(3.79)
Force rate
(Ns-1)
-264.14***
(15.88)
-618.34
(42.06)
-962.09***
(79.65)
-408.09++
(22.16)
-1050.67+++
(65.96)
Total intensity
(mV2)
0.513
(0.046)
0.770
(0.084)
2.621***
(0.296)
1.455+++
(0.149)
3.255+++
(0.469)
Angle θ (rad) 1.330***
(0.012)
1.270
(0.014)
1.291
(0.015)
1.347
(0.013)
1.314++
(0.014)
29
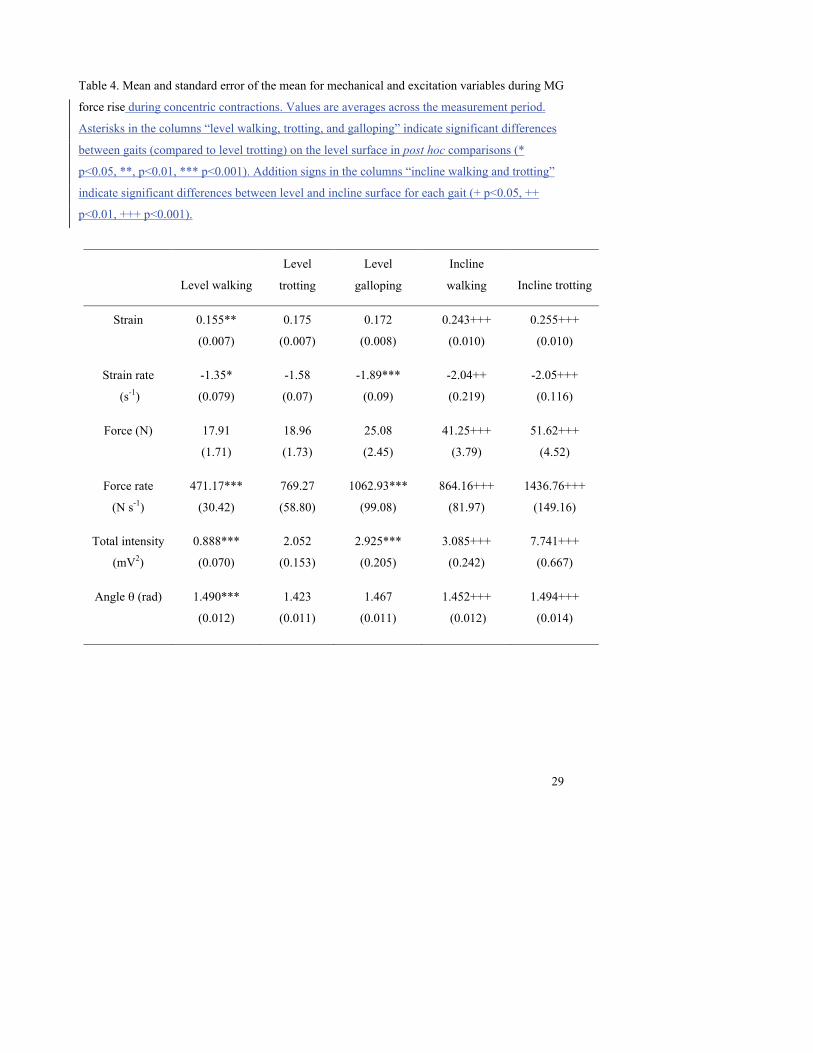
Table 4. Mean and standard error of the mean for mechanical and excitation variables during MG
force rise during concentric contractions. Values are averages across the measurement period.
Asterisks in the columns “level walking, trotting, and galloping” indicate significant differences
between gaits (compared to level trotting) on the level surface in post hoc comparisons (*
p<0.05, **, p<0.01, *** p<0.001). Addition signs in the columns “incline walking and trotting”
indicate significant differences between level and incline surface for each gait (+ p<0.05, ++
p<0.01, +++ p<0.001).
Level walking
Level
trotting
Level
galloping
Incline
walking Incline trotting
Strain 0.155**
(0.007)
0.175
(0.007)
0.172
(0.008)
0.243+++
(0.010)
0.255+++
(0.010)
Strain rate
(s-1)
-1.35*
(0.079)
-1.58
(0.07)
-1.89***
(0.09)
-2.04++
(0.219)
-2.05+++
(0.116)
Force (N) 17.91
(1.71)
18.96
(1.73)
25.08
(2.45)
41.25+++
(3.79)
51.62+++
(4.52)
Force rate
(N s-1)
471.17***
(30.42)
769.27
(58.80)
1062.93***
(99.08)
864.16+++
(81.97)
1436.76+++
(149.16)
Total intensity
(mV2)
0.888***
(0.070)
2.052
(0.153)
2.925***
(0.205)
3.085+++
(0.242)
7.741+++
(0.667)
Angle θ (rad) 1.490***
(0.012)
1.423
(0.011)
1.467
(0.011)
1.452+++
(0.012)
1.494+++
(0.014)
30
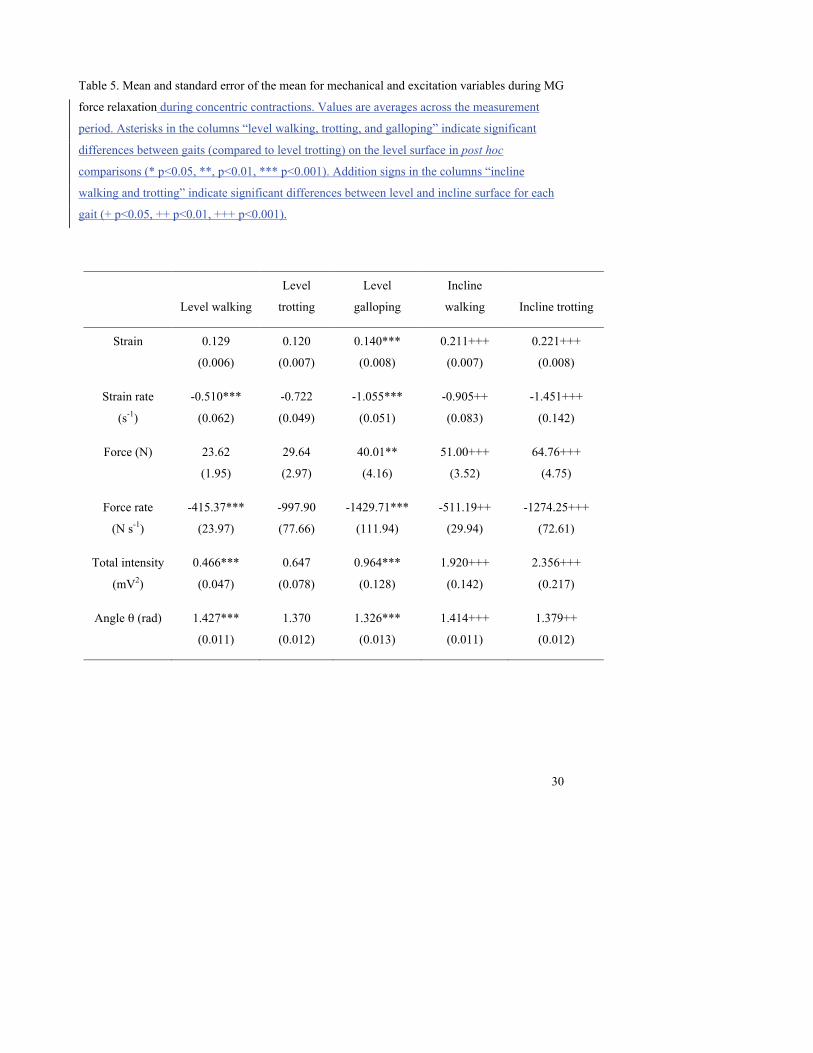
Table 5. Mean and standard error of the mean for mechanical and excitation variables during MG
force relaxation during concentric contractions. Values are averages across the measurement
period. Asterisks in the columns “level walking, trotting, and galloping” indicate significant
differences between gaits (compared to level trotting) on the level surface in post hoc
comparisons (* p<0.05, **, p<0.01, *** p<0.001). Addition signs in the columns “incline
walking and trotting” indicate significant differences between level and incline surface for each
gait (+ p<0.05, ++ p<0.01, +++ p<0.001).
Level walking
Level
trotting
Level
galloping
Incline
walking Incline trotting
Strain 0.129
(0.006)
0.120
(0.007)
0.140***
(0.008)
0.211+++
(0.007)
0.221+++
(0.008)
Strain rate
(s-1)
-0.510***
(0.062)
-0.722
(0.049)
-1.055***
(0.051)
-0.905++
(0.083)
-1.451+++
(0.142)
Force (N) 23.62
(1.95)
29.64
(2.97)
40.01**
(4.16)
51.00+++
(3.52)
64.76+++
(4.75)
Force rate
(N s-1)
-415.37***
(23.97)
-997.90
(77.66)
-1429.71***
(111.94)
-511.19++
(29.94)
-1274.25+++
(72.61)
Total intensity
(mV2)
0.466***
(0.047)
0.647
(0.078)
0.964***
(0.128)
1.920+++
(0.142)
2.356+++
(0.217)
Angle θ (rad) 1.427***
(0.011)
1.370
(0.012)
1.326***
(0.013)
1.414+++
(0.011)
1.379++
(0.012)
31
Figure Legends
1
Figure 1. Representative lateral gastrocnemius force, fascicle length, and myoelectric signals 2
from fine-wire EMG of a goat during different locomotor tasks. Shaded bars indicate the stance 3
phase. 4
5
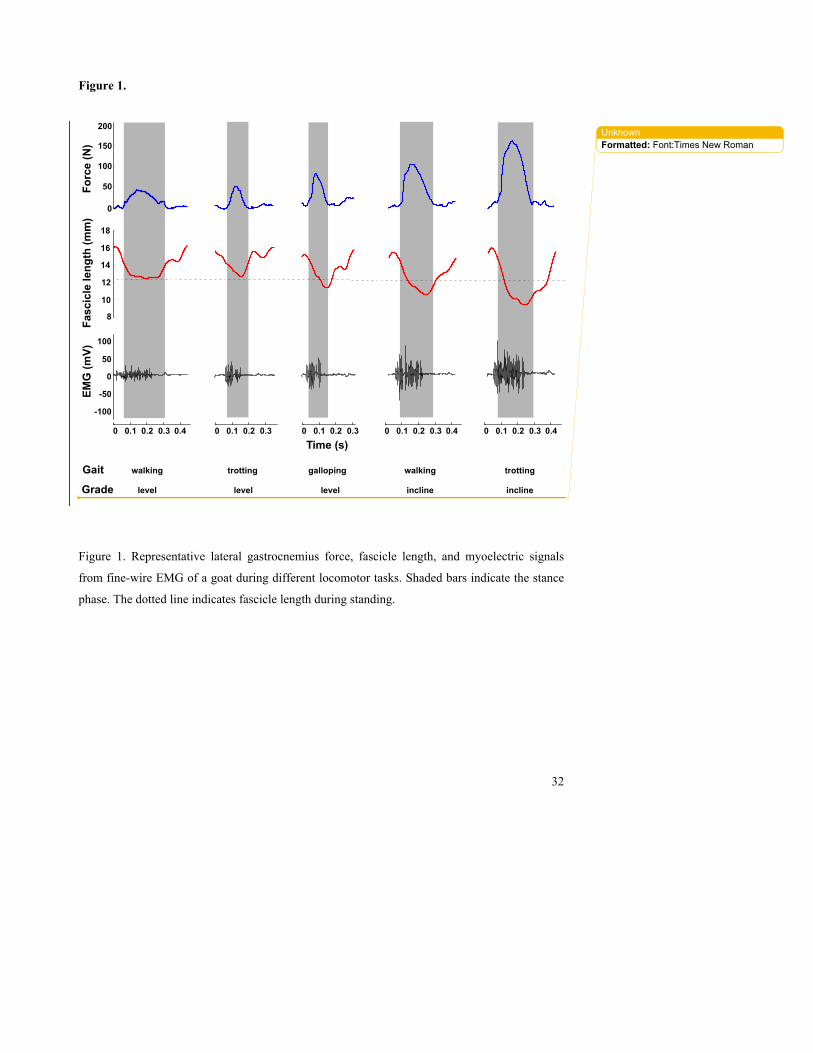
Figure 2. Mean (thick lines) ± S.E.M. (thin lines) of lateral gastrocnemius a) fascicle strain, b) 6
fascicle strain rate, c) force, d) force rate, and e) normalized intensity for different locomotor 7
tasks over a stride (level walking, trotting, and galloping, incline walking and trotting). 8
9
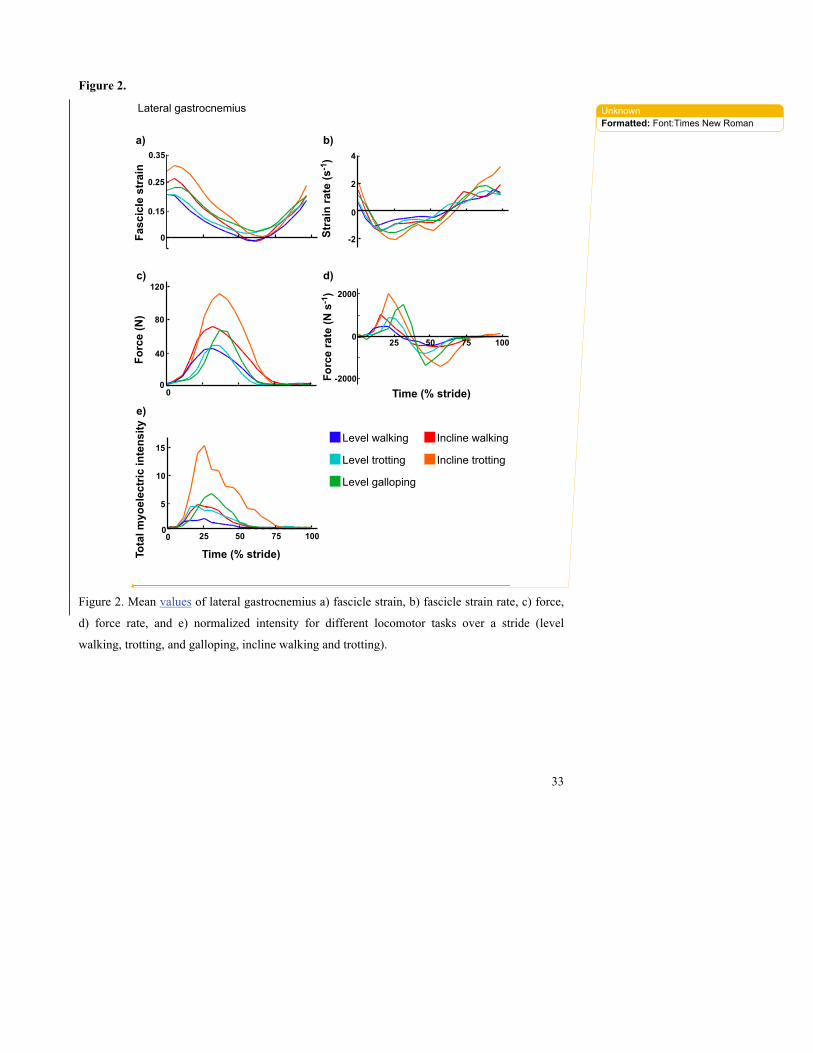
Figure 3. Mean (thick lines) ± S.E.M. (thin lines) of medial gastrocnemius a) fascicle strain, b) 10
fascicle strain rate, c) force, d) force rate, and e) normalized intensity for different locomotor 11
tasks over a stride (level walking, trotting, and galloping, incline walking and trotting). 12
13
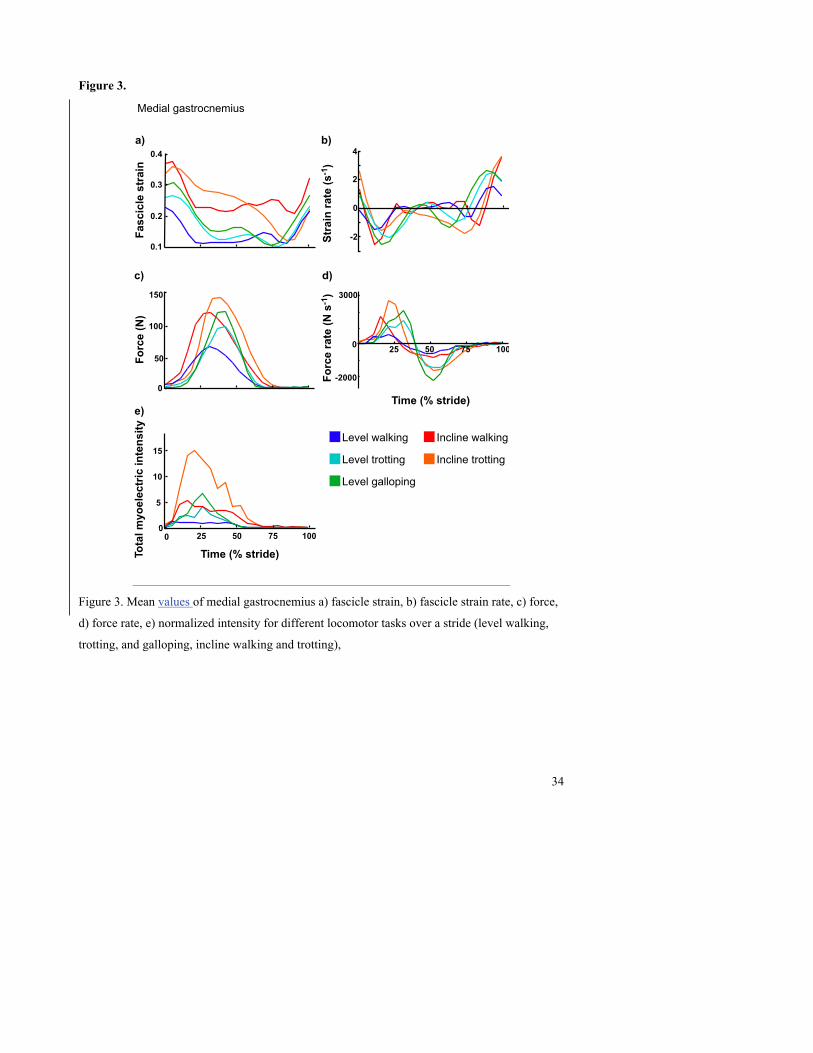
Figure 4. Principal component (PC) analysis of the myoelectric signals. a) The first two principal 14
components defined from the myoelectric spectra of LG and MG. The percentage values reflect 15
the percentage of the signal explained by the PC. b) Principal component I and II loading scores 16
for medial gastrocnemius (solid) and lateral gastrocnemius (dotted) during different locomotor 17
tasks (diamond: level walking, triangle: level trotting, star: level galloping, circle: incline 18
walking, square: incline trotting). 19
32
Figure 1.
Figure 1. Representative lateral gastrocnemius force, fascicle length, and myoelectric signals
from fine-wire EMG of a goat during different locomotor tasks. Shaded bars indicate the stance
phase. The dotted line indicates fascicle length during standing.
50
100
150
200
0
10
12
14
16
18
8
-100
-50
50
100
0
walking
0 0.1 0.2 0.3 0.4
level
trotting
0 0.1 0.2 0.3
level
0 0.1 0.2 0.3 0.4
walking
incline
0 0.1 0.2 0.3 0.4
trotting
incline
galloping
0 0.1 0.2 0.3
level
Time (s)
Force(N)
Fasciclelength(mm)
EMG(mV)
Gait
Grade
UnknownFormatted: Font:Times New Roman
33
Figure 2.
Figure 2. Mean values of lateral gastrocnemius a) fascicle strain, b) fascicle strain rate, c) force,
d) force rate, and e) normalized intensity for different locomotor tasks over a stride (level
walking, trotting, and galloping, incline walking and trotting).
25 50 75 1000
5
10
15
0
80
120
00
40
0.35
0
0.15
0.25
-2000
2000
025 100
-2
2
4
0
Level walking
Level galloping
Level trotting
Incline walking
Incline trotting
a) b)
c) d)
e)
Totalmyoelectricintensity
Force(N)
Forcerate(Ns-1 )
Strainrate(s-1)
Fasciclestrain
Time (% stride)
Lateral gastrocnemius
Time (% stride)
7550
UnknownFormatted: Font:Times New Roman
34
Figure 3.
Figure 3. Mean values of medial gastrocnemius a) fascicle strain, b) fascicle strain rate, c) force,
d) force rate, e) normalized intensity for different locomotor tasks over a stride (level walking,
trotting, and galloping, incline walking and trotting),
0
10
15
5
25 50 75 1000
-2000
3000
0 25 50 100
100
150
0
50
2
0
a) b)
c) d)
e)
Totalmyoelectricintensity
Force(N)
Forcerate(Ns-1 )
Strainrate(s-1)
Fasciclestrain
Time (% stride)
0.4
Level walking
Level galloping
Level trotting
Incline walking
Incline trotting
Time (% stride)
Medial gastrocnemius
0.1
0.2
0.3
-2
4
75
35
Figure 4.
Figure 4. Principal component (PC) analysis of the myoelectric signals. a) The first two principal
components defined from the myoelectric spectra of LG and MG. The percentage values reflect
the percentage of the signal explained by the PC. b) Principal component I and II loading scores
for medial gastrocnemius (solid) and lateral gastrocnemius (dotted) during different locomotor
tasks (diamond: level walking, triangle: level trotting, star: level galloping, circle: incline
walking, square: incline trotting).
-0.2 -0.1 0.0 0.1 0.2
0.2
0.4
0.6
0.8
1.0
1.2
PCII loading score
PCIloadingscore
Level walking
Level galloping
Level trotting
Incline walking
Incline trotting
0
0.4
500-0.4
1000 1500
PCII10.7%
0 500
0.4
1500
PCI65.7%
10000
Frequency (Hz)
Principalcomponent
weighting
a)
b)
θθ