Embed Size (px)
Citation preview
41st Edition
RECRUITING TRENDS2011-2012
Recruiting Trends 2010—2011 is published by Career Services and the Collegiate Employment Research Institute and copyrighted, © 2011-2012, by Michigan State University. All rights re-served. This electronic version is for individual use only. No part of this electronic report may be reproduced in any form by any electronic or mechanical means (including photocopying, record-ing, or information storage and retrieval) without permission in writing from the Institute. Users are not permitted to mount this file on any network servers or distribute to other individuals via email. Material from this report can be used in the classroom and newsletters with proper cita-tion of Michigan State University and the Collegiate Employment Research Institute.
Recruiting Trends 2010-2011 was made possible through generous gifts from these sponsors. We thank them for their confidence in our contribution to research on college recruiting. Without their thoughtful foresight, CERI’s research would be limited in scope. Special thanks go to Duncan Ferguson, Managing Director for BPI GroupUSA and James Spohrer, Director of University Programs World Wide, IBM Almaden Research Center.
RECRUITING TRENDS 2011-2012
A Michigan State University Publication prepared by
The Collegiate Employment Research Institute and
The MSU Career Services Network
Dr. Phil Gardner, Principal Investigator Director, Collegiate Employment
Research Institute
Research Team Ian Render, Research Assistant
iv
EXECUTIVE SUMMARY . . . . . . . . . . . . . . . . V
MEET THE COMPLETERS . . . . . . . . . . . . . VI
THE STATE OF HIRING, 2011-2012 . . . . . . . 1
EMPLOYER OUTLOOK ON THE LABOR MARKET . . . . . . . . . . . . . . . . . . . . 2
EMPLOYER HIRING INTENTIONS . . . . . . . . . 4
COLLEGE HIRING . . . . . . . . . . . . . . . . . . . 7
HIRING BY COMPANY SIZE . . . . . . . . . . . . . 9
HIRING BY ACADEMIC MAJOR . . . . . . . . . 12
HIRING BY INDUSTRY . . . . . . . . . . . . . . . 17
HIRING BY REGION . . . . . . . . . . . . . . . . . 22
RECRUITING STRATEGIES AND HIRING . . 25
POSITIONS FILLED . . . . . . . . . . . . . . . . . 29
STARTING SALARIES. . . . . . . . . . . . . . . . 30
SHAPING COLLEGE HIRING . . . . . . . . . . . 32
INTERNSHIPS AND CO-OPS . . . . . . . . . . . 34
GLOBAL HIRING . . . . . . . . . . . . . . . . . . . 36
COLLEGE RECRUITING ISSUES . . . . . . . . 37
CORPORATE PARTNERSHIPS . . . . . . . . . . 40
FINAL THOUGHTS . . . . . . . . . . . . . . . . . . 42
TRENDS SUPPORTERS . . . . . . . . . . . . . . . 43
CONTENTS
v
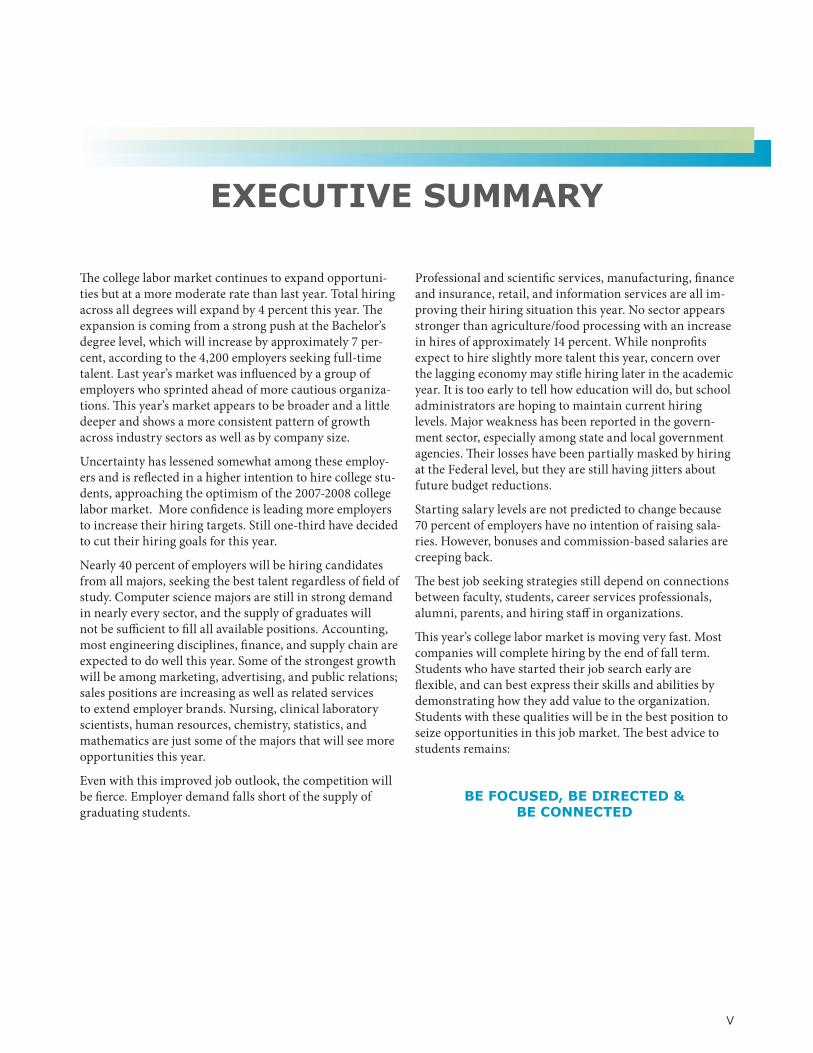
The college labor market continues to expand opportuni-ties but at a more moderate rate than last year. Total hiring across all degrees will expand by 4 percent this year. The expansion is coming from a strong push at the Bachelor’s degree level, which will increase by approximately 7 per-cent, according to the 4,200 employers seeking full-time talent. Last year’s market was influenced by a group of employers who sprinted ahead of more cautious organiza-tions. This year’s market appears to be broader and a little deeper and shows a more consistent pattern of growth across industry sectors as well as by company size.
Uncertainty has lessened somewhat among these employ-ers and is reflected in a higher intention to hire college stu-dents, approaching the optimism of the 2007-2008 college labor market. More confidence is leading more employers to increase their hiring targets. Still one-third have decided to cut their hiring goals for this year.
Nearly 40 percent of employers will be hiring candidates from all majors, seeking the best talent regardless of field of study. Computer science majors are still in strong demand in nearly every sector, and the supply of graduates will not be sufficient to fill all available positions. Accounting, most engineering disciplines, finance, and supply chain are expected to do well this year. Some of the strongest growth will be among marketing, advertising, and public relations; sales positions are increasing as well as related services to extend employer brands. Nursing, clinical laboratory scientists, human resources, chemistry, statistics, and mathematics are just some of the majors that will see more opportunities this year.
Even with this improved job outlook, the competition will be fierce. Employer demand falls short of the supply of graduating students.
EXECUTIVE SUMMARY
Professional and scientific services, manufacturing, finance and insurance, retail, and information services are all im-proving their hiring situation this year. No sector appears stronger than agriculture/food processing with an increase in hires of approximately 14 percent. While nonprofits expect to hire slightly more talent this year, concern over the lagging economy may stifle hiring later in the academic year. It is too early to tell how education will do, but school administrators are hoping to maintain current hiring levels. Major weakness has been reported in the govern-ment sector, especially among state and local government agencies. Their losses have been partially masked by hiring at the Federal level, but they are still having jitters about future budget reductions.
Starting salary levels are not predicted to change because 70 percent of employers have no intention of raising sala-ries. However, bonuses and commission-based salaries are creeping back.
The best job seeking strategies still depend on connections between faculty, students, career services professionals, alumni, parents, and hiring staff in organizations.
This year’s college labor market is moving very fast. Most companies will complete hiring by the end of fall term. Students who have started their job search early are flexible, and can best express their skills and abilities by demonstrating how they add value to the organization. Students with these qualities will be in the best position to seize opportunities in this job market. The best advice to students remains:
BE FOCUSED, BE DIRECTED & BE CONNECTED
RECRUITING TRENDS 2011-2012
vi
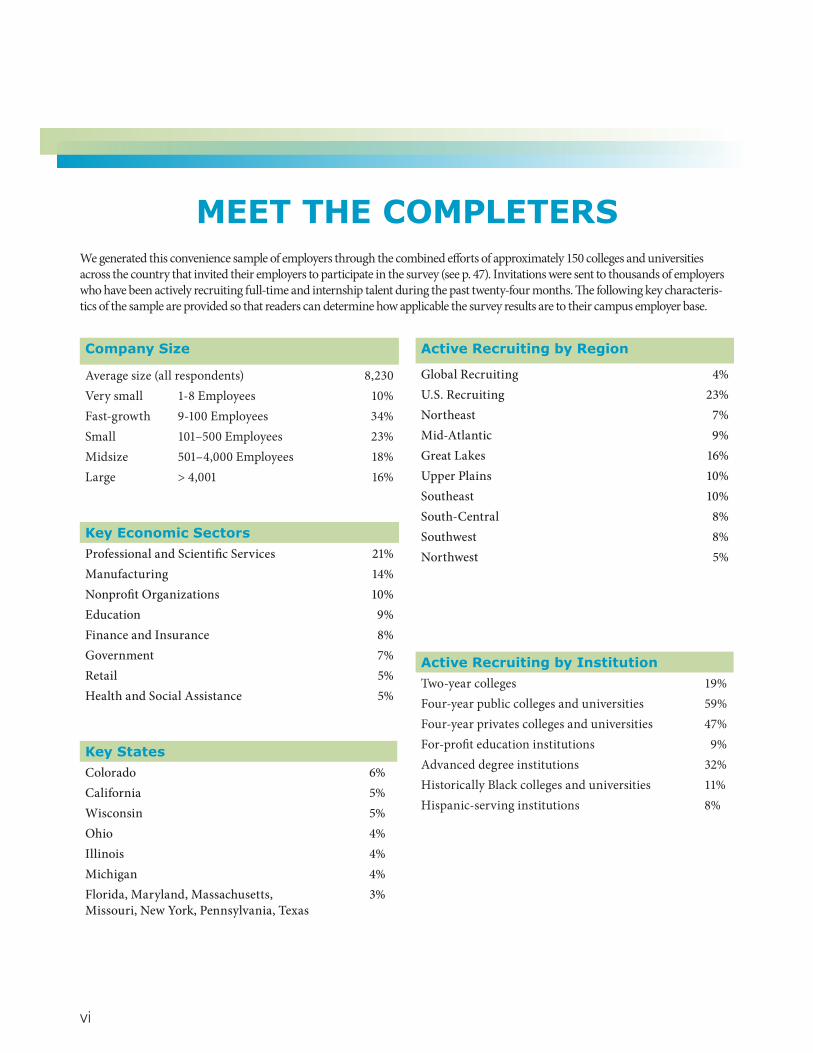
Company Size
Average size (all respondents) 8,230Very small 1-8 Employees 10%Fast-growth 9-100 Employees 34%Small 101–500 Employees 23%Midsize 501–4,000 Employees 18%Large > 4,001 16%
Key Economic SectorsProfessional and Scientific Services 21%Manufacturing 14%Nonprofit Organizations 10%Education 9%Finance and Insurance 8%Government 7%Retail 5%Health and Social Assistance 5%
Key StatesColorado 6%California 5%Wisconsin 5%Ohio 4%Illinois 4%Michigan 4%Florida, Maryland, Massachusetts, Missouri, New York, Pennsylvania, Texas
3%
Active Recruiting by Region
Global Recruiting 4%U.S. Recruiting 23%Northeast 7%Mid-Atlantic 9%Great Lakes 16%Upper Plains 10%Southeast 10%South-Central 8%Southwest 8%Northwest 5%
Active Recruiting by InstitutionTwo-year colleges 19%Four-year public colleges and universities 59%Four-year privates colleges and universities 47%For-profit education institutions 9%Advanced degree institutions 32%Historically Black colleges and universities 11%Hispanic-serving institutions 8%
We generated this convenience sample of employers through the combined efforts of approximately 150 colleges and universities across the country that invited their employers to participate in the survey (see p. 47). Invitations were sent to thousands of employers who have been actively recruiting full-time and internship talent during the past twenty-four months. The following key characteris-tics of the sample are provided so that readers can determine how applicable the survey results are to their campus employer base.
MEET THE COMPLETERS
RECRUITING TRENDS 2011-2012
1
Last fall, you may recall, the college-recruiting season was ablaze with activity and confidence. After a slow summer, the fall job reports, a small increase in consumer spending, and advanced manufacturing orders provided confidence that the economy was getting back on track. Two months later wine had turned to vinegar as the economy soured for the next ten months. This fall seems like a replay with more positive job reports for September and October, a surge in consumer spending, and a calming of the European finan-cial crisis. On visits to most campus career fairs this fall, the venues were packed; employers were eagerly engaging with college students. However, the enthusiasm was more tempered than last year, an attitude consistent with other labor market reports that have been forecasting more cau-tious optimism.
Office Depot’s Small Business Index revealed a higher level of uncertainty among small employers with only 42 percent expecting growth in the near future (a 16% decrease from last year). Because of this uncertainty, 79 percent do not expect to add staff in the near future.
Manpower Employment Outlook for the third quarter reveals a “positive but careful” outlook. The labor market should make modest, positive gains during the next few quarters as “the demand for labor trumps economic uncer-tainty.” In fact Manpower warns employers against waiting for the right talent to arrive when it is time to hire.
The Bureau of Labor Statistics (BLS) provides monthly updates for nonfarm employment statistics by economic sector at the end of each month. Reports from 2011 do not bear witness to strong gains in new positions except during the past two months. Professional job growth has appeared modest despite the trends. In the following key sectors
• Retail has grown consistently. Motor vehicle dealers, food and beverage stores, general merchandise stores, and building materials are leading this sector. Clothing
stores have increased staffing significantly over the past three months.
• Professional Services reports consistent gains each month. Computer design is driving this sector. Ac-counting and management consulting continue to add staff. Demand for legal services still appears to be shrinking though the decline appears to be slowing down.
• Health Services have shown strong growth this year, up nearly 43 percent over the past three months. Although these gains are being boosted by more hiring at hospi-tals, social assistance programs have reduced their staff.
• Manufacturing, after impressive gains in 2010, in-creased hiring much more slowly this year. Year over year, however, was positive. Leading sectors include food, primary metals, fabricated metals, machinery, and electrical.
The BLS U-6 Report, a broader measure of unemployment, is rarely published for the public. The statistics include discouraged workers who have quit looking for work and those who work half time but desire full-time employment. These numbers remain stubbornly high, ranging between 16-20 percent depending on the reporting period. The U-6 report provides a sense of how difficult the situation may be for our recent graduates and experienced alumni who are seeking work or are misaligned with the workplace.
Other sources you might want to keep an eye on include
Moody’s Analytics Job Forecast
Shadow Government Statistics (for data seldom reported or massaged for political purposes)
Global Creativity Index
Economic fluctuations still affect hiring. [ ]THE STATE OF HIRING, 2011-2012
RECRUITING TRENDS 2011-2012
2
How do employers hiring new college talent this year view the labor market? This report focuses on responses from (1) 3,700 employers hiring for full-time positions who pro-vided information on their hiring intentions and (2) intern and co-op managers who responded to specific questions about their programs. Our effort to collect information from employers was facilitated by more than 150 col-leges and universities around the country who contacted employers and personally asked them to participate in the survey. These valuable partnerships have gathered a large, geographically broad, and diverse mix of employers tap-ping colleges and universities for talent.
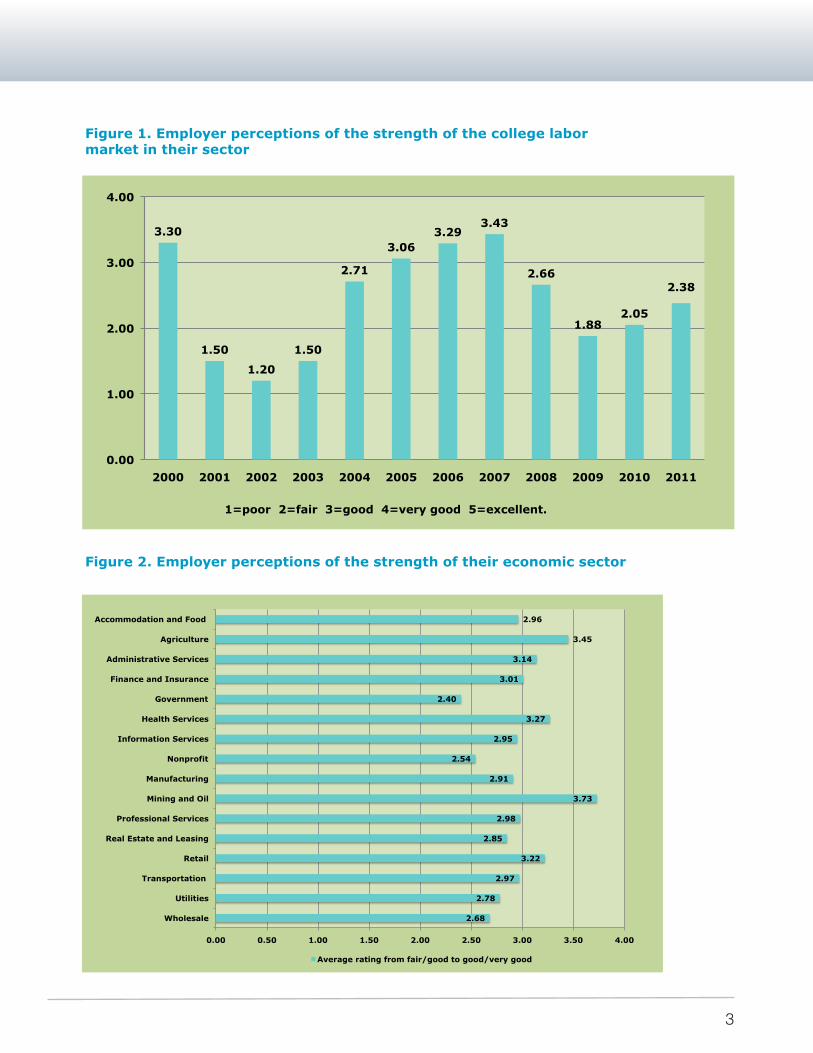
Employers are now more optimistic about the college labor market than at any time since 2007. Overall employers rated the market at nearly 2.4, a rise of four-tenths over the year (fig. 1). In most cases employers are even more optimistic about their own sectors (fig. 2).
Employers are more optimistic about the college labor market than at any time since 2007.[ ]
EMPLOYER OUTLOOK ON THE LABOR MARKET
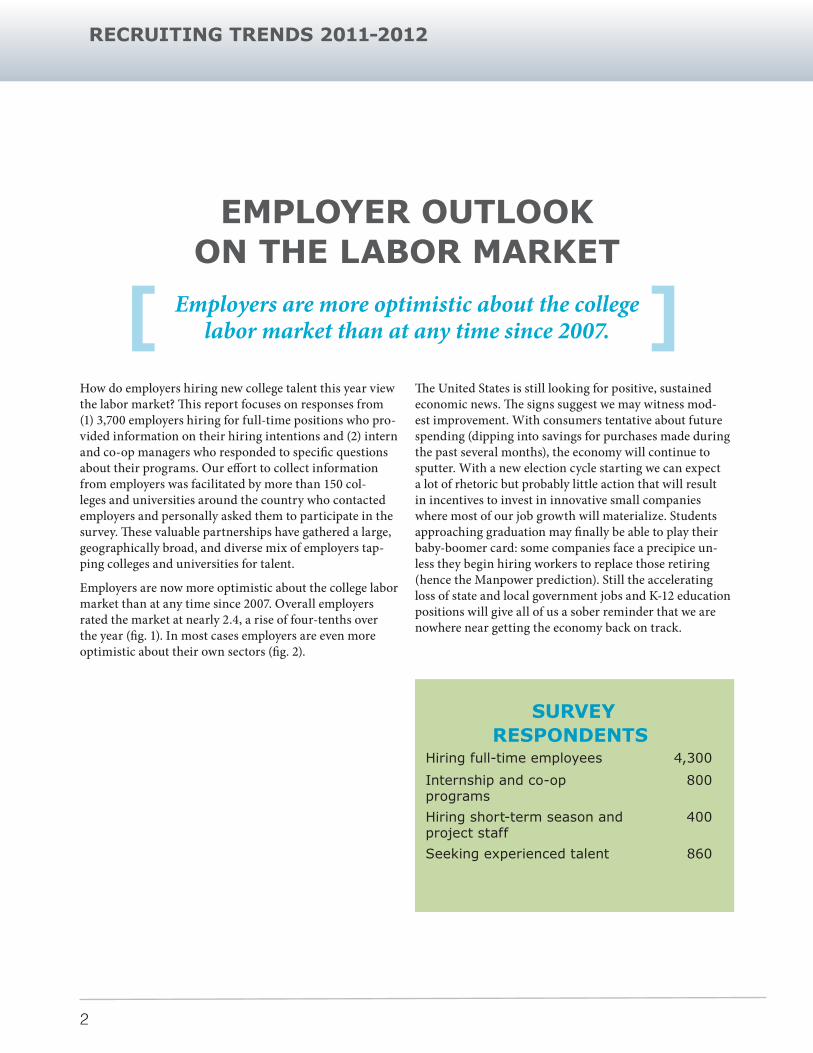
SURVEY RESPONDENTS
Hiring full-time employees 4,300
Internship and co-op programs
800
Hiring short-term season and project staff
400
Seeking experienced talent 860
The United States is still looking for positive, sustained economic news. The signs suggest we may witness mod-est improvement. With consumers tentative about future spending (dipping into savings for purchases made during the past several months), the economy will continue to sputter. With a new election cycle starting we can expect a lot of rhetoric but probably little action that will result in incentives to invest in innovative small companies where most of our job growth will materialize. Students approaching graduation may finally be able to play their baby-boomer card: some companies face a precipice un-less they begin hiring workers to replace those retiring (hence the Manpower prediction). Still the accelerating loss of state and local government jobs and K-12 education positions will give all of us a sober reminder that we are nowhere near getting the economy back on track.
RECRUITING TRENDS 2011-2012
3
3.30
1.50
1.20
1.50
2.71
3.06 3.29
3.43
2.66
1.88 2.05
2.38
0.00
1.00
2.00
3.00
4.00
2000 2001 2002 2003 2004 2005 2006 2007 2008 2009 2010 2011
1=poor 2=fair 3=good 4=very good 5=excellent.
Figure 1. Employer perceptions of the strength of the college labor market in their sector
Figure 2. Employer perceptions of the strength of their economic sector
2.68
2.78
2.97
3.22
2.85
2.98
3.73
2.91
2.54
2.95
3.27
2.40
3.01
3.14
3.45
2.96
0.00 0.50 1.00 1.50 2.00 2.50 3.00 3.50 4.00
Wholesale
Utilities
Transportation
Retail
Real Estate and Leasing
Professional Services
Mining and Oil
Manufacturing
Nonprofit
Information Services
Health Services
Government
Finance and Insurance
Administrative Services
Agriculture
Accommodation and Food
Average rating from fair/good to good/very good
RECRUITING TRENDS 2011-2012
4
Employers are less uncertain about committing to hiring targets.[ ]
EMPLOYER HIRING INTENTIONS
Forty-two percent of employers reported they had definite plans to hire college graduates during the 2010-2011 aca-demic year. This figure is 10 percentage points higher than last year and approaches the high of 47 percent in 2007. Approximately 20 percent of employers have made pre-liminary hiring targets for the next year that include new college graduates. An additional 29 percent (a drop of 6%) have entered the recruiting season uncertain about hiring intentions as they monitor uncertainty in the economy. Only 8 percent of employers indicated they would not be hiring this year, a noticeable drop from last year.
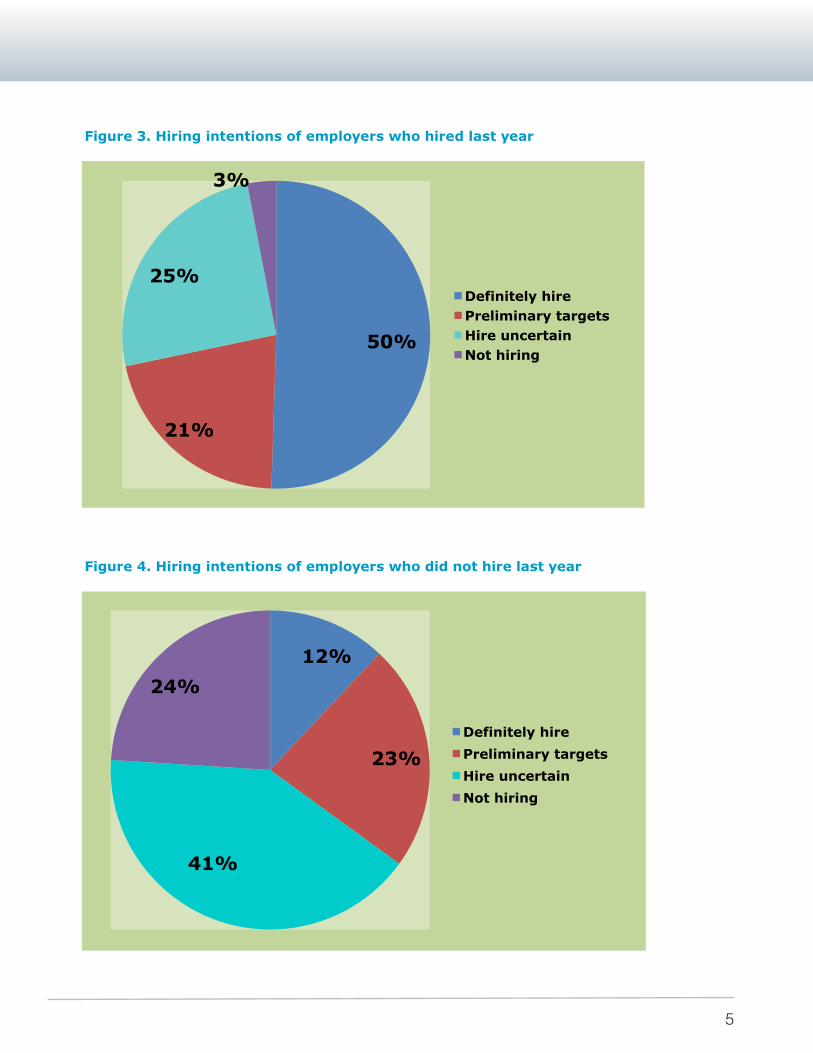
Comparing the intentions of employers who hired new graduates last year (78%) to those who did not (22%) revealed that uncertainty has ebbed somewhat for both groups (fig. 3-4). Several interesting observations emerged
• Employers who hired are more confident that they will definitely hire (51%) than those who did not 12%).
• Both groups demonstrated uncertainty; however, the level dropped 6 percentage points for those hiring (25%) and remained relatively the same in group not hiring (41%).
• A small segment of employers who did not hire last year will not hire this year (24%), a slight reduction from last year (32%).
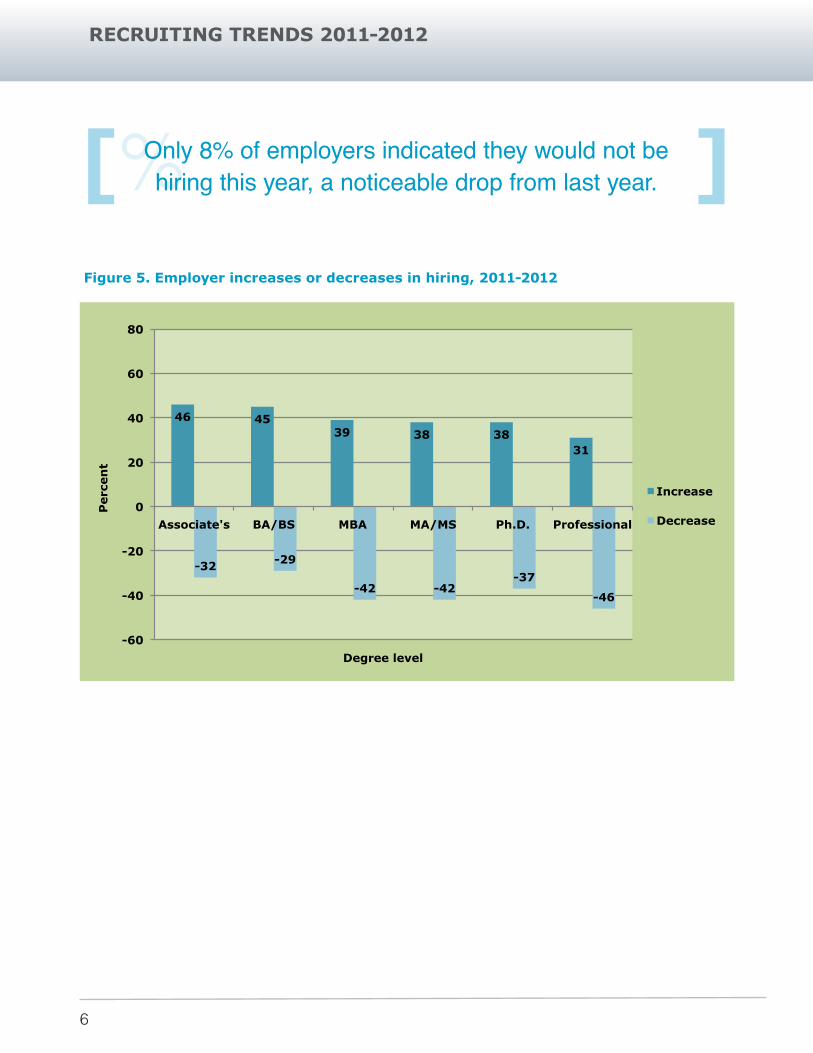
DIRECTION OF HIRING PLANSEven with the increase in employers hiring this year, we cannot assume employers will be increasing their hires over last year. Across all degree levels, approximately 31-46 percent of employers apparently will be increasing their hiring targets from last year. Those employers decreasing their hiring targets remains at slightly more than one-third of employers hiring at each degree level.
HIRING BY DEGREE LEVEL SHOWS MIXED RESULTS.At the bachelor’s degree level employers increasing hires exceeded those not hiring by 16 percent (fig. 5). The MBA and Master’s degree markets are both split again this year with slightly more employers decreasing their hiring. The labor situation for Associate’s degree holders and Ph.D.s shows that a few more employers will increase hiring than decrease hiring.
RECRUITING TRENDS 2011-2012
5
Figure 3. Hiring intentions of employers who hired last year
50%
21%
25%
3%
Definitely hire Preliminary targets Hire uncertain Not hiring
Figure 4. Hiring intentions of employers who did not hire last year
12%
23%
41%
24%
Definitely hire
Preliminary targets
Hire uncertain
Not hiring
RECRUITING TRENDS 2011-2012
6
[% ]Only 8% of employers indicated they would not be hiring this year, a noticeable drop from last year.
Figure 5. Employer increases or decreases in hiring, 2011-2012
46 45 39 38 38
31
-32 -29
-42 -42 -37
-46
-60
-40
-20
0
20
40
60
80
Associate's BA/BS MBA MA/MS Ph.D. Professional
Perc
en
t
Degree level
Increase
Decrease
RECRUITING TRENDS 2011-2012
7
Hiring targets for Bachelor’s degree holders are expanding moderately.[ ]
COLLEGE HIRING
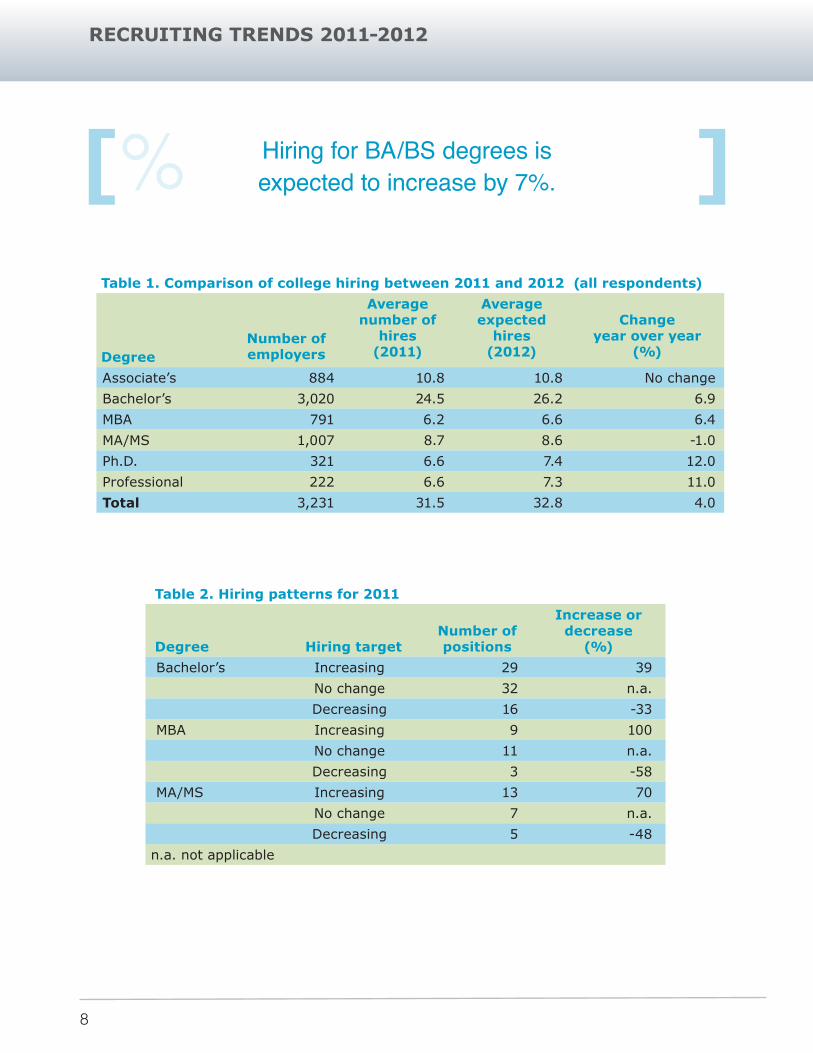
Approximately 3,231 employers provided complete hiring information for the analyses in this report. These compa-nies represent 106,000 job opportunities across all degree levels. (Nearly 79,000 or 74% of the total estimated hires are at the Bachelor’s degree level). Overall, the college labor market is expanding at a very modest 4 percent from last year. This market has more moderate expectations, especially at the Bachelor’s degree level, than the more exu-berant market of last year. Bachelor’s degree holders and MBAs will both experience a 5-7 percent increase this year while Associate’s degree and Master’s degree holders will remain relatively constant at last year’s level. Employment opportunities for advanced degree candidates appear to be expanding this year (table 1).
Hiring for Bachelor’s degree holders is moderate but still aggressive. Last year the labor market for these graduates was jerked into life by a group of large and small organiza-tions that dramatically increased their hiring targets. This year the market better reflects the middle of the distribu-tion: 26 percent will keep hiring at the same level as last year. Twenty-seven percent will add one or two staff; 17 percent will decrease their hiring targets by one or two po-sitions. The ends do play an important role this year: they nearly balance each other in gains and losses of positions.
In other words, organizations expecting to hire a large number of new employees are being offset by organizations lowering their targets or suspending recruiting this year.
Hiring for MBAs is bifurcated. Slightly more employers are reducing their hiring targets (42%) than those planning to increase theirs (39%). Despite this imbalance, the total available positions for MBAs will be 6 percent higher this year. This marks the third straight year of steady expansion in opportunities. Yet, keep in mind that the supply of new MBAs exceeds the number of available positions and will keep competition fierce.
While total hires per organization (across all degree levels) appeared to hit the projected targets made in the 2010-2011 report (33 hires per company), the average hires per com-pany at the Bachelor’s degree and MBA levels fell slightly short of our prediction. This year’s targets are comparable to last year’s and are expected to remain unchanged, with the Bachelor’s degree level at 26 and MBAs at 8.
Though companies are hiring and adding positions to their payroll, the pace of hiring and number of positions have changed somewhat from last year. Comparing projections and actual hiring information, interesting patterns emerge among companies’ hiring patterns (table 2).
RECRUITING TRENDS 2011-2012
8
[% ]Table 1. Comparison of college hiring between 2011 and 2012 (all respondents)
DegreeNumber of employers
Average number of
hires (2011)
Average expected
hires (2012)
Change year over year
(%)
Associate’s 884 10.8 10.8 No changeBachelor’s 3,020 24.5 26.2 6.9MBA 791 6.2 6.6 6.4MA/MS 1,007 8.7 8.6 -1.0Ph.D. 321 6.6 7.4 12.0Professional 222 6.6 7.3 11.0Total 3,231 31.5 32.8 4.0
Table 2. Hiring patterns for 2011
Degree Hiring targetNumber of positions
Increase or decrease
(%)Bachelor’s Increasing 29 39
No change 32 n.a.Decreasing 16 -33
MBA Increasing 9 100No change 11 n.a.Decreasing 3 -58
MA/MS Increasing 13 70No change 7 n.a.Decreasing 5 -48
n.a. not applicable
Hiring for BA/BS degrees is expected to increase by 7%.
RECRUITING TRENDS 2011-2012
9
[ ]Despite economic conditions, companies appear to haveput out the welcome mat for college-educated workers.
This report always strives to obtain a diverse sample of employers based on company size. For the last few years we have stressed the importance of fast-growth or second-stage companies that have successfully emerged from the start-up phase and are accelerating hiring. With the expan-sion of schools assisting with this project we are capturing start-up activity that particularly influences hiring at the advanced degree level. These smaller companies are bal-anced by medium and large ones typically more visible on campus during recruiting season.
Despite economic conditions organizations seeking col-lege-trained employees appear to have put out the welcome mat. There are a few troubling signs, however. Small com-panies still struggle as shown in the Office Depot index. Midsize organizations are still contracting, but job loss appears to be bottoming out for some for-profit companies (second- and third-tier suppliers). With the loss of stimulus funds local and state agencies and public education have had to decrease their staffing. This decrease has offset the gains being made by midsize for-profit companies. Based on comparisons of projected hires and actual hiring fig-ures, the following synopses describe the situation for each type of organization (fig. 6).
Very small establishments (< 8 employees) capture small single-proprietor establishments (e.g., insurance agency, law firm, public relations firm, or consulting business) and start-up companies. These establishments expect to in-crease their hiring across all degree levels. Total hires will increase on average from 1.1 hires last year to 4.5 hires this year. Most of this hiring will take place at the Bachelor’s degree level with strong increases at the Associate’s degree and Ph.D. levels.
Fast-growth (second-stage) companies (9-100 employees) have consistently been top performers over the past ten years and represent 34 percent of respondents. While not
HIRING BY COMPANY SIZE
all companies in this segment can be considered fast-growth, hiring expectations are positive across all degree levels except in Professional Services. These organizations will hire on average 7 individuals, a 35 percent increase over last year. More specifically, companies plan to in-crease hiring by 19 percent at the Bachelor’s degree level and 54 percent at the Ph.D. level.
Small companies (101-500 employees) appear to be slightly improving their hiring though it can be described as cau-tious. Hiring increases are expected at the Bachelor’s and Master’s degree levels and for MBAs while targets will be lower for other degrees. These companies expect to hire on average 11 individuals this year, essentially no change from last year.
Midsize companies (501-3,999 employees) still struggle with economic challenges. Even though they will be hir-ing on average 43 individuals, this represents a 3 percent decline from last year. Hiring for Bachelor’s degree holders and MBAs are both projected to be down 3 percent. Hiring will improve slightly for Ph.D. and Professional degree holders.
Large companies (>4,000 employees) will increase total hiring by 6 percent, a continuation of the modest growth in hiring begun last year. Average hires per company will be on average 123, about 11 fewer hires than last year. While hiring will improve across all degree levels, the exception will be Master’s’ degree holders, whose hiring prospects are expected to drop by 6 percent. Most hiring is concentrated at the Bachelor’s degree level and will in-crease by 9 percent. However, these companies only expect to hire on average 97 individuals compared to the 103 projected last year. (Companies reported actually hiring 89 Bachelor’s degree holders last year.) After enjoying a strong gain (up 13%) in positions last year, MBA degree holders will have to deal with only a 1 percent increase this year.
RECRUITING TRENDS 2011-2012
10
The decline in Master’s degree level opportunities reverses the gains made last year.
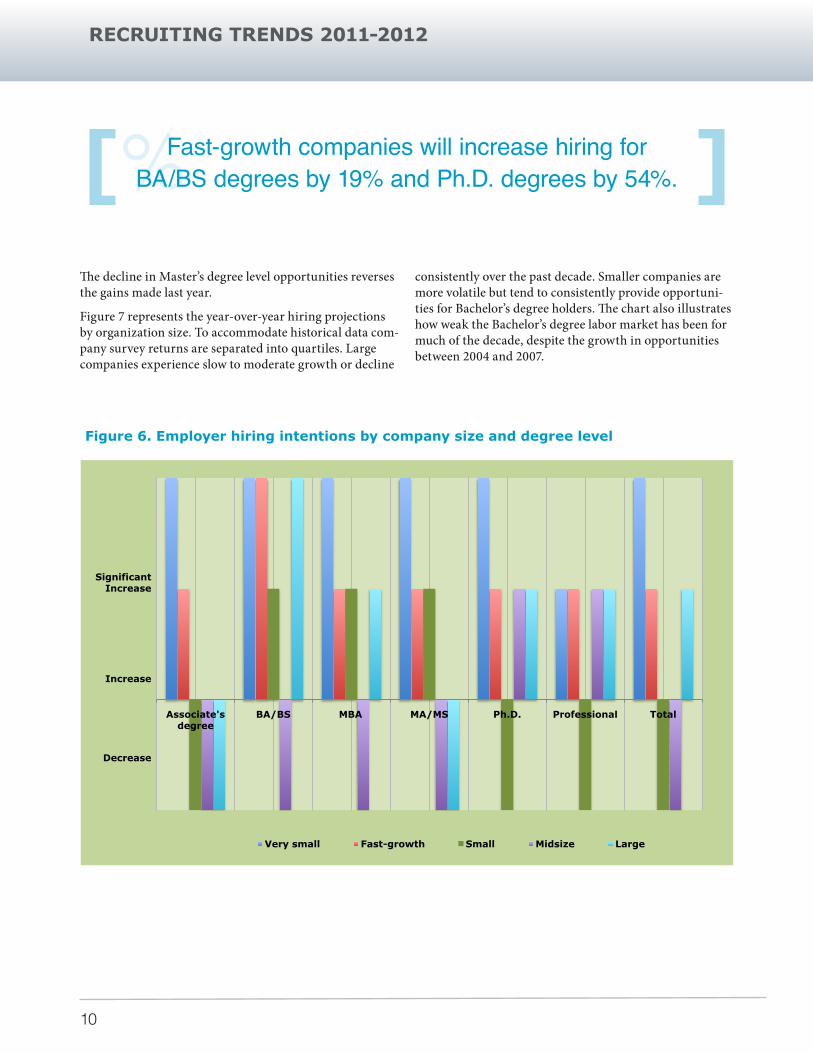
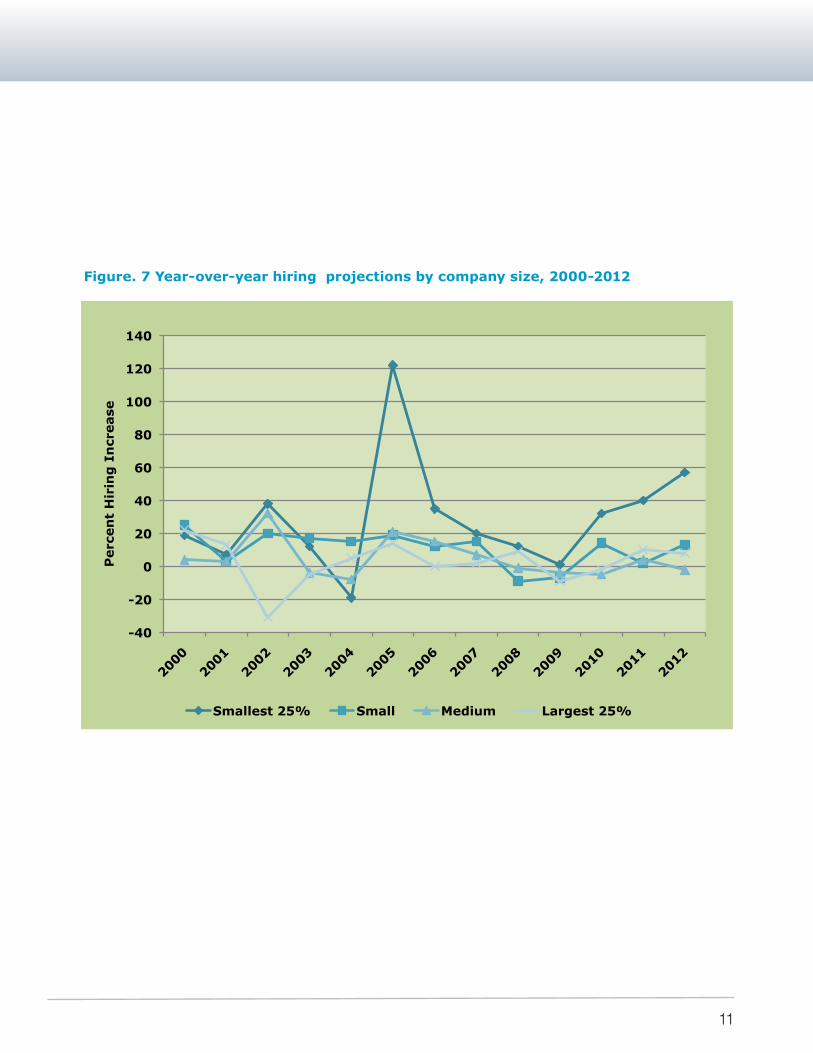
Figure 7 represents the year-over-year hiring projections by organization size. To accommodate historical data com-pany survey returns are separated into quartiles. Large companies experience slow to moderate growth or decline
consistently over the past decade. Smaller companies are more volatile but tend to consistently provide opportuni-ties for Bachelor’s degree holders. The chart also illustrates how weak the Bachelor’s degree labor market has been for much of the decade, despite the growth in opportunities between 2004 and 2007.
[% ]Fast-growth companies will increase hiring for BA/BS degrees by 19% and Ph.D. degrees by 54%.
Figure 6. Employer hiring intentions by company size and degree level
Associate's degree
BA/BS MBA MA/MS Ph.D. Professional Total
Significant Increase
Increase
Decrease
Very small Fast-growth Small Midsize Large
RECRUITING TRENDS 2011-2012
11
Figure. 7 Year-over-year hiring projections by company size, 2000-2012
-40
-20
0
20
40
60
80
100
120
140
2000
2001
2002
2003
2004
2005
2006
2007
2008
2009
2010
2011
2012
Perc
en
t H
irin
g I
ncr
ease
Smallest 25% Small Medium Largest 25%
RECRUITING TRENDS 2011-2012
12
Available positions still fall short of supply.[ ]HIRING BY ACADEMIC MAJOR
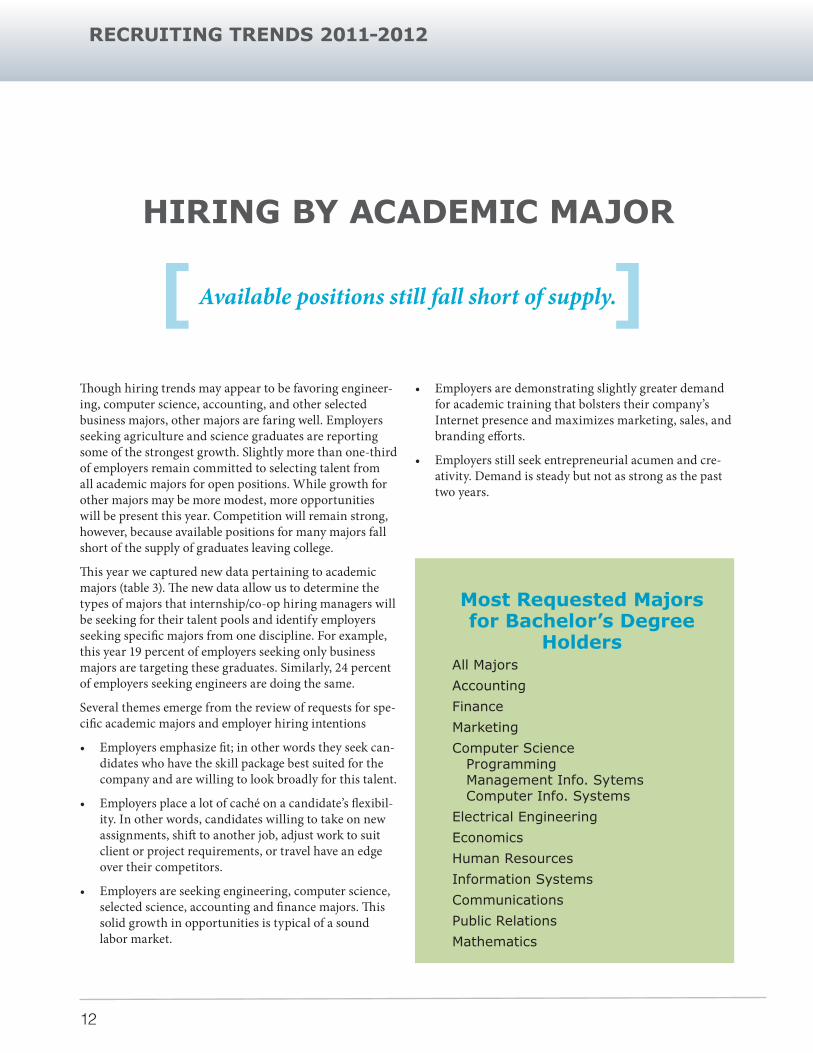
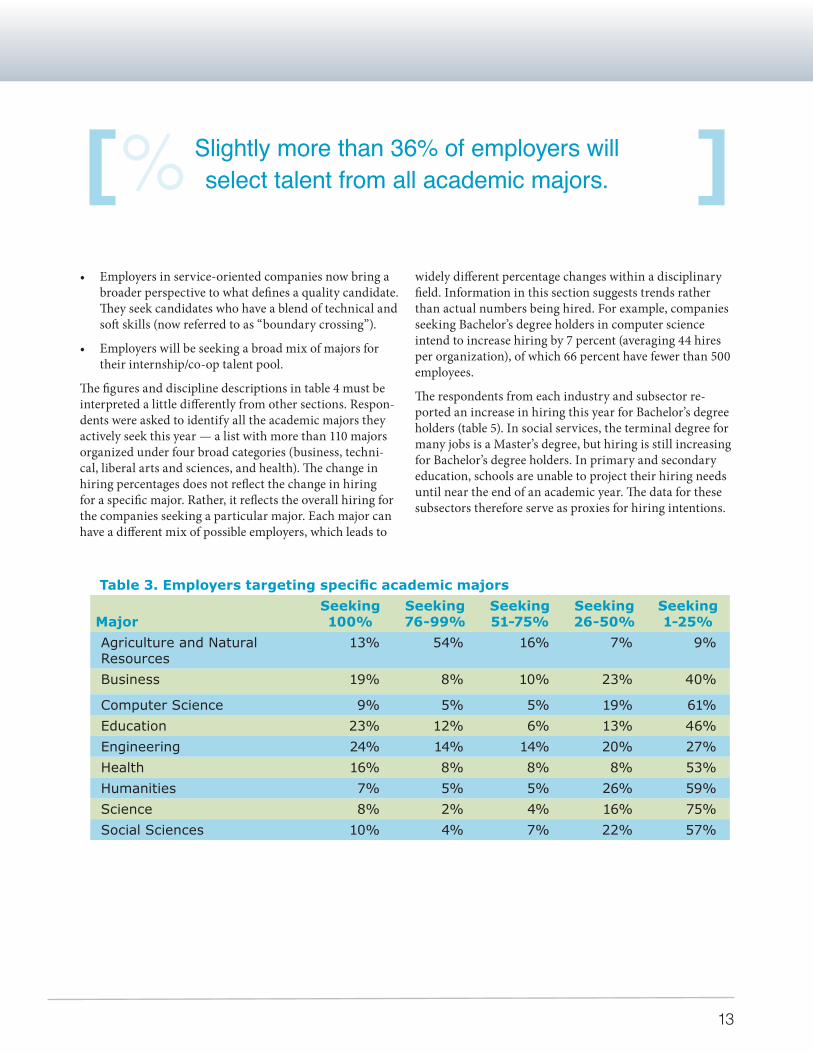
Though hiring trends may appear to be favoring engineer-ing, computer science, accounting, and other selected business majors, other majors are faring well. Employers seeking agriculture and science graduates are reporting some of the strongest growth. Slightly more than one-third of employers remain committed to selecting talent from all academic majors for open positions. While growth for other majors may be more modest, more opportunities will be present this year. Competition will remain strong, however, because available positions for many majors fall short of the supply of graduates leaving college.
This year we captured new data pertaining to academic majors (table 3). The new data allow us to determine the types of majors that internship/co-op hiring managers will be seeking for their talent pools and identify employers seeking specific majors from one discipline. For example, this year 19 percent of employers seeking only business majors are targeting these graduates. Similarly, 24 percent of employers seeking engineers are doing the same.
Several themes emerge from the review of requests for spe-cific academic majors and employer hiring intentions
• Employers emphasize fit; in other words they seek can-didates who have the skill package best suited for the company and are willing to look broadly for this talent.
• Employers place a lot of caché on a candidate’s flexibil-ity. In other words, candidates willing to take on new assignments, shift to another job, adjust work to suit client or project requirements, or travel have an edge over their competitors.
• Employers are seeking engineering, computer science, selected science, accounting and finance majors. This solid growth in opportunities is typical of a sound labor market.
• Employers are demonstrating slightly greater demand for academic training that bolsters their company’s Internet presence and maximizes marketing, sales, and branding efforts.
• Employers still seek entrepreneurial acumen and cre-ativity. Demand is steady but not as strong as the past two years.
Most Requested Majors for Bachelor’s Degree
HoldersAll MajorsAccounting FinanceMarketingComputer Science Programming Management Info. Sytems Computer Info. SystemsElectrical EngineeringEconomicsHuman ResourcesInformation SystemsCommunicationsPublic RelationsMathematics
RECRUITING TRENDS 2011-2012
13
[% ]• Employers in service-oriented companies now bring a
broader perspective to what defines a quality candidate. They seek candidates who have a blend of technical and soft skills (now referred to as “boundary crossing”).
• Employers will be seeking a broad mix of majors for their internship/co-op talent pool.
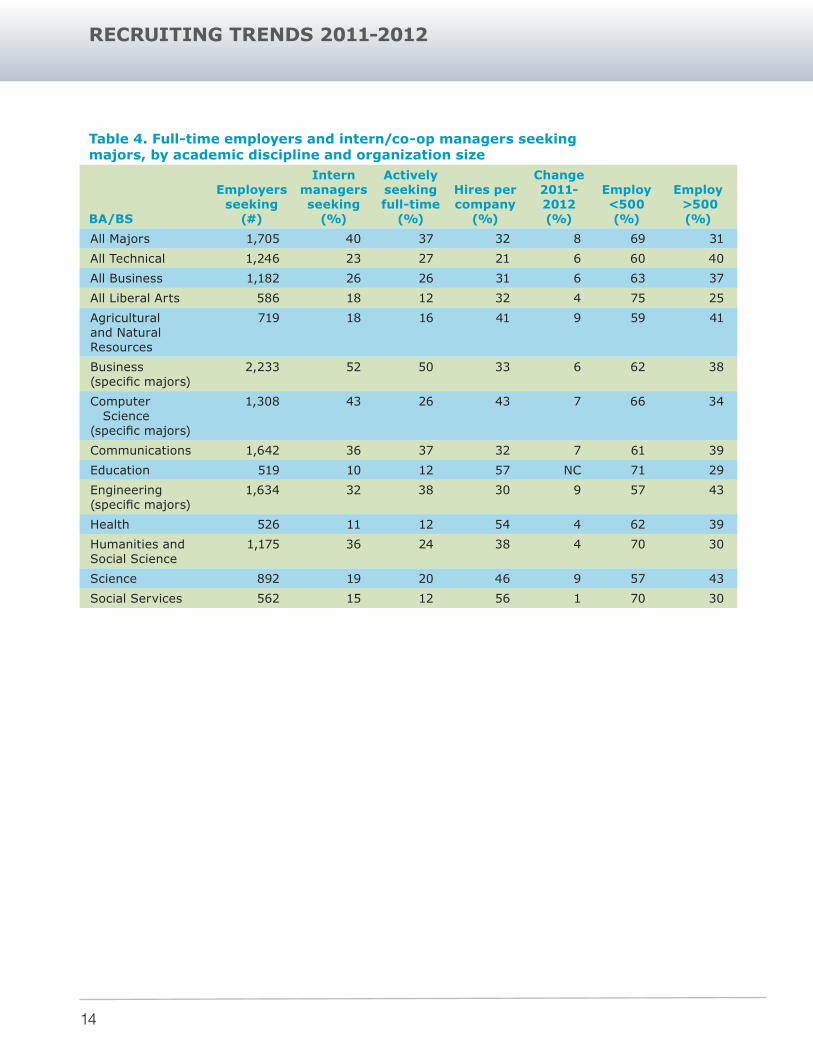
The figures and discipline descriptions in table 4 must be interpreted a little differently from other sections. Respon-dents were asked to identify all the academic majors they actively seek this year — a list with more than 110 majors organized under four broad categories (business, techni-cal, liberal arts and sciences, and health). The change in hiring percentages does not reflect the change in hiring for a specific major. Rather, it reflects the overall hiring for the companies seeking a particular major. Each major can have a different mix of possible employers, which leads to
widely different percentage changes within a disciplinary field. Information in this section suggests trends rather than actual numbers being hired. For example, companies seeking Bachelor’s degree holders in computer science intend to increase hiring by 7 percent (averaging 44 hires per organization), of which 66 percent have fewer than 500 employees.
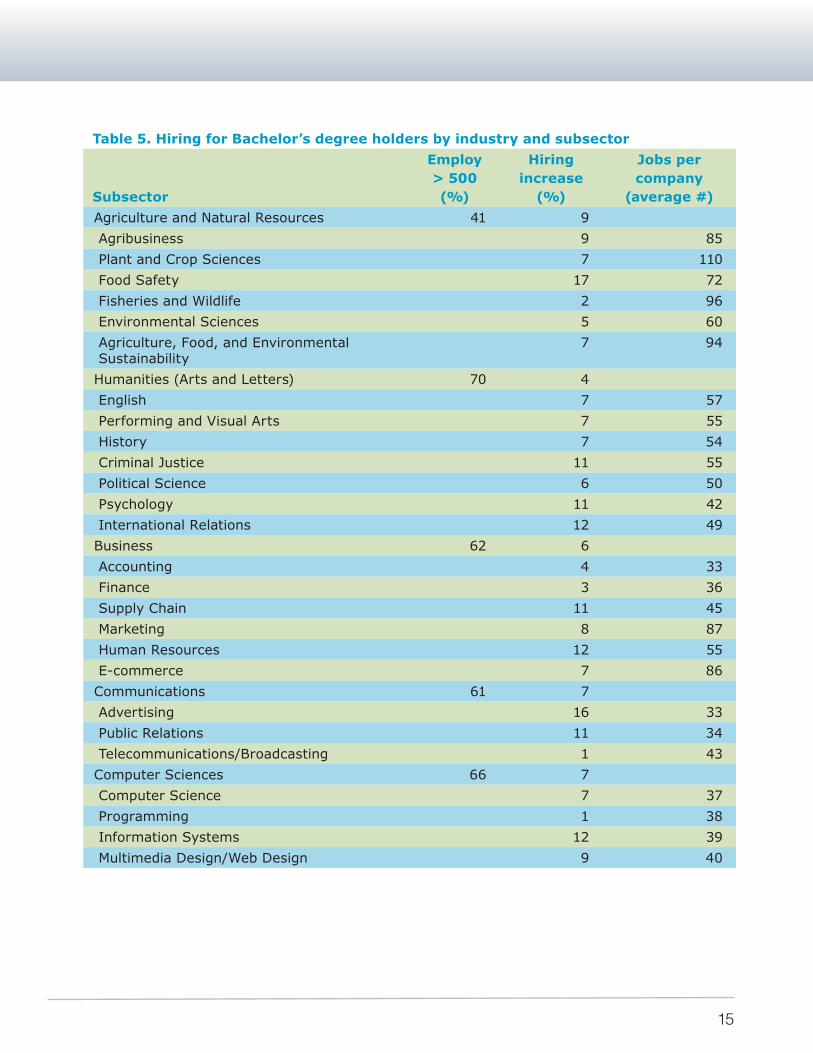
The respondents from each industry and subsector re-ported an increase in hiring this year for Bachelor’s degree holders (table 5). In social services, the terminal degree for many jobs is a Master’s degree, but hiring is still increasing for Bachelor’s degree holders. In primary and secondary education, schools are unable to project their hiring needs until near the end of an academic year. The data for these subsectors therefore serve as proxies for hiring intentions.
Slightly more than 36% of employers will select talent from all academic majors.
Table 3. Employers targeting specific academic majors
MajorSeeking 100%
Seeking 76-99%
Seeking 51-75%
Seeking 26-50%
Seeking 1-25%
Agriculture and Natural Resources
13% 54% 16% 7% 9%
Business 19% 8% 10% 23% 40%
Computer Science 9% 5% 5% 19% 61%Education 23% 12% 6% 13% 46%Engineering 24% 14% 14% 20% 27%Health 16% 8% 8% 8% 53%Humanities 7% 5% 5% 26% 59%Science 8% 2% 4% 16% 75%Social Sciences 10% 4% 7% 22% 57%
RECRUITING TRENDS 2011-2012
14
Table 4. Full-time employers and intern/co-op managers seeking majors, by academic discipline and organization size
BA/BS
Employers seeking
(#)
Intern managers seeking
(%)
Actively seeking full-time
(%)
Hires per company
(%)
Change 2011-2012(%)
Employ <500 (%)
Employ >500 (%)
All Majors 1,705 40 37 32 8 69 31
All Technical 1,246 23 27 21 6 60 40
All Business 1,182 26 26 31 6 63 37
All Liberal Arts 586 18 12 32 4 75 25
Agricultural and Natural Resources
719 18 16 41 9 59 41
Business (specific majors)
2,233 52 50 33 6 62 38
Computer Science (specific majors)
1,308 43 26 43 7 66 34
Communications 1,642 36 37 32 7 61 39
Education 519 10 12 57 NC 71 29
Engineering (specific majors)
1,634 32 38 30 9 57 43
Health 526 11 12 54 4 62 39
Humanities and Social Science
1,175 36 24 38 4 70 30
Science 892 19 20 46 9 57 43
Social Services 562 15 12 56 1 70 30
RECRUITING TRENDS 2011-2012
15
Table 5. Hiring for Bachelor’s degree holders by industry and subsector
Subsector
Employ > 500(%)
Hiring increase
(%)
Jobs per company
(average #)Agriculture and Natural Resources 41 9 Agribusiness 9 85 Plant and Crop Sciences 7 110 Food Safety 17 72 Fisheries and Wildlife 2 96 Environmental Sciences 5 60 Agriculture, Food, and Environmental Sustainability
7 94
Humanities (Arts and Letters) 70 4 English 7 57 Performing and Visual Arts 7 55 History 7 54 Criminal Justice 11 55 Political Science 6 50 Psychology 11 42 International Relations 12 49Business 62 6 Accounting 4 33 Finance 3 36 Supply Chain 11 45 Marketing 8 87 Human Resources 12 55 E-commerce 7 86Communications 61 7 Advertising 16 33 Public Relations 11 34 Telecommunications/Broadcasting 1 43Computer Sciences 66 7 Computer Science 7 37 Programming 1 38 Information Systems 12 39 Multimedia Design/Web Design 9 40
RECRUITING TRENDS 2011-2012
16
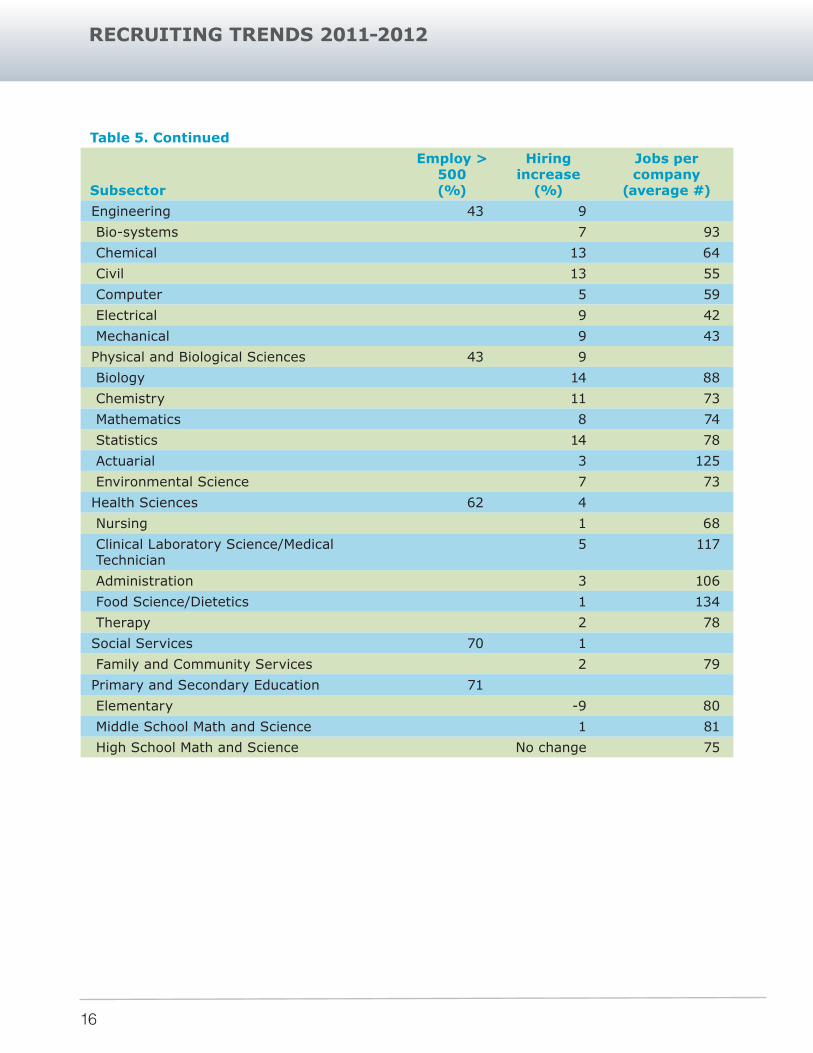
Table 5. Continued
Subsector
Employ > 500(%)
Hiring increase
(%)
Jobs per company
(average #)Engineering 43 9 Bio-systems 7 93 Chemical 13 64 Civil 13 55 Computer 5 59 Electrical 9 42 Mechanical 9 43Physical and Biological Sciences 43 9 Biology 14 88 Chemistry 11 73 Mathematics 8 74 Statistics 14 78 Actuarial 3 125 Environmental Science 7 73Health Sciences 62 4 Nursing 1 68 Clinical Laboratory Science/Medical Technician
5 117
Administration 3 106 Food Science/Dietetics 1 134 Therapy 2 78Social Services 70 1 Family and Community Services 2 79Primary and Secondary Education 71 Elementary -9 80 Middle School Math and Science 1 81 High School Math and Science No change 75
RECRUITING TRENDS 2011-2012
17
Professional Services opportunities areexpanding for the second year in a row.
The BLS monthly report, The Employment Situation, captures the growth in new positions by firms and estab-lishments across the United States. Several sectors have already been highlighted for their year-over-year perfor-mance. Classifying respondents by their North American Industrial Classification codes, comparisons can be made between actual labor market behavior and job forecasts from the survey respondents. It is important to remember that the new college labor market is a small sliver of the national labor market. The college market can be trending in a different direction in some sectors than the national figures might suggest should be happening.
The BLS jobs figures continue to portray sluggish job growth. Periods of solid (not spectacular) growth are fol-lowed by periods during which employers are adding few jobs. This cycle has been repeating for much of the past twenty-four months. Fall projections for September and October have turned upward again and reflect the level of jobs anticipated when the economy is growing between 2-3 percent of GDP. Our picture continues to show the college labor market actually expanding across most sectors (al-though some sectors have a small number of respondents). In our leading sectors of Manufacturing, Retail, Finance, Professional Services, and Health, only Manufacturing has slipped from last year’s strong expansion. Concern remains for Government, Education, and Construction, which have lost opportunities this year.
Several forces are motivating employers to hire college students. Among the smaller group, a core segment actu-ally creates new positions as business expands. For larger companies, the reasonable explanation continues to be that most positions these employers are attempting to fill have been unfilled for some time. With baby boomers finally beginning to retire, employers can no longer delay hiring if they expect to maintain a seamless workforce.
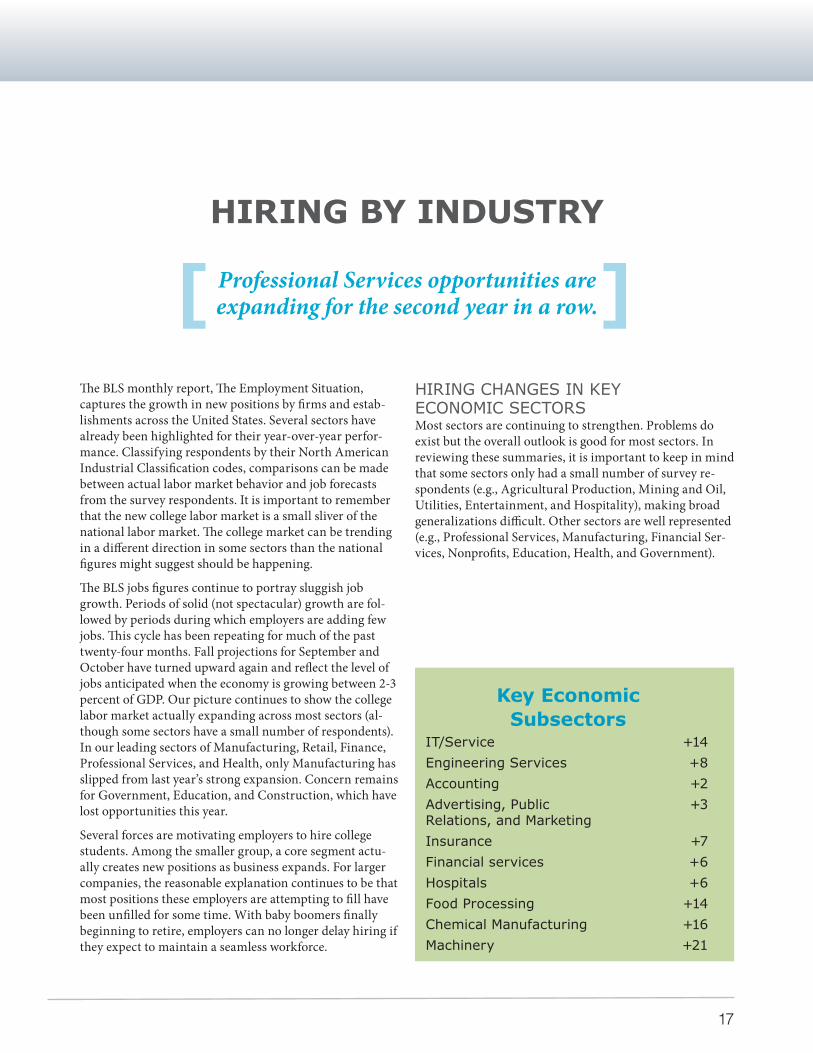
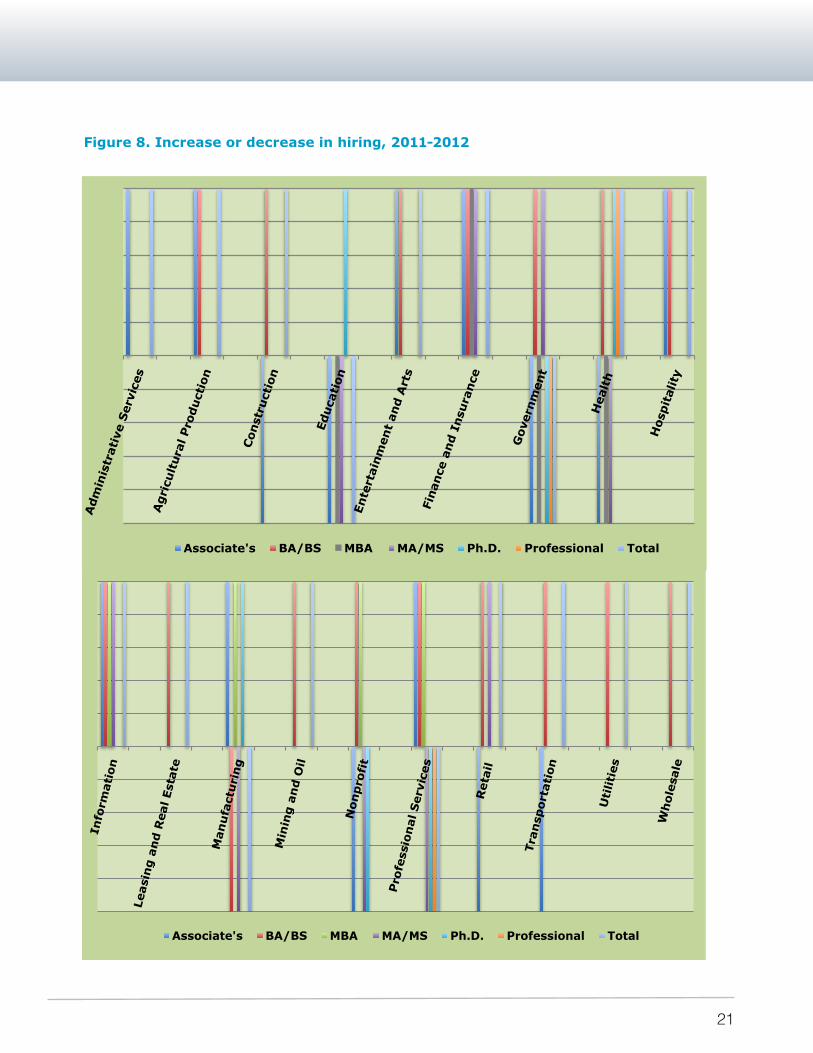
HIRING CHANGES IN KEY ECONOMIC SECTORSMost sectors are continuing to strengthen. Problems do exist but the overall outlook is good for most sectors. In reviewing these summaries, it is important to keep in mind that some sectors only had a small number of survey re-spondents (e.g., Agricultural Production, Mining and Oil, Utilities, Entertainment, and Hospitality), making broad generalizations difficult. Other sectors are well represented (e.g., Professional Services, Manufacturing, Financial Ser-vices, Nonprofits, Education, Health, and Government).
[ ]HIRING BY INDUSTRY
Key Economic Subsectors
IT/Service +14Engineering Services +8Accounting +2Advertising, Public Relations, and Marketing
+3
Insurance +7Financial services +6Hospitals +6Food Processing +14Chemical Manufacturing +16Machinery +21
RECRUITING TRENDS 2011-2012
18
Agriculture and Natural Resources. Production Agricul-ture, Forestry, and their support-services companies expect to hire 15 Bachelor’s degree holders this year, a 40 percent increase over actual hiring last year. When combining this figure with Food Processing, the picture for the food sector (broadly defined) is very positive.
Mining and Oil. Energy Exploration continues to be a growth sector. These companies expect to hire on aver-age 19 Bachelor’s degree holders this year, an increase of 7 percent.
Utilities. Total hiring in the utilities sector is expected to be up slightly from last year. Hiring for Bachelor’s degree holders is expected to be the same as last year, averaging 9 per company.
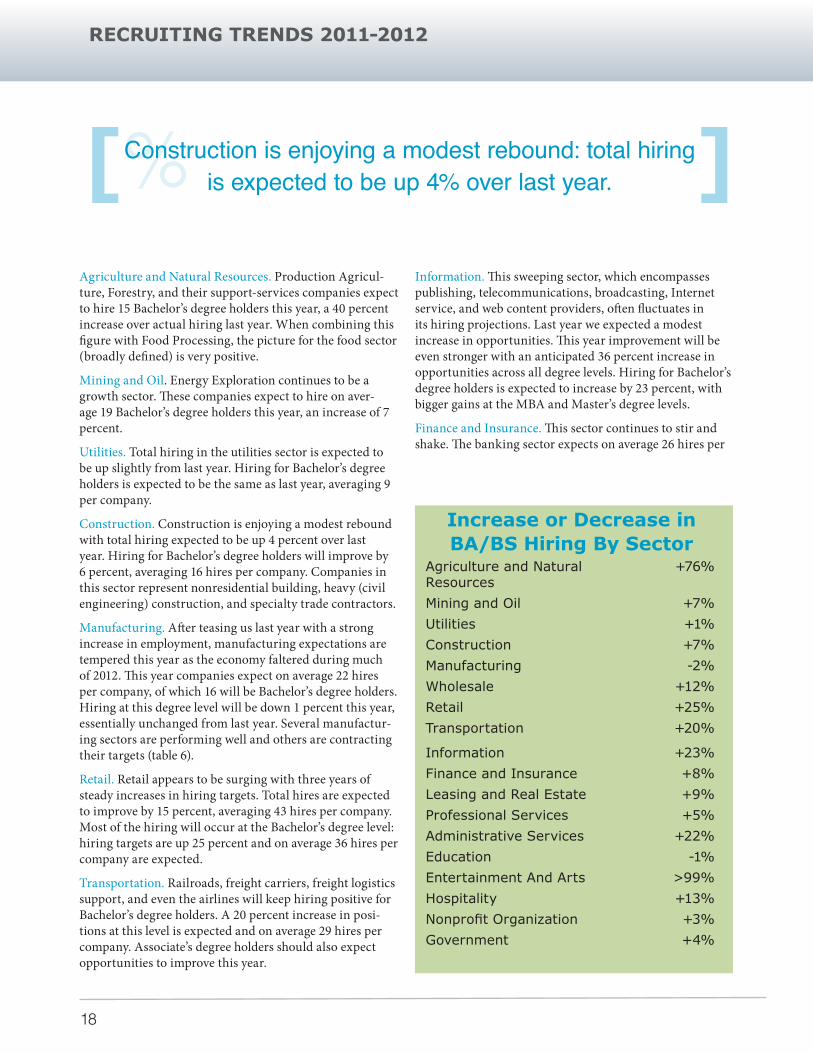
Construction. Construction is enjoying a modest rebound with total hiring expected to be up 4 percent over last year. Hiring for Bachelor’s degree holders will improve by 6 percent, averaging 16 hires per company. Companies in this sector represent nonresidential building, heavy (civil engineering) construction, and specialty trade contractors.
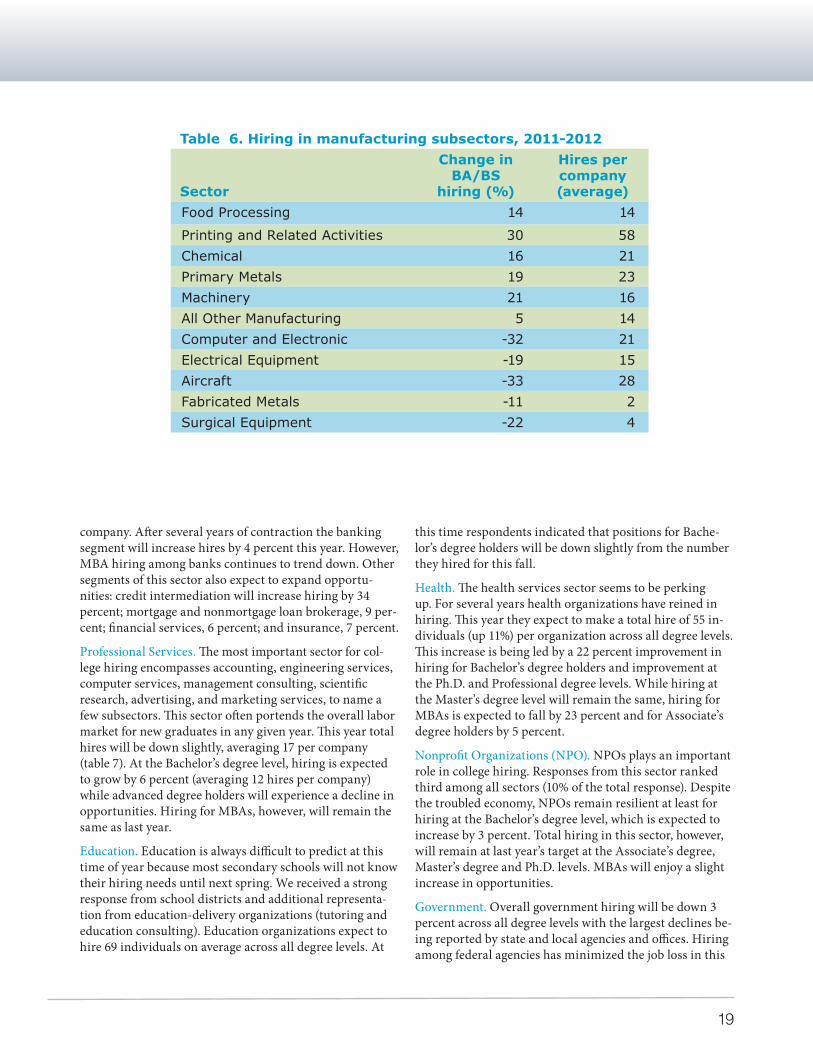
Manufacturing. After teasing us last year with a strong increase in employment, manufacturing expectations are tempered this year as the economy faltered during much of 2012. This year companies expect on average 22 hires per company, of which 16 will be Bachelor’s degree holders. Hiring at this degree level will be down 1 percent this year, essentially unchanged from last year. Several manufactur-ing sectors are performing well and others are contracting their targets (table 6).
Retail. Retail appears to be surging with three years of steady increases in hiring targets. Total hires are expected to improve by 15 percent, averaging 43 hires per company. Most of the hiring will occur at the Bachelor’s degree level: hiring targets are up 25 percent and on average 36 hires per company are expected.
Transportation. Railroads, freight carriers, freight logistics support, and even the airlines will keep hiring positive for Bachelor’s degree holders. A 20 percent increase in posi-tions at this level is expected and on average 29 hires per company. Associate’s degree holders should also expect opportunities to improve this year.
Information. This sweeping sector, which encompasses publishing, telecommunications, broadcasting, Internet service, and web content providers, often fluctuates in its hiring projections. Last year we expected a modest increase in opportunities. This year improvement will be even stronger with an anticipated 36 percent increase in opportunities across all degree levels. Hiring for Bachelor’s degree holders is expected to increase by 23 percent, with bigger gains at the MBA and Master’s degree levels.
Finance and Insurance. This sector continues to stir and shake. The banking sector expects on average 26 hires per
[% ]Construction is enjoying a modest rebound: total hiring is expected to be up 4% over last year.
Increase or Decrease in BA/BS Hiring By Sector
Agriculture and Natural Resources
+76%
Mining and Oil +7%Utilities +1%Construction +7%Manufacturing -2%Wholesale +12%Retail +25%Transportation +20%
Information +23%Finance and Insurance +8%Leasing and Real Estate +9%Professional Services +5%Administrative Services +22%Education -1%Entertainment And Arts >99%Hospitality +13%Nonprofit Organization +3%Government +4%
RECRUITING TRENDS 2011-2012
19
company. After several years of contraction the banking segment will increase hires by 4 percent this year. However, MBA hiring among banks continues to trend down. Other segments of this sector also expect to expand opportu-nities: credit intermediation will increase hiring by 34 percent; mortgage and nonmortgage loan brokerage, 9 per-cent; financial services, 6 percent; and insurance, 7 percent.
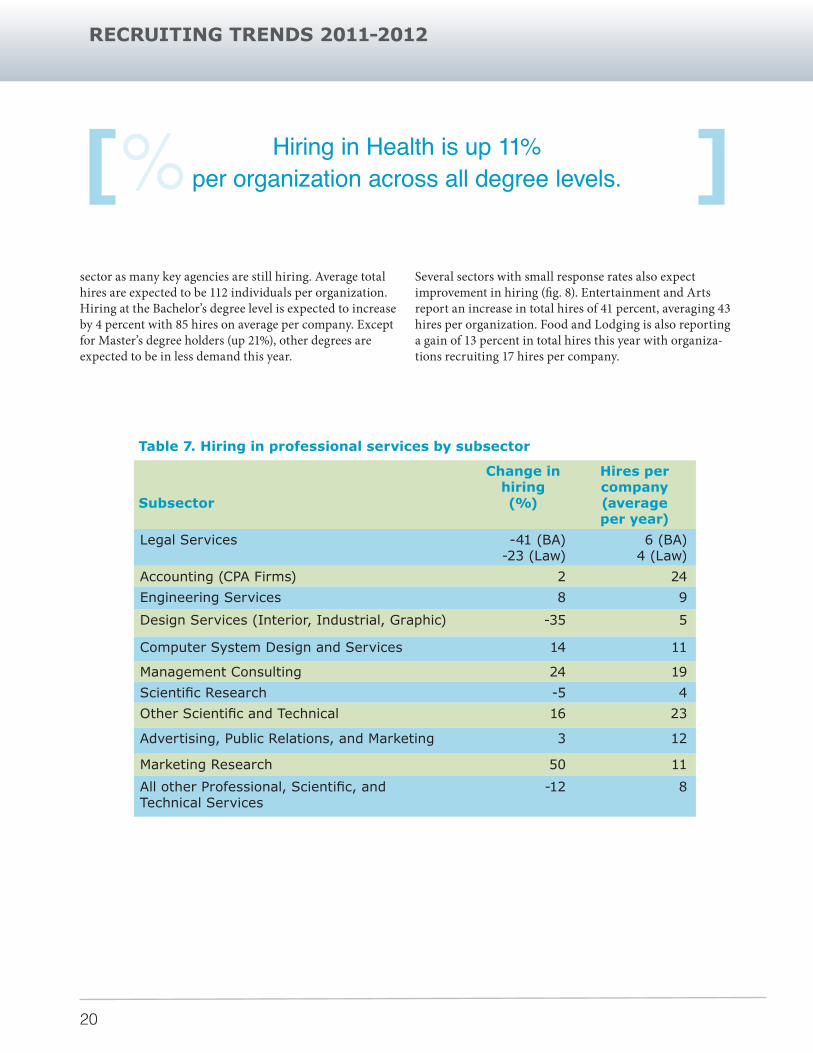
Professional Services. The most important sector for col-lege hiring encompasses accounting, engineering services, computer services, management consulting, scientific research, advertising, and marketing services, to name a few subsectors. This sector often portends the overall labor market for new graduates in any given year. This year total hires will be down slightly, averaging 17 per company (table 7). At the Bachelor’s degree level, hiring is expected to grow by 6 percent (averaging 12 hires per company) while advanced degree holders will experience a decline in opportunities. Hiring for MBAs, however, will remain the same as last year.
Education. Education is always difficult to predict at this time of year because most secondary schools will not know their hiring needs until next spring. We received a strong response from school districts and additional representa-tion from education-delivery organizations (tutoring and education consulting). Education organizations expect to hire 69 individuals on average across all degree levels. At
this time respondents indicated that positions for Bache-lor’s degree holders will be down slightly from the number they hired for this fall.
Health. The health services sector seems to be perking up. For several years health organizations have reined in hiring. This year they expect to make a total hire of 55 in-dividuals (up 11%) per organization across all degree levels. This increase is being led by a 22 percent improvement in hiring for Bachelor’s degree holders and improvement at the Ph.D. and Professional degree levels. While hiring at the Master’s degree level will remain the same, hiring for MBAs is expected to fall by 23 percent and for Associate’s degree holders by 5 percent.
Nonprofit Organizations (NPO). NPOs plays an important role in college hiring. Responses from this sector ranked third among all sectors (10% of the total response). Despite the troubled economy, NPOs remain resilient at least for hiring at the Bachelor’s degree level, which is expected to increase by 3 percent. Total hiring in this sector, however, will remain at last year’s target at the Associate’s degree, Master’s degree and Ph.D. levels. MBAs will enjoy a slight increase in opportunities.
Government. Overall government hiring will be down 3 percent across all degree levels with the largest declines be-ing reported by state and local agencies and offices. Hiring among federal agencies has minimized the job loss in this
Table 6. Hiring in manufacturing subsectors, 2011-2012
Sector
Change in BA/BS
hiring (%)
Hires per company (average)
Food Processing 14 14
Printing and Related Activities 30 58Chemical 16 21Primary Metals 19 23Machinery 21 16All Other Manufacturing 5 14Computer and Electronic -32 21Electrical Equipment -19 15Aircraft -33 28Fabricated Metals -11 2Surgical Equipment -22 4
RECRUITING TRENDS 2011-2012
20
[% ]Hiring in Health is up 11% per organization across all degree levels.
sector as many key agencies are still hiring. Average total hires are expected to be 112 individuals per organization. Hiring at the Bachelor’s degree level is expected to increase by 4 percent with 85 hires on average per company. Except for Master’s degree holders (up 21%), other degrees are expected to be in less demand this year.
Several sectors with small response rates also expect improvement in hiring (fig. 8). Entertainment and Arts report an increase in total hires of 41 percent, averaging 43 hires per organization. Food and Lodging is also reporting a gain of 13 percent in total hires this year with organiza-tions recruiting 17 hires per company.
Table 7. Hiring in professional services by subsector
Subsector
Change in hiring (%)
Hires per company (average per year)
Legal Services -41 (BA) -23 (Law)
6 (BA) 4 (Law)
Accounting (CPA Firms) 2 24Engineering Services 8 9
Design Services (Interior, Industrial, Graphic) -35 5
Computer System Design and Services 14 11
Management Consulting 24 19Scientific Research -5 4Other Scientific and Technical 16 23
Advertising, Public Relations, and Marketing 3 12
Marketing Research 50 11
All other Professional, Scientific, and Technical Services
-12 8
RECRUITING TRENDS 2011-2012
21
Figure 8. Increase or decrease in hiring, 2011-2012
Adm
inis
trat
ive
Ser
vice
s A
gri
cult
ura
l Pro
duct
ion
Con
stru
ctio
n
Educa
tion
En
tert
ainm
ent
and A
rts
Finan
ce a
nd I
nsu
rance
Gov
ernm
ent
Hea
lth
Hos
pit
alit
y
Associate's BA/BS MBA MA/MS Ph.D. Professional Total
Info
rmat
ion
Leas
ing a
nd R
eal Est
ate
Man
ufa
ctu
rin
g
Min
ing a
nd O
il
Non
pro
fit
Pro
fess
ion
al S
ervi
ces
Ret
ail
Tra
nsp
ort
atio
n
Uti
liti
es
Wh
ole
sale
Associate's BA/BS MBA MA/MS Ph.D. Professional Total
RECRUITING TRENDS 2011-2012
22
The Southern and Great Lakes regions will experience double-digit growth in job opportunities.[ ]
HIRING BY REGION
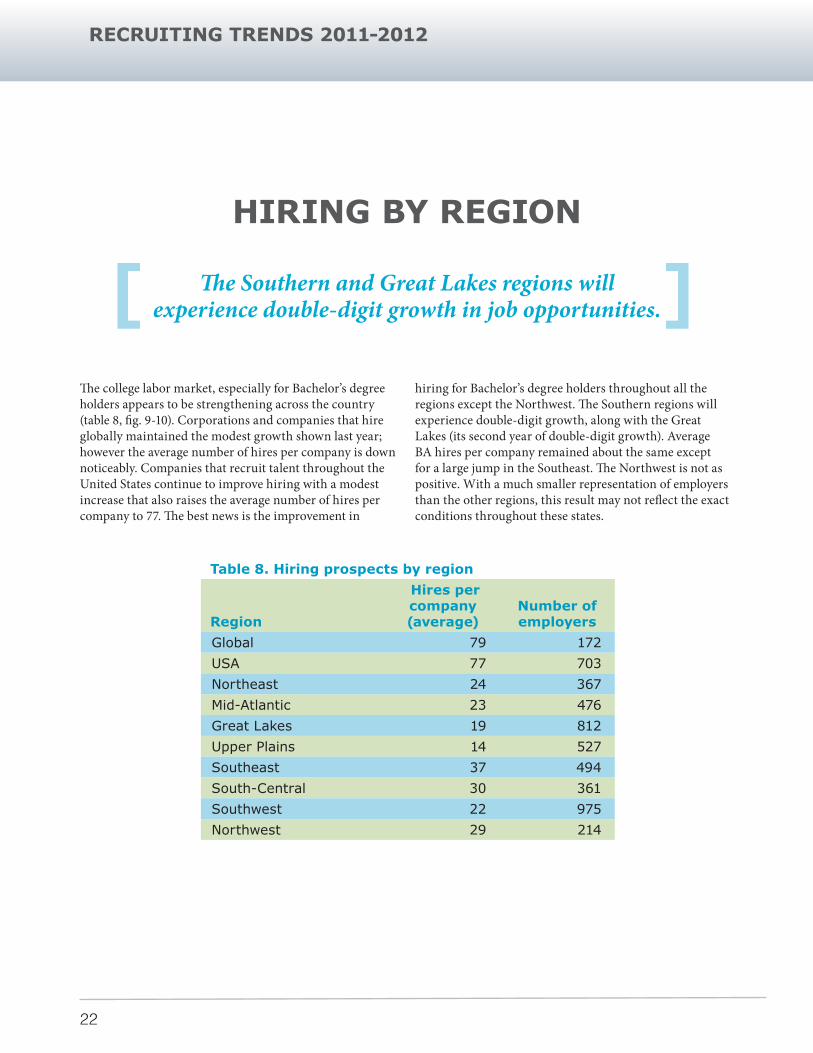
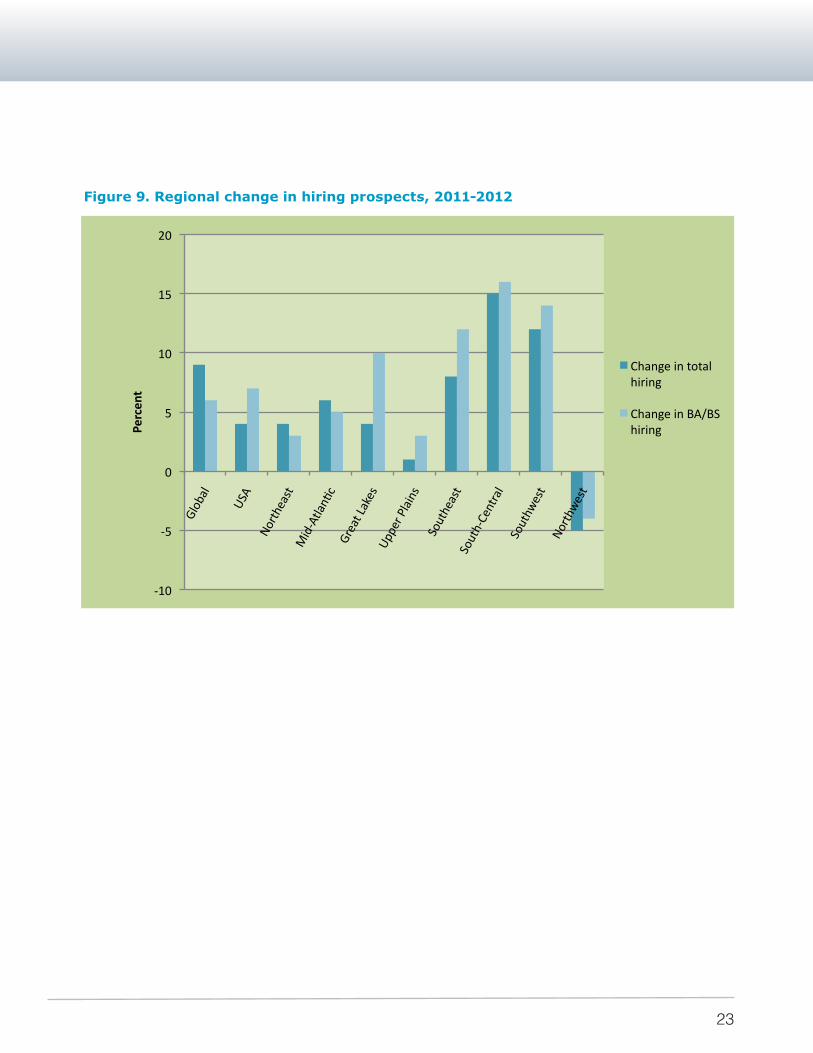
The college labor market, especially for Bachelor’s degree holders appears to be strengthening across the country (table 8, fig. 9-10). Corporations and companies that hire globally maintained the modest growth shown last year; however the average number of hires per company is down noticeably. Companies that recruit talent throughout the United States continue to improve hiring with a modest increase that also raises the average number of hires per company to 77. The best news is the improvement in
Table 8. Hiring prospects by region
Region
Hires per company (average)
Number of employers
Global 79 172USA 77 703Northeast 24 367Mid-Atlantic 23 476Great Lakes 19 812Upper Plains 14 527Southeast 37 494South-Central 30 361Southwest 22 975Northwest 29 214
hiring for Bachelor’s degree holders throughout all the regions except the Northwest. The Southern regions will experience double-digit growth, along with the Great Lakes (its second year of double-digit growth). Average BA hires per company remained about the same except for a large jump in the Southeast. The Northwest is not as positive. With a much smaller representation of employers than the other regions, this result may not reflect the exact conditions throughout these states.
RECRUITING TRENDS 2011-2012
23
-‐10
-‐5
0
5
10
15
20
Glob
al
USA
Nort
heas
t M
id-‐A
tlan9
c Gr
eat L
akes
Up
per P
lain
s So
uthe
ast
Sout
h-‐Ce
ntra
l So
uthw
est
Nort
hwes
t
Percen
t
Change in total hiring
Change in BA/BS hiring
Figure 9. Regional change in hiring prospects, 2011-2012
RECRUITING TRENDS 2011-2012
24
AL
AZ AR
CA CO
CT
DE
FL
GA
ID
IL IN
IA
KS KY
LA
ME
MD
MA
MI
MN
MS
MO
MN
NE NV
NH
NJ
NM
NY
NC
ND
OH
OK
OR
PA RI
SC
SD
TN
TX
UT
VT
VA
WA
WV
WI
WY
HI
AK
DC
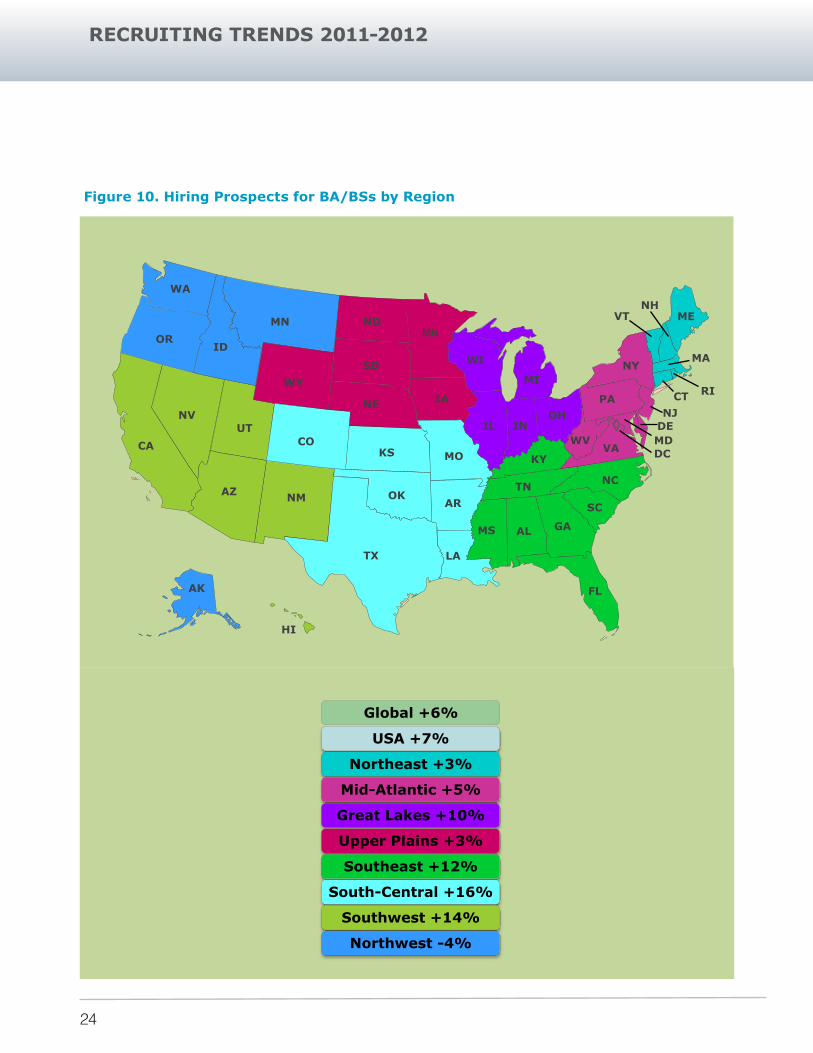
Figure 10. Hiring Prospects for BA/BSs by Region
Global +6%
USA +7%
Northeast +3%
Mid-Atlantic +5%
Great Lakes +10%
Upper Plains +3%
Southeast +12%
South-Central +16%
Southwest +14%
Northwest -4%
RECRUITING TRENDS 2011-2012
25
Social media provide increasingly important tools for recruiters.[ ]
RECRUITING STRATEGIES AND HIRING
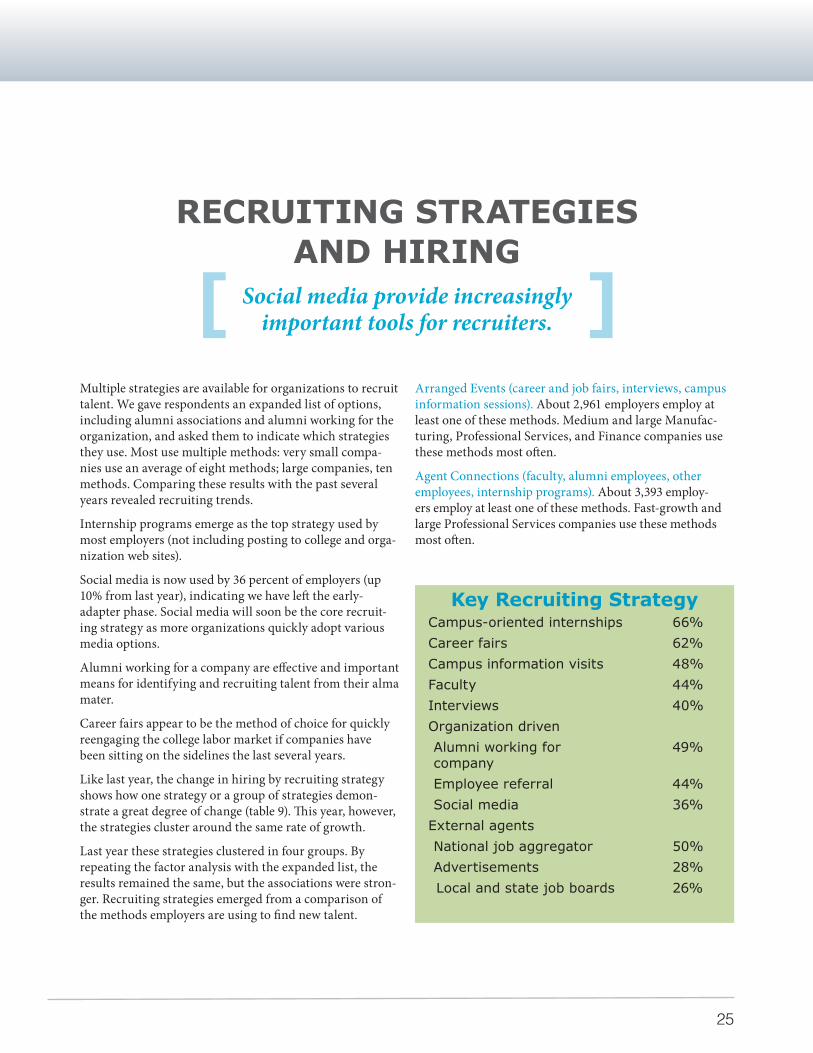
Multiple strategies are available for organizations to recruit talent. We gave respondents an expanded list of options, including alumni associations and alumni working for the organization, and asked them to indicate which strategies they use. Most use multiple methods: very small compa-nies use an average of eight methods; large companies, ten methods. Comparing these results with the past several years revealed recruiting trends.
Internship programs emerge as the top strategy used by most employers (not including posting to college and orga-nization web sites).
Social media is now used by 36 percent of employers (up 10% from last year), indicating we have left the early-adapter phase. Social media will soon be the core recruit-ing strategy as more organizations quickly adopt various media options.
Alumni working for a company are effective and important means for identifying and recruiting talent from their alma mater.
Career fairs appear to be the method of choice for quickly reengaging the college labor market if companies have been sitting on the sidelines the last several years.
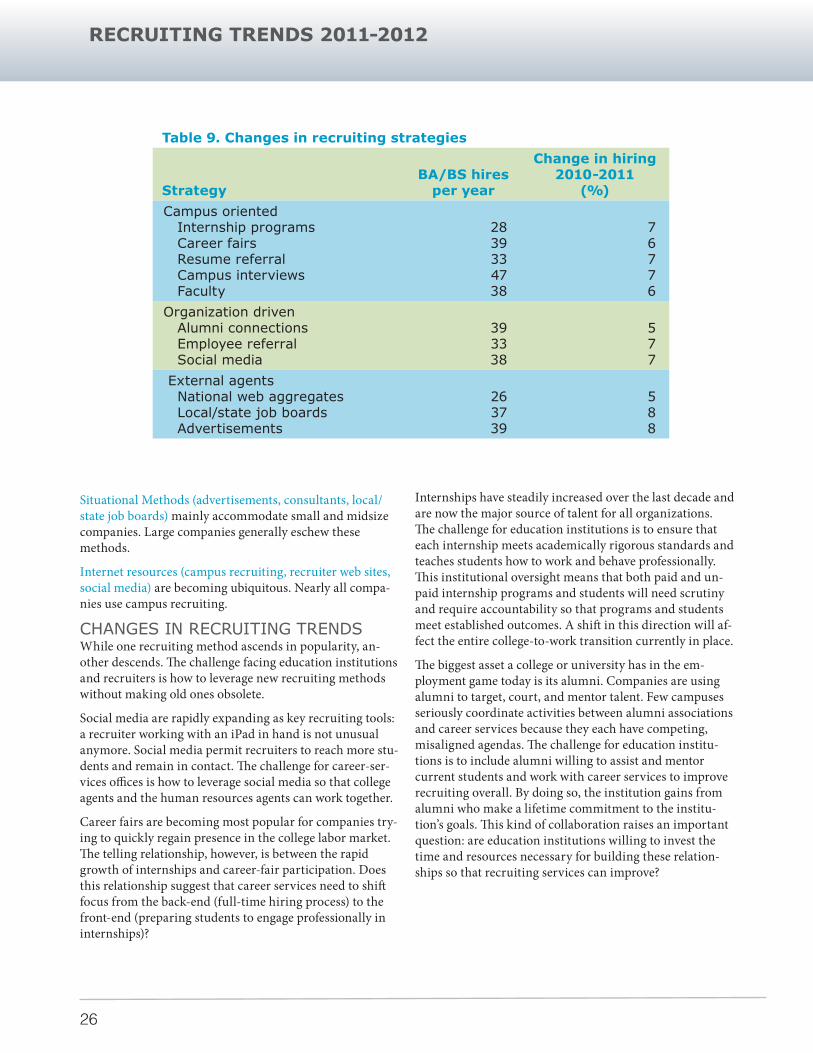
Like last year, the change in hiring by recruiting strategy shows how one strategy or a group of strategies demon-strate a great degree of change (table 9). This year, however, the strategies cluster around the same rate of growth.
Last year these strategies clustered in four groups. By repeating the factor analysis with the expanded list, the results remained the same, but the associations were stron-ger. Recruiting strategies emerged from a comparison of the methods employers are using to find new talent.
Arranged Events (career and job fairs, interviews, campus information sessions). About 2,961 employers employ at least one of these methods. Medium and large Manufac-turing, Professional Services, and Finance companies use these methods most often.
Agent Connections (faculty, alumni employees, other employees, internship programs). About 3,393 employ-ers employ at least one of these methods. Fast-growth and large Professional Services companies use these methods most often.
Key Recruiting StrategyCampus-oriented internships 66%Career fairs 62%Campus information visits 48%Faculty 44%Interviews 40%Organization drivenAlumni working for company
49%
Employee referral 44%Social media 36%
External agentsNational job aggregator 50%Advertisements 28%Local and state job boards 26%
RECRUITING TRENDS 2011-2012
26
Situational Methods (advertisements, consultants, local/state job boards) mainly accommodate small and midsize companies. Large companies generally eschew these methods.
Internet resources (campus recruiting, recruiter web sites, social media) are becoming ubiquitous. Nearly all compa-nies use campus recruiting.
CHANGES IN RECRUITING TRENDSWhile one recruiting method ascends in popularity, an-other descends. The challenge facing education institutions and recruiters is how to leverage new recruiting methods without making old ones obsolete.
Social media are rapidly expanding as key recruiting tools: a recruiter working with an iPad in hand is not unusual anymore. Social media permit recruiters to reach more stu-dents and remain in contact. The challenge for career-ser-vices offices is how to leverage social media so that college agents and the human resources agents can work together.
Career fairs are becoming most popular for companies try-ing to quickly regain presence in the college labor market. The telling relationship, however, is between the rapid growth of internships and career-fair participation. Does this relationship suggest that career services need to shift focus from the back-end (full-time hiring process) to the front-end (preparing students to engage professionally in internships)?
Internships have steadily increased over the last decade and are now the major source of talent for all organizations. The challenge for education institutions is to ensure that each internship meets academically rigorous standards and teaches students how to work and behave professionally. This institutional oversight means that both paid and un-paid internship programs and students will need scrutiny and require accountability so that programs and students meet established outcomes. A shift in this direction will af-fect the entire college-to-work transition currently in place.
The biggest asset a college or university has in the em-ployment game today is its alumni. Companies are using alumni to target, court, and mentor talent. Few campuses seriously coordinate activities between alumni associations and career services because they each have competing, misaligned agendas. The challenge for education institu-tions is to include alumni willing to assist and mentor current students and work with career services to improve recruiting overall. By doing so, the institution gains from alumni who make a lifetime commitment to the institu-tion’s goals. This kind of collaboration raises an important question: are education institutions willing to invest the time and resources necessary for building these relation-ships so that recruiting services can improve?
Table 9. Changes in recruiting strategies
StrategyBA/BS hires
per year
Change in hiring 2010-2011
(%)Campus oriented Internship programs Career fairs Resume referral Campus interviews Faculty
2839334738
76776
Organization driven Alumni connections Employee referral Social media
393338
577
External agents National web aggregates Local/state job boards Advertisements
263739
588
RECRUITING TRENDS 2011-2012
27
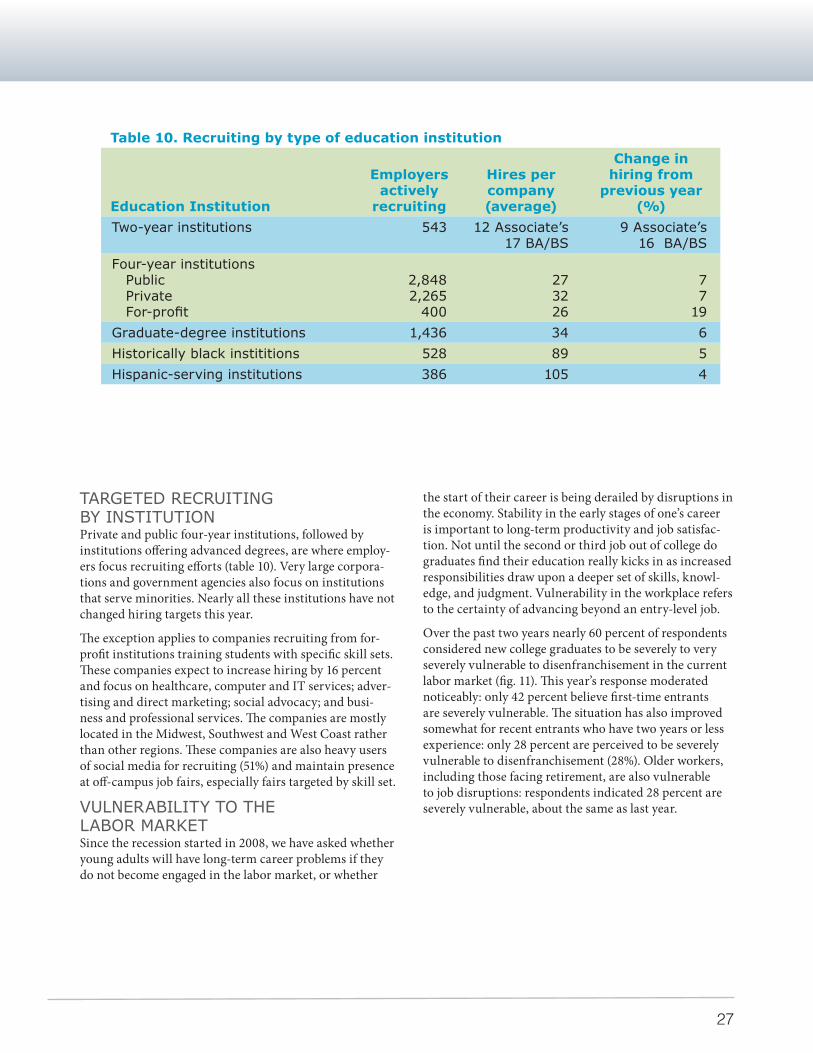
TARGETED RECRUITING BY INSTITUTIONPrivate and public four-year institutions, followed by institutions offering advanced degrees, are where employ-ers focus recruiting efforts (table 10). Very large corpora-tions and government agencies also focus on institutions that serve minorities. Nearly all these institutions have not changed hiring targets this year.
The exception applies to companies recruiting from for-profit institutions training students with specific skill sets. These companies expect to increase hiring by 16 percent and focus on healthcare, computer and IT services; adver-tising and direct marketing; social advocacy; and busi-ness and professional services. The companies are mostly located in the Midwest, Southwest and West Coast rather than other regions. These companies are also heavy users of social media for recruiting (51%) and maintain presence at off-campus job fairs, especially fairs targeted by skill set.
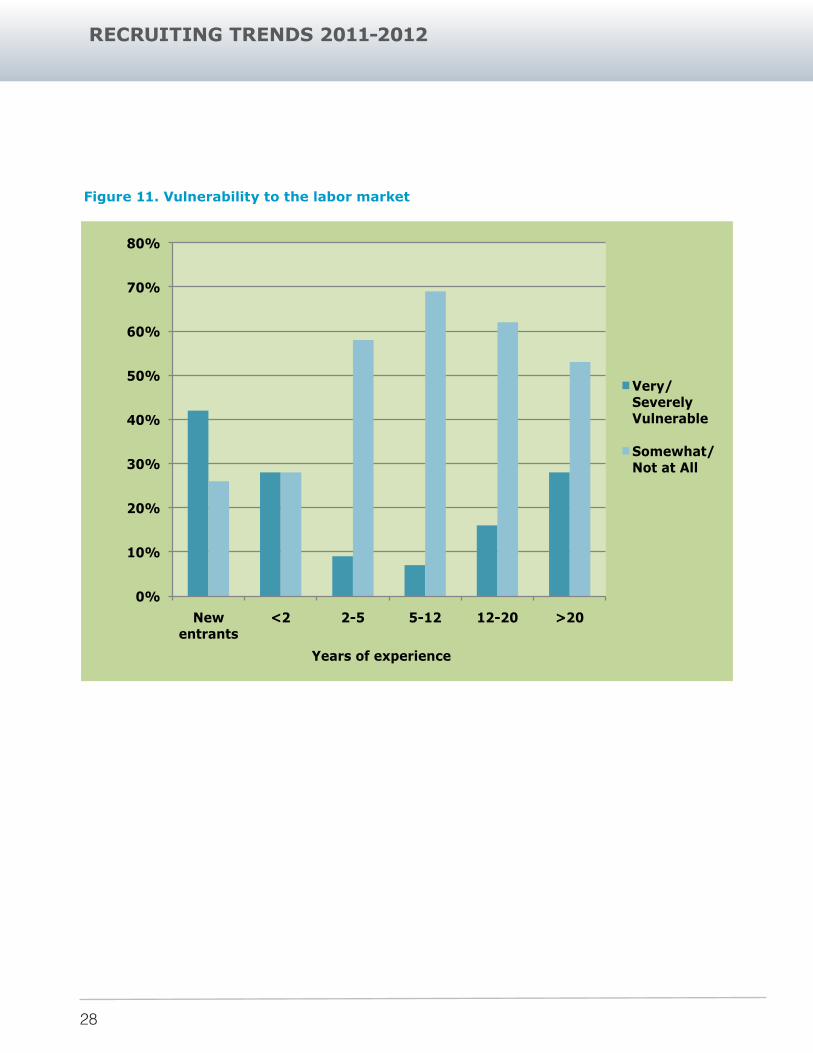
VULNERABILITY TO THE LABOR MARKETSince the recession started in 2008, we have asked whether young adults will have long-term career problems if they do not become engaged in the labor market, or whether
the start of their career is being derailed by disruptions in the economy. Stability in the early stages of one’s career is important to long-term productivity and job satisfac-tion. Not until the second or third job out of college do graduates find their education really kicks in as increased responsibilities draw upon a deeper set of skills, knowl-edge, and judgment. Vulnerability in the workplace refers to the certainty of advancing beyond an entry-level job.
Over the past two years nearly 60 percent of respondents considered new college graduates to be severely to very severely vulnerable to disenfranchisement in the current labor market (fig. 11). This year’s response moderated noticeably: only 42 percent believe first-time entrants are severely vulnerable. The situation has also improved somewhat for recent entrants who have two years or less experience: only 28 percent are perceived to be severely vulnerable to disenfranchisement (28%). Older workers, including those facing retirement, are also vulnerable to job disruptions: respondents indicated 28 percent are severely vulnerable, about the same as last year.
Table 10. Recruiting by type of education institution
Education Institution
Employers actively
recruiting
Hires per company (average)
Change in hiring from
previous year (%)
Two-year institutions 543 12 Associate’s17 BA/BS
9 Associate’s16 BA/BS
Four-year institutions Public Private For-profit
2,8482,265
400
273226
77
19Graduate-degree institutions 1,436 34 6Historically black instititions 528 89 5Hispanic-serving institutions 386 105 4
RECRUITING TRENDS 2011-2012
28
0%
10%
20%
30%
40%
50%
60%
70%
80%
New entrants
<2 2-5 5-12 12-20 >20
Years of experience
Very/Severely Vulnerable
Somewhat/Not at All
Figure 11. Vulnerability to the labor market
RECRUITING TRENDS 2011-2012
29
Accounting and computer science top the list again this year.
POSITIONS FILLED
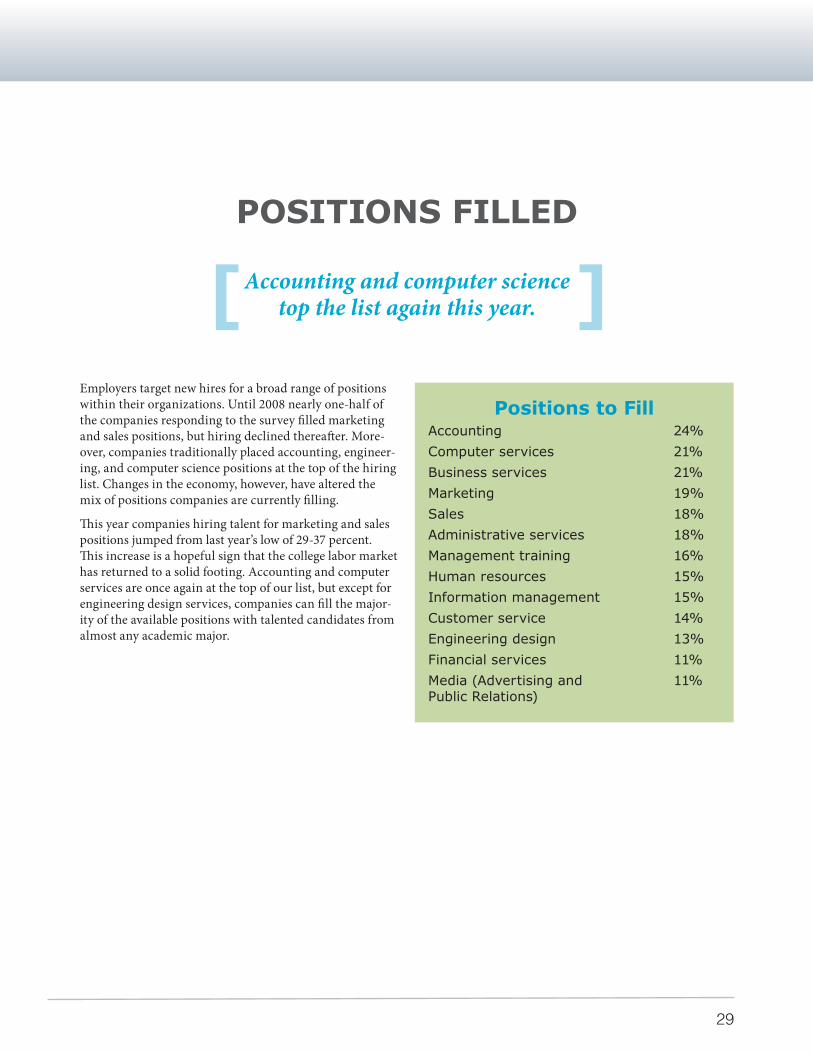
[ ]Employers target new hires for a broad range of positions within their organizations. Until 2008 nearly one-half of the companies responding to the survey filled marketing and sales positions, but hiring declined thereafter. More-over, companies traditionally placed accounting, engineer-ing, and computer science positions at the top of the hiring list. Changes in the economy, however, have altered the mix of positions companies are currently filling.
This year companies hiring talent for marketing and sales positions jumped from last year’s low of 29-37 percent. This increase is a hopeful sign that the college labor market has returned to a solid footing. Accounting and computer services are once again at the top of our list, but except for engineering design services, companies can fill the major-ity of the available positions with talented candidates from almost any academic major.
Positions to FillAccounting 24%Computer services 21%Business services 21%Marketing 19%Sales 18%Administrative services 18%Management training 16%Human resources 15%Information management 15%Customer service 14%Engineering design 13%Financial services 11%Media (Advertising and Public Relations)
11%
RECRUITING TRENDS 2011-2012
30
Employers do not expect to increase starting salaries this year.[ ]
STARTING SALARIES
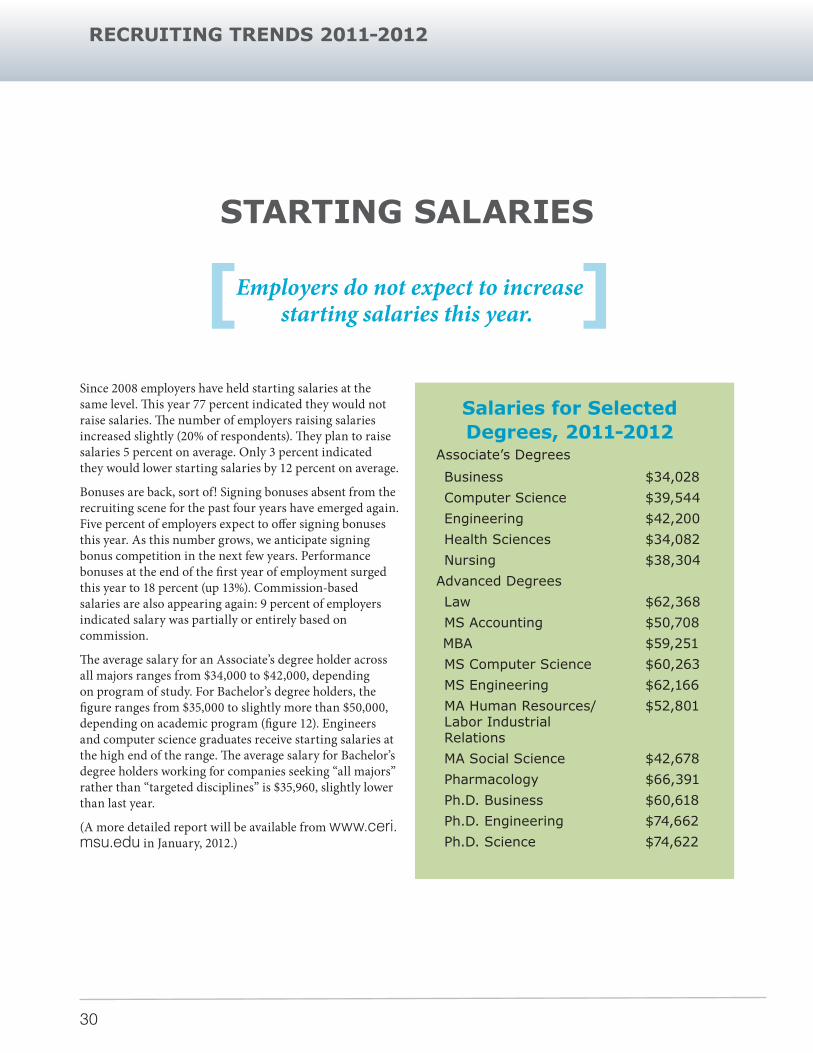
Since 2008 employers have held starting salaries at the same level. This year 77 percent indicated they would not raise salaries. The number of employers raising salaries increased slightly (20% of respondents). They plan to raise salaries 5 percent on average. Only 3 percent indicated they would lower starting salaries by 12 percent on average.
Bonuses are back, sort of! Signing bonuses absent from the recruiting scene for the past four years have emerged again. Five percent of employers expect to offer signing bonuses this year. As this number grows, we anticipate signing bonus competition in the next few years. Performance bonuses at the end of the first year of employment surged this year to 18 percent (up 13%). Commission-based salaries are also appearing again: 9 percent of employers indicated salary was partially or entirely based on commission.
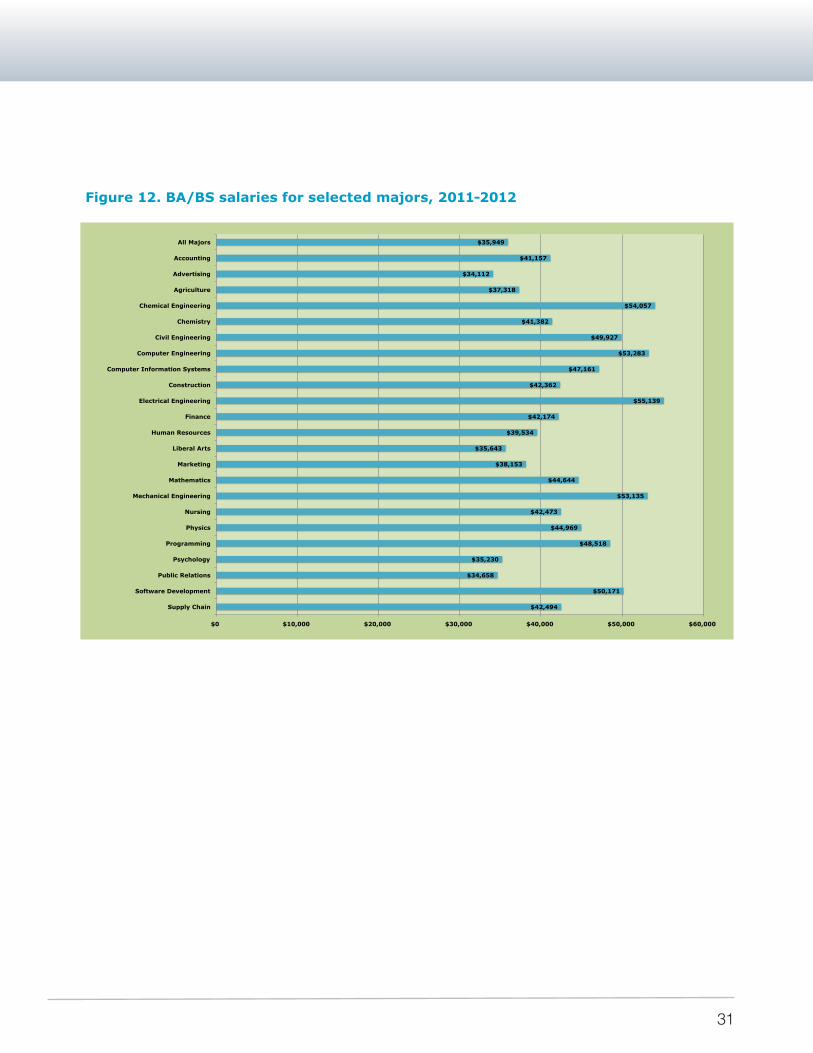
The average salary for an Associate’s degree holder across all majors ranges from $34,000 to $42,000, depending on program of study. For Bachelor’s degree holders, the figure ranges from $35,000 to slightly more than $50,000, depending on academic program (figure 12). Engineers and computer science graduates receive starting salaries at the high end of the range. The average salary for Bachelor’s degree holders working for companies seeking “all majors” rather than “targeted disciplines” is $35,960, slightly lower than last year.
(A more detailed report will be available from www.ceri.msu.edu in January, 2012.)
Salaries for Selected Degrees, 2011-2012
Associate’s Degrees
Business $34,028Computer Science $39,544Engineering $42,200Health Sciences $34,082Nursing $38,304
Advanced DegreesLaw $62,368MS Accounting $50,708MBA $59,251MS Computer Science $60,263MS Engineering $62,166MA Human Resources/ Labor Industrial Relations
$52,801
MA Social Science $42,678Pharmacology $66,391Ph.D. Business $60,618Ph.D. Engineering $74,662Ph.D. Science $74,622
RECRUITING TRENDS 2011-2012
31
Figure 12. BA/BS salaries for selected majors, 2011-2012
$42,494
$50,171
$34,658
$35,230
$48,518
$44,969
$42,473
$53,135
$44,644
$38,153
$35,643
$39,534
$42,174
$55,139
$42,362
$47,161
$53,283
$49,927
$41,382
$54,057
$37,318
$34,112
$41,157
$35,949
$0 $10,000 $20,000 $30,000 $40,000 $50,000 $60,000
Supply Chain
Software Development
Public Relations
Psychology
Programming
Physics
Nursing
Mechanical Engineering
Mathematics
Marketing
Liberal Arts
Human Resources
Finance
Electrical Engineering
Construction
Computer Information Systems
Computer Engineering
Civil Engineering
Chemistry
Chemical Engineering
Agriculture
Advertising
Accounting
All Majors
RECRUITING TRENDS 2011-2012
32
Employers are adding not only a solid number of jobs but also needed depth and breadth.[ ]
SHAPING COLLEGE HIRING
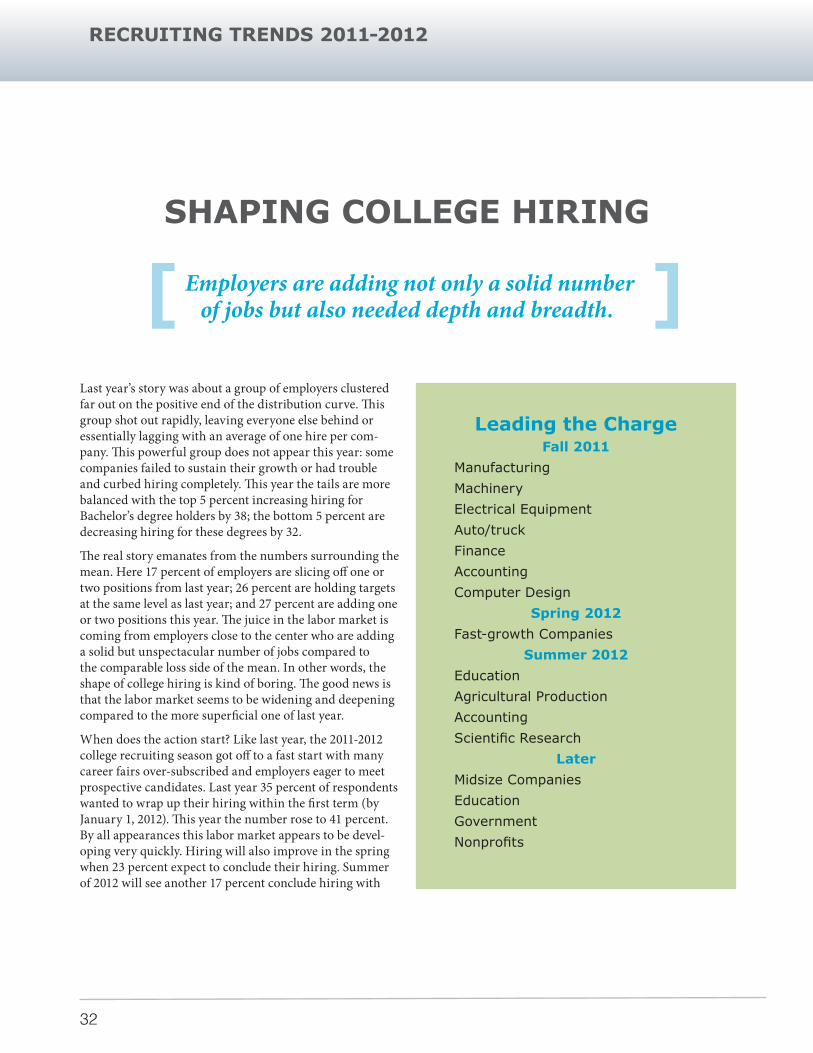
Last year’s story was about a group of employers clustered far out on the positive end of the distribution curve. This group shot out rapidly, leaving everyone else behind or essentially lagging with an average of one hire per com-pany. This powerful group does not appear this year: some companies failed to sustain their growth or had trouble and curbed hiring completely. This year the tails are more balanced with the top 5 percent increasing hiring for Bachelor’s degree holders by 38; the bottom 5 percent are decreasing hiring for these degrees by 32.
The real story emanates from the numbers surrounding the mean. Here 17 percent of employers are slicing off one or two positions from last year; 26 percent are holding targets at the same level as last year; and 27 percent are adding one or two positions this year. The juice in the labor market is coming from employers close to the center who are adding a solid but unspectacular number of jobs compared to the comparable loss side of the mean. In other words, the shape of college hiring is kind of boring. The good news is that the labor market seems to be widening and deepening compared to the more superficial one of last year.
When does the action start? Like last year, the 2011-2012 college recruiting season got off to a fast start with many career fairs over-subscribed and employers eager to meet prospective candidates. Last year 35 percent of respondents wanted to wrap up their hiring within the first term (by January 1, 2012). This year the number rose to 41 percent. By all appearances this labor market appears to be devel-oping very quickly. Hiring will also improve in the spring when 23 percent expect to conclude their hiring. Summer of 2012 will see another 17 percent conclude hiring with
Leading the ChargeFall 2011
Manufacturing MachineryElectrical EquipmentAuto/truckFinanceAccounting Computer Design
Spring 2012Fast-growth Companies
Summer 2012EducationAgricultural ProductionAccountingScientific Research
LaterMidsize CompaniesEducationGovernmentNonprofits
RECRUITING TRENDS 2011-2012
33
the remaining 18 percent continuing into the fall of 2012. By season companies and specific sectors will finish hiring for Bachelor’s degree holders.
Fall 2011. Companies will increase hiring by 12 percent, averaging 32 hires per organization. Manufacturing (ma-chinery, electrical equipment, and auto/truck), Finance, and Professional Services (accounting and computer design services) will lead the charge.
Spring 2012. Companies will increase hiring by 14 percent, averaging 21 hires per organization. Fast-growth compa-nies will take the lead. Manufacturing (food processing, primary metals, and aircraft) and Professional Services (engineering services and scientific research) will follow closely behind.
About 41% of employers wanted to wrap up their hiring during the first term.[% ]
Summer 2012. These companies will keep hiring targets at the same level as last year, averaging 18 hires per organiza-tion. Education, Agricultural Production, and Professional Services (accounting and scientific research) will lead at this time.
Later. Companies in this group expect to decrease hiring by 10 percent but still hire 25 candidates per organization. More midsize companies appeared in this group than ex-pected. The education, nonprofit, and government sectors are represented in this group.
RECRUITING TRENDS 2011-2012
34
[ ] Most paid interns earn between $10 and $15 per hour.
INTERNSHIPS AND CO-OPS
Inviting internship and co-op program managers to take part in the survey has made our understanding of internship recruiting activities and intentions much richer than last year. Approximately 3,000 (71%) of respondents indicated their organization would be seeking interns and co-ops during the academic year. This number does not include organizations that support training for student teachers, clinical rotations for nursing and other health practitioners, and practicums for social work and other fields. After adjusting for multiple entries from the same organization, we estimate between 65-68 percent of respondents will seek interns and co-ops this year.
More than one-third of respondents plan to increase their intern recruiting targets; only 3 percent said they would reduce them. These employers plan to recruit an estimated 55,000 interns and co-ops.
The average number of intern/co-op hires per organization is 21. The range is very wide, from one to three thousand interns. Thus the large tail influences the average. The median number of interns/co-ops is five, and the most common number of interns is two. When the numbers for intern recruiting intentions are examined by economic sector, a consistent pattern emerges. The average number of hires across nearly all sectors hovers around 20 with Information Services at the high end of 36 and Wholesale and Accommodations (Food and Lodging) at the low end with 8 and 12, respectively. Both the median of 5 to 6 intern hires and the mode of 2 intern hires are constant for all sectors.
In the 2007 Trends survey, employers reported whether they offered paid, unpaid, or a combination of both internships. Three-quarters of employers said they offered paid internships while 10 percent offered only unpaid internships. Employers were then asked what they expected would happen with paid and unpaid internships
over the next five years: increase, decrease, or become more mixed. They expected that they would increase paid internships (62% would), increase unpaid internships (7% would), or offer both paid and unpaid internships (32%). These projects suggested more organizations would begin offering both forms of internship. Being mixed, it was difficult to determine the potential growth in paid and unpaid internships.
Five years later, the Trends survey asked employers wheth-er they were offering paid or unpaid internships. Sixty-six percent were offering paid internship, 18 percent unpaid and 16 percent a mix. The reader should not immediately assume that unpaid internships have grown over the past five years. Over this time period, our sample of organiza-tions has changed. In 2007 we had only 900 employers responding, today more than 3,000 respond. The mix has changed with the inclusion of more nonprofits, small com-panies, and local government agencies — long the home of unpaid internships. Because of the heated discussion surrounding unpaid internships, caution must be extended when using these figures.
How many organizations convert their interns and co-ops to full-time hires? Several years ago we asked this question and learned the conversion rate on average ranged from 35-50 percent for a typical organization. We probed this topic again this year for a contrast between interns and co-ops to determine which group had the better full-time conversion rate.
In the process we learned a lot about framing the conver-sion question. First, we encountered a noticeable group of employers who had no idea what their conversion rate was. Second, verb choice was important. We captured three very different measures in their response: they provided their preferred (what I dream of), expected (what I hope we will get), or real (what I really got) conversion rates.
RECRUITING TRENDS 2011-2012
35
Caution must therefore be exercised in interpreting these results. Third, a zero conversion rate had several different meanings
Employers provided opportunities for students out of a sense of responsibility to their profession and seldom con-verted any to full-time employment (e.g., student teachers, nursing, and other health practitioners).
Employers were not in a position to convert any interns/co-ops to full-time positions because of the economy. Employ-ers supported internships, knowing they would rarely hire one as an employee (e.g., nonprofit).
We made two calculations for the conversion rates. In the first calculation, we retained all reported conversion rates,
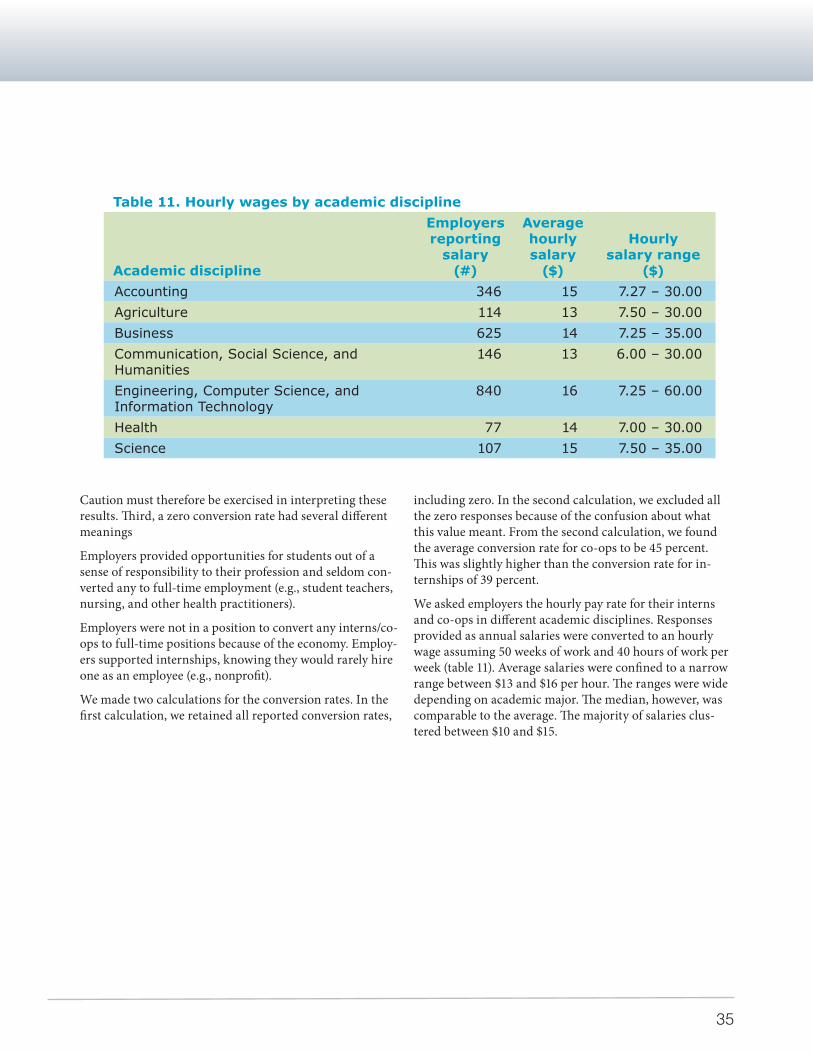
Table 11. Hourly wages by academic discipline
Academic discipline
Employers reporting
salary (#)
Average hourly salary
($)
Hourlysalary range
($)Accounting 346 15 7.27 – 30.00Agriculture 114 13 7.50 – 30.00Business 625 14 7.25 – 35.00Communication, Social Science, and Humanities
146 13 6.00 – 30.00
Engineering, Computer Science, and Information Technology
840 16 7.25 – 60.00
Health 77 14 7.00 – 30.00Science 107 15 7.50 – 35.00
including zero. In the second calculation, we excluded all the zero responses because of the confusion about what this value meant. From the second calculation, we found the average conversion rate for co-ops to be 45 percent. This was slightly higher than the conversion rate for in-ternships of 39 percent.
We asked employers the hourly pay rate for their interns and co-ops in different academic disciplines. Responses provided as annual salaries were converted to an hourly wage assuming 50 weeks of work and 40 hours of work per week (table 11). Average salaries were confined to a narrow range between $13 and $16 per hour. The ranges were wide depending on academic major. The median, however, was comparable to the average. The majority of salaries clus-tered between $10 and $15.
RECRUITING TRENDS 2011-2012
36
The H-1B visa is hot. Companies use the visa to hire the best talent wherever they can find it.[ ]
GLOBAL HIRING
Last year the Trends survey examined global hiring within U.S. companies (see www.ceri.msu.edu for the research brief) because the number of foreign students in U.S. col-leges and universities has been increasing significantly. This year the global hiring portion of the survey focused on company sponsorship of foreign nationals with the H-1B visa. This visa is a hot topic in some quarters because companies seek talent wherever they can find it. The ques-tions asked about the company’s use of the H-1B visa, their hiring intentions for next year, and the academic majors they would be sponsoring.
Fifteen percent of respondents (slightly more than 500 companies) indicated their company planned to sponsor hires with an H-1B visa.
Although large companies outnumbered all others, compa-nies from each size category were sponsoring workers.
Professional Services, Manufacturing, and Information Services were the sectors sponsoring the most H-1B visas.
Most companies (69%) planned to sponsor the same number of visas next year as they are currently sponsoring, but some are increasing (13%) or decreasing (17%) sponsor-ships.
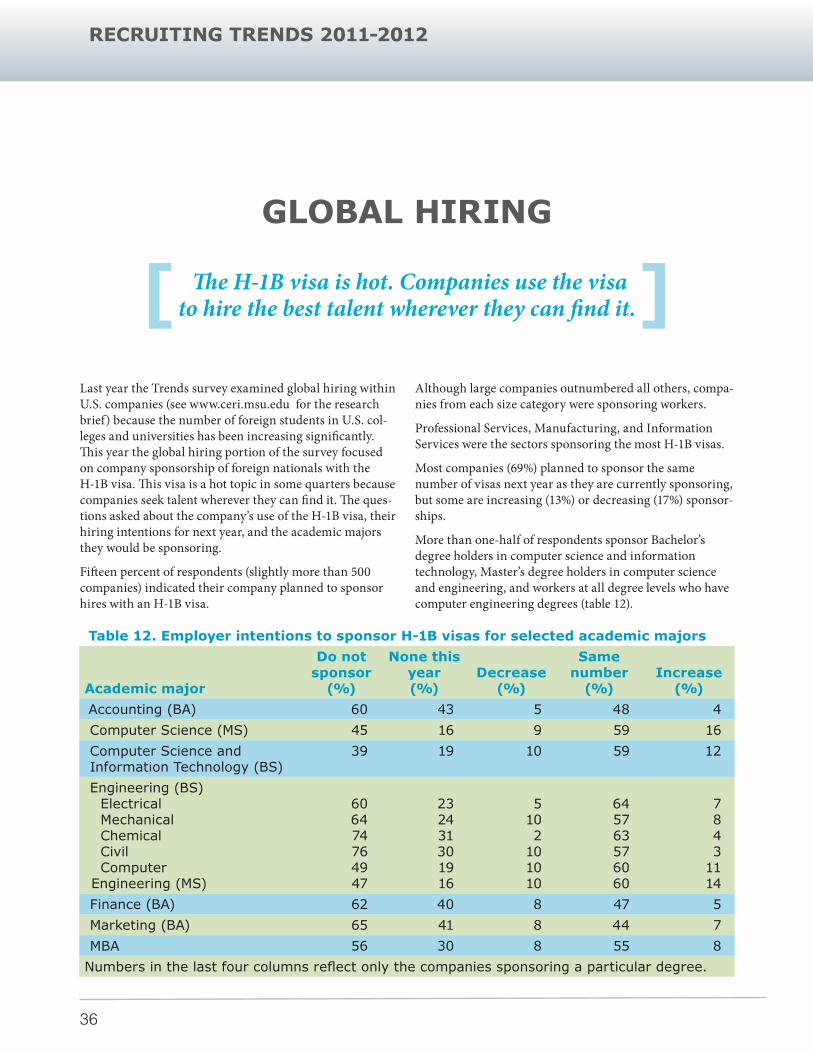
More than one-half of respondents sponsor Bachelor’s degree holders in computer science and information technology, Master’s degree holders in computer science and engineering, and workers at all degree levels who have computer engineering degrees (table 12).
Table 12. Employer intentions to sponsor H-1B visas for selected academic majors
Academic major
Do not sponsor
(%)
None this year(%)
Decrease (%)
Same number
(%)Increase
(%)Accounting (BA) 60 43 5 48 4Computer Science (MS) 45 16 9 59 16Computer Science and Information Technology (BS)
39 19 10 59 12
Engineering (BS)ElectricalMechanicalChemicalCivilComputer
Engineering (MS)
606474764947
232431301916
5102
101010
645763576060
7843
1114
Finance (BA) 62 40 8 47 5Marketing (BA) 65 41 8 44 7MBA 56 30 8 55 8
Numbers in the last four columns reflect only the companies sponsoring a particular degree.
RECRUITING TRENDS 2011-2012
37
[ ] Assessments have not become a major part of college recruiting.
COLLEGE RECRUITING ISSUES
Can companies find “fit” by using assessments? Companies organize their talent pipelines in two parts to find qualified candidates. The first part consists of an initial screening for the eligibility requirements (e.g., major, grade-point average, and work experience) a candidate must meet before he or she can be further vetted. These requirements are audited by the federal government when it examines an organization’s hiring practices. The second part consists of suitability requirements (e.g., people skills, personality); that is, interviewers and other company employees determine how well the candidate fits into the organization.
According to our friends who attend conferences at the Society of Human Resource Management (SHRM), the use of Emotional Intelligence Assessments is a hot-button topic. One could surmise that everyone is using these assessments and that, based on some presenters’ web sites, these assessments will identity the perfect candidate. This challenged us to see how extensively different forms of suitability assessments are used in college recruiting and look at other group methods used to determine people skills.
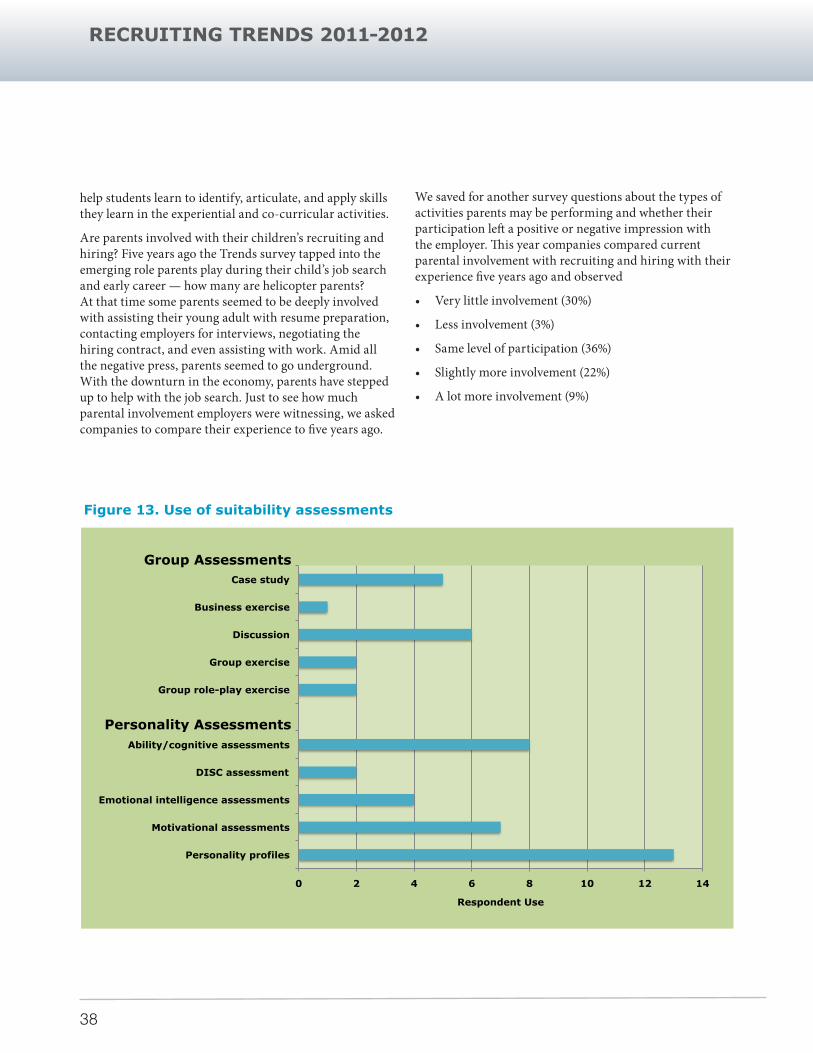
We gave a list of common suitability assessments to respondents and asked them to indicate which assessments they used (figure 13). We followed the same procedure for group exercises. The bottom line is simply that these assessments have not made their way into the college hiring process. This lack of use raises an important question: are suitability assessments another fad?
Tradeoffs – which college activities really count? The most requested topic from the CERI advisory board’s college members concerned rating, ranking, or comparing the college activities students can engage in with respect to the activity’s importance in the recruiting process. This
request presented a challenge: rankings (1 to 10) and ratings (level of importance) fail to actually differentiate between activities. To honestly capture how activities play into recruiting a researcher would have to set up a controlled experiment or conduct a paired-comparison experiment. The latter is an excellent but unwieldy method in the survey’s present format. After struggling with how to present this topic, several of our research partners settled on asking how each activity contributes to the development of the skills and competencies that comprise “people” or “soft” skills (e.g., teamwork, cultural awareness, and interpersonal aptitude).
These results merely reflect the perceptions respondents had about each activity (fig. 14). Individuals familiar with college recruiting posited a defining experience can come from any of these activities. Employers, however, believe an internship contributes most to the development of people or soft skills.
These results are not surprising. Students have not been able to adequately demonstrate the significant skills they have gained in study abroad (and in other co-curricular activities). Unlike internships that employers know a lot about, employers are generally unfamiliar with study abroad.
It is not enough just to have the experience; students must be able to intelligently discuss how the experience has helped them develop skills they can bring to bear in a professional setting. If a student merely communicates that the study abroad was “totally awesome,” employers assume the lowest common denominator of the study-abroad experience — a great vacation with ample pub crawls. International educators, faculty, study-abroad staff, career services, and others must make a conscientious effort to
RECRUITING TRENDS 2011-2012
38
help students learn to identify, articulate, and apply skills they learn in the experiential and co-curricular activities.
Are parents involved with their children’s recruiting and hiring? Five years ago the Trends survey tapped into the emerging role parents play during their child’s job search and early career — how many are helicopter parents? At that time some parents seemed to be deeply involved with assisting their young adult with resume preparation, contacting employers for interviews, negotiating the hiring contract, and even assisting with work. Amid all the negative press, parents seemed to go underground. With the downturn in the economy, parents have stepped up to help with the job search. Just to see how much parental involvement employers were witnessing, we asked companies to compare their experience to five years ago.
We saved for another survey questions about the types of activities parents may be performing and whether their participation left a positive or negative impression with the employer. This year companies compared current parental involvement with recruiting and hiring with their experience five years ago and observed
• Very little involvement (30%)
• Less involvement (3%)
• Same level of participation (36%)
• Slightly more involvement (22%)
• A lot more involvement (9%)
Figure 13. Use of suitability assessments
0 2 4 6 8 10 12 14
Personality profiles
Motivational assessments
Emotional intelligence assessments
DISC assessment
Ability/cognitive assessments
Group role-play exercise
Group exercise
Discussion
Business exercise
Case study
Respondent Use
Group Assessments
Personality Assessments
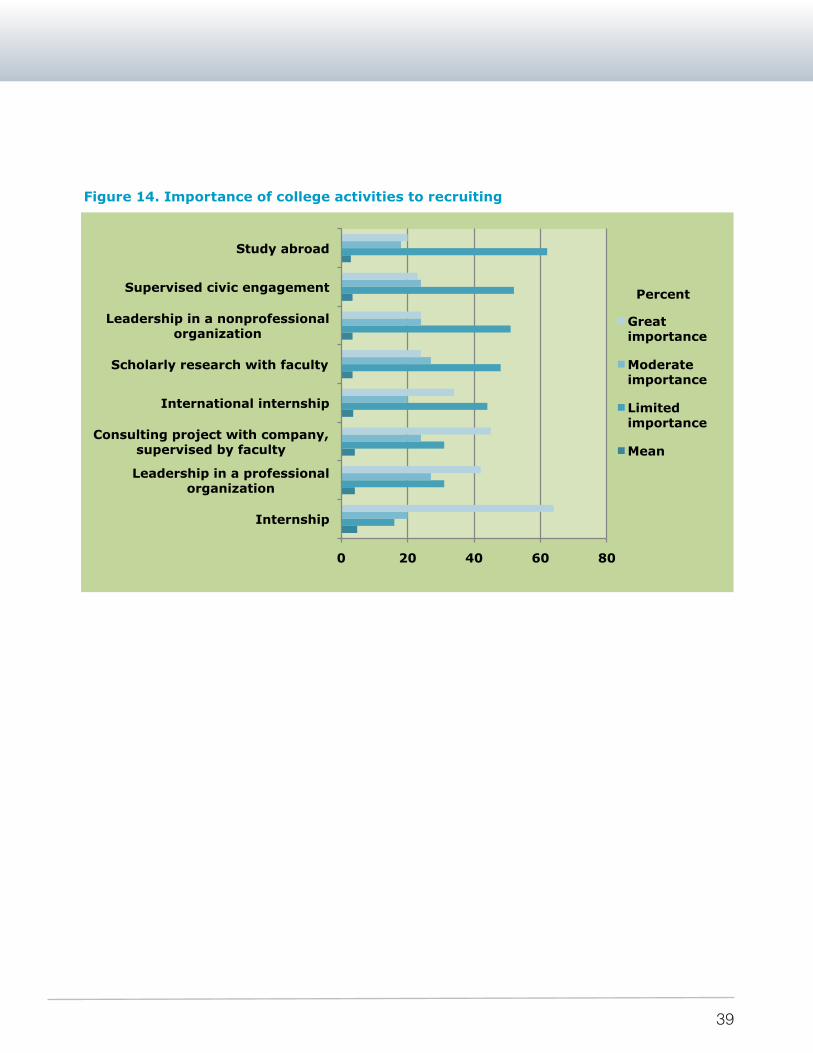
RECRUITING TRENDS 2011-2012
39
0 20 40 60 80
Internship
Leadership in a professional organization
Consulting project with company, supervised by faculty
International internship
Scholarly research with faculty
Leadership in a nonprofessional organization
Supervised civic engagement
Study abroad
Percent
Great importance
Moderate importance
Limited importance
Mean
Figure 14. Importance of college activities to recruiting
0 20 40 60 80
Internship
Leadership in a professional organization
Consulting project with company, supervised by faculty
International internship
Scholarly research with faculty
Leadership in a nonprofessional organization
Supervised civic engagement
Study abroad
Percent
Great importance
Moderate importance
Limited importance
Mean
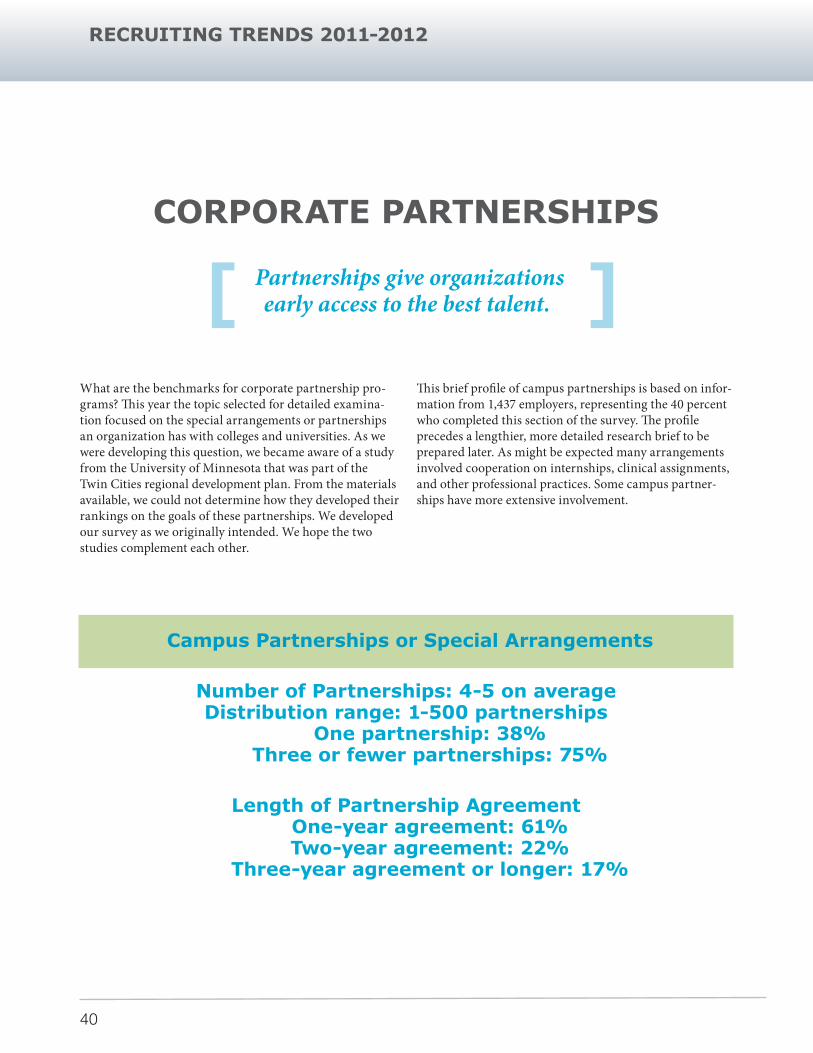
RECRUITING TRENDS 2011-2012
40
Partnerships give organizations early access to the best talent.[ ]
CORPORATE PARTNERSHIPS
What are the benchmarks for corporate partnership pro-grams? This year the topic selected for detailed examina-tion focused on the special arrangements or partnerships an organization has with colleges and universities. As we were developing this question, we became aware of a study from the University of Minnesota that was part of the Twin Cities regional development plan. From the materials available, we could not determine how they developed their rankings on the goals of these partnerships. We developed our survey as we originally intended. We hope the two studies complement each other.
This brief profile of campus partnerships is based on infor-mation from 1,437 employers, representing the 40 percent who completed this section of the survey. The profile precedes a lengthier, more detailed research brief to be prepared later. As might be expected many arrangements involved cooperation on internships, clinical assignments, and other professional practices. Some campus partner-ships have more extensive involvement.
Campus Partnerships or Special Arrangements
Number of Partnerships: 4-5 on averageDistribution range: 1-500 partnerships
One partnership: 38% Three or fewer partnerships: 75%
Length of Partnership Agreement One-year agreement: 61% Two-year agreement: 22% Three-year agreement or longer: 17%
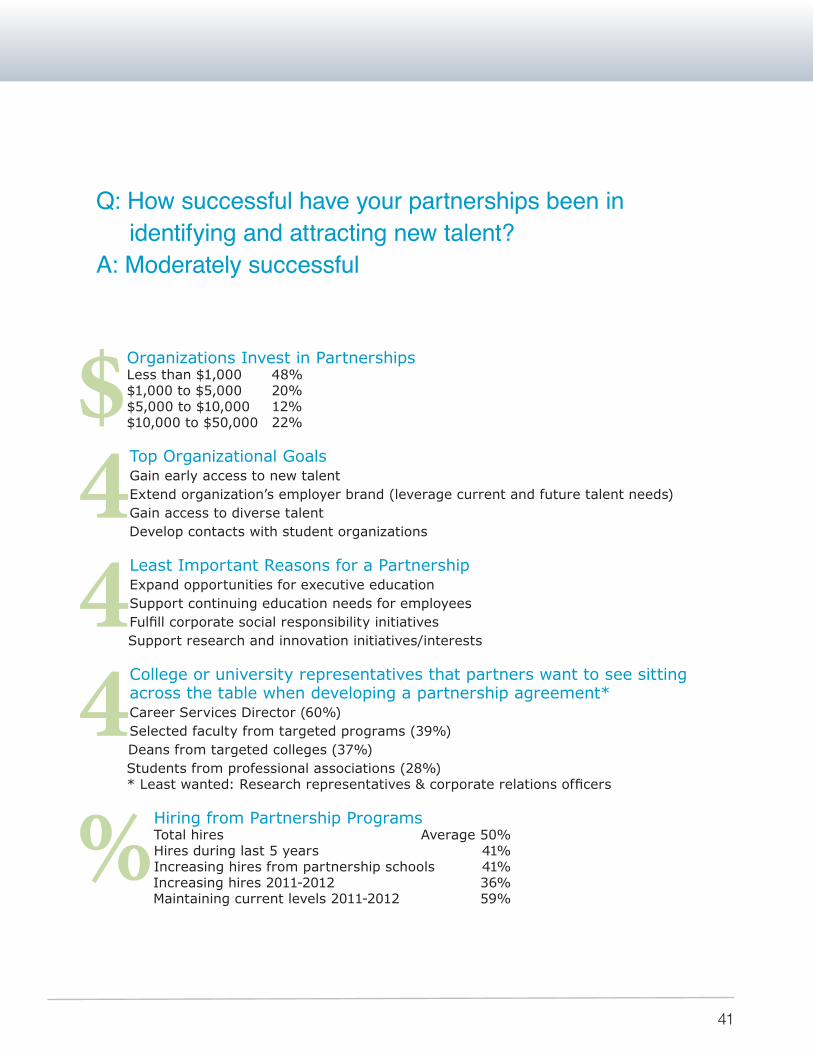
RECRUITING TRENDS 2011-2012
41
Q: How successful have your partnerships been in identifying and attracting new talent?A: Moderately successful
$Organizations Invest in PartnershipsLess than $1,000 48%$1,000 to $5,000 20%$5,000 to $10,000 12%$10,000 to $50,000 22%
4 Top Organizational GoalsGain early access to new talentExtend organization’s employer brand (leverage current and future talent needs)Gain access to diverse talentDevelop contacts with student organizations
4 Least Important Reasons for a PartnershipExpand opportunities for executive educationSupport continuing education needs for employeesFulfill corporate social responsibility initiativesSupport research and innovation initiatives/interests
4 College or university representatives that partners want to see sitting across the table when developing a partnership agreement*Career Services Director (60%)Selected faculty from targeted programs (39%)Deans from targeted colleges (37%)Students from professional associations (28%)* Least wanted: Research representatives & corporate relations officers
% Hiring from Partnership ProgramsTotal hires Average 50%Hires during last 5 years 41%Increasing hires from partnership schools 41%Increasing hires 2011-2012 36%Maintaining current levels 2011-2012 59%
RECRUITING TRENDS 2011-2012
42
This report marks fifteen years of my supervising the national labor market study for MSU. My nightmares during the month prior to its release are filled with dread that we will have nothing interesting to report. For fourteen years, we have always found an interesting story. This year, well, this year is different. The results are basically boring. We found consis-tency across economic sector, organizational size, academic major, and location. But you know what? Boring is good. Last year’s market was superficial. It did not run deep, and we did not know if it had legs for the long haul. This year’s market runs broader and deeper and is beginning to recover and expand across all fronts.
The college labor market can run upstream against the prevailing sluggish economy. As Manpower stated: demand trumps uncertainty. Companies simply have to hire. They have outstanding requisition (many since the early years of the previous decade) that now need to be filled. Baby boomers are retiring, and this trend will only accelerate over the next decade. The current workforce is exhausted, and this is showing up in productivity figures. Plus, employers need to revi-talize their skill base. All these factors are nudging the college labor market out of the doldrums, ahead of other segments of the labor market.
Small, midsize, and large organizations are all involved in this turn around. It is good to see that the hemorrhaging has finally stopped among midsize companies. We hope they are now positioned to capitalize on new growth opportunities over the next several years. A word of caution: we should not become too giddy. In the first place the uncertainty level within the economy, particularly among consumers, remains persistently high. Of course, world events and political chaos in Washington, D.C., keep the economy on edge. We may no longer be teetering on the edge of an abyss, but we still have a long way to go to have enough opportunities to meet the yearly supply of new college graduates.
The pressure will continue to mount for more accountability among higher education institutions to demonstrate their relevancy for preparing students to engage in meaningful employment after graduation. Our challenge is to align these students with the emerging opportunities witnessed in the two years of job growth and not leave them wandering lost, hoping something good happens. I would rather do this than catch my students at Occupy Wall Street – though they do have legitimate beefs. But this may not be the best way to use their creativity, knowledge, and energy. Putting them to work to solve our problems contributes more to society.
BE FOCUSED, BE DIRECTED & BE CONNECTED.
May this year be a successful one for you and your staff. Best wishes to all your graduates,
FINAL THOUGHTS
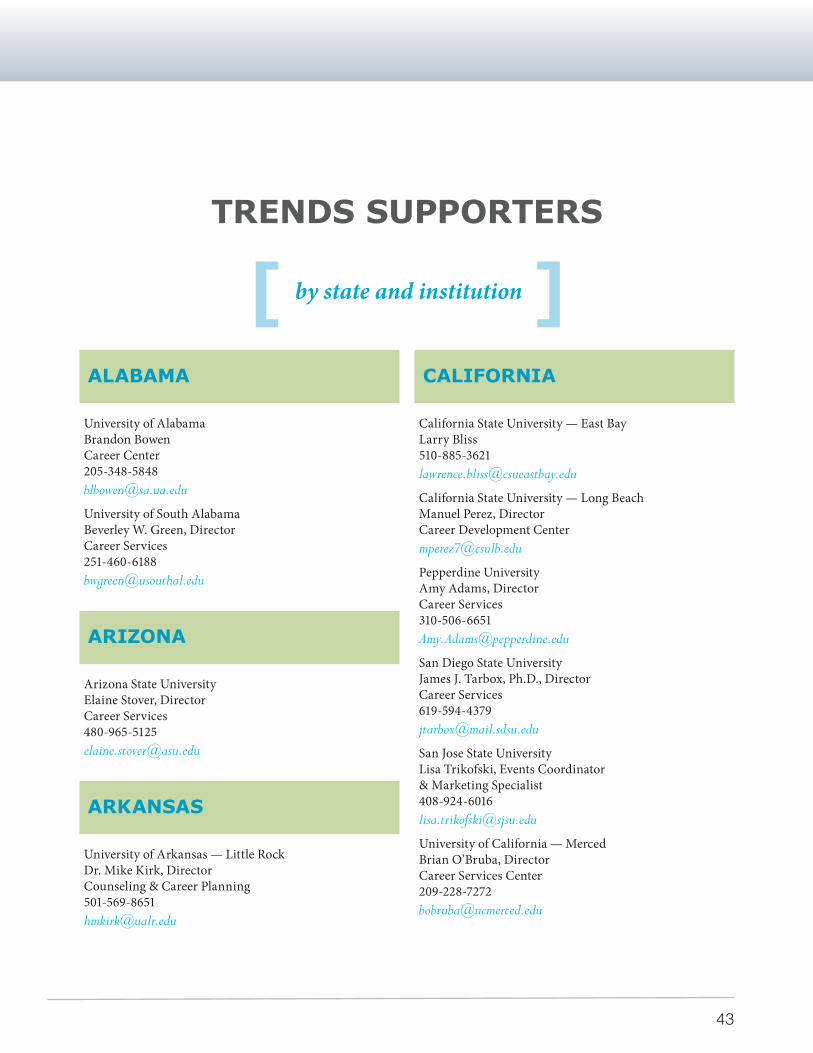
RECRUITING TRENDS 2011-2012
[ ]
43
by state and institution
TRENDS SUPPORTERS
ALABAMA
University of Alabama Brandon Bowen Career Center 205-348-5848 [email protected]
University of South Alabama Beverley W. Green, Director Career Services 251-460-6188 [email protected]
ARIZONA
Arizona State University Elaine Stover, Director Career Services 480-965-5125 [email protected]
ARKANSAS
University of Arkansas — Little Rock Dr. Mike Kirk, Director Counseling & Career Planning 501-569-8651 [email protected]
CALIFORNIA
California State University — East Bay Larry Bliss 510-885-3621 [email protected]
California State University — Long Beach Manuel Perez, Director Career Development Center [email protected]
Pepperdine University Amy Adams, Director Career Services 310-506-6651 [email protected]
San Diego State University James J. Tarbox, Ph.D., Director Career Services 619-594-4379 [email protected]
San Jose State University Lisa Trikofski, Events Coordinator & Marketing Specialist 408-924-6016 [email protected]
University of California — Merced Brian O’Bruba, Director Career Services Center 209-228-7272 [email protected]
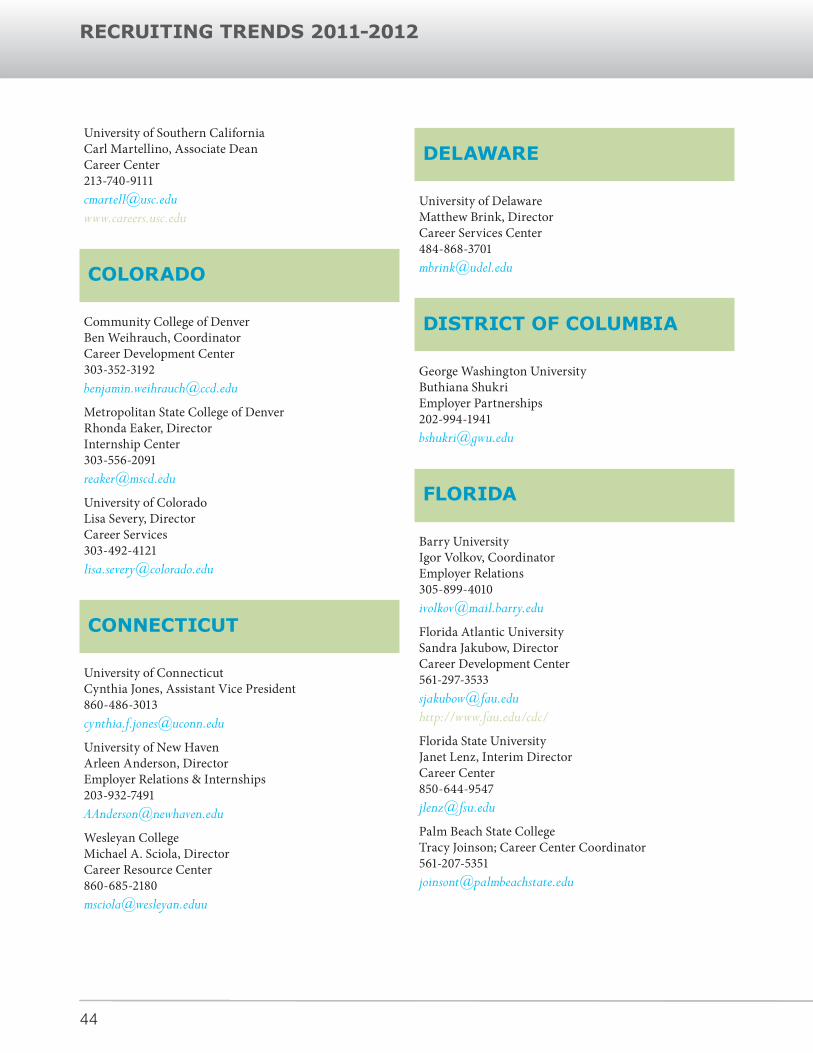
RECRUITING TRENDS 2011-2012
44
University of Southern California Carl Martellino, Associate Dean Career Center 213-740-9111 [email protected] www.careers.usc.edu
COLORADO
Community College of Denver Ben Weihrauch, Coordinator Career Development Center 303-352-3192 [email protected]
Metropolitan State College of Denver Rhonda Eaker, Director Internship Center 303-556-2091 [email protected]
University of Colorado Lisa Severy, Director Career Services 303-492-4121 [email protected]
CONNECTICUT
University of Connecticut Cynthia Jones, Assistant Vice President 860-486-3013 [email protected]
University of New Haven Arleen Anderson, Director Employer Relations & Internships 203-932-7491 [email protected]
Wesleyan College Michael A. Sciola, Director Career Resource Center 860-685-2180 [email protected]
DELAWARE
University of Delaware Matthew Brink, Director Career Services Center 484-868-3701 [email protected]
DISTRICT OF COLUMBIA
George Washington University Buthiana Shukri Employer Partnerships 202-994-1941 [email protected]
FLORIDA
Barry University Igor Volkov, Coordinator Employer Relations 305-899-4010 [email protected]
Florida Atlantic University Sandra Jakubow, Director Career Development Center 561-297-3533 [email protected] http://www.fau.edu/cdc/
Florida State University Janet Lenz, Interim Director Career Center 850-644-9547 [email protected]
Palm Beach State College Tracy Joinson; Career Center Coordinator 561-207-5351 [email protected]
TRENDS SUPPORTERS
45
University of South Florida Michael Tooke, Assistant Director Employer & Customer Relations 813-974-4306 [email protected]
University of Tampa Mark Colvenbach, Manager Employer Development 813-253-6236 [email protected]
GEORGIA
Georgia Institute of Technology Andrea Fekete, Associate Director Career Services 404-894-3738
Georgia Southern University Col. Warren Riles, Director Career Services 912-478-5197 [email protected]
Georgia State University Kevin Gaw, Director Career Services 404-413-1835 [email protected]
Emory University Claudia Paez Ellett, Director Career Services Rollins School of Public Health 404-727-9957 [email protected]
IDAHO
Boise State University Vickie Coale, Associate Director Employment Services 208-426-1744 [email protected]
ILLINOIS
College of DuPage Steve Gustis, Program Manager Cooperative Education & Internship 630-942-2611 [email protected] www.cod.edu
DePaul University Karyn McCoy, Associate Director Employer Relations 312-362-5874 [email protected] www.careercenter.depaul.edu
Elgin Community College Peggy Gundrum, Director Career Services 847-214-7122 [email protected]
Lake Forest College Lisa Hinkley, Director of Career Services 847-735-5235 [email protected]
Northwestern University Dianne Siekmann, Associate Director University Career Services 847-491-5785 [email protected]
INDIANA
Ball State University James Mitchell, Senior Assistant Director Employer Relations 765-285-1522 [email protected]
Indiana University – Purdue University Indianapolis Beth Haggenjos, Director of Career Services School of Informatics 317-278-4143 [email protected]
RECRUITING TRENDS 2011-2012
46
Purdue University – Calumet Shelly Robinson, Director Career Services 219-989-2600 [email protected]
IOWA
Iowa State University Career Management Services 515-294-2540 [email protected]
KANSAS
Kansas State University Kerri Day Keller, Director Career and Employment Services 785-532-1691 [email protected]
Wichita State University Connie Dietz, Director Cooperative Education & Work-Based Learning 316-978-6988 [email protected]
KENTUCKY
Eastern Kentucky University Mary Raider, Assistant Director 859-622-8889 [email protected]
University of Louisville Leslye Erickson, Director Career Development Center 502-852-4740 [email protected]
LOUISIANA
Louisiana State University Trey Truitt, Associate Director Career Services 225-578-2162 [email protected]
MARYLAND
John Hopkins University Mark Presnell, Director Career Center [email protected]
Prince George’s Community College Dr. H. Randall Poole, Manager Career Services 301-322-0135 [email protected]
Towson University Lorie Logan-Bennett, Director The Career Center 410-704-2386 [email protected]
University of Maryland William Jones, Assistant Director University Career Center 301-314-7120 [email protected]
MASSACHUSETTS
Amherst College Ursula Olender, Dean Career Center 413-542-2265 [email protected]
Clark University David McDonough, Director Career Services 508-793-7258 [email protected]
TRENDS SUPPORTERS
47
Massachusetts Institute of Technology Melanie Parker, Executive Director 617-253-4733 [email protected]
Northeastern University Steve Johnson, Associate Director Employer Relations 617-373-3404 [email protected]
University of Massachusetts Nick Wegman, Executive Director Chase Career Center Isenberg School of Management 413-577-3156 [email protected]
MICHIGAN
Baker College Niki Perkins Baker College Online and Center for Graduate Studies 810-766-2090 [email protected]
Calvin College Laurie Lemmen, Internship Coordinator Career Services 616-526-6485 [email protected]
Grand Rapids Community College Luanne Wedge Career Services 616-234-4170 [email protected]
Macomb Community College Robert S. Penkala, Director Career Services 586-445-7636 [email protected]
Michigan State University Paul Jaques, Internship Developer Career Services Network 517-256-9285 [email protected]
Michigan State University Theda Rudd, Acting Director Career Services Network 517-884-1301 [email protected]
MINNESOTA
University of St. Thomas Jennifer K. Rogers, M.A., Manager Employer Relations 651-962-6761 [email protected]
University of Minnesota — MCUCSA Megan Rivera Science and Engineering 612-624-4090 [email protected]
MISSISSIPPI
University of Mississippi Toni D. Avant, Director Career Center 662-915-7174 [email protected]
University of Mississippi — Mississippi AC Mark McCloud 662-915-7174 [email protected]
MISSOURI
University of Missouri — Kansas City Gregory Hayes, Director Career Services 816-235-1015 [email protected]
RECRUITING TRENDS 2011-2012
48
University of Missouri Trulaske College of Business Matt Reiske, Director Career Services 573-882-6574 [email protected]
University of Central Missouri Teresa Alewel, Director Career Services 660-543-4985 [email protected]
University of Missouri — St. Louis Teresa Balestreri, Director Career Services 314-516-5002 [email protected]
MONTANA
University of Montana Janay Whisman, Recruiting Coordinator 406-243-2239 [email protected]
Montana Tech Sarah A. Raymond, Director Career Services 406-496-4140 [email protected]
NEBRASKA
Creighton University Jim Bretl, Director Career Center 402-280-3060 [email protected]
NEW HAMPSHIRE
Plymouth State University Debby Regan, Dean 603-535-2436 [email protected]
NEW JERSEY
Bergen Community College Jennifer Migliorino-Reyes, Director Transfer & Career Center 201-447-7171 [email protected]
Drew University Kim Crabbe, Director Career Center 973-408-3710 [email protected]
Rutgers University — New Brunswick Dorothy Kerr, Executive Manager Employer Services 732-932-7287 [email protected]
Seton Hall University Jaquline Chaffin, Director Career Services 973-761-9355 [email protected]
NEW MEXICO
University of New Mexico Jenna Crabb, Director Career Services 505-277-2531 [email protected]
TRENDS SUPPORTERS
49
NEW YORK
Colgate University Teresa Olsen, Interim Director Center for Career Services 315-228-7380 [email protected]
City University of New York (CUNY) Baruch College Theresa Accardi, Associate Director Career & Internship Services 646-312-4682 [email protected]
New York Institute of Technology Amy Bravo, Director Career Services 516-686-7528 [email protected]
Pace University Maxine Sugarman, Interim Executive Director Career Services 212-346-1950 [email protected]
Syracuse University Mike Cahill, Director Career Services 315-443-3616 [email protected]
NORTH CAROLINA
Central Piedmont Community College Pat Nash, Associate Dean Career & Advising Support 704-330-6286 [email protected]
University of North Carolina — Chapel Hill O. Ray Angle, Director Career Services [email protected]
University of North Carolina — Wilmington Thom Rakes, Director Career Center 910-962-3174 [email protected]
Wake Forest University Ladd Flock, Associate Director Career Services 336-758-5902 [email protected]
NORTH DAKOTA
North Dakota State University Jill Wilkey, Director Career Center 701-231-8466 [email protected]
OHIO
Cincinnati State College Peggy Harrier, Acting Dean Business Technologies Division 513-569-1639
Cleveland State University John Scanlan, Assistant Director 216-687-2233 [email protected]
Ohio Dominican University Gary Swisher, Director Career Development Center 614-251-4734 [email protected]
University of Dayton Chris Wiley, Associate Director Employer Relations 937-229-2045 [email protected]
RECRUITING TRENDS 2011-2012
50
OKLAHOMA
Oklahoma City College Joshua Waddell, Director Career Services 405-208-7920 [email protected]
University of Oklahoma Brenda Peters, Associate Director 405-325-1974 [email protected]
University of Tulsa Shelly Holly, Director Career Services 918-631-2549 [email protected]
OREGON
Lane Community College Tamara Pinkas, Coop. Edu. Coordinator Advanced Technology Division 541-463-5011 [email protected]
Lewis and Clark College Minda Heyman 503-768-7114 [email protected]
Linfield College Kristi Mackay, Coordinator Career Services 503-883-2606 [email protected]
Oregon State University Doug Cochrane, Director Career Services 541-737-4085 [email protected]
University of Oregon Deb Chereck, Director Career Center 541-346-6005 [email protected]
Willamette University Jerry Houser, Ph.D., Director Career Services 503-370-6413 [email protected]
PENNYSYLVANIA
Carnegie Mellon University Farouk Dey, Director Career and Professional Development Center 412-268-2064 [email protected]
Drexel University Andrew Duffy, Manager Career Services 215-895-6468 [email protected]
Duquesne University Kim Pierce, Recruiting Coordinator Career Services 412-396-4331 [email protected]
Messiah College Michael True, Director Internship Center 717-796-5099 [email protected]
St. Joseph’s University Brett Woodard, Director Career Development Center 610-660-3100 [email protected]
TRENDS SUPPORTERS
51
RHODE ISLAND
Bryant University Barbara Gregory 401-232-6355 [email protected]
Johnson & Wales University Gregory Lorenz, Dean Experiential Education 303-256-9322 [email protected]
Rhode Island College Linda Kent Davis, Director Career Development Center 401-456-8031 [email protected]
SOUTH CAROLINA
University of South Carolina Vicki Hamby, Associate Director 803-777-3966 [email protected]
SOUTH DAKOTA
South Dakota School of Mines Darrell Sawyer, Ed.D., Director Career Center 605-394-2667 [email protected]
TENNESSEE
Rhodes College Sandy George Tracy, Director Career Services 901-843-3800 [email protected]
University of Memphis Courtney Pierce, Assistant Director 901-678-5634 [email protected]
University of Tennessee Russ Coughenour, Director Career Services 865-974-5435 [email protected]
TEXAS
St. Mary’s University Amy Diepenbrock, Director Career Services [email protected]
Texas A&M Dr. Leigh Turner, Executive Director Career Center 979-845-5139 [email protected]
University of Texas at Dallas Kimshi Hickman 972-883-2943 [email protected]
West Texas A&M University Steve Sellars 806-651-2345 [email protected]
UTAH
Brigham Young University Dave Waddell, Career Advisor 801-422-6084 [email protected]
Dixie State College Kinney, Kathy, Director Career Services (435) 652-7669 [email protected] [email protected]
RECRUITING TRENDS 2011-2012
52
Southern Utah University Michael Carmine, Director Academic & Career Development Center 435-865-8035 [email protected]
University of Utah Stan Inman, Director Career Services 801-581-6186 [email protected]
Utah State University Donna Crow, Director Career Services 435-797-7777 [email protected]
Utah Valley University Michael Snapp, Director Career Services & Student Employment 801-863-8219 [email protected]
Weber State University Winn Stanger, Director Career Services 801-626-6393 [email protected]
Westminster College Mike Caldwell Director, Career Resource Center 801-832-2592 [email protected]
VIRGINIA
Roanoke College Toni McLawhorn, Director Career Services 540-375-2303 [email protected]
University of Richmond Leslie Stevenson 804-289-8141 [email protected]
University of Virginia Barbara Hampton, Associate Director Employer Services 434-924-4331 [email protected]
Virginia Tech Stuart Mease Pamplin College of Business 540-641-4444 [email protected]
WASHINGTON
Gonzaga University Mary Heitkemper, Director 509-313-4231 [email protected]
University of Puget Sound Alana Hentges, Associate Director Career & Employment Services 253-879-3161 [email protected]
University of Washington Diane Martin, Associate Director Employer Relations 206-543-9102 [email protected]
WEST VIRGINIA
Marshall University Debby Stoler, Assistant Director Development & Outreach 304-696-6679 [email protected]
WISCONSIN
Edgewood College Shawn Johnson 608-663-2312 [email protected]
TRENDS SUPPORTERS
53
Marquette University Kristin Finn, Manager Employer Relations 414-288-7423 [email protected]
University of Wisconsin — Green Bay Linda Peacock-Landrum, Director Career Services 920-465-2163 [email protected]
University of Wisconsin — Oshkosh Jaime Page-Stadler, Director Career Services 920-424-2181 [email protected]
WYOMING
University of Wyoming Jo Chytka, Director Advising and Career Services 307-766-2398 [email protected]