Embed Size (px)
Citation preview

Recreational Use SurveySurvey Results

Background
Draft results presented at Oct. TEC Mtg.
TEC generated several recommendations for followup work.
Water Quality Review Committee considered TEC recommendations as follows:

Summary of Oct Mtg. Outcomes
Issue #1: Phone survey results intuitively seem high and
are high compared with field data. Water quality review Committee concerned
that repeating the survey might create more uncertainty, not less.
And the statistical uncertainty around phone survey results was quite low

River-Wide Comparison of Results
Phone Survey Error = 1.37% at 95% Confidence.
Phone Survey = 8.2 million total person days
Field Survey = 5.2 million max 2.7 million avg
It appears that the phone survey results may over-estimate reality (possibly by a factor of 2-3).

Issue #2: Comparison of Ohio River Recreational Use to Beach Use
Initial approach was to compare data from equivalent water body sizes (areas).
Acreage of 10 mile river segment equal to average lake acreage of which beaches are located. Water Quality Review Committee recommended
re-evaluating the data by comparing equivalent lengths of beaches and river.

Comparison of Use Data for Equivalent River-Beach Lengths

Why compare results to beach use data? Comparison to EPA’s criteria language:
Moderate use: At least half use of typical bathing beach.
Light use: Less than half use of typical bathing beach.
Indicator
Geometric mean CFU/100mL
Single Sample Maximum, CFU/100mL Designated Bathing Beach
Moderate Full Body Contact Recreation
Lightly Used Full Body Contact Recreation
Infrequently Used Full Body Contact Recreation
E. coli
126
235
298
409
575

Primary Recreational Use
0
20
40
60
80
100
120
140
0-50
51-100
101
-150
151
-200
201
-250
251
-300
301
-350
351
-400
401
-450
451
-500
501
-550
551
-600
601
-650
651
-700
701
-750
751
-800
801
-850
851
-900
901
-950
951
-980
No. In
dividu
als re
creati
ng pe
r day
per
mile
0
500,000
1,000,000
1,500,000
2,000,000
2,500,000
Jan Feb Mar Apr May Jun Jul Aug Sep Oct Nov Dec

Issue #3: Need to Look at How Wet Weather Affects Recreational Use
# Primary Contact Recreators
# Boaters
No Rain Rain No Rain Rain
During Survey 3.8 1.3 32 6.6
24 Hours Prior 3.6 5.4 32 31.4
48 Hours Prior 3.8 3.9 32.3 30.9
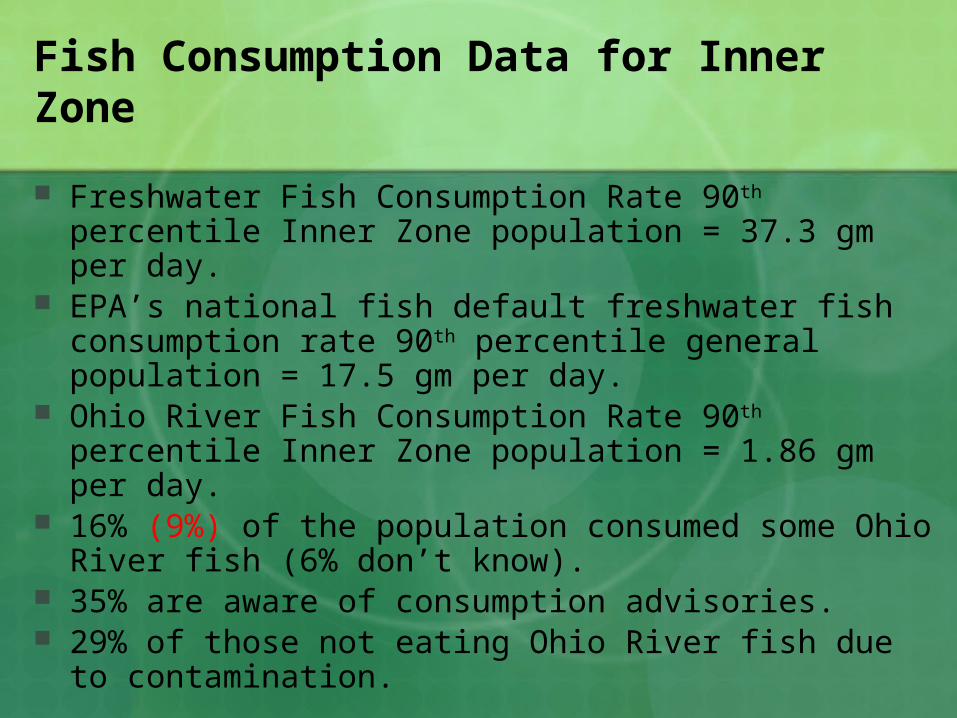
Fish Consumption Data for Inner Zone
Freshwater Fish Consumption Rate 90th percentile Inner Zone population = 37.3 gm per day.
EPA’s national fish default freshwater fish consumption rate 90th percentile general population = 17.5 gm per day.
Ohio River Fish Consumption Rate 90th percentile Inner Zone population = 1.86 gm per day.
16% (9%) of the population consumed some Ohio River fish (6% don’t know).
35% are aware of consumption advisories. 29% of those not eating Ohio River fish due to contamination.

Conclusions
The frequency/density of contact recreation in the Ohio River is significantly less than at public beaches. Could have an implication for E. coli criterion.
Frequency of contact recreation during April could have an implication for when criteria apply.
Recreation is significantly reduced DURING rain events. Recreation is not significantly reduced when precipitation
occurs 24-48 hrs prior. Watershed funding may be available to conduct additional
fish consumption and contact recreation studies in the future.

TEC Action
Are we ready to take the information public?

10-Mile River Segment Equivalent Area to Beach Use Lake Area

Survey Objectives
QUANTIFY THE RECREATIONAL USES OF OHIO RIVER.
DESCRIBE THE LEVEL OF USE IN TERMS OF NATIONAL CRITERIA CATEGORIES. Beach use, moderate use, light use.
DETERMINE WHEN THE USES OCCUR. Ohio River criteria apply May-Oct.

Survey Objectives
QUANTIFY THE RECREATIONAL USES OF OHIO RIVER.
DESCRIBE THE LEVEL OF USE IN TERMS OF NATIONAL CRITERIA CATEGORIES. Beach use, moderate use, light use.
DETERMINE WHEN THE USES OCCUR. Ohio River criteria apply May-Oct.
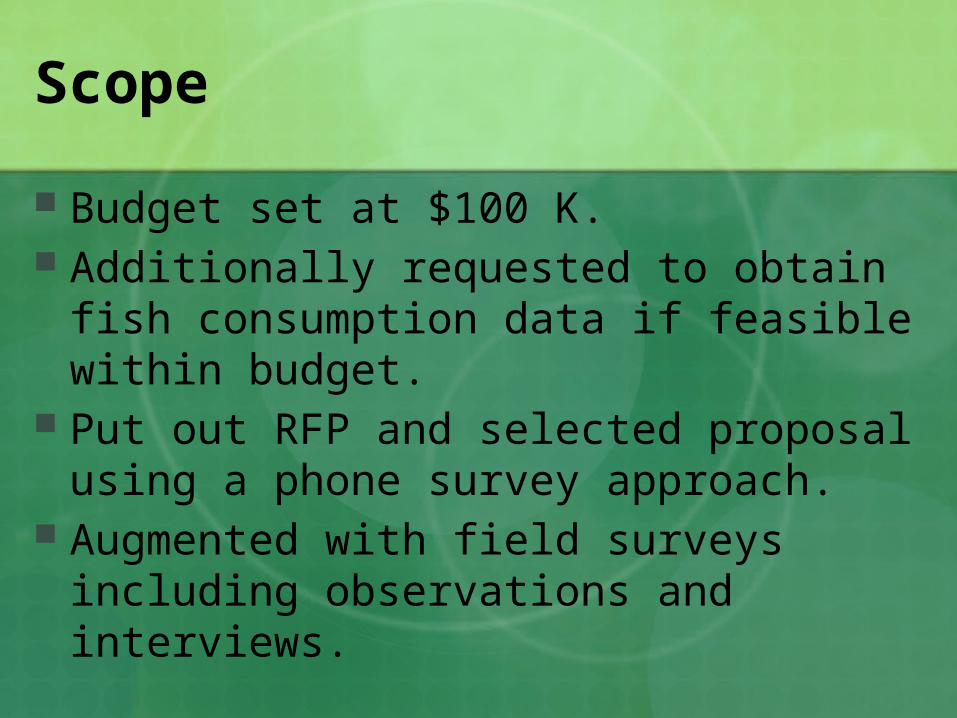
Scope
Budget set at $100 K. Additionally requested to obtain fish
consumption data if feasible within budget. Put out RFP and selected proposal using a
phone survey approach. Augmented with field surveys including
observations and interviews.

Survey Design
5102 random telephone surveys completed. 3,865 inner zone; 1,237 outer zone.

170 Field Surveys285 Interviews Ground-truth phone survey results. Sites every 20 miles “randomly” selected. 4-hour surveys completed 2-3 times at each
location during rec season. Observational counts of recreational
activities – Ground Surveys. In-person interviews – Intercept Surveys.


Results for 2008 Primary Contact Recreation
River Segment
Mile Points
Total number of Events
Person-Days
Persons per day
Persons per day per mile
Total Number of Events
Person-Days
Persons per day
Persons per day per mile
0-50 1,913,649 1,188,602 6,460 129 188,745 117,233 648 1351-100 5,821 3,615 20 0 0 0 0 0101-150 168,533 104,679 569 11 0 0 0 0151-200 593,074 368,369 2,002 40 2,557 1,588 9 0201-250 100,863 62,648 340 7 0 0 0 0251-300 163,024 101,257 550 11 0 0 0 0301-350 532,223 330,573 1,797 36 0 0 0 0351-400 517,668 321,533 1,747 35 0 0 0 0401-450 177,234 110,083 598 12 12,107 7,520 42 1451-500 1,797,900 1,116,708 6,069 121 49,417 30,694 170 3501-550 125,755 78,109 425 8 0 0 0 0551-600 720,151 447,299 2,431 49 4,320 2,683 15 0601-650 943,169 585,819 3,184 64 104,098 64,657 357 7651-700 985,647 612,203 3,327 67 0 0 0 0701-750 1,035,258 643,018 3,495 70 591 367 2 0751-800 916,226 569,084 3,093 62 0 0 0 0801-850 237,920 147,777 803 16 0 0 0 0851-900 631,223 392,064 2,131 43 0 0 0 0901-950 1,542,746 958,227 5,208 104 5,604 3,480 19 0951-980 109,759 68,174 371 12 128,555 79,848 441 14Total 13,217,842 8,209,840 495,994 308,071
Recreation Season: May - October Non-Recreation Season: November - April

Are the numbers right & what do they mean?
They are all estimates!!!

Extrapolating the Field data
Surveyed 49 public access sites 2-3 times during the rec season.
4-hour observations & in-person interviews. Recorded the field of vision and counted
recreators. Extrapolated the data to entire river for entire
recreation season.

Beach Use Data
State Waterbody Site Name FY2008 Visitation
Waterbody Area, Acres Source
KY Barren River Lake Bailey's Point Beach 33,876 CORPS
KY Barren River Lake Quarry Road Beach 30,243 CORPS
KY Barren River Lake State Resort Park Beach 124,094 CORPS
KY Buckhorn Lake State Resort Park Beach 6,253 1,230 CORPS
KY Carr Creek Lake Irishman Creek (State Park) 11,790 710 CORPS
KY Green River Lake Holmes Bend Beach 27,232 CORPS
KY Green River Lake Smith Ridge Beach 10,550 CORPS
KY Green River Lake Pikes Ridge Beach 3,805 CORPS
KY Green River Lake State Park Beach 88,087 CORPS
KY Nolin River Lake Iberia Beach 4,915 CORPS
KY Nolin River Lake Dog Creek Beach 7,645 CORPS
KY Nolin River Lake Brier Creek (State Park) 15,171 CORPS
KY Rough River Lake Laurel Branch Beach 3,990 CORPS
KY Rough River Lake North Fork Beach 9,622 CORPS
KY Rough River Lake Axtel Beach 22,953 CORPS
KY Rough River Lake State Resort Park Beach 22,107 CORPS
OH Caesar Creek Lake Fumas Shores (State Park) 86,615 2,830 CORPS
OH CJ Brown Lake Merritt State ( State Park) 51,819 2,120 CORPS
OH WH Harsha Lake Greenbrier (state Park) 66,659 CORPS
OH WH Harsha Lake Tate (State Park) 17,900 CORPS
IN Brookville Lake Mounds State Beach 48,890 CORPS
IN Brookville Lake Quakertown State Beach 6,090 CORPS
IN Cagles Mill Lake Lieber State Recreation Area 82,197 1,400 CORPS
IN CM Harden Lake Raccoon State Beach 73,821 2,110 CORPS
IN JE Roush Lake Little Turtle State Beach 47,079 900 CORPS
IN Mississinewa Lake Miami State Beach 21,217 3,210 CORPS
IN Monroe Lake Hardin Ridge Beach 32,889 CORPS
IN Monroe Lake Fairfax Beach 51,603 CORPS
IN Monroe Lake Paynetown State Rec. Area 68,446 CORPS
IN Patoka Lake Newton-Stewart State Beach 85,421 8,800 CORPS
IN Salamonie Lake Lost Bridge West State Beach 58,585 2,855 CORPS
PA Chapman 12,094 68 PADCNR
PA Keystone 50,403 78 PADCNR
PA Kooser 5,511 4 PADCNR
PA Laurel Hill 33,985 63 PADCNR
PA Lyman Run 8,902 45 PADCNR
PA Moraine 112,968 3,225 PADCNR
PA Pymatuning 46,818 17,088 PADCNR
PA Raccoon Creek 97,492 101 PADCNR
PA Yellow Creek 25,429 720 PADCNR
PA Crooked Creek Lake 62,458 350 CORPS
PA Youghiogheny Lake 59,859 2,840 CORPS
61808 5065
33383 2140
11866 620
75th percentile Value
Median Value
25th Percentile Value
5,260
10,750
10,100
8,200
5,795
5,000
2,160

Why/When Don’t Recreators Recreate


Questions?


![Short circuit followup[1]](https://img.pdfslide.us/doc/110x75/556264fad8b42ae87d8b4ffa/short-circuit-followup1.jpg)