Embed Size (px)
Citation preview
CFA Institute
Recovery: Vigorous or Lethargic?Author(s): Beryl W. SprinkelSource: Financial Analysts Journal, Vol. 27, No. 4 (Jul. - Aug., 1971), pp. 9-15Published by: CFA InstituteStable URL: http://www.jstor.org/stable/4470818 .
Accessed: 13/06/2014 07:11
Your use of the JSTOR archive indicates your acceptance of the Terms & Conditions of Use, available at .http://www.jstor.org/page/info/about/policies/terms.jsp
.JSTOR is a not-for-profit service that helps scholars, researchers, and students discover, use, and build upon a wide range ofcontent in a trusted digital archive. We use information technology and tools to increase productivity and facilitate new formsof scholarship. For more information about JSTOR, please contact [email protected].
.
CFA Institute is collaborating with JSTOR to digitize, preserve and extend access to Financial AnalystsJournal.
http://www.jstor.org
This content downloaded from 195.78.109.119 on Fri, 13 Jun 2014 07:11:00 AMAll use subject to JSTOR Terms and Conditions
RECOVERY
-Viorous
or
Lethargic?v
. .. business and financial evidence continues to support the view that a vigorous economic expansion lies immediately ahead
by BERYL W. SPRINKEL
DR. BERYL W. SPRINKEL is Senior Vice President and Economist of the Harris Trust and Savings Bank, Chicago, Illinois.
This article is based on an address to the Financial Analysts Society of San Diego, April 8, 1971.
HE economy is clearly emerging from the mild 1969-70 recession and the rate of inflation is receding. In fact, the rise in the annual rate
of GNP in the first quarter will probably be the largest in history-over $25 billion, and consumer prices are rising at less than half the pace of a year ago. One would expect this news to be received joyously but, in fact, many economists-mostly of Keynesian persuasion-have taken the occasion to label the recovery "disappointing," and have gone on to argue that recent evidence suggests economic performance throughout all 1971 will be far below the official objective of $1,065 billion.
Since Keynesian economists minimize the ex- pansive effect of greater monetary growth and place emphasis upon fiscal stimulus, they mostly argue that more action is now needed in the form of tax cuts or greater Government spending. Pro- fessor Paul Samuelson, adviser to President Ken- nedy, recently claimed that no jury of informed persons could possible agree that the official fore- cast is warranted by the evidence now available. Arthur Okun, a past chairman of the Council of Economic Advisers, said the forecast represents the view that the economy is a "jack-in-the-box," when, in his judgment, it is actually "stuck in the mud." Professor Otto Eckstein, a former member of the Council of Economic Advisers, recently re- vised his moderate growth forecast downward. A monetarist interpretation of the evidence does not support these lethargic growth predictions but rather points toward vigorous expansion and re- duced inflation in the months ahead.
Looking at the Numbers
It is indeed true that the increases in several major economic aggregates in the first three months of this recovery have been moderate as contrasted with the three prior recoveries.
Percentage Increase in Economic Aggregates (Annual Rate)
Nov. '70 Feb. '61 April '58 Aug. '54 through through through through Feb. '71 May'61 July'58 Nov. '54
Industrial Production + 8.0% +19.2% +27.2% + 9.2% Personal Income + 8.0 + 6.8 +10.8 + 8.8 Retail Sales +13.6 + 2.8 +10.4 +11.6 Employment 0 - 0.8 + 0.8 + 3.2
Source: Federal Reserve Board, Department of Commerce and Department of Labor.
The mild nature of the recovery is particularly
FINANCIAL ANALYSTS JOURNAL / JULY-AUGUST 1971 9
This content downloaded from 195.78.109.119 on Fri, 13 Jun 2014 07:11:00 AMAll use subject to JSTOR Terms and Conditions
-+- 0 * (A) la > > 0 CD '
O = ;a S
0~~~~
oi c 3 e, -' -1
z0 ca CD C
CL 3~~~~~~~' %O Su n*~1 a. e
+
-C LA C
10-4 -3
e_ = 0 0 ~~~~~~~~~~~~~~~~~~~~. 0A
o 0~~~~~~~~~~~~~~~~~~~~~~~o e (0~~~~~~~~~~~~~~~~0 Lit 0~~~~~~~~~~~~~~~~~~~~~~~.0
0 C)~~~~~0CA A
(ID
04 I0~~~~~~~
-. A~~~~~~~~~~~~~~~~~~~~~~~~~~A
0<4
0.
04
0' C.)~~~~~~~~~~~~~~~~~~~~~~~~~~~~~~~~~~4
This content downloaded from 195.78.109.119 on Fri, 13 Jun 2014 07:11:00 AMAll use subject to JSTOR Terms and Conditions
evident when it is recognized that some of the im- provement in the above measures was clearly due to a recovery from the auto strike which ended with the recession low in November of last year. But subtracting out all the auto components in the recovery probably over-adjusts, since the economy would have been on the weak side last fall even without the strike.
Two factors help explain the moderate nature of the recovery so far. First, it has long been evident that the rate of recovery from recessions or depres- sions is positively correlated with the severity of the preceding decline. Although the 1969-70 re- cession lasted over a year, it was among the mildest in the 20th Century. The sizeable expansion in the money supply beginning in March 1970 cushioned the economic decline under way. But in contrast to most other periods of recession-induced mone- tary increases, monetary growth declined sharply after the first six months' expansion.
Recession Induced Rates of Monetary Growth (Ml)*
First Subsequent Six Months Five Months
1970-71 + 7.2% + 3.4% 1%0-61 + 0.8 + 2.6 1958-59 + 4.2 + 4.8 1954-55 + 4.6 + 3.8
*See definition in text. Source: Federal Reserve Board.
The slowdown in monetary growth extending from September 1970 through January 1971 may contribute to an understanding of the moderate nature of the recovery up to the present time since monetary growth affects spending and income creation with several months' lag. But the slow- down in monetary growth cannot be considered indicative of probable monetary growth in future months. In fact, because of several technical fac- tors, especially the rapid growth in time deposits, the growth in most monetary aggregates has been much more rapid than the growth in M1 (demand deposits plus currency in circulation). In Febru- ary the money supply jumped so sharply that the average annual rate of rise since September 1970 now amounts to 5.2 per cent. Furthermore, nu- merous public statements by Chairman Arthur Burns of the Federal Reserve Board suggests that the monetary growth rate target in the months ahead is five per cent to six per cent.
If we can count on a five per cent to six per cent growth in money supply this year, what can we
expect for velocity? It is a well known fact that money turnover tends to decline during recessions as consumers and businessmen become more con- servative in their outlook and rises during recov- eries as expectations improve.
Average GNP Velocity Increases in the Three Prior Recoveries
Recession Low to Yearly Average Ending in 4th Quarter Recession Low to Average of Recovery of First Year of Expansion
+ 6.2% + 3.4%
Source: Federal Reserve Board, Department of Commerce.
By the fourth quarter of recovery in the past three expansions, velocity had risen 6.2 per cent on average from the recession low. If the money supply increases six per cent this year and velocity enjoys a normal cyclical increase, GNP should ex- ceed $1,100 billion (in terms of an annual rate) by the fourth quarter of this year, 12 per cent above the year earlier. If the average increase in velocity between recession years and recovery years occurs, combined with a six per cent imcrease in the money supply, GNP for 1971 will amount to about $1,068 billion, slightly above the official target. If either the money supply grows less than six per cent or velocity rises less than usual, the GNP numbers will be commensurately lower. There would undoubtedly be a hung jury if this writer were a member of Professor Samuelson's "jury of informed persons" reviewing the official projection. Even if the money supply comes in a little low or if the upswing in velocity a little less than in prior recoveries, an expectation of a vig- orous expansion yielding a GNP for calendar 1971 of $1,050 billion or more is a reasonably safe ex- pectation. At worst, a 12-month GNP forecast of $1,065 billion GNP might be one quarter late in arriving.
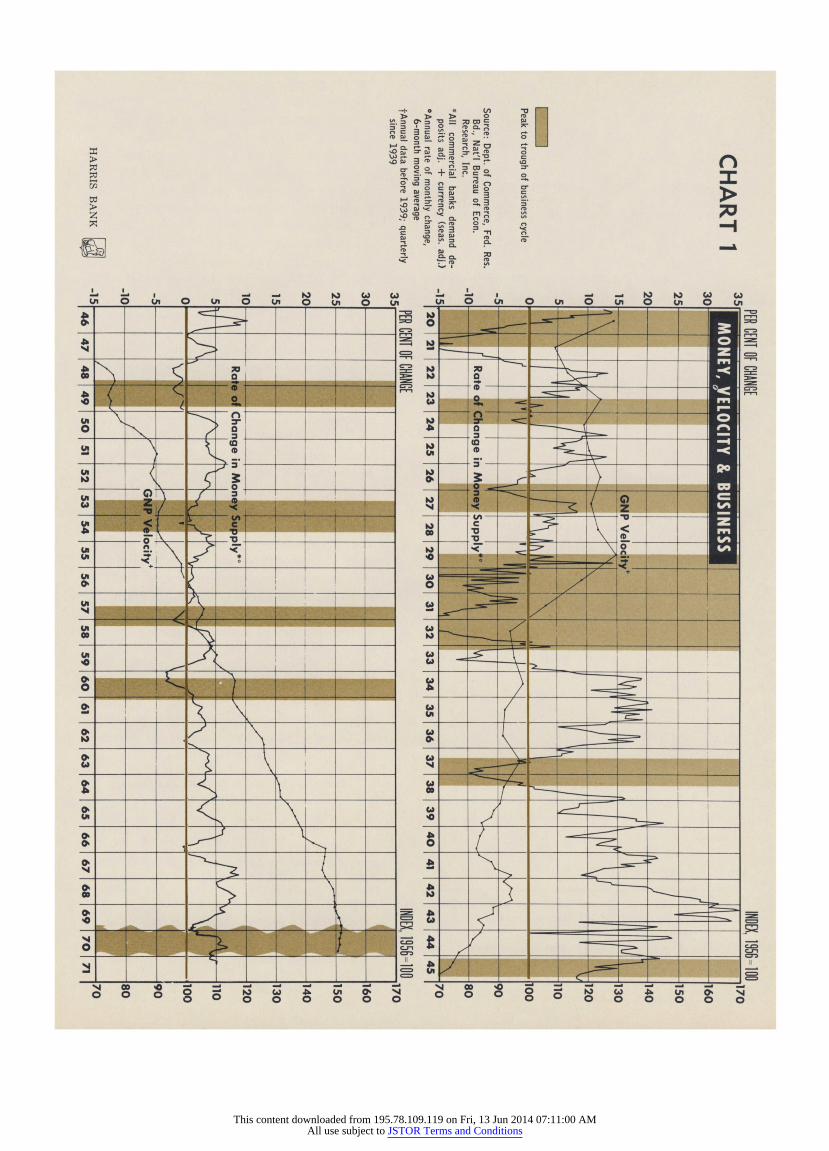
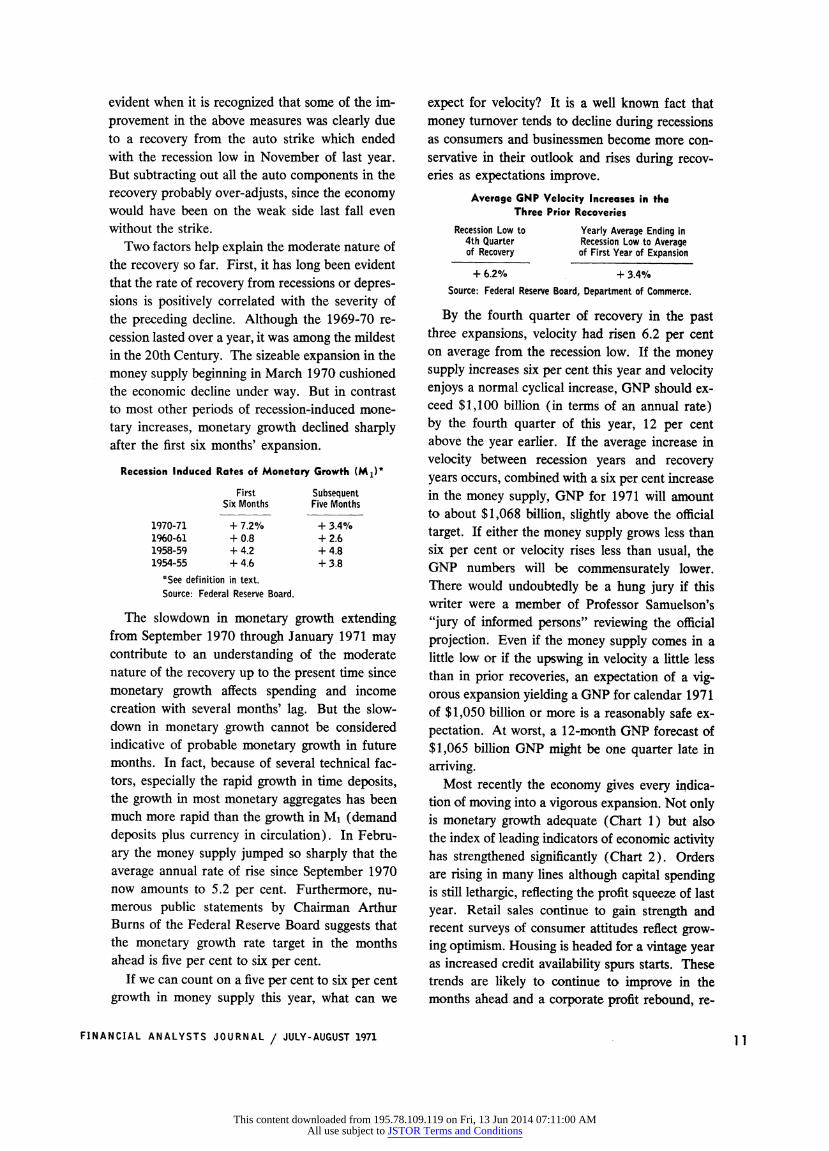
Most recently the economy gives every indica- tion of moving into a vigorous expansion. Not only is monetary growth adequate (Chart 1 ) but also the index of leading indicators of economic activity has strengthened significantly (Chart 2). Orders are rising in many lines although capital spending is still lethargic, reflecting the profit squeeze of last year. Retail sales continue to gain strength and recent surveys of consumer attitudes reflect grow- ing optimism. Housing is headed for a vintage year as increased credit availability spurs starts. These trends are likely to continue to improve in the months ahead and a corporate profit rebound, re-
FINANCIAL ANALYSTS JOURNAL / JULY-AUGUST 1971 1 1
This content downloaded from 195.78.109.119 on Fri, 13 Jun 2014 07:11:00 AMAll use subject to JSTOR Terms and Conditions
CHART 2
INDEX, 1957-59-100 200
LEADING INDICATORS & PRODUCTION 1 190
180
170
160
Indicators 150
140
130
PER CENT Per Cent of Leaders Expanding* __l_______ __-____7?5
II 5
66 67 68 69 70 71
Source: Statistical Indicator Associates, Federal Reserve Board *Based on 2-6 month moving averages
This content downloaded from 195.78.109.119 on Fri, 13 Jun 2014 07:11:00 AMAll use subject to JSTOR Terms and Conditions
flecting a probable sharp jump in productivity, will eventually strengthen capital spending plans.
But wouldn't a vigorous recovery threaten the present trend toward reduced inflation? If mone- tary growth were to continue rising indefinitely at about six per cent a year, inflation could become a more serious problem in late 1972 or 1973 as the economy approaches full employment of resources. But, in the meantime, widespread slack in manu- facturing capacity as well as the labor force pro- vides considerable protection against renewed in- flation. Furthermore, the civilian labor force is expected to grow by two million persons this year and the probable sharp rise in manufacturing pro- ductivity, which has averaged over five per cent in the first year of prior postwar recoveries, will help dampen the kind of sharp rises in manufacturing unit labor costs experienced in 1966-70.
Money, Recovery, and the Financial Markets
Finally, the financial markets are acting as if a vigorous recovery accompanied by reduced infla- tion is in the offing. Stock prices are up about 45 per cent from their May 1970 low and bond yields have declined over 200 basis points. The rise in asset values will be a major factor improving senti- ment while raising money velocity.
Monetarists contend that a changing monetary policy, as measured by changing monetary growth, has important and partially predictable effects on financial markets.* It is possible to separate mone- tary influences into three separate forces - the liquidity effect, the income effect and the price effect. Let us first apply these concepts to fixed value bonds. All economists, be they Keynesian or monetarist, agree that the short-run effect of an increase in the money supply by the central bank is reduced interest rates, just as lower monetary growth raises rates. An increase in the amount of funds seeking investment outlets inevitably places downward pressure on the interest rate structure. But that is not the end of the story, according to monetarists. If it were, we would expect to find low interest rates in countries with rapid monetary growth and high interest rates in countries with slow monetary growth. In fact, the evidence is precisely the opposite. South America tends to
CHART 3. Yields on Highest-Grade Corporate Bonds
Per Cent Per Cent
8 84<4
7 7
Nominal Rate of Return iCorporole Aoo Bonds)
6 6
5 ~~~~~~~~~~~~~~~~~~5
Real Rate af Return*
3 3
ol T T T T T T T T ^ 1962 1963 1964 1965 1966 1967 1968 1969 1970
*Estimates of "real" interest rates were obtained from statistical regres- sions of nominal interest rates on current and lagged price changes and on variables thought to influence "real" interest rates (i.e., the level of and changes in output and changes in the deflated money stock). See William P. Yohe and Denis S. Karnosky, "Interest Rates and Price Level Changes, 1952-69," Review, Federal Reserve Bank of St. Louis, December 1969.
Latest data plotted: November estimated. Prepared by Federal Reserve Bank of St. Louis
have higher rates and higher monetary growth whereas those few countries with low monetary growth have low interest rates. The United States had relatively low interest rates during the 1950s and the first half of the past decade, when mone- tary growth was relatively subdued, and higher rates after monetary growth became very large. Only recently, following reduced monetary growth in 1969 and early 1970, have interest rates de- clined sharply.
Clearly, there must be important secondary effects of more rapid growth in the money supply, and monetarists contend these effects serve to re- verse the direction of the initial liquidity effect upon interest rates. More money in circulation leads, according to monetarist doctrine, to more spending and hence more income creation, tending to increase the demand for funds and interest rates rise via the income effect. If monetary growth con-
.'See Beryl W. Sprinkel, Money and Markets: A Monetarist View, Dow Jones-Irwin, Inc., May 1971.
FINANCIAL ANALYSTS JOURNAL / JULY-AUGUST 1971 13
This content downloaded from 195.78.109.119 on Fri, 13 Jun 2014 07:11:00 AMAll use subject to JSTOR Terms and Conditions
0 0 * (A - >> > 0 rw
o0 e -i ` 3 z 0.
CL~~~~~~~~~~~~~~~'
o o o o
o<jo r-L 'A -0 r
x A)
eD 3 CD
0 -) 0 (1
k~~~~~~~~~~~~~~~~t .q 0
SA
.0 ~ ~ ~ 0C ( m3 - -'f
. & 0. -..rI
t1 t <tX j 80t)4AS0+]~~eD AA 4
*t t tl t-*dIII -tt
ttiX 0010 X2<]- EFX XXt0
U'4
o~ o~ - - - -o - - - - - - -o - o 0 - X o q
0.1~~~~~~~~~~~~~~~~~~~~~~~~U - --U'--~0
U' C~~~~~~~~~~~~~~~~~~~~~~~4
1 0
ER
This content downloaded from 195.78.109.119 on Fri, 13 Jun 2014 07:11:00 AMAll use subject to JSTOR Terms and Conditions
tinues high after full employment of resources has been approached, inflation will rear its ugly head as excessive money chases a limited supply of goods and services. But when inflationary pres- sures become firmly entrenched, bondholders will insist on adequate yield protection to cover the real rate of interest plus an inflation premium, i.e., the price effect (Chart 3).
Hence the easier the monetary policy pursued, the higher the prevailing rates of interest. Those politicians who, like modern-day Populists, are always advocating low interest rates should favor a policy permitting only moderate monetary growth.
What impact do these pressures have on the equity market? Again it is possible to distinguish between the liquidity, price and income effects. A tight monetary policy inevitably brings an eco- nomic slowdown. An easing monetary policy in- creases liquidity in the economy and induces holders to give up liquidity for assets and goods and services. Bear markets in common stocks usually end within two to three months after mone- tary policy is eased during an economic slowdown (Chart 4). Also, an easing in monetary policy during a recession, combined with lower incomes, leads to decreased interest rates which mean that the discount rate on future flows of income from stocks is reduced, causing stock prices to rise. Continued monetary growth leads to higher spend- ing, an economic recovery and, finally to a rise in corporate profits. In fact, profits usually reach bot- tom somewhat before the recession low as attempts to reduce business costs during the recession begin to bear fruit. Higher corporate incomes tend to raise stock prices.
These ideas had an excellent test recently in the United States. Monetary policy was eased in March 1970, several months after a recession got under way. If the monetarist theory was to yield the right prediction, stock prices should have ceased declining within two to three months of the monetary trough, interest rates should have de- clined abiruptly as the inflation premium was re- duced, and a business recovery should have com- menced in late 1970. All those events did indeed occur last year.
But what about the period ahead? Now that the economy has started up, short-term rates are prob> ably past their lows. Since there is much slack in the economy and the rate of inflation is likely to
continue to recede for some time, a further decline in longer term U. S. interest rates is likely. The stock market has greatly benefited from first, im- proving liquidity; second, lower interest rates; and now, improving volume, productivity and margins suggest that in the months ahead equities will benefit further from an improving profit trend.
Conclusion
Changes in monetary policy influence not only the rate of change in spending, income creation, inflation, employment and real economic growth, but also exert a systematic and partly predictable impact on bond and stock markets. Maintenance of more stable and moderate monetary growth in the months ahead will promote both economic and financial stability, just as volatile and excessive monetary growth promoted instability in the past. The business and financial evidence continues to support the view that a vigorous economic expan- sion, accompanied by reduced inflation, lies imme- diately ahead. *
There 's
Power to SPare In the
Mountain west There is ade- quate power
now, adequate IDAHO ~~~~~~low-cost f uel
IDAHO now, and con- WYO. ~~struction of
plenty of addi- COLO. tional generating
capacity is underway. Also... we h ave
strong interconnec- UTAH tions with huge
power pools in other areas-just in case.
The Folks at UTAH POWER & LIGHT CO. A Growing Company in the Growing West
FINANCIAL ANALYSTS JOURNAL / JULY-AUGUST 1971 15
This content downloaded from 195.78.109.119 on Fri, 13 Jun 2014 07:11:00 AMAll use subject to JSTOR Terms and Conditions