Embed Size (px)
Citation preview
Recovery of Coded-Wire Tags from Chinook Salmon in California’s Central Valley
Escapement and Ocean Harvest in 2010
Brett Kormos1, Melodie Palmer-Zwahlen1 and Alice Low2
California Department of Fish and Game
Fisheries Branch Administrative Report 2012-02
March 2012 1 Marine Region, Ocean Salmon Project, 5355 Skylane Blvd Suite B, Santa Rosa, CA 95403 2 Fisheries Branch, Anadromous Fisheries, 830 S Street, Sacramento, CA 95811
NOTE TO READERS
Recovery of Coded-Wire Tagsfrom Chinook Salmon in California's Central Valley Escapementand Ocean Harvest in 2010 presents important data for the improvement of Central Valleysalmon management. Until 2007, only experimental releases of fall-run Chinook salmon fromCentral Valley hatcheries were marked and coded-wire tagged (low, inconsistent numbers),resulting in a lack of data for harvest management, evaluation of hatchery rearing and releasepractices, hatchery impacts to natural-origin fish, and the success of habitat improvementprograms.
The Central Valley Constant Fractional Marking Program (CFM) was initiated in 2007 toestimate in a statistically valid manner the relative contribution of hatchery production and toevaluate the various release strategies being employed in the Central Valley. Beginning withBrood Year 2006 fall-run Chinook, the program has marked and coded-wire tagged a minimumof25 percent of releases from the Central Valley hatcheries each year (Buttars 2007, 2008, 2009,2010). The program is a cooperative effort of the California Department of Fish and Game(DFG), the California Department of Water Resources (DWR), the U.S. Bureau of Reclamation,the U.S. Fish and Wildlife Service (FWS), the East Bay Municipal Utilities District (EBMUD),and the Pacific States Marine Fisheries Commission (PSMFC).
In 2010, almost 27,000 Code Wire Tags were recovered from ad-clipped Chinook sampled inCentral Valley natural area spawning surveys, at Central Valley hatcheries, Central Valley rivercreel surveys, and California commercial and recreational ocean fisheries. Almost all of the fallrun Chinook Code Wire Tags recovered in the Central Valley were tagged as part of the CFMprogram, since most Central Valley fish return at ages two, three, or four, and age five Chinookmade up a very small fraction (0.01 %) of the total Central Valley fall escapement in 2010.
This report evaluates the 2010 Central Valley fall, spring, and late fall runs Chinook Code WireTags recovery data in accordance with program objectives. In particular, this report attempts toanswer the following questions with this first full year of recovery data from the CFM program:
• What are the proportions of hatchery and natural-origin fish in spawning returns toCentral Valley hatcheries and natural areas, and in ocean harvest?
• What are the relative recovery and stray rates for hatchery fish released in-basin versussalmon trucked to and released into the waters of the Carquinez Straits?
• What are the relative recovery rates for fish acclimated in net pens and released in thebay compared to salmon released directly into the waters of the Carquinez Straits?
• What are the relative contribution rates of hatchery fish, by run and release type, to theocean harvest?
As with all of its products, Fisheries Branch is interested in comments on the utility of thisdocument, particularly regarding its application to monitoring and management decision
processes. Therefore, we encourage you to provide us with your comments. Comments shouldbe directed to Ms. Alice Low, Fisheries Branch, 830 S Street, Sacramento, CA 95814, (916) 323-9583, [email protected].
~-Staffb ehfChief, Fisheries Branch
1
Introduction
Each year, approximately 32 million fall-run Chinook salmon are produced at five hatcheries in California’s Central Valley (CV): Coleman National Fish Hatchery (CNFH), Feather River Hatchery (FRH), Nimbus Fish Hatchery (NFH), Mokelumne River Hatchery (MOK), and Merced River Fish Facility (MER). Production from these hatcheries contributes to major sport and commercial fisheries in ocean and inland areas. Prior to 2007, only small experimental releases (generally <100,000 fish) of CV fall-run Chinook were consistently released with microscopic (≤ 1 mm) coded-wire tags (CWT) inserted in their snouts. Each CWT contains a binary or alpha-numeric code that identifies a specific release group of salmon (e.g., agency, species, run, brood year, hatchery or wild stock, release size, release date(s), release location(s), number tagged and untagged). Any CV salmon containing a CWT is also externally marked with a clipped adipose fin (ad-clipped) to allow for visual identification. Although FRH did mark and tag a portion of their fall-run Chinook during 2000 through 2006, tagging rates were not consistent or representative of the 6-8 million fish produced annually by FRH. Almost all of the fall-run Chinook production releases at the other CV hatcheries were untagged during this time. In 2004, the CALFED Ecosystem Restoration Program (ERP) funded a study to design a constant fractional marking and coded-wire tagging program for CV fall-run Chinook production at all CV hatcheries. The primary goal of this program was to estimate in a statistically valid manner the relative contribution of hatchery production and to evaluate the various release strategies being employed throughout the CV. The study recommended the implementation of a system-wide marking and tagging program for production releases. Planning studies indicated an optimum marking and tagging rate of 25% for all CV fall-run Chinook production releases (Hicks et al. 2005). Beginning with brood year 2006, at least 25% of fall-run Chinook production releases at CNFH (12-13 million), FRH (9-10 million), NFH (5-6 million), and MOK (4-5 million) have been marked and tagged each spring-run (Buttars 2007, 2008, 2009, 2010). This Constant Fractional Marking (CFM) program is a cooperative effort of the California Department of Fish and Game (DFG), the California Department of Water Resources (DWR), the U.S. Bureau of Reclamation, the U.S. Fish and Wildlife Service (FWS), the East Bay Municipal Utilities District (EBMUD), and the Pacific States Marine Fisheries Commission (PSMFC). In addition, 100% of the fall-run Chinook produced at the MER (approximately 50,000-300,000 annually) are marked and coded-wire tagged. Almost 100% of the spring-run Chinook reared at FRH and the late fall-run Chinook reared at CNFH have also been marked and coded-wire tagged. It should be noted that due to their extremely low production numbers, MOK marked and tagged 100% of their fall-run Chinook releases for brood years 2008 and 2009. During 2010, almost 27,000 CWTs were recovered from ad-clipped Chinook sampled in CV natural area spawning surveys, at CV hatcheries, in CV river creel surveys, and in California ocean commercial and recreational fisheries. Almost all of the fall-run Chinook CWTs recovered in the CV were tagged as part of the CFM program since most CV fish return at ages two, three, or four. Age five Chinook made up a very small fraction (0.01%) of the total CV fall-run escapement in 2010. This report evaluates the 2010 CV fall, spring, and late fall runs Chinook CWT recovery data in
2
accordance with program objectives. In particular, this report attempts to answer the following questions with this first essentially complete year of recovery data: What are the proportions of hatchery and natural-origin fish in spawning returns to CV
hatcheries and natural areas, and in ocean harvest? Of the hatchery proportions, what proportions originated from in-basin versus out-of-basin CWT recoveries?
What are the relative recovery and stray rates for hatchery fish released in-basin versus
salmon trucked to and released into the waters of the Carquinez Straits? The latter includes salmon acclimated in net pens that are pulled for several hours into San Pablo Bay before fish are released.
What are the relative recovery rates for fish acclimated in net pens and released in the bay
versus salmon released directly into the waters of the Carquinez Straits? What are the relative contribution rates of hatchery fish, by run and release type, to the ocean
harvest?
Data and Methods Inland Escapement Monitoring During 2010, monitoring of Chinook escapement occurred at all five salmon hatcheries and on major rivers and tributaries throughout the CV. In addition, creel surveys were conducted on river fisheries in the Feather, American, and Sacramento River basins. Returning salmon were counted and 100% sampled at CV hatcheries while sample rates and methods (e.g., carcass surveys, weir counts, redd counts) varied among natural spawner surveys (Table 1). Approximately 26,500 ad-clipped salmon were observed and 25,700 heads collected by various CV projects. Monitoring agencies include DFG, DWR, EBMUD, FWS, and PSMFC. Most heads were processed by DFG at the Santa Rosa CWT lab (15,839 heads) and by FWS staff at CNFH (9,531 heads). Remaining heads were processed by individual projects and their data submitted to the Santa Rosa CWT Lab. Almost 97% (24,838) of these heads contained valid CWTs, 2% of heads had shed their CWTs prior to processing, and 1% contained CWTs that either were lost during processing or too damaged to read. Total escapement estimates and the number of salmon sampled for ad-clips in this report were provided by individual CV projects or hatcheries. These data, along with their respective CWT recovery data, were uploaded to the Regional Mark Processing Center (RMPC) and are readily accessible at www.rmpc.org. Ocean Harvest Monitoring Since 1962, the DFG’s Ocean Salmon Project (OSP) has monitored California’s ocean salmon fisheries at approximately 20 ports between Point Conception and the California-Oregon border. The goal of OSP is to sample at least 20% of all Chinook landed and to collect the heads from all ad-clipped salmon observed during monitoring. In 2010, the seasons for California sport and commercial ocean salmon fisheries were relatively constrained (Table 2) to protect both
3
Sacramento River fall-run Chinook and Klamath River fall-run Chinook. Field staff sampled 13,344 salmon and collected 2,211 heads that were processed by the Santa Rosa CWT lab. About 90% (1,987) of these heads contained valid CWTs, 10% were missing CWTs and <1% contained CWTs that were too damaged to read. Although it is generally agreed that CWTs missing from inland head recoveries is the result of salmon “shedding” these tags prior to release, this can not be assumed for heads recovered from mixed-stock ocean fisheries. Oregon and Washington hatcheries have recently begun to “mass-mark” (i.e., ad-clipped salmon that do not contain a CWT) Chinook to support small mark-selective fisheries in the northwest. During the last several years, OSP has noticed a gradual increase in the number of ocean heads collected that do not contain CWTs, especially in California’s northern ports, and assume that this is due to the increased production of mass-marked salmon in Oregon and Washington. CWT Data Analysis A “Master” release database of CWT codes was created to determine species, brood year, run, stock origin (hatchery or natural), release site, release date(s), number of salmon CWT tagged, total number of salmon released and any other pertinent release information (e.g., trucked, net pen acclimation, disease) for all 2010 CWT recoveries. All west coast CWT release data for broods 2006 through 2009 were downloaded from the RMPC. Approximately 105 million CV Chinook were released for these five brood years, of which, 37 million fish were marked and tagged utilizing 500 unique CWT codes. Although a few natural origin salmon are trapped, marked, and tagged each year, salmon produced by hatcheries make up more than 95% of all releases. In 2010, there were 319 individual CWT codes recovered in the CV, primarily from age two-, three-, and four-year old Chinook. The CWT master file was updated with any additional information obtained for these CV Chinook releases (e.g., number of untagged salmon associated with 2008 fall-run CNFH production CWT releases) and the production factor calculated for each CWT code. The production factor, Fprod, is the total number of fish released (tagged and untagged) represented by each CWT recovery. Fprod, was calculated for each CWT code and is defined as,
Fprod = (Ad.CWT + Ad.noCWT + noAd.CWT + noAd.noCWT) / Ad.CWT , where Ad.CWT is the number of fish released with ad-clips and CWTs, Ad.noCWT is the number of fish released with ad-clips but without CWTs (i.e., shed tags), noAd.CWT is the number of fish released without ad-clips but with CWTs, and noAd.noCWT is the number of fish released without ad-clips and without CWTs. Fprod allows expansion to total hatchery production from observed recoveries of CV CWTs. For this analysis, each CV CWT release was further classified into “release types” based on the following criteria: run, stock, hatchery or natural, production or experimental, release location, and holding strategy. All CV CWT codes were assigned by brood year into one of 16 fall-run Chinook release types, 4 spring-run Chinook release types, or 2 late fall-run Chinook release types: Sacramento River Basin Fall-run Chinook Release Types
CFHFe Coleman National Fish Hatchery fall-run experimental releases CFHFh Coleman National Fish Hatchery fall-run in-basin (at hatchery) releases CFHFn Coleman National Fish Hatchery fall-run net pen releases
4
FRHFe Feather River Hatchery fall-run experimental releases FRHFn Feather River Hatchery fall-run net pen releases FRHFt Feather River Hatchery fall-run trucked releases (no net pen acclimation) FRHFtn Feather River Hatchery fall-run Tiburon net pen releases (held 3-4 months; released in fall) FeaFw Feather River fall-run wild YubFw Yuba River fall-run wild NIMF In-basin releasesNIMFn Nimbus Fish Hatchery fall-run net pen releases NIMFtib Nimbus Fish Hatchery fall-run Tiburon net pen releases (held 3-4 months; released in fall)
San Joaquin River Basin Fall-run Chinook Release Types
MOKF Mokelumne River Hatchery fall-run in-basin releases MOKFn Mokelumne River Hatchery fall-run net pen releases MOKFt Mokelumne River Hatchery fall-run trucked releases (no net pen acclimation) MokFw Mokelumne River fall-run wild MERF Merced River Fish Facility fall-run releases (primarily in-basin)
Central Valley Spring-run Chinook Release Types
FRHS Feather River Hatchery spring-run in-basin releases FRHSn Feather River Hatchery spring-run net pen releases FRHSt Feather River Hatchery spring-run trucked releases (no net pen acclimation) YubSw Yuba River spring-run wild
Central Valley Late fall-run Chinook Release Types
CFHLe Coleman National Fish Hatchery late fall-run experimental releases CFHLh Coleman National Fish Hatchery late fall-run in-basin (at hatchery) releases
It should be noted that not all release types occurred every brood year and release sites sometimes varied within a given release type (Table 3). There were also several problem CWT releases where stock origin did not match hatchery origin (e.g., American River fall-run Chinook salmon raised at MOK), stocks or runs were mixed prior to CWT tagging and released utilizing various strategies (e.g., American and Mokelumne fall-run Chinook accidentally mixed and tagged together at MOK, FRH fall-run and spring-run Chinook spawned together and released as experimental “hybrid” salmon for Delta studies), or a percentage of the salmon trucked for net pen acclimation were actually released directly into the waters of the Carquinez Strait. To estimate the total escapement (or harvest) associated with each CWT recovery, each tag recovery was expanded by its respective Fprod and sample expansion factor, Fsamp, which is defined as,
Fsamp = 1 / (fe x fa x fd),
where fe is the fraction of the total salmon escapement sampled and examined for ad-clipped fish, fa is the fraction of heads from ad-clipped salmon collected and processed, and fd is the fraction of observed CWTs that were successfully decoded (Tables 4 and 5). A few heads were collected opportunistically during redd counts and snorkel surveys but are not included in this analysis since they are not representative of the escapement.
5
To help delineate between raw CWT recoveries, CWT recoveries expanded for production, CWTs expanded for sampling, and CWTs expanded for production and sampling, the following nomenclature will be used:
CWT = Raw count CWT recoveries CWTprod = CWT recoveries expanded only by their respective production factor, Fprod CWTsamp = CWT recoveries expanded only by their respective sample expansion factor, Fsamp CWTtotal = CWT recoveries expanded by both Fprod and Fsamp
Determining hatchery and natural-origin proportions in CV escapement To determine the contribution of hatchery and natural-origin Chinook for each natural-area escapement survey or hatchery, all hatchery CWTtotal were summed to produce the total number of hatchery fish. The contribution of natural-origin fish was then determined by subtracting the total number of hatchery fish from the total escapement estimate, as follows:
Estimate of natural-origin Chinook = Total Escapement Estimate - , ,1
m
total ii
CWT
where m = total number of CWT release groups identified in an escapement survey or hatchery. Determining recovery rates of various release types in CV escapement and ocean harvest To determine the relative CV recovery rate, Rcwt, of each unique CWT release group (i.e., code), all recoveries were expanded by their location-specific Fsamp, summed over all recovery locations, and then divided by the total number of fish tagged and released with this CWT. Since expanded recoveries for several individual CWT groups were less than 0.001% of the numbers released, recovery rates are reported in recoveries per 100,000 CWT salmon released, as follows:
Rcwt = CWTsamp,j recoveries / (CWT release group size / 100,000), 1
l
j
where j (=1,2,3,,,l) denotes recovery location.
Data from all CWT release groups belonging to the same brood year and release type were combined and an overall release type-specific CV recovery rate, Rtype, was calculated as:
Rtype = CWTsamp,j,k / (1
l
j release group size of CWT k / 100,000),
where: k (= 1,2,3,,,n) denotes release group and j (=1,2,3,,,l) denotes recovery location. Determining stray proportions of various release groups in CV escapement Basin of origin is defined here as the drainage of any major river as it pertains to the geographic region of the CV where a hatchery is located. For this report the CV was segregated into five primary hatchery basins: Battle Creek (including the mainstem of the upper Sacramento River), Feather River (including the Yuba River), American River, Mokelumne River, and the Merced River. Hatchery-origin Chinook returning to streams not included in these five primary basins were considered to be strays. Through discussion with regional biologists it was determined that CNFH stocks are often considered to be analogous to Chinook that originate from the mainstem of the upper Sacramento River and thus are not considered to be strays. Alternatively, FRH stocks are often considered to be strays when they return to the Yuba River, a major tributary in
5
1
n
k
1
n
k
6
the basin. As a result of differing opinions of what constitutes a stray throughout the CV any CWTs recovered outside of these defined basins of origin based on their reported stock or hatchery were considered strays. Further evaluation of these definitions is warranted as future CFM recovery data become available. To determine the CV stray proportion, Scwt, for each CWT code, the sum of all CWTsamp recoveries collected out of the basin of origin was divided by total CV CWTsamp recoveries for that release group, as follows:
Scwt = CWTsamp,p (out-of-basin locations) / 1
o
p
1
q
p CWTsamp,p (all CV locations),
where p denotes recovery location, o denotes the number of out-of-basin recovery locations, and q denotes the total number of recovery locations.
Data from all CWT releases belonging to the same brood year and release group were then combined and release type-specific CV stray proportion, Stype, was calculated as:
Stype = CWTsamp,p, k (out-of-basin) / CWTsamp,p,k (all CV locations)
o
p
n
k1 1
o
p
n
k1 1
Results
General Overview of 2010 CV inland recoveries and California ocean harvest All but two of the 24,838 valid CWTs recovered in the CV during 2010 were CV Chinook releases; most CWTs originated from brood year 2006 through 2008 releases (Table 6). More than 84% of all expanded CWT recoveries were fall-run Chinook, followed by spring-run (10%) and late fall-run (6%) releases. No Sacramento River winter-run Chinook CWTs were recovered. The majority of fall-run CWTs were age-3 (67%) and age-2 (31%) fish. It should be noted that a few age-1 fall-run CWTs were also sampled which is relatively rare in the CV. Age-3 (92%) fish dominated the spring-run return while age-4 (59%), age-3 (20%), and age-5 (16%) made up most of the late fall-run return. A few age-6 late fall-run fish were also recovered. All but 141 of the 1,987 valid CWT recoveries from the California ocean harvest in 2010 were CV Chinook releases; most CWTs were brood year 2006 through 2008 releases (Table 7). Approximately 62% of all expanded CWTs in the ocean harvest were fall-run Chinook, followed by late fall-run (30%), spring-run (3%), and winter-run (<1%). The majority of fall-run Chinook CWTs were age-3 (86%) and age-2 (12%) fish. Age-3 (93%) fish dominated the spring-run Chinook harvest while age-4 (62%), age-3 (21%), and age-5 (17%) made up most of the late-fall Chinook catch. A few age-6 late fall-run Chinook were also caught. The remaining 5% of ocean CWT recoveries originated from non-CV rivers, including the Klamath, Trinity, Smith, Chetco and Columbia rivers; most were age-3 (51%) and age-4 (49%) fish. 1. Proportion of hatchery- and natural-origin fish in CV escapement The proportion of hatchery-origin fish on the natural area spawning grounds varied throughout the CV and by run. The lowest hatchery proportion (1%) was observed in the Butte Creek spring-run
7
Chinook mark-recapture survey while the highest proportion (78%) was observed in the Feather River fall/spring-run Chinook mark-recapture survey (Figure 1). The hatchery proportion of fall-run Chinook returning to CV hatcheries ranged from 79% to 95% (Figure 2). The spring-run Chinook return to FRH was 82% hatchery-origin fish whereas the latefall-run return to CNFH was almost 100% hatchery-origin fish. Overall, there were 23 individual CWT release types contributing to CV escapement in 2010. To facilitate the breakout of the hatchery proportion by stock and release strategy, all release types from the same hatchery/basin were given the same color scheme (Figure 3) in Figures 4 through 9. All net pen releases contain black dots while most trucked, experimental, or Tiburon net pen releases are designated by black stripes when possible (i.e., release types did not overlap for a particular basin). Upper Sacramento River Basin Ten escapement surveys were conducted in the Upper Sacramento River Basin: fall and late fall runs Chinook counts at CNFH, fall and late fall runs Chinook mark-recapture surveys in the mainstem Sacramento River, a fall-run Chinook mark-recapture survey in Clear Creek, and spring-run and fall-run Chinook mark-recapture surveys in Butte Creek. Spring and fall runs Chinook redd count surveys were conducted in Mill Creek and a spring-run Chinook snorkel survey (maximum count) was conducted in Deer Creek. Representative sampling for ad-clipped salmon did not occur in Mill and Deer Creek. Returns to CNFH were predominantly hatchery-origin fish released from this facility while escapement into natural areas was primarily natural-origin fish (Figures 4 and 5):
Fall-run returns at CNFH were 89% hatchery-origin fish (96% CFHFh) Fall-run spawners in the mainstem Sacramento River were 20% hatchery-origin fish (48%
FRHFn, 19% CFHFh, 17% FRHSn) Fall-run spawners in Clear Creek were 4% hatchery-origin fish (45% FRHFn, 32% CFHFh) Late fall-run returns at CNFH were almost 100% hatchery-origin fish (99% CFHLh) Late fall-run spawners in the mainstem Sacramento River were 6% hatchery-origin fish (73%
CFHLh) Spring-run spawners in Butte Creek were 1% hatchery-origin fish (63% FRHSn) Fall-run spawners in Butte Creek were 11% hatchery-origin fish (89% FRHFn)
Feather River Basin Four escapement surveys were conducted in the Feather River Basin: spring and fall runs Chinook counts at FRH, a combined fall/spring run Chinook mark-recapture survey in the Feather River, and a combined fall/spring run Chinook mark-recapture survey in the Yuba River. Spring and fall runs Chinook returns to FRH and in the natural areas were predominantly of hatchery-origin (Figure 6):
Spring-run returns at FRH were 82% hatchery-origin (50% FRHS, 39% FRHSn) Fall-run returns at FRH were 95% hatchery-origin (87% FRHFn) Fall/spring-run spawners in the Feather River were 78% hatchery-origin (88% FRHFn) Fall/spring-run spawners in the Yuba River were 71% hatchery-origin (48% FRHFn, 22%
FRHS, 21% FRHSn)
8
American River Basin Three escapement surveys were conducted in the American River Basin: fall-run Chinook counts at NFH, a fall-run Chinook mark-recapture survey on the American River and a single late fall-run Chinook carcass count on the American River. In addition, dead salmon were recovered from the NFH weir, which is located just upstream from the hatchery and was installed on September 15th to force returning salmon into NFH. Salmon that migrated upstream beyond the hatchery prior to installation of the weir were trapped in the upstream area. Many of those salmon washed back onto the weir upon death. There is minimal spawning habitat above the weir. Spawner returns to natural areas and those from the NFH weir fish were predominantly of natural-origin while returns to NFH were predominantly of hatchery-origin (Figure 7):
Fall-run returns to NFH were 79% hatchery-origin (81% NIMFn) Fall-run spawners in the American River were 32% hatchery-origin (48% NIMFn, 24%
FRHFn, 19% CFHFn) Late fall-run spawners in the American River were 24% hatchery-origin (97% CFHLe) Salmon recovered on the NFH Weir were 38% hatchery-origin (40% NIMFn, 36%
FRHFn) Mokelumne River Basin Three escapement surveys were conducted in the Mokelumne River Basin: fall-run Chinook counts at MOK, a video weir count at Woodbridge Dam of all fall-run Chinook escapement into Mokelumne River, and a daily collection of salmon carcasses from the MOK weir, which is installed to prevent salmon from bypassing the MOK fish ladder. This barrier was originally installed on October 8th but removed on October 15th to allow for increased water releases from Camanche Reservoir designed to produce attraction flows for upstream migrating Chinook. The weir was then reinstalled on October 19th when flows returned to a rate that would not damage the weir. Any salmon above the weir when it was installed were trapped and many washed back onto the weir after their death. All adult Chinook salmon migrating upstream into the Mokelumne River to spawn were counted by the video fish counting device operated by EBMUD at Woodbridge Dam. These counts also included the number of ad-clipped salmon entering the system. By subtracting the 5,520 Chinook that returned to MOK and that were collected on the MOK weir from the total video count of 7,196 Chinook, it was assumed that the remaining 1,676 Chinook remained in the Mokelumne River. Utilizing the same logic, it was also assumed that there were 820 ad-clipped Chinook remaining in the river since only 2,866 of the 3,686 ad-clipped Chinook counted in the video monitoring were recovered at MOK and on the weir. After reviewing the CWT codes recovered from 59 heads collected during sporadic surveys on the Mokelumne River, we found that the proportions of the 12 individual CWT codes collected were very similar to the proportion of these codes recovered at MOK and on the weir; however there were 45 additional CWT codes recovered at the hatchery and weir. Because 100% of Chinook salmon observed at MOK and the weir were sampled, we felt that the MOK recoveries best represented the entire run and thus expanded the estimated 820 ad-clips in the Mokelumne River based on their proportions, including heads that lacked a CWT (approx 1.5%). This approach is based on the methodology used by the Klamath River Technical Team (KRTT) to determine the hatchery composition of fall-run Chinook above Willow Creek Weir on the Trinity River (e.g.,KRTT 2011).
9
Spawner returns to the Mokelumne River Basin were dominated by hatchery-origin fish (Figure 8):
Fall-run returns at MOK were 90% hatchery-origin (34% MOKFt, 18% MOKFn, 32% NIMFn)
Salmon carcasses recovered on the MOK weir were 74% hatchery-origin (50% MOKFt, 18% MOKFn, 27% NIMFn)
Fall-run spawners in the Mokelumne River were 73% hatchery-origin (50% MOKFt, 18% MOKFn, 31% NIMFn)
San Joaquin River Basin Tributaries Four additional escapement surveys were conducted in tributaries of the San Joaquin River: fall-run Chinook counts at MER, as well as fall-run Chinook mark-recapture surveys conducted on the Stanislaus, Tuolumne, and Merced rivers. Fall-run Chinook returns to the Merced River were dominated by hatchery-origin fish while the Stanislaus and Tuolumne rivers were almost equally split between hatchery- and natural-origin spawners (Figure 9):
Fall-run returns at MER were 79% hatchery-origin (37% MOKFt, 18% NIMFn, 12% NIMFtib, 11% CFHFn, 10% MERF)
Fall-run spawners in the Merced River were 78% hatchery-origin (31% NIMFn, 20% FRHFn, 16% MOKFn, 14% MOKFt)
Fall-run spawners in the Stanislaus River were 50% hatchery-origin (31% NIMFn, 26% MOKFn, 23% MOKFt)
Fall-run spawners in the Tuolumne River were 49% hatchery-origin (29% CFHFn, 23% MERF, 19% FRHFn)
2. Relative recovery and stray proportions for hatchery-origin Chinook released in-basin versus hatchery-origin Chinook trucked and released into the waters of the Carquinez Strait (includes Chinook salmon acclimated in net pens and released into San Pablo Bay). Release strategies vary widely among hatcheries from year to year. This variability has often been in response to fluctuating abundances of certain stocks or differing policies among mitigating agencies with respect to “best” release practices. Lack of consistency and “problem releases” among CV hatcheries has limited the number of release groups available for direct comparison of differing release strategies. For these reasons, there are only six release groups recovered in 2010 that allows in-basin releases to be compared directly to trucked/net pen releases. Table 8 summarizes the recovery rates Rtype (in-basin, stray, and ocean) for all release groups with representative recoveries from the CV in 2010. Figures 10 and 11 provide a graphical representation of Rtype for the Sacramento River fall-run Chinook and other CV stocks, respectively. In general, Chinook that were trucked and released directly into the waters of Carquinez Strait or acclimated in bay area net pens had higher relative recovery rates than their respective in-basin releases. These releases also had higher stray proportions than their paired in-basin counterparts. Coleman National Fish Hatchery Releases - Fall-run Chinook Broods 2007 and 2008 For brood 2008 CNFH fall-run Chinook releases, the CV age-2 recovery rate for net pen CNFHn releases (161.5) was 2.3 times greater than in-basin CFHFh releases (70.9). However, while
10
CNFHh releases were only recovered in-basin, the proportion of CFHFn recoveries out-of-basin was very high at 89%. There were three different CNFH release types for brood 2007 fall-run Chinook. The CV age-3 recovery rate for experimental CFHFe releases (164.0) was more than 3.0 times greater than in-basin CFHFh (54.6) and net pen CFHFn (41.2) releases. Less than 1% of CFHFh were recovered out-of-basin compared to straying proportions of 98% and 25% for CFHFn and CFHFe, respectively. Feather River Hatchery Releases – Spring-run Chinook Broods 2006, 2007, and 2008 For brood 2008 FRH spring-run releases, the CV age-2 recovery rate for net pen FRHSn releases (32.2) was slightly higher than in-basin FRHS (28.0) releases. Approximately 10% of FRHSn were recovered out-of-basin while all FRHS CWTs were recovered in-basin. For brood 2007 FRH spring-run releases, the CV age-3 recovery rate for net pen FRHSn releases (440.4) was 1.3 times higher than in-basin FRHS (348.4) releases. Approximately 15% of age-3 FRHSn were recovered out-of-basin while all FRHS CWTs were recovered in-basin. For brood 2006 FRH spring-run releases, the CV age-4 recovery rate for net pen FRHSt releases (19.4) was 3.0 times higher than in-basin FRHS (6.4) releases. Approximately 18% of both FRHSt and FRHS CWTs were recovered out-of-basin. Nimbus Fish Hatchery Release – Fall-run Chinook Brood 2008 For brood 2008 NFH fall-run releases, the CV age-2 recovery rate for net pen NIMFn releases (86.9) was 2.6 times greater than in-basin NIMF releases (33.5). However, while NIMF releases were only recovered in-basin, the proportion of NIMFn recoveries out-of-basin was very low at 6%. Feather River Hatchery Releases – Fall-run Chinook Brood 2008 Although FRH did not have any in-basin releases for broods 2006, 2007 or 2008, they did have experimental FRHFe, net pen FRHFn and trucked FRHFt releases that can be compared. For brood 2008 FRH fall-run releases, the CV age-2 recovery rate for experimental FRHFe releases (135.6) was slightly higher than net pen FRHFn (117.6) releases. The FRHFe releases were actually “hybrid” fish (FRH fall-run x FRH spring-run Chinook). Approximately 5% of both FRHFeand FRHFn were recovered out-of-basin. For brood 2006 FRH fall-run releases, the CV age-4 recovery rate for net pen FRHFn releases (17.2) was 3.1 times higher than experimental FRHFe (5.6) releases. Recoveries of trucked FRHFt (0.7) releases were too low for comparison purposes. Approximately 10% of FRHFn and 9% of FRFHe releases were recovered out-of-basin. It should be noted that many of the FRHFn releases had some fish released directly into the bay so it is impossible to separate true net pen releases from trucked/direct bay ones.
11
3. Relative CV recovery and stray rates of bay releases acclimated in net pens and released directly without acclimatization The same issues related to release practices that limited the available recovery comparisons in the previous section also limited the comparison of net pen releases and direct releases in the Carquinez Strait area. As a result there is only one release type comparison possible. Feather River Hatchery Release – Fall-run Chinook Brood 2007 For brood 2007 FRH fall-run releases, the CV age-3 recovery rate for net pen FRHFn releases (478.4) was 3.9 times higher than trucked/direct bay FRHFt (122.9) releases. Approximately 19% of FRHFt fish were recovered out-of-basin compared to 8% of FRHFn releases. 4. Relative recovery rate and contribution of CV release groups to ocean harvest The relative recovery rate of CV hatchery releases in the 2010 ocean salmon fisheries (sport and commercial combined) varied by age and release group (Figure 12). Of the 4,755 CV CWTsamp collected in the fisheries, most were age-3 (84%), followed by age-2 (12%), age-4 (4%) and age-5 (<1%) fish. The majority of age-2 CV Chinook harvested were in the sport fishery due to its lower size limit (20”-24” total length) compared to the commercial fishery (27” total length). For all age-2 CV releases, trucked MOKFt (42.7) had the highest recovery rate per 100,000 fish released, followed by net pen CFHFn (23.6), San Joaquin basin MERF (11.3), and net pen FRHFn (7.9) releases (Table 8). Net pen releases had the highest recovery rates for age-3 CV fall and spring runs Chinook. The recovery rate for net pen FRHFn (81.2) was more than twice that of NIMFn (37.7) CFHFn, (32.1), FRHSn (29.4) and MOKFn (22.8). There were only in-basin releases of CV late fall-run CFHLh (24.4) for age-3 fish. Relatively few age-4 or age-5 CWT recoveries were made compared to age-2 and age-3 CV fish. In-basin CV late fall-run Chinook CFHLh had the highest recovery rate for age-4 (16.0) and age-5 (0.6) CV releases. Contribution of CV release groups to sport ocean harvest In 2010, anglers harvested an estimated 14,697 Chinook in the California sport ocean salmon fishery. Based on the expanded CWTtotal collected in the fishery, including non-CV Chinook release types, hatchery-origin fish contributed 31%-63% of the total harvest, depending on major port area (Figure 13). Of the hatchery-origin fish, fall-run net pen FRHFn releases dominated the sport catch in all port areas: Monterey (43%), San Francisco (38%), Fort Bragg (22%), and Eureka/Crescent City (27%). Other CV releases contributing to all sport fisheries were net pen NIMFn (4-8%), in-basin CFHFh (5-10%) and net pen CFHFn (3-5%); however there were no recoveries of CFHFh and CFHFn in the Eureka/Crescent City port area. Non-CV stocks also made up a higher proportion (3%) in this northern area. Contribution of CV release groups to commercial ocean harvest Commercial trollers landed an estimated 15,098 Chinook in the California commercial ocean salmon fishery; most salmon (83%) were caught in the Fort Bragg port area. Based on the
12
expanded CWTtotal collected in the fishery, hatchery-origin fish contributed 22%-74% of the total harvest, depending on major port area (Figure 14). Of the hatchery release types, fall-run net pen FRHFn dominated the commercial catch in all port areas: Monterey (50%), San Francisco (14%), and Fort Bragg (22%). The Eureka / Crescent City port area was completely closed to commercial fishing in 2010. Other CV releases contributing to the California commercial fishery were net pen NIMFn (3%-10%) and in-basin CFHFh (3%-8%). In addition, non-CV stocks contributed at a higher overall proportion in the commercial fishery (6%) than in the sport fishery (1%), especially in Fort Bragg (7%) where most of the commercial season occurred in 2010.
Discussion
Estimates of hatchery contributions that are presented in this report should be viewed simply as a “single year (2010) snapshot” of CV Chinook escapement and the California ocean harvest. This was the first year that the majority of all CWT recoveries from CV releases were representatively marked and tagged at a minimum 25% level. Although there were definite differences observed in recovery rates and straying proportions among runs, brood years, and CV release groups, this is just the first step in many needed to statistically analyze the contribution of hatchery and natural-origin salmon to natural areas throughout the CV, evaluate hatchery release strategies, improve California ocean and river salmon fisheries management, and determine if other goals of the CFM program are being met. It is also important to note that most of the CV CWT release groups in this study were produced, released and/or recovered during a time when Sacramento River fall-run Chinook were at historically low levels. Thus these salmon were not susceptible to “normal” ocean or river salmon fisheries since these fisheries were either completely closed or very constrained during the last three years. The effect of interannual variation in survival and year-class strength of both hatchery-origin and natural-origin stocks should be considered when evaluating the status of CV Chinook stocks. At this time neither year class strength or age structure of CV natural-original Chinook are known. Scale-aging work done on 2006, 2007, and 2008 CV Chinook escapement by OSP has indicated that there may be different maturation rates for hatchery and natural-origin fish by stock and basin. It is premature to compare hatchery and natural-origin proportions without having complete brood- and/or stock-specific population estimates. While it may appear that total escapement by hatchery fish in the CV may exceed that of natural-origin fish in any given year, comparing age-specific total escapement (hatchery and natural) once broods complete their life cycle may indicate differences in hatchery and natural ratios for specific age groups and stocks. Such analyses may provide the basis for changing hatchery practices to better mimic wild population parameters. They may also further clarify the effects of specific environmental stressors unique to natural-origin fish and/or specific hatchery CWT release groups. Strategies for CV fall-run production releases in any given year are often a result of two conflicting objectives. Increasing survival rates to allow for greater harvest and escapement often favors release strategies that bypass the Sacramento-San Joaquin Delta. Alternatively, in-basin release practices are aimed at maximizing homing rates back to the hatchery of origin to reduce impacts on natural stocks. It is impossible to make a thorough comparison of hatchery
13
release practices at this time due to the large variability that existed among CWT release types within the same CV hatchery broods examined in this study. Most release types included individual CWT codes that were released at numerous locations at different times and under various conditions (e.g., river water flows and temperatures, bay tidal flows for trucked and net pen releases). While some individual CWT codes were recovered at a relatively high rate, others within the same release type were not recovered at all. The recovery rate Rcwt for individual CWT codes should be examined on a release type basis and the release strategies (in-basin, trucked, net-pen acclimation) that produce the greatest resource value (i.e., highest recovery rate, lowest straying proportion) adopted for future release strategy evaluation. Coordinated and paired hatchery release types will allow for direct comparisons to be made between them and will enrich the available data set used for subsequent evaluation of the hatchery program in the future. The CDFG Fisheries Branch has performed some very preliminary statistical testing to evaluate the significance of differences noted between the performance of individual pairs of release types (Ferreira 2011). Prior to the CFM program, the primary purpose of CV Chinook escapement monitoring was to provide basic status information (e.g., grilse and adult escapement counts) by individual stocks and basins for California hatchery and ocean harvest management needs. The marking, tagging, or collection of CV CWT fish was not a high priority. CV escapement monitoring has expanded to provide data for a broad range of management applications related to recovery planning for listed stocks. These applications include assessing recovery efforts, including habitat restoration work, improving ocean and river fisheries management, and evaluating CV salmon hatchery programs to ensure both mitigation and conservation goals are being met. To meet the needs of these various assessment efforts, a review of current methodologies being employed among CV inland escapement monitoring programs was undertaken by DFG in 2008. The goal of this review was to identify needed changes and/or additions to survey protocols that will ensure both statistically valid estimates of escapement and the collection of biological data, including CWTs and scales, needed for assessment efforts. In 2012, DFG completed the Central Valley Chinook Salmon Escapement Monitoring Plan that recommends methods for estimating escapement and collecting biological data necessary for improved stock assessment in the CV (Bergman et al. 2012). Survey modifications included changes in the current mark-recapture models being utilized, changes in sampling protocols to ensure representative sampling and proper accounting, and the use of counting devices in place of some mark-recapture programs. This monitoring plan is now being implemented among CV surveys to provide the basis for sound CV Chinook assessment and subsequent management. The OSP and DFG Fisheries Branch CWT laboratories in Santa Rosa and Sacramento respectively, have both been expanded and additional staff hired to process the 40,000-60,000 tagged Chinook expected to be recovered annually during CV escapement and California ocean salmon fisheries monitoring. The OSP lab has also expanded its scale-aging capability utilizing state-of-the-art digital imaging. If these data are going to be used in a timely manner to manage CV salmon production and ocean/river fisheries, all CWT data and stock-specific age composition of CV escapement will be needed by February each year. The CV CFM program has been successful in marking and tagging the target numbers of salmon each year at each of the CV hatcheries, and has just begun recovering CWTs in a statistically valid manner throughout the CV. The results from this program, in conjunction with future
14
aging work will provide the best opportunity to manage CV Chinook salmon based on scientifically defensible data. The CFM program should be continued with the current design for several years to provide comparable, consistent data needed for harvest and hatchery management. Current funding for both CFM CWT recovery/processing and scale-aging programs expires in July 2013. Identifying future funding for these programs is essential for the continued enhancement of Chinook management in California’s Central Valley.
Literature Cited
Bergman, J., Nielson, R., and Low, A. 2012. Central Valley Chinook Salmon In-River Escapement Monitoring Plan. California Department of Fish and Game. Fisheries Branch Administrative Report Number: 2012-1. January 2012
Buttars, B. 2007. Constant Fractional Marking/Tagging Program for Central Valley Fall Chinook
Salmon, 2007 Marking Season. Pacific States Marine Fisheries Commission. Buttars, B. 2008. Constant Fractional Marking/Tagging Program for Central Valley Fall Chinook
Salmon, 2008 Marking Season. Pacific States Marine Fisheries Commission. Buttars, B. 2009. Constant Fractional Marking/Tagging Program for Central Valley Fall Chinook
Salmon, 2009 Marking Season. Pacific States Marine Fisheries Commission. Buttars, B. 2010. Constant Fractional Marking/Tagging Program for Central Valley Fall Chinook
Salmon, 2010 Marking Season. Pacific States Marine Fisheries Commission. Ferreira, J. 2011. Coded Wire Tag Recovery Analysis for Central Valley Chinook. California
Department of Fish and Game, Fisheries Branch. Hicks, A.C., Newman, K.B., and Hankin D.G. 2005. A second analysis of a marking, tagging,
and recovery program for Central valley hatchery Chinook salmon. Unpublished report to Central Valley Salmon Team.
Klamath River Technical Team 2011. Klamath River Fall Chinook Salmon Age-Specific
Escapement, River Harvest, and Run Size Estimates, 2010 Run. 24 February 2011
Acknowledgements
Thanks to the following individuals for their assistance in compiling, reviewing and editing data for this report: Jennifer Simon, Barry Miller, and Julie Coombes. Thanks to Rob Titus and Russ Bellmer of DFG Fisheries Branch and David Hankin of Humboldt State University for providing text review and edits for this report. Special kudos are extended to Roxanne Jordan and Barry Dreher of the OSP Santa Rosa CWT lab for processing and reading the thousands of CWTs used in this analysis. We thank the following agencies for providing 2010 CV escapement estimates and their salmon heads/CWT recoveries: DWR Feather River Program, FWS, PSFMC, EBMUD,
15
and YARMT. Additional thanks are extended to staff at the following hatcheries for their cooperation in this monitoring effort: Coleman National Fish Hatchery, Feather River Hatchery, Nimbus Fish Hatchery, Mokelumne River Fish Hatchery, and the Merced River Fish Facility. Last but not least, we want to acknowledge Stan Allen (PSMFC) for his efforts in facilitating the funding, staffing, tagging, and coordination needs of the CFM program. Funding was provided by DFG, DWR, EBMUD, BOR, and the CALFED Ecosystem Restoration Program.
List of Acronyms and Abbreviations
Ad-clipped clipped adipose fin BOR U.S. Bureau of Reclamation CFM Constant Fractional Marking CNFH Coleman National Fish Hatchery CV California Central Valley CWT coded-wire tag DFG California Department of Fish and Game DWR California Department of Water Resources EBMUD East Bay Municipal Utilities District ERP Ecosystem Restoration Program FRH Feather River Hatchery FWS U.S. Fish and Wildlife Service MER Merced River Hatchery MOK Mokelumne River Hatchery NFH Nimbus Fish Hatchery OSP Ocean Salmon Project PSMFC Pacific States Marine Fisheries Commission RMPC Regional Mark Processing Center YARMT Yuba Accord River Management Team
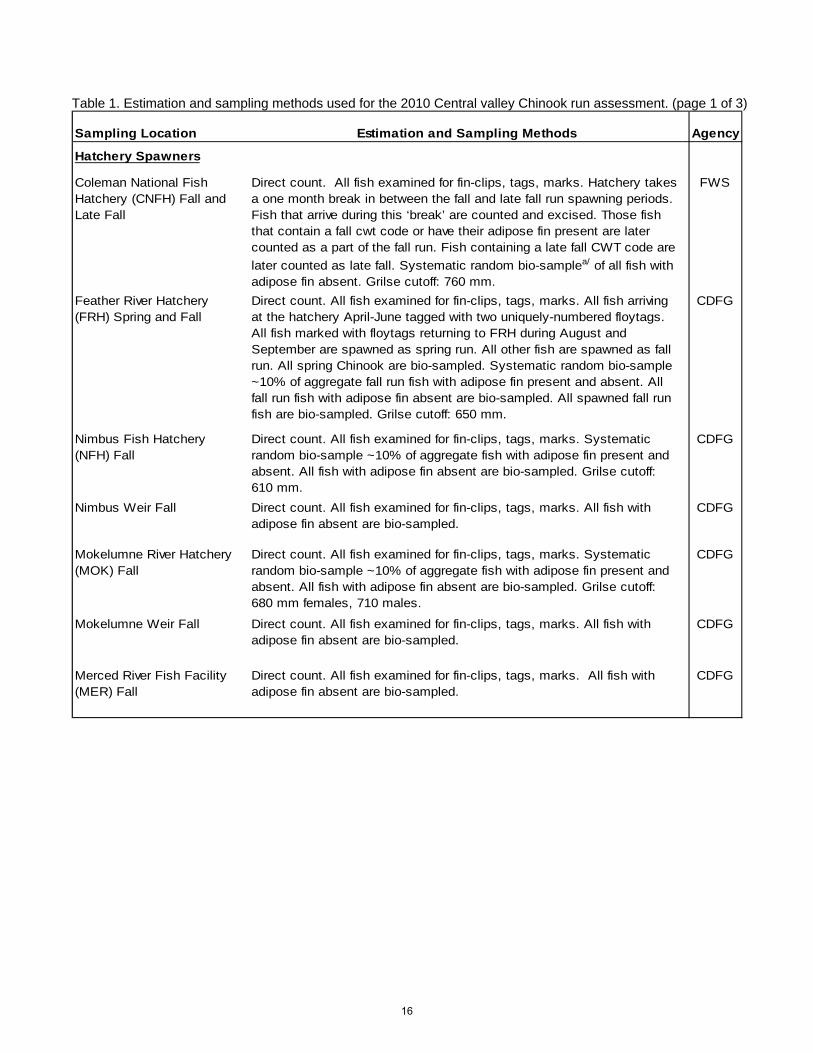
Table 1. Estimation and sampling methods used for the 2010 Central valley Chinook run assessment. (page 1 of 3)
Sampling Location Estimation and Sampling Methods Agency
Hatchery Spawners
Coleman National Fish Hatchery (CNFH) Fall and Late Fall
Direct count. All fish examined for fin-clips, tags, marks. Hatchery takes a one month break in between the fall and late fall run spawning periods. Fish that arrive during this ‘break’ are counted and excised. Those fish that contain a fall cwt code or have their adipose fin present are later counted as a part of the fall run. Fish containing a late fall CWT code are
later counted as late fall. Systematic random bio-samplea/ of all fish with adipose fin absent. Grilse cutoff: 760 mm.
FWS
Feather River Hatchery (FRH) Spring and Fall
Direct count. All fish examined for fin-clips, tags, marks. All fish arriving at the hatchery April-June tagged with two uniquely-numbered floytags. All fish marked with floytags returning to FRH during August and September are spawned as spring run. All other fish are spawned as fall run. All spring Chinook are bio-sampled. Systematic random bio-sample ~10% of aggregate fall run fish with adipose fin present and absent. All fall run fish with adipose fin absent are bio-sampled. All spawned fall run fish are bio-sampled. Grilse cutoff: 650 mm.
CDFG
Nimbus Fish Hatchery (NFH) Fall
Direct count. All fish examined for fin-clips, tags, marks. Systematic random bio-sample ~10% of aggregate fish with adipose fin present and absent. All fish with adipose fin absent are bio-sampled. Grilse cutoff: 610 mm.
CDFG
Nimbus Weir Fall Direct count. All fish examined for fin-clips, tags, marks. All fish with adipose fin absent are bio-sampled.
CDFG
Mokelumne River Hatchery (MOK) Fall
Direct count. All fish examined for fin-clips, tags, marks. Systematic random bio-sample ~10% of aggregate fish with adipose fin present and absent. All fish with adipose fin absent are bio-sampled. Grilse cutoff: 680 mm females, 710 males.
CDFG
Mokelumne Weir Fall Direct count. All fish examined for fin-clips, tags, marks. All fish with adipose fin absent are bio-sampled.
CDFG
Merced River Fish Facility (MER) Fall
Direct count. All fish examined for fin-clips, tags, marks. All fish with adipose fin absent are bio-sampled.
CDFG
16
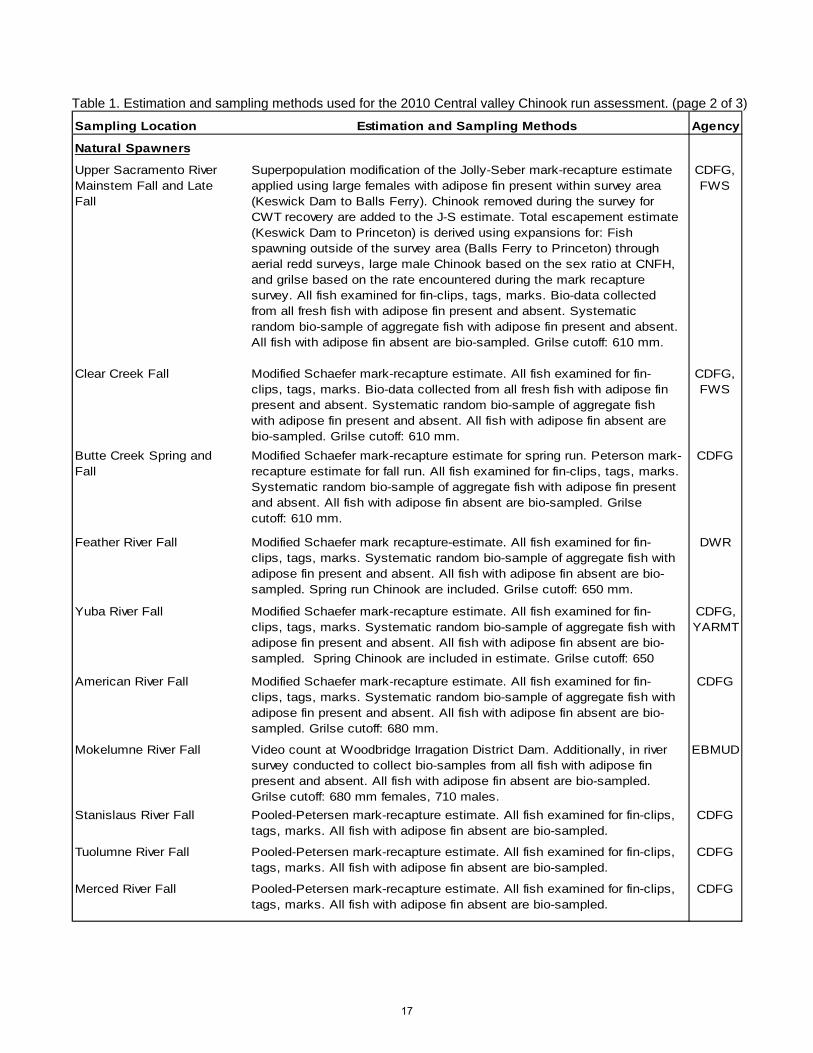
Table 1. Estimation and sampling methods used for the 2010 Central valley Chinook run assessment. (page 2 of 3)
Sampling Location Estimation and Sampling Methods Agency
Natural Spawners
Upper Sacramento River Mainstem Fall and Late Fall
Superpopulation modification of the Jolly-Seber mark-recapture estimate applied using large females with adipose fin present within survey area (Keswick Dam to Balls Ferry). Chinook removed during the survey for CWT recovery are added to the J-S estimate. Total escapement estimate (Keswick Dam to Princeton) is derived using expansions for: Fish spawning outside of the survey area (Balls Ferry to Princeton) through aerial redd surveys, large male Chinook based on the sex ratio at CNFH, and grilse based on the rate encountered during the mark recapture survey. All fish examined for fin-clips, tags, marks. Bio-data collected from all fresh fish with adipose fin present and absent. Systematic random bio-sample of aggregate fish with adipose fin present and absent. All fish with adipose fin absent are bio-sampled. Grilse cutoff: 610 mm.
CDFG, FWS
Clear Creek Fall Modified Schaefer mark-recapture estimate. All fish examined for fin-clips, tags, marks. Bio-data collected from all fresh fish with adipose fin present and absent. Systematic random bio-sample of aggregate fish with adipose fin present and absent. All fish with adipose fin absent are bio-sampled. Grilse cutoff: 610 mm.
CDFG, FWS
Butte Creek Spring and Fall
Modified Schaefer mark-recapture estimate for spring run. Peterson mark-recapture estimate for fall run. All fish examined for fin-clips, tags, marks. Systematic random bio-sample of aggregate fish with adipose fin present and absent. All fish with adipose fin absent are bio-sampled. Grilse cutoff: 610 mm.
CDFG
Feather River Fall Modified Schaefer mark recapture-estimate. All fish examined for fin-clips, tags, marks. Systematic random bio-sample of aggregate fish with adipose fin present and absent. All fish with adipose fin absent are bio-sampled. Spring run Chinook are included. Grilse cutoff: 650 mm.
DWR
Yuba River Fall Modified Schaefer mark-recapture estimate. All fish examined for fin-clips, tags, marks. Systematic random bio-sample of aggregate fish with adipose fin present and absent. All fish with adipose fin absent are bio-sampled. Spring Chinook are included in estimate. Grilse cutoff: 650
CDFG, YARMT
American River Fall Modified Schaefer mark-recapture estimate. All fish examined for fin-clips, tags, marks. Systematic random bio-sample of aggregate fish with adipose fin present and absent. All fish with adipose fin absent are bio-sampled. Grilse cutoff: 680 mm.
CDFG
Mokelumne River Fall Video count at Woodbridge Irragation District Dam. Additionally, in river survey conducted to collect bio-samples from all fish with adipose fin present and absent. All fish with adipose fin absent are bio-sampled. Grilse cutoff: 680 mm females, 710 males.
EBMUD
Stanislaus River Fall Pooled-Petersen mark-recapture estimate. All fish examined for fin-clips, tags, marks. All fish with adipose fin absent are bio-sampled.
CDFG
Tuolumne River Fall Pooled-Petersen mark-recapture estimate. All fish examined for fin-clips, tags, marks. All fish with adipose fin absent are bio-sampled.
CDFG
Merced River Fall Pooled-Petersen mark-recapture estimate. All fish examined for fin-clips, tags, marks. All fish with adipose fin absent are bio-sampled.
CDFG
17
Table 1. Estimation and sampling methods used for the 2010 Central valley Chinook run assessment. (page 3 of 3)
Sampling Location Estimation and Sampling Methods Agency
Recreational Harvest
Upper Sacramento River Fall
Open October 9th to October 31st from Highway 113 Bridge to Deschutes Road Bridge. Stratified-random sampling design (one weekday and one weekend sample per week per section during the open season per management zone) that included both roving and access interview components, and the collection of coded-wire tags from adipose fin-clipped salmon for stock identification. Bio-data collected during angler interviews.
CDFG
Feather River Fall Open July 31st to August 29th below the Thermolito Afterbay Outlet. Stratified-random sampling design (one weekday and one weekend sample per week per section during the open season per management zone) that included both roving and access interview components, and the collection of coded-wire tags from adipose fin-clipped salmon for stock identification. Bio-data collected during angler interviews.
CDFG
American River Fall Open October 30th to November 28th from the mouth to the SMUD power line crossing at Ancil Hoffman Park. Stratified-random sampling design (one weekday and one weekend sample per week per section during the open season per management zone) that included both roving and access interview components, and the collection of coded-wire tags from adipose fin-clipped salmon for stock identification. Bio-data collected during angler interviews.
CDFG
Lower Sacramento River Fall
Open September 4th to October 3rd from the Carquinez Bridge to the Highway 113 Bridge. Stratified-random sampling design (one weekday and one weekend sample per week per section during the open season per management zone) that included both roving and access interview components, and the collection of coded-wire tags from adipose fin-clipped salmon for stock identification. Bio-data collected during angler interviews.
CDFG
Upper Sacramento River Late Fall
Open November 1st to December 12th from Highway 113 Bridge to Deschutes Road Bridge. Stratified-random sampling design (one weekday and one weekend sample per week per section during the open season per management zone) that included both roving and access interview components, and the collection of coded-wire tags from adipose fin-clipped salmon for stock identification. Bio-data collected during angler interviews.
CDFG
a/ Biological samples ("bio-samples" or "bio-data") of live fish or carcasses generally include: sex, fork length, scales, tags or marks, and CWT recovery from ad-clipped fish.
18
Table 2. 2010 California ocean sport and commerial salmon fishery seasons by major port area.
Major Port Area Season Size Limita/ Season Size Limita/ QuotaCrescent City/Eureka May 29-Sep 6 24" TL closed -- --
Fort Bragg Apr 3-30 20" TL July 1-4, 8-11 27" TL none May 1-Sep 6 24" TL July 15-29 27" TL 18,000
Aug 1-31 27" TL 9,375
San Francisco Apr 3-30 20" TL July 1-4, 8-11 27" TL none May 1-Sep 6 24" TL (closed Tue/Wed)
Monterey/Morro Bay Apr 3-30 20" TL July 1-4, 8-11 27" TL none May 1-Sep 6 24" TL (closed Tue/Wed)
a/ Size limit in total length (TL).
Sport Commercial
19
Table 3. Central Valley coded-wire tag (CWT) Chinook releases by age, stock, run and release type, brood years 2006-2009. (page 1 of 2) Age 2 CWT releasesRelease Brood Hatchery Stock Run CWT Total fish # CWT % Releasetype* year / wild origin type codes released tagged CWT strategy Release locations / notes
FRHS 2008 FRH Fea R Spr 5 1,016,835 1,015,717 100% Basin Boyds Pump Ramp
FRHSn 2008 FRH Fea R Spr 5 1,007,177 1,005,727 100% Bay pens San Pablo Bay net pens
CFHFh 2008 CNFH Sac R Fall 27 12,529,146 3,128,111 25% Basin CNFH
CFHFn 2008 CNFH Sac R Fall 3 1,427,439 371,685 26% Bay pens Mare Island net pens, San Pablo Bay net pens
FRHFn 2008 FRH Fea R Fall 11 7,760,969 2,061,211 27% Bay pens Mare Island net pens, San Pablo Bay net pens,Wickland Oil net pens
FRHFe 2008 FRH Fea R Hybrid 30 498,341 481,853 97% CV exper Fall x Spr hybrid releases: Benicia, Discovery Pk, Elkhorn BoatLaunch, Miller Park, Sac River at Garcia Bend and Pittsburg
FRHFtib 2008 FRH Fea R Fall 2 91,631 89,859 98% Tiberon pens Held 3-4 mos Tiberon net pens, released as yearlings
FeaFw 2008 wild Fea R Fall 37 292,423 289,830 99% Basin Feather River Hatchery, Thermalito Bypass
NIMF 2008 NIM Ame R Fall 1 267,003 264,006 99% Basin American River
NIMFn 2008 NIM Ame R Fall 4 3,924,440 976,955 25% Bay pens Mare Island net pens
MOKFt 2008 MOK Mok R Fall 4 250,969 250,300 100% Trucked Sherman Island
MokFw 2008 wild Mok R Fall 5 24,911 20,680 83% Basin Woodbridge, Mok R Vino farms
MERF 2008 MER Mer R Fall 2 34,532 32,978 95% Basin Jersey Pt (San Joaquin River)
CFHLh 2009 CNFH Sac R Late 16 1,134,119 1,115,378 98% Basin CNFH (includes spring surrogate releases)
Total age 2 releases: 152 30,259,935 11,104,290 37% 1% wild releases
Age 3 CWT releasesRelease Brood Hatchery Stock Run CWT Total fish # CWT % Releasetype* year / wild origin type codes released tagged CWT strategy Release locations / notesButSw 2007 wild Butte Ck Spr 30 317,706 311,061 98% Basin Baldwin Construction Yard
FRHS 2007 FRH Fea R Spr 8 1,414,343 1,378,941 97% Basin Boyds Pump Ramp (on Feather River)
FRHSn 2007 FRH Fea R Spr 2 1,271,761 1,242,480 98% Bay pens San Pablo Bay net pens, Wickland Oil net pens
CFHFe 2007 CNFH Sac R Fall 8 200,619 196,993 98% CV exper Clarksburg, Red Bluff Diversion Dam
CFHFh 2007 CNFH Sac R Fall 14 11,232,241 2,801,459 25% Basin CNFH
CFHFn 2007 CNFH Sac R Fall 3 1,266,949 314,681 25% Bay pens San Pablo Bay net pens (Conoco Phillips, Mare Island);75% truck mortality noted for one release
FRHFe 2007 FRH Fea R Fall 19 623,567 619,085 99% CV exper Elkhorn Boat Ramp,Isleton, Lighthouse Marina, West Sacramento
FRHFn 2007 FRH Fea R Fall 9 9,422,521 2,347,396 25% Bay pens Mare Island net pens, San Pablo Bay net pens, Wickland Oil net pens
FRHFt 2007 FRH Fea R Fall 4 102,225 101,712 99% Trucked Benicia
FeaFw 2007 wild Fea R Fall 19 208,717 206,683 99% Basin Thermalito Bypass
NIMFn 2007 NIM/MOK Ame R Fall 7 6,879,664 1,714,858 25% Bay pens Raised at both NIM and MOK; San Pablo Bay net pens
NIMFtib 2007 MOK Ame R Fall 1 51,600 51,600 100% Tiberon pens Raised at MOK; held 3-4 mos Tiberon net pens, released as yearlings
MOKF 2007 MOK Mok R Fall 1 406,593 101,458 25% Basin New Hope Landing
MOKFn 2007 MOK Mok R Fall 2 2,203,488 550,668 25% Bay pens San Pablo Bay net pens
MokFw 2007 wild Mok R Fall 1 315 315 100% Basin Mokelumne River
CFHLh 2008 CNFH Sac R Late 14 1,106,673 1,072,854 97% Basin CNFH (includes spring surrogate releases)
Total age 3 releases: 142 36,708,982 13,012,244 35% 1% wild releases 20
Table 3. Central Valley coded-wire tag (CWT) Chinook releases by age, stock, run and release type, brood years 2006-2009. (page 2 of 2) Age 4 CWT releasesRelease Brood Hatchery Stock Run CWT Total fish # CWT % Releasetype* year / wild origin type codes released tagged CWT strategy Release locations / notesButSw 2006 wild Spr 27 283,749 279,936 99% Basin Baldwin Construction Yard
FRHS 2006 FRH Fea R Spr 1 1,043,284 1,004,683 96% Basin Fea R Hatchery
FRHSt 2006 FRH Fea R Spr 9 1,036,931 1,026,561 99% Trucked Wickland Oil Terminal (no pens)
YubSw 2006 wild Yub R Spr 16 182,730 179,853 98% Basin Yuba River
CFHFe 2006 CNFH Sac R Fall 8 201,812 196,108 97% CV exper Clarksburg, Red Bluff Diversion Dam
CFHFh 2006 CNFH Sac R Fall 8 12,113,781 3,032,082 25% Basin CNFH
FRHFe 2006 FRH Fea R Fall 34 573,386 564,904 99% CV exper Elkhorn Boat Ramp,Isleton, Lighthouse Marina, West Sacramento, Yolo Bypass
FRHFn 2006 FRH Fea R Fall 8 8,154,003 1,995,912 24% Bay pens, Wickland Oil net pens - proportion of trucked fish placed in pens,Trucked varies from 35%-100%; remainder dumped directly into bay
FRHFt 2006 FRH Fea R Fall 9 1,018,073 305,755 30% Trucked Benicia, Wickland Oil Terminal (no pens)
FeaFw 2006 wild Fea R Fall 17 188,293 186,478 99% Basin Thermalito Bypass
YubFw 2006 wild Yub R Fall 14 62,426 61,295 98% Basin Yuba River
NIMFn 2006 NIM Ame-Mok Fall 5 6,128,032 1,527,846 25% Coastal & Amer-Moke fish accidentally mixed, released into multiple net pens: Bay pens, 18% coastal (Avila, Santa Cruz), 82% Bay net pens. American stockTrucked trucked to Wickland Oil net pens (approx 87% placed into pens)
MOKF 2006 MOK Mok R Fall 7 3,706,436 925,826 25% Basin New Hope Landing
MOKFn 2006 MOK Mok R Fall 2 227,412 55,427 24% Coastal & Coastal and ocean net pens (Port San Luis,Santa Cruz, Moss Bay pens Landing & Selby/Wickland net pens)
MOKFt 2006 MOK Mok R Fall 1 1,127,138 281,582 25% Trucked Wickland Oil Terminal (no pens)
MokFw 2006 wild Mok R Fall 2 13,903 10,968 79% Basin Mok R
MERF 2006 MER Mer R Fall 12 312,294 304,121 97% Basin Hatfield State Area, MER
CFHLe 2007 CNFH Sac R Late 17 309,829 299,292 97% CV exper Sac R (Colusa to RBDD), Georgianna Slough, Port Chicago, Ryde-Koket
CFHLh 2007 CNFH Sac R Late 9 738,638 723,091 98% Basin CNFH (includes spring surrogate releases)
Total age 4 releases: 206 37,422,150 12,961,720 35% 2% wild releases
*CV CWT release types:Sacramento River Basin Fall Chinook CWT release groups San Joaquin Basin Fall Chinook CWT release groupsCFHFe Coleman National Fish Hatchery (CNFH) fall experimental releases MOKF Mokelumne Hatchery fall basin releases CFHFh Coleman National Fish Hatchery fall hatchery releases MOKFn Mokelumne Hatchery fall net pen releasesCFHFn Coleman National Fish Hatchery fall net pen releases MOKFt Mokelumne Hatchery fall trucked releases FRHFe Feather River Hatchery fall experimental (2008 brdyr includes spring x fall hybrids) MokFw Mokelumne River fall wildFRHFn Feather River Hatchery fall net pen releases MerF Merced Hatchery fall releasesFRHFt Feather River Hatchery fall trucked releases (no net pens)FRHFtn Feather River Hatchery fall Tiburon net pen releases (released as yearlings following fall) Central Valley Spring Chinook CWT release groupsFeaFw Feather River fall wild FRHS Feather River Hatchery spring basin releasesYubFw Yuba River fall wild FRHSn Feather River Hatchery spring net pen releasesNIMFn Nimbus Fish Hatchery fall net pens FRHSt Feather River Hatchery spring trucked releasesNIMFtib Nimbus Fish Hatchery fall Tiburon net pens (released as yearlings following fall) ButSw Butte Creek spring wild
YubSw Yuba River spring wildSacramento River Basin Late Fall Chinook CWT release groupsCFHLe Coleman National Fish Hatchery late fall experimental releasesCFHLh Coleman National Fish Hatchery late fall hatchery releases 21
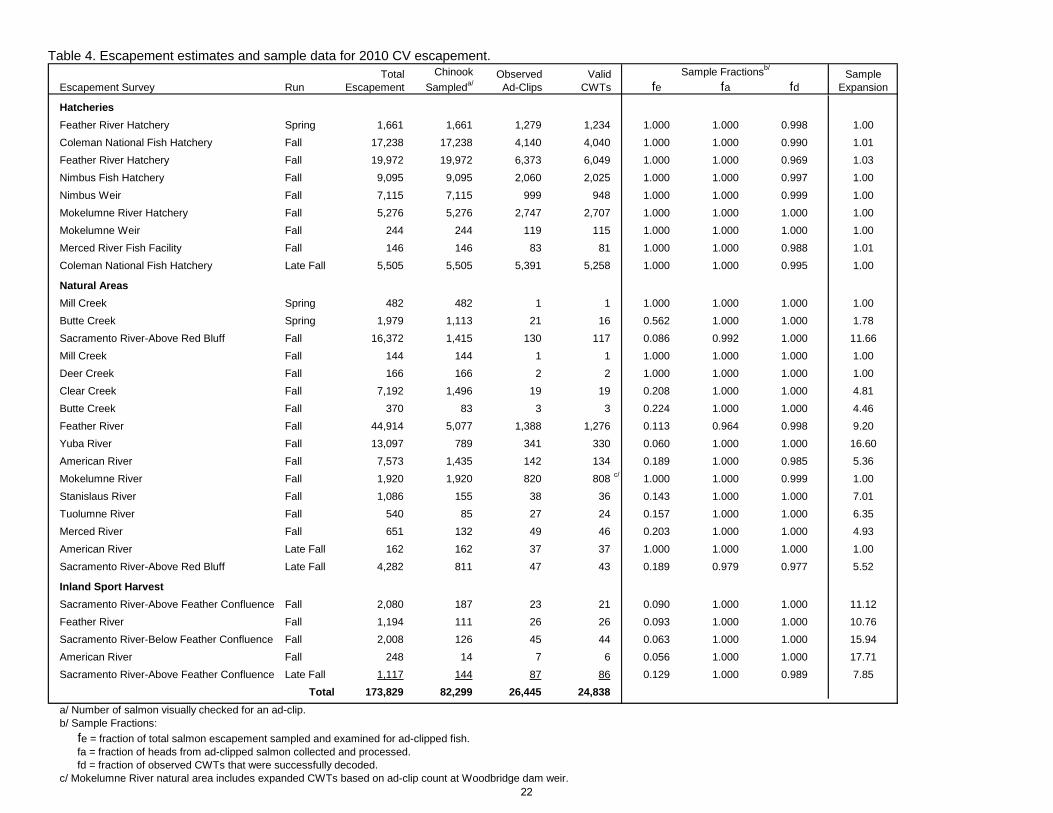
Table 4. Escapement estimates and sample data for 2010 CV escapement.
Escapement Survey Run fe fa fd
Hatcheries
Feather River Hatchery Spring 1,661 1,661 1,279 1,234 1.000 1.000 0.998 1.00
Coleman National Fish Hatchery Fall 17,238 17,238 4,140 4,040 1.000 1.000 0.990 1.01
Feather River Hatchery Fall 19,972 19,972 6,373 6,049 1.000 1.000 0.969 1.03
Nimbus Fish Hatchery Fall 9,095 9,095 2,060 2,025 1.000 1.000 0.997 1.00
Nimbus Weir Fall 7,115 7,115 999 948 1.000 1.000 0.999 1.00
Mokelumne River Hatchery Fall 5,276 5,276 2,747 2,707 1.000 1.000 1.000 1.00
Mokelumne Weir Fall 244 244 119 115 1.000 1.000 1.000 1.00
Merced River Fish Facility Fall 146 146 83 81 1.000 1.000 0.988 1.01
Coleman National Fish Hatchery Late Fall 5,505 5,505 5,391 5,258 1.000 1.000 0.995 1.00
Natural Areas
Mill Creek Spring 482 482 1 1 1.000 1.000 1.000 1.00
Butte Creek Spring 1,979 1,113 21 16 0.562 1.000 1.000 1.78
Sacramento River-Above Red Bluff Fall 16,372 1,415 130 117 0.086 0.992 1.000 11.66
Mill Creek Fall 144 144 1 1 1.000 1.000 1.000 1.00
Deer Creek Fall 166 166 2 2 1.000 1.000 1.000 1.00
Clear Creek Fall 7,192 1,496 19 19 0.208 1.000 1.000 4.81
Butte Creek Fall 370 83 3 3 0.224 1.000 1.000 4.46
Feather River Fall 44,914 5,077 1,388 1,276 0.113 0.964 0.998 9.20
Yuba River Fall 13,097 789 341 330 0.060 1.000 1.000 16.60
American River Fall 7,573 1,435 142 134 0.189 1.000 0.985 5.36
Mokelumne River Fall 1,920 1,920 820 808 c/ 1.000 1.000 0.999 1.00
Stanislaus River Fall 1,086 155 38 36 0.143 1.000 1.000 7.01
Tuolumne River Fall 540 85 27 24 0.157 1.000 1.000 6.35
Merced River Fall 651 132 49 46 0.203 1.000 1.000 4.93
American River Late Fall 162 162 37 37 1.000 1.000 1.000 1.00
Sacramento River-Above Red Bluff Late Fall 4,282 811 47 43 0.189 0.979 0.977 5.52
Inland Sport Harvest
Sacramento River-Above Feather Confluence Fall 2,080 187 23 21 0.090 1.000 1.000 11.12
Feather River Fall 1,194 111 26 26 0.093 1.000 1.000 10.76
Sacramento River-Below Feather Confluence Fall 2,008 126 45 44 0.063 1.000 1.000 15.94
American River Fall 248 14 7 6 0.056 1.000 1.000 17.71
Sacramento River-Above Feather Confluence Late Fall 1,117 144 87 86 0.129 1.000 0.989 7.85
Total 173,829 82,299 26,445 24,838
a/ Number of salmon visually checked for an ad-clip.b/ Sample Fractions:
fe = fraction of total salmon escapement sampled and examined for ad-clipped fish.fa = fraction of heads from ad-clipped salmon collected and processed.fd = fraction of observed CWTs that were successfully decoded.
c/ Mokelumne River natural area includes expanded CWTs based on ad-clip count at Woodbridge dam weir.
Sample Expansion
Sample Fractionsb/Total
Escapement
Chinook
Sampleda/Observed
Ad-ClipsValid
CWTs
22
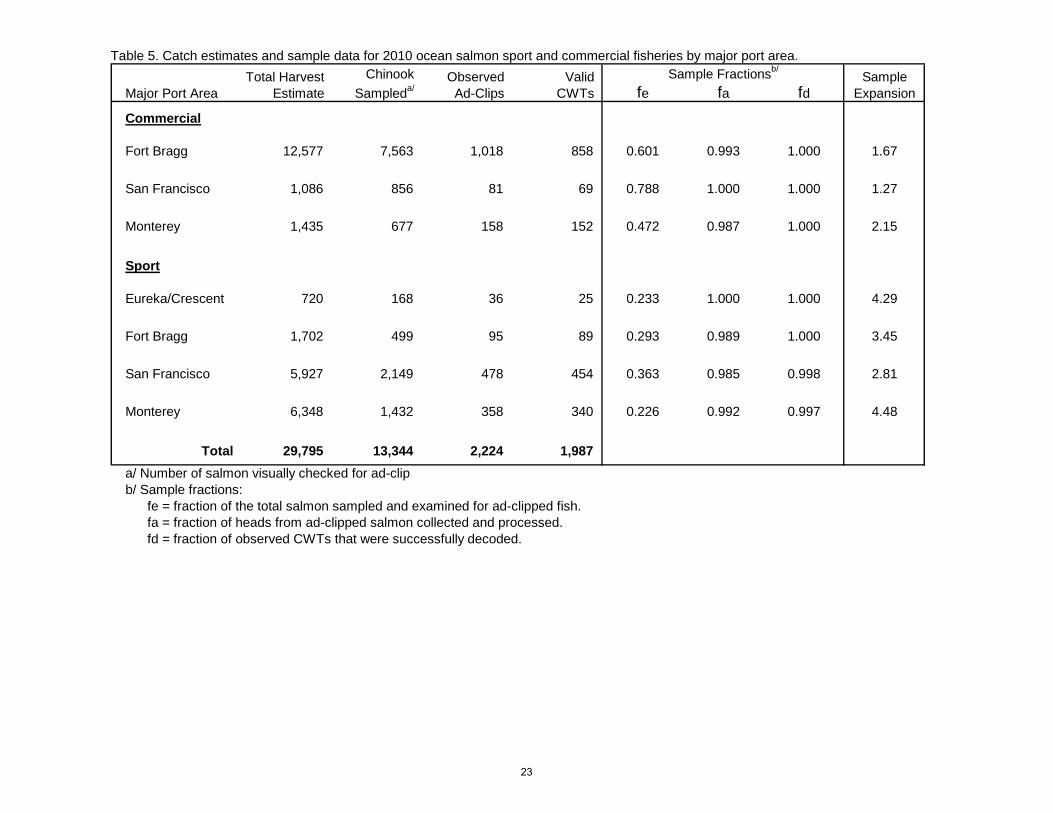
Table 5. Catch estimates and sample data for 2010 ocean salmon sport and commercial fisheries by major port area.
Major Port Area fe fa fd
Commercial
Fort Bragg 12,577 7,563 1,018 858 0.601 0.993 1.000 1.67
San Francisco 1,086 856 81 69 0.788 1.000 1.000 1.27
Monterey 1,435 677 158 152 0.472 0.987 1.000 2.15
Sport
Eureka/Crescent 720 168 36 25 0.233 1.000 1.000 4.29
Fort Bragg 1,702 499 95 89 0.293 0.989 1.000 3.45
San Francisco 5,927 2,149 478 454 0.363 0.985 0.998 2.81
Monterey 6,348 1,432 358 340 0.226 0.992 0.997 4.48
Total 29,795 13,344 2,224 1,987
a/ Number of salmon visually checked for ad-clipb/ Sample fractions:
fe = fraction of the total salmon sampled and examined for ad-clipped fish.fa = fraction of heads from ad-clipped salmon collected and processed.fd = fraction of observed CWTs that were successfully decoded.
Chinook
Sampleda/Total Harvest
Estimate
Sample Fractionsb/Sample
ExpansionValid
CWTsObserved
Ad-Clips
23
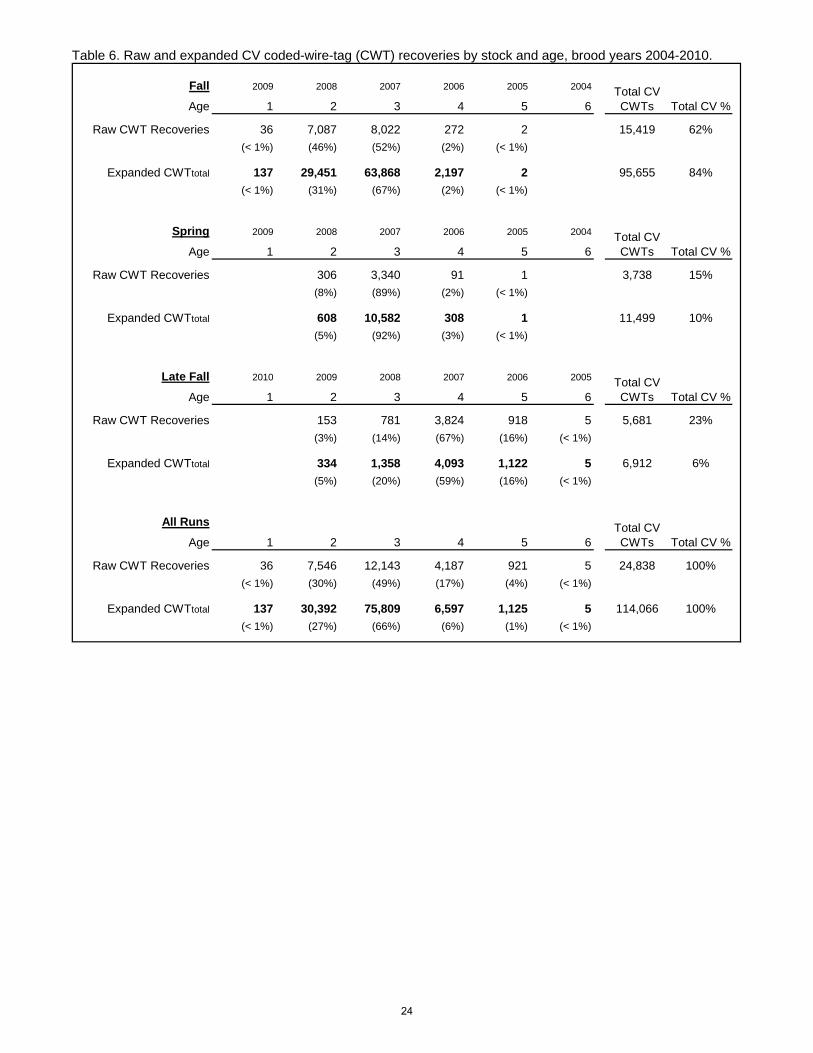
Table 6. Raw and expanded CV coded-wire-tag (CWT) recoveries by stock and age, brood years 2004-2010.
Fall 2009 2008 2007 2006 2005 2004
Age 1 2 3 4 5 6
36 7,087 8,022 272 2 15,419 62%
(< 1%) (46%) (52%) (2%) (< 1%)
137 29,451 63,868 2,197 2 95,655 84%
(< 1%) (31%) (67%) (2%) (< 1%)
Spring 2009 2008 2007 2006 2005 2004
Age 1 2 3 4 5 6
306 3,340 91 1 3,738 15%
(8%) (89%) (2%) (< 1%)
608 10,582 308 1 11,499 10%
(5%) (92%) (3%) (< 1%)
Late Fall 2010 2009 2008 2007 2006 2005
Age 1 2 3 4 5 6
153 781 3,824 918 5 5,681 23%
(3%) (14%) (67%) (16%) (< 1%)
334 1,358 4,093 1,122 5 6,912 6%
(5%) (20%) (59%) (16%) (< 1%)
All Runs
Age 1 2 3 4 5 6
36 7,546 12,143 4,187 921 5 24,838 100%
(< 1%) (30%) (49%) (17%) (4%) (< 1%)
137 30,392 75,809 6,597 1,125 5 114,066 100%
(< 1%) (27%) (66%) (6%) (1%) (< 1%)
Raw CWT Recoveries
Expanded CWTtotal
Raw CWT Recoveries
Expanded CWTtotal
Raw CWT Recoveries
Expanded CWTtotal
Raw CWT Recoveries
Expanded CWTtotal
Total CV %Total CV CWTs
Total CV CWTs Total CV %
Total CV CWTs Total CV %
Total CV CWTs Total CV %
24
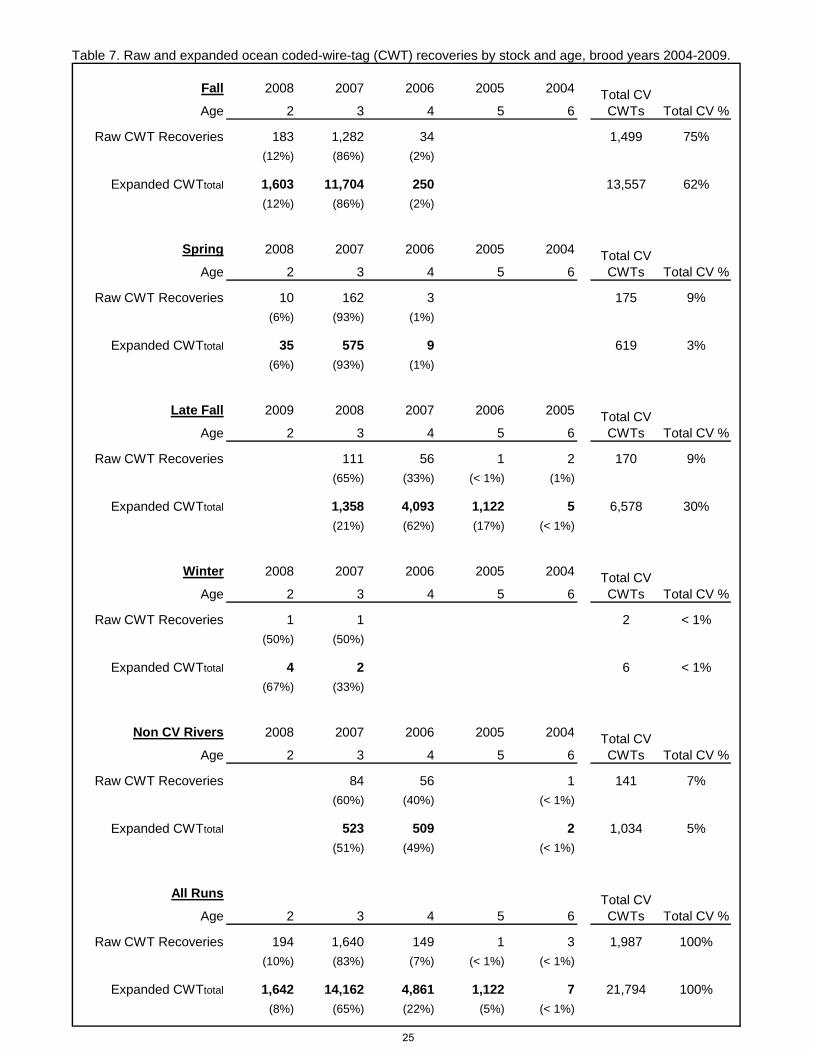
Table 7. Raw and expanded ocean coded-wire-tag (CWT) recoveries by stock and age, brood years 2004-2009.
Fall 2008 2007 2006 2005 2004
Age 2 3 4 5 6
183 1,282 34 1,499 75%
(12%) (86%) (2%)
1,603 11,704 250 13,557 62%
(12%) (86%) (2%)
Spring 2008 2007 2006 2005 2004
Age 2 3 4 5 6
10 162 3 175 9%
(6%) (93%) (1%)
35 575 9 619 3%
(6%) (93%) (1%)
Late Fall 2009 2008 2007 2006 2005
Age 2 3 4 5 6
111 56 1 2 170 9%
(65%) (33%) (< 1%) (1%)
1,358 4,093 1,122 5 6,578 30%
(21%) (62%) (17%) (< 1%)
Winter 2008 2007 2006 2005 2004
Age 2 3 4 5 6
1 1 2 < 1%
(50%) (50%)
4 2 6 < 1%
(67%) (33%)
Non CV Rivers 2008 2007 2006 2005 2004
Age 2 3 4 5 6
84 56 1 141 7%
(60%) (40%) (< 1%)
523 509 2 1,034 5%
(51%) (49%) (< 1%)
All Runs
Age 2 3 4 5 6
194 1,640 149 1 3 1,987 100%
(10%) (83%) (7%) (< 1%) (< 1%)
1,642 14,162 4,861 1,122 7 21,794 100%
(8%) (65%) (22%) (5%) (< 1%)
Total CV CWTs Total CV %
Total CV CWTs Total CV %
Total CV CWTs Total CV %
Total CV CWTs Total CV %
Total CV CWTs Total CV %
Total CV CWTs Total CV %
Raw CWT Recoveries
Expanded CWTtotal
Raw CWT Recoveries
Expanded CWTtotal
Raw CWT Recoveries
Expanded CWTtotal
Raw CWT Recoveries
Expanded CWTtotal
Raw CWT Recoveries
Expanded CWTtotal
Expanded CWTtotal
Raw CWT Recoveries
25
Table 8. 2010 CWT recovery rate (recoveries per 100,000 CWTs released) by release type, brood year, and recovery location. (page 1 of 2)
Age 2 CV recoveries
Release Brood Run # CWT Ocean CV Stray
type year type tagged Battle ck Up Sac Nat crks* Fea/Yub Amer Moke Merc Stan CV total Basin Stray CWTsamp Basin Stray CV total Ocean Proportion
FRHS 2008 Spr 1,015,717 284 284 284 12 28.0 28.0 1.2 0.00
FRHSn 2008 Spr 1,005,727 23 291 8 1 323 291 33 23 28.9 3.2 32.2 2.3 0.10
CFHFh 2008 Fall 3,128,111 2,196 23 2,219 2,219 102 70.9 70.9 3.3 0.00
CFHFn 2008 Fall 371,685 44 23 14 213 221 44 7 33 600 68 533 88 18.2 143.3 161.5 23.6 0.89
FRHFn 2008 Fall 2,061,211 17 12 2,297 70 13 1 13 2,423 2,297 126 163 111.4 6.1 117.6 7.9 0.05
FRHFe 2008 Fall 481,853 623 30 653 623 30 27 129.3 6.3 135.6 5.6 0.05
FRHFtib 2008 Fall 89,859 7 48 11 67 48 18 5 53.6 20.5 74.1 5.1 0.28
FeaFw 2008 Fall 289,830 12 12 12 4.2 4.2 0.00
NIMF 2008 Fall 264,006 88 88 88 33.5 33.5 0.00
NIMFn 2008 Fall 976,955 12 3 800 33 1 849 800 49 34 81.9 5.0 86.9 3.5 0.06
MOKFt 2008 Fall 250,300 2 4 3 151 2,176 111 158 2,606 2,176 430 107 869.4 171.8 1041.2 42.7 0.17
MokFw 2008 Fall 20,680 4 4 4 2 18.7 18.7 7.4 0.00
MERF 2008 Fall 32,978 4 6 36 23 100 31 78 278 31 247 4 93.5 749.6 843.0 11.3 0.89
CFHLh 2009 Late 1,115,378 130 1 2 133 130 3 11.7 0.3 12.0 0.02
Age 3 CV recoveriesRelease Brood Run # CWT Ocean CV Stray
type year type tagged Battle ck Up Sac Nat crks* Fea/Yub Amer Moke Merc Stan CV total Basin Stray CWTs Basin Stray CV total Ocean Proportion
ButSw 2007 Spr 311,061 5 5 5 1.7 1.7 0.00
FRHS 2007 Spr 1,378,941 4,804 4,804 4,804 195 348.4 348.4 14.1 0.00
FRHSn 2007 Spr 1,242,480 11 501 24 4,650 245 22 19 5,471 4,650 822 365 374.2 66.1 440.4 29.4 0.15
CFHFe 2007 Fall 196,993 68 175 5 55 20 1 323 243 81 30 123.1 40.9 164.0 15.2 0.25
CFHFh 2007 Fall 2,801,459 1,392 117 20 1,529 1,508 20 311 53.8 0.7 54.6 11.1 0.01
CFHFn 2007 Fall 314,681 2 33 73 15 6 130 2 128 101 0.6 40.5 41.2 32.1 0.98
FRHFe 2007 Fall 619,085 12 203 8 223 203 20 22 32.8 3.2 36.0 3.6 0.09
FRHFn 2007 Fall 2,347,396 18 373 39 10,339 390 39 25 6 11,230 10,339 891 1905 440.4 38.0 478.4 81.2 0.08
FRHFt 2007 Fall 101,712 12 101 10 3 125 101 24 15 99.1 23.8 122.9 14.7 0.19
FeaFw 2007 Fall 206,683 29 29 29 14.0 14.0 0.00
NIMFn 2007 Fall 1,714,858 2 12 6 1,159 457 43 48 1,727 1,159 568 646 67.6 33.1 100.7 37.7 0.33
NIMFtib 2007 Fall 51,600 3 140 386 59 7 594 140 454 270.8 880.7 1151.5 0.76
MOKF 2007 Fall 101,458 1 21 22 21 1 3 20.3 1.0 21.3 2.6 0.05
MOKFn 2007 Fall 550,668 2 29 148 278 22 35 514 278 236 126 50.4 42.9 93.3 22.8 0.46
MokFw 2007 Fall 315
CFHLh 2008 Late 1,072,854 711 6 1 718 717 1 261 66.8 0.1 66.9 24.4 0.00
Recovery Rate per 100,000 released
CV CWTsamp totals Recovery Rate per 100,000 releasedCentral Valley CWTsamp recoveries by location
Central Valley CWTsamp recoveries by location CV CWTsamp totals
26
Table 8. 2010 CWT recovery rate (recoveries per 100,000 CWTs released) by release type, brood year, and recovery location. (page 2 of 2)
Age 4 CV recoveriesRelease Brood Run # CWT Ocean CV Stray
type year type tagged Battle ck Up Sac Nat crks* Fea/Yub Amer Moke Merc Stan CV total Basin Stray CWTs Basin Stray CV total Ocean Proportion
ButSw 2006 Spr 279,936 5 5 5 2 1.9 1.9 0.6 0.00
FRHS 2006 Spr 1,004,683 12 53 65 53 12 6 5.3 1.2 6.4 0.6 0.18
FRHSt 2006 Spr 1,026,561 12 164 23 199 164 35 16.0 3.4 19.4 0.18
YubSw 2006 Spr 179,853 33 33 33 3 18.5 18.5 1.6 0.00
CFHFe 2006 Fall 196,108 1 9 10 1 9 2 0.5 4.7 5.2 0.8 0.90
CFHFh 2006 Fall 3,032,082 82 12 5 98 93 5 8 3.1 0.2 3.2 0.3 0.05
FRHFe 2006 Fall 564,904 29 3 32 29 3 5.1 0.5 5.6 0.09
FRHFn 2006 Fall 1,995,912 1 12 5 308 17 1 343 308 35 45 15.4 1.8 17.2 2.2 0.10
FRHFt 2006 Fall 305,755 2 2 2 5 0.7 0.7 1.5 0.00
FeaFw 2006 Fall 186,478
YubFw 2006 Fall 61,295
NIMFn 2006 Fall 1,527,846 36 8 44 36 8 4 2.4 0.5 2.9 0.3 0.18
MOKF 2006 Fall 925,826
MOKFn 2006 Fall 55,427 1 1 1 2 1.8 1.8 2.9 1.00
MOKFt 2006 Fall 281,582 1 1 2 1 1 2 0.5 0.4 0.8 0.6 0.44
MokFw 2006 Fall 10,968
MERF 2006 Fall 304,121
CFHLe 2007 Late 299,292 7 6 16 4 32 13 20 12 4.2 6.6 10.8 3.8 0.61
CFHLh 2007 Late 723,091 3,770 72 1 3843 3842 1 115 531.3 0.1 531.4 16.0 0.00
Age 5 CV recoveriesRelease Brood Run # CWT Ocean CV Stray
type year type tagged Battle ck Up Sac Nat crks* Fea/Yub Amer Moke Merc Stan CV total Basin Stray CWTsamp Basin Stray Ocean Proportion
FRHS 2005 Spr 762,021 1 1 1 0.1
FRHFt 2005 Fall 1,000,606 1 1 2 1 1 0.1 0.1 0.49
CFHLe 2006 Late 264,277 8 61 24 93 69 24 26.0 9.1 0.26
CFHLh 2006 Late 854,496 858 94 952 952 5 111.4 0.6
* - Natural creeks include Clear Creek, Butte Creek, and Deer Creek.
Recovery Rate per 100,000 released
Recovery Rate per 100,000 releasedCentral Valley CWTsamp recoveries by location
Central Valley CWTsamp recoveries by location CV CWTsamp totals
CV CWTsamp totals
27
Figure 1. 2010 Fall Chinook Natural Area Escapement, Hatchery and Natural Proportions
Clear Creek
Feather River
Upper Sacramento
Yuba River
American River
MokelumneRiver
Stanislaus River
Butte Creek Spring
Tuolumne River
Merced River
Natural
Hatchery
N = 99,416
Range = 22%-96% Natural
Mean = 54% Natural
28
Figure 2. 2010 Fall Chinook Hatchery Escapement, Hatchery and Natural Proportions
Fall
Fall
Fall
Fall
Spring
Fall
Natural
Hatchery
N = 53,420
Range = 5%-21% Natural
Mean = 14% Natural
29
NaturalFRHFe
FRHFn
FRHFt
FeaFw
NIMF
NIMFn
NIMFtn
CFHFh
CFHFn
CFHFeMOKFMOKFn
MOKFt
MokFw
MERF
FRHS
FRHSn
FRHSt
YubSw
ButSw
CFHLh
CFHLe
nonCV
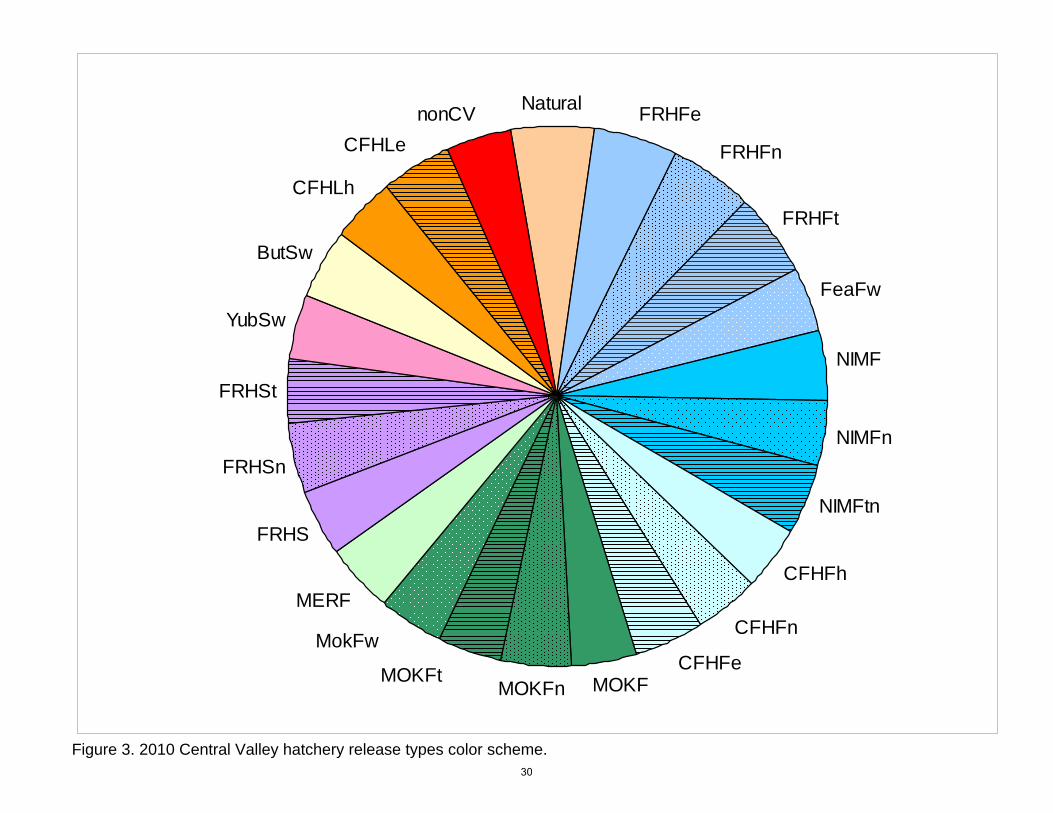
Figure 3. 2010 Central Valley hatchery release types color scheme.
30
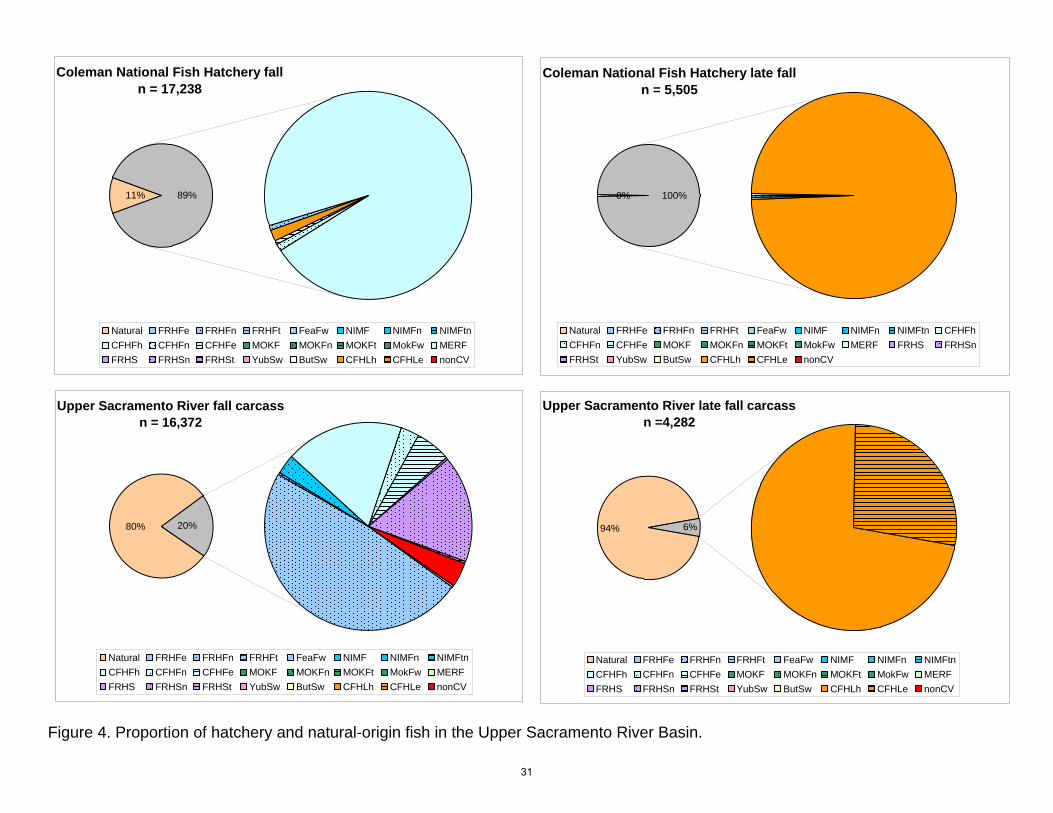
Upper Sacramento River fall carcassn = 16,372
20%80%
Natural FRHFe FRHFn FRHFt FeaFw NIMF NIMFn NIMFtn
CFHFh CFHFn CFHFe MOKF MOKFn MOKFt MokFw MERF
FRHS FRHSn FRHSt YubSw ButSw CFHLh CFHLe nonCV
Upper Sacramento River late fall carcassn =4,282
94% 6%
Natural FRHFe FRHFn FRHFt FeaFw NIMF NIMFn NIMFtn
CFHFh CFHFn CFHFe MOKF MOKFn MOKFt MokFw MERF
FRHS FRHSn FRHSt YubSw ButSw CFHLh CFHLe nonCV
Coleman National Fish Hatchery fall n = 17,238
89%11%
Natural FRHFe FRHFn FRHFt FeaFw NIMF NIMFn NIMFtn
CFHFh CFHFn CFHFe MOKF MOKFn MOKFt MokFw MERF
FRHS FRHSn FRHSt YubSw ButSw CFHLh CFHLe nonCV
Coleman National Fish Hatchery late fall n = 5,505
100%0%
Natural FRHFe FRHFn FRHFt FeaFw NIMF NIMFn NIMFtn CFHFh
CFHFn CFHFe MOKF MOKFn MOKFt MokFw MERF FRHS FRHSn
FRHSt YubSw ButSw CFHLh CFHLe nonCV
Figure 4. Proportion of hatchery and natural-origin fish in the Upper Sacramento River Basin.
31
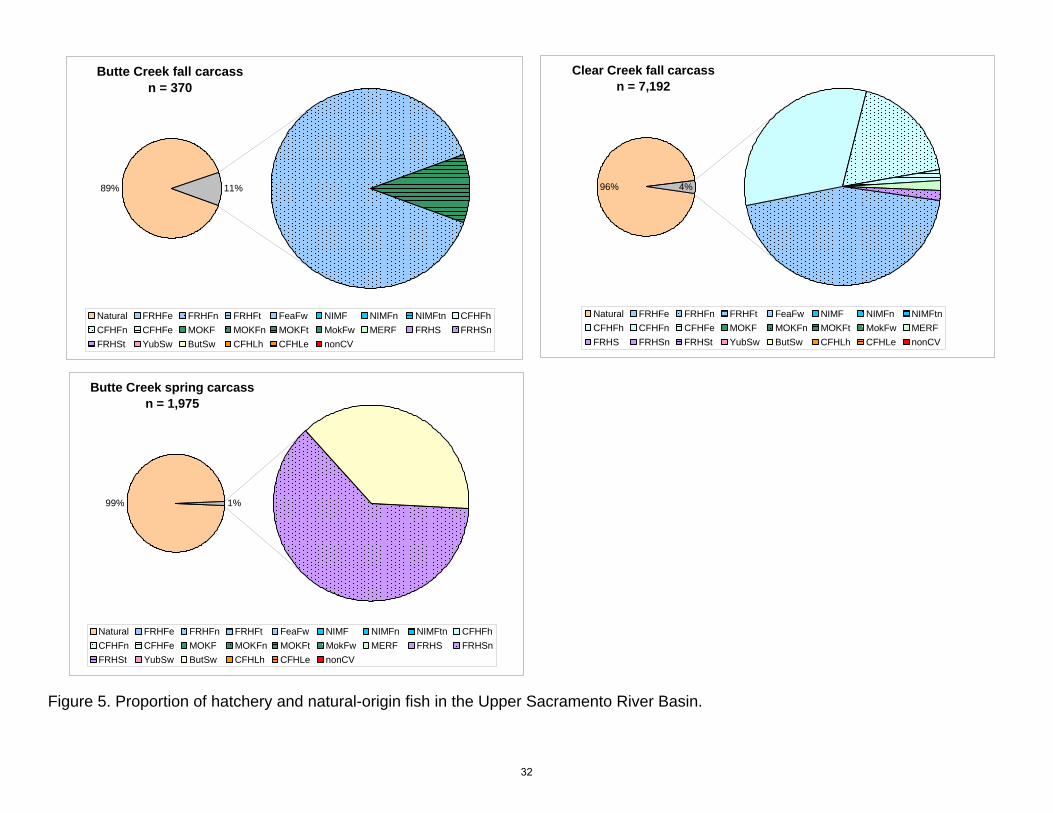
Clear Creek fall carcass n = 7,192
96% 4%
Natural FRHFe FRHFn FRHFt FeaFw NIMF NIMFn NIMFtn
CFHFh CFHFn CFHFe MOKF MOKFn MOKFt MokFw MERF
FRHS FRHSn FRHSt YubSw ButSw CFHLh CFHLe nonCV
Butte Creek spring carcass n = 1,975
99% 1%
Natural FRHFe FRHFn FRHFt FeaFw NIMF NIMFn NIMFtn CFHFh
CFHFn CFHFe MOKF MOKFn MOKFt MokFw MERF FRHS FRHSn
FRHSt YubSw ButSw CFHLh CFHLe nonCV
Butte Creek fall carcass n = 370
89% 11%
Natural FRHFe FRHFn FRHFt FeaFw NIMF NIMFn NIMFtn CFHFh
CFHFn CFHFe MOKF MOKFn MOKFt MokFw MERF FRHS FRHSn
FRHSt YubSw ButSw CFHLh CFHLe nonCV
Figure 5. Proportion of hatchery and natural-origin fish in the Upper Sacramento River Basin.
32
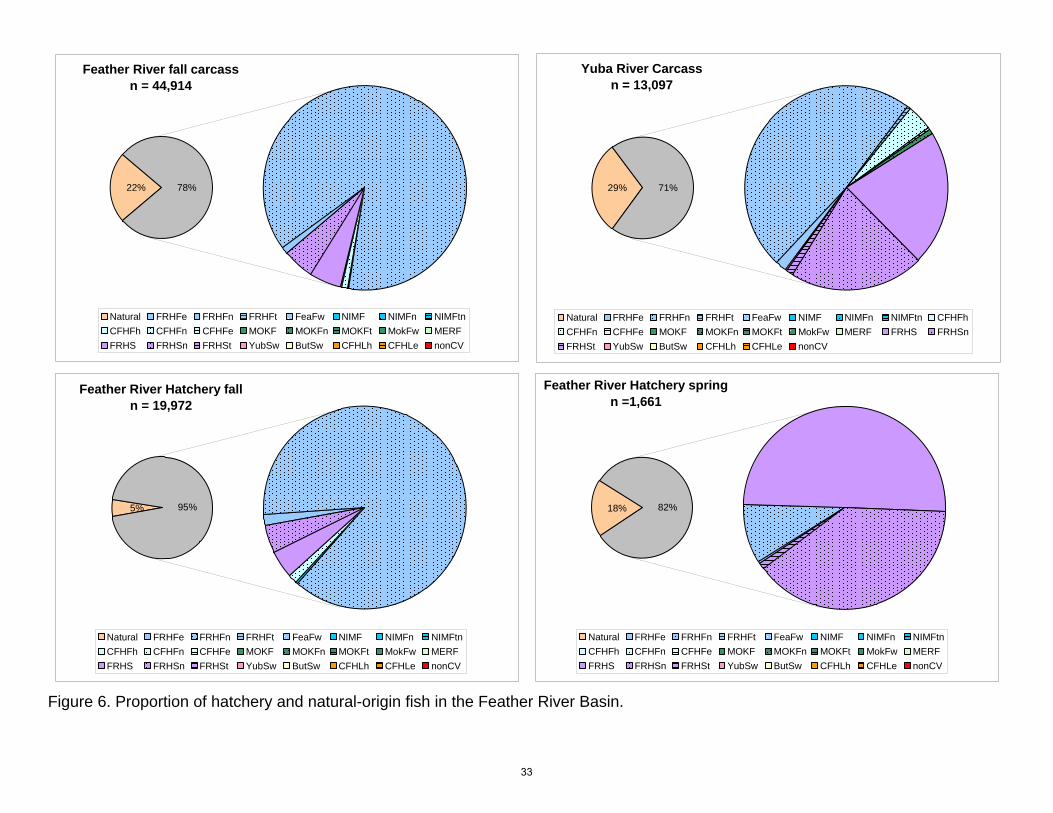
Feather River fall carcassn = 44,914
78%22%
Natural FRHFe FRHFn FRHFt FeaFw NIMF NIMFn NIMFtn
CFHFh CFHFn CFHFe MOKF MOKFn MOKFt MokFw MERF
FRHS FRHSn FRHSt YubSw ButSw CFHLh CFHLe nonCV
Feather River Hatchery springn =1,661
18% 82%
Natural FRHFe FRHFn FRHFt FeaFw NIMF NIMFn NIMFtn
CFHFh CFHFn CFHFe MOKF MOKFn MOKFt MokFw MERF
FRHS FRHSn FRHSt YubSw ButSw CFHLh CFHLe nonCV
Feather River Hatchery fall n = 19,972
95%5%
Natural FRHFe FRHFn FRHFt FeaFw NIMF NIMFn NIMFtn
CFHFh CFHFn CFHFe MOKF MOKFn MOKFt MokFw MERF
FRHS FRHSn FRHSt YubSw ButSw CFHLh CFHLe nonCV
Yuba River Carcass n = 13,097
71%29%
Natural FRHFe FRHFn FRHFt FeaFw NIMF NIMFn NIMFtn CFHFh
CFHFn CFHFe MOKF MOKFn MOKFt MokFw MERF FRHS FRHSn
FRHSt YubSw ButSw CFHLh CFHLe nonCV
Figure 6. Proportion of hatchery and natural-origin fish in the Feather River Basin.
33
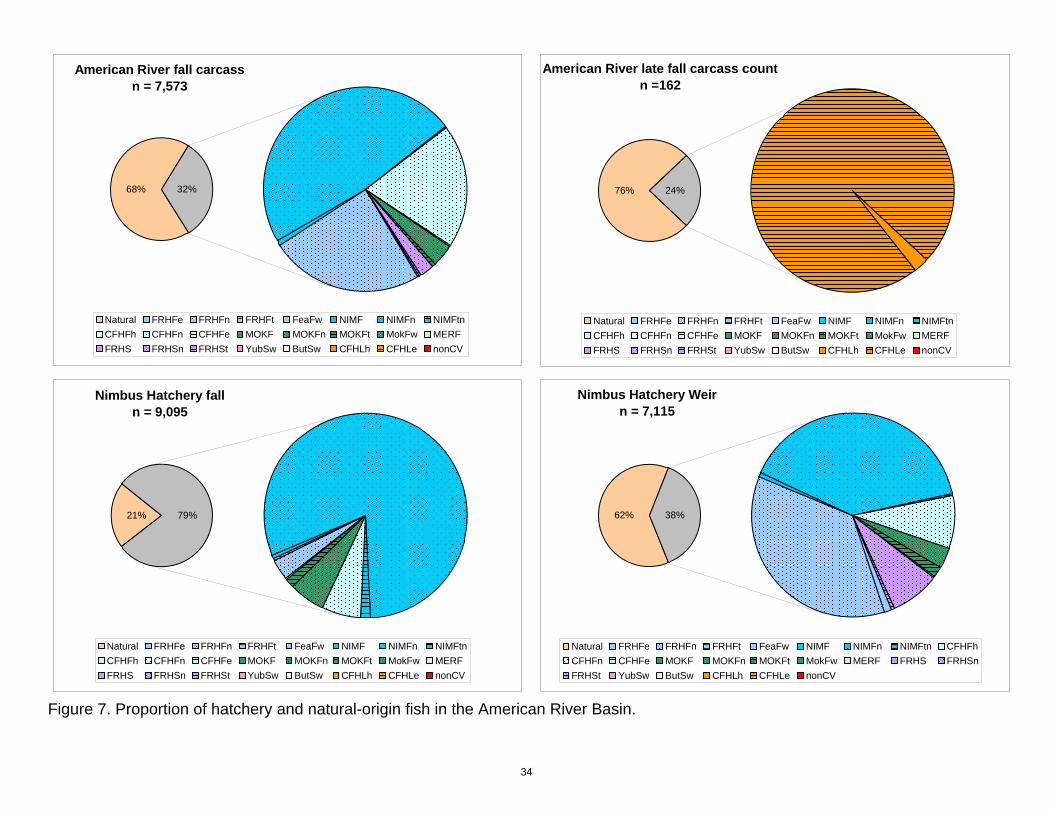
American River fall carcassn = 7,573
68% 32%
Natural FRHFe FRHFn FRHFt FeaFw NIMF NIMFn NIMFtn
CFHFh CFHFn CFHFe MOKF MOKFn MOKFt MokFw MERF
FRHS FRHSn FRHSt YubSw ButSw CFHLh CFHLe nonCV
American River late fall carcass countn =162
76% 24%
Natural FRHFe FRHFn FRHFt FeaFw NIMF NIMFn NIMFtn
CFHFh CFHFn CFHFe MOKF MOKFn MOKFt MokFw MERF
FRHS FRHSn FRHSt YubSw ButSw CFHLh CFHLe nonCV
Nimbus Hatchery fall n = 9,095
21% 79%
Natural FRHFe FRHFn FRHFt FeaFw NIMF NIMFn NIMFtn
CFHFh CFHFn CFHFe MOKF MOKFn MOKFt MokFw MERF
FRHS FRHSn FRHSt YubSw ButSw CFHLh CFHLe nonCV
Nimbus Hatchery Weir n = 7,115
38%62%
Natural FRHFe FRHFn FRHFt FeaFw NIMF NIMFn NIMFtn CFHFh
CFHFn CFHFe MOKF MOKFn MOKFt MokFw MERF FRHS FRHSn
FRHSt YubSw ButSw CFHLh CFHLe nonCV
Figure 7. Proportion of hatchery and natural-origin fish in the American River Basin.
34
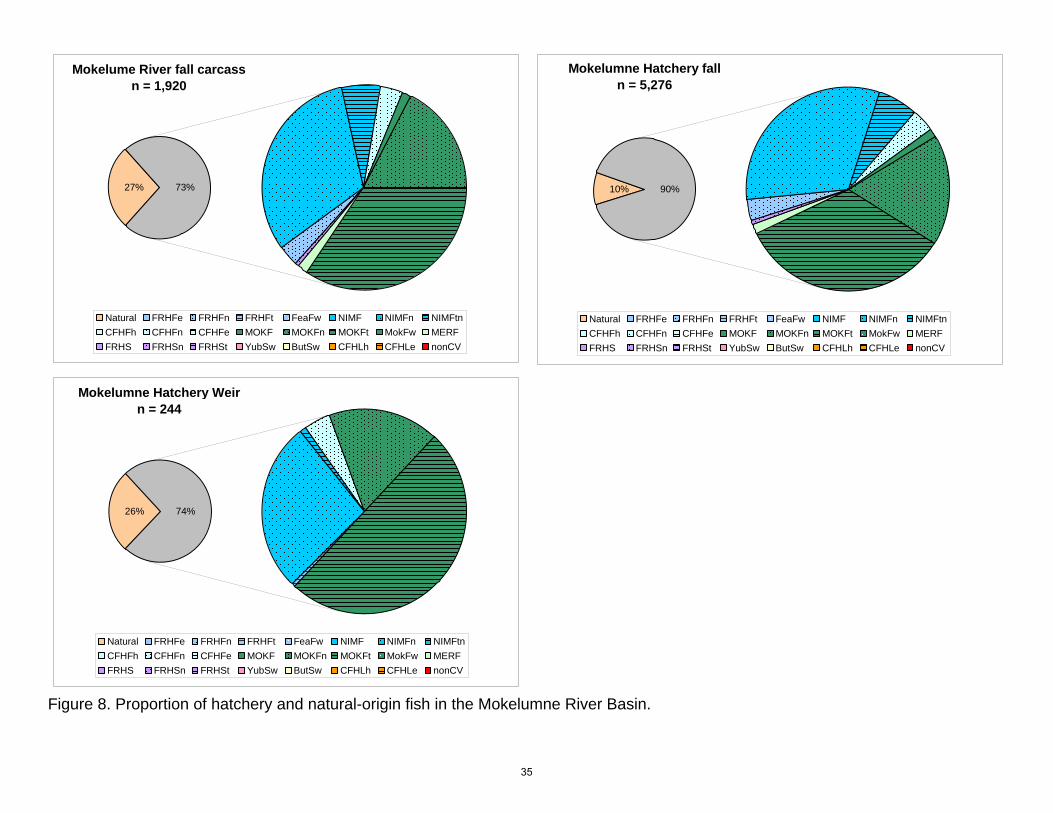
Mokelume River fall carcassn = 1,920
73%27%
Natural FRHFe FRHFn FRHFt FeaFw NIMF NIMFn NIMFtn
CFHFh CFHFn CFHFe MOKF MOKFn MOKFt MokFw MERF
FRHS FRHSn FRHSt YubSw ButSw CFHLh CFHLe nonCV
Mokelumne Hatchery falln = 5,276
10% 90%
Natural FRHFe FRHFn FRHFt FeaFw NIMF NIMFn NIMFtn
CFHFh CFHFn CFHFe MOKF MOKFn MOKFt MokFw MERF
FRHS FRHSn FRHSt YubSw ButSw CFHLh CFHLe nonCV
Mokelumne Hatchery Weir n = 244
26% 74%
Natural FRHFe FRHFn FRHFt FeaFw NIMF NIMFn NIMFtn
CFHFh CFHFn CFHFe MOKF MOKFn MOKFt MokFw MERF
FRHS FRHSn FRHSt YubSw ButSw CFHLh CFHLe nonCV
Figure 8. Proportion of hatchery and natural-origin fish in the Mokelumne River Basin.
35
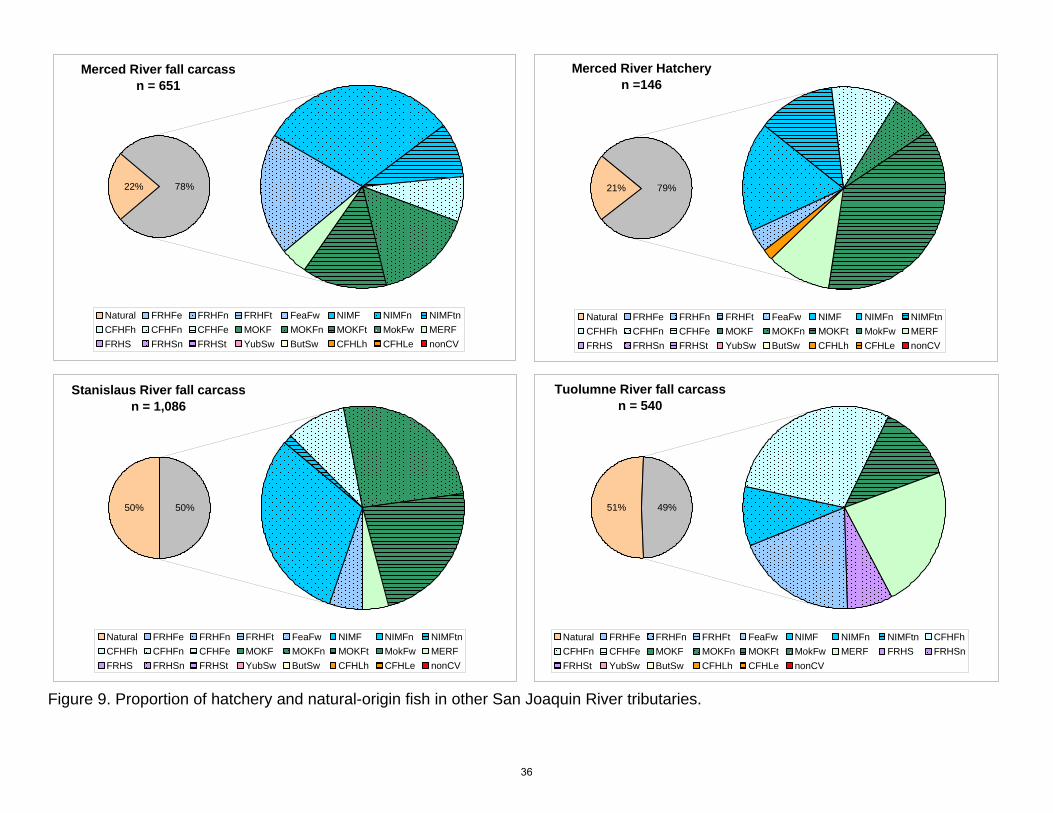
Merced River fall carcassn = 651
78%22%
Natural FRHFe FRHFn FRHFt FeaFw NIMF NIMFn NIMFtn
CFHFh CFHFn CFHFe MOKF MOKFn MOKFt MokFw MERF
FRHS FRHSn FRHSt YubSw ButSw CFHLh CFHLe nonCV
Merced River Hatcheryn =146
21% 79%
Natural FRHFe FRHFn FRHFt FeaFw NIMF NIMFn NIMFtn
CFHFh CFHFn CFHFe MOKF MOKFn MOKFt MokFw MERF
FRHS FRHSn FRHSt YubSw ButSw CFHLh CFHLe nonCV
Stanislaus River fall carcass n = 1,086
50% 50%
Natural FRHFe FRHFn FRHFt FeaFw NIMF NIMFn NIMFtn
CFHFh CFHFn CFHFe MOKF MOKFn MOKFt MokFw MERF
FRHS FRHSn FRHSt YubSw ButSw CFHLh CFHLe nonCV
Tuolumne River fall carcass n = 540
49%51%
Natural FRHFe FRHFn FRHFt FeaFw NIMF NIMFn NIMFtn CFHFh
CFHFn CFHFe MOKF MOKFn MOKFt MokFw MERF FRHS FRHSn
FRHSt YubSw ButSw CFHLh CFHLe nonCV
Figure 9. Proportion of hatchery and natural-origin fish in other San Joaquin River tributaries.
36
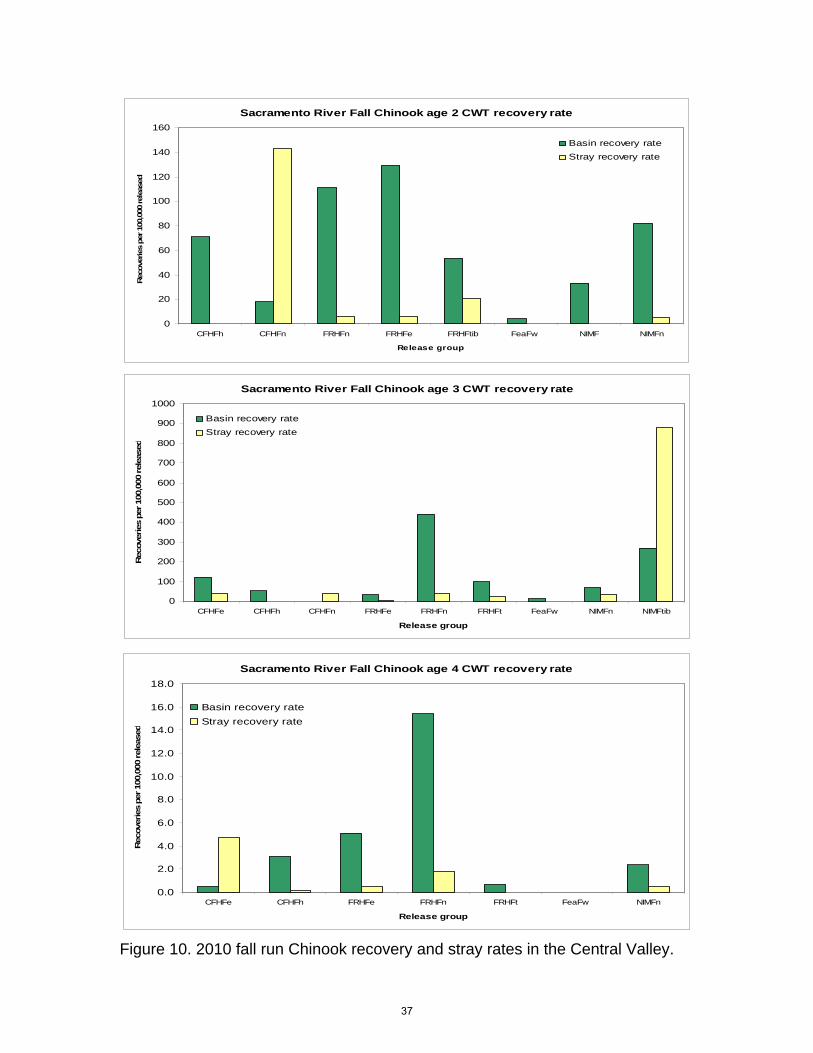
Sacramento River Fall Chinook age 2 CWT recovery rate
0
20
40
60
80
100
120
140
160
CFHFh CFHFn FRHFn FRHFe FRHFtib FeaFw NIMF NIMFn
Release group
Rec
ove
ries
per
100
,000
rel
ease
dBasin recovery rate
Stray recovery rate
Sacramento River Fall Chinook age 3 CWT recovery rate
0
100
200
300
400
500
600
700
800
900
1000
CFHFe CFHFh CFHFn FRHFe FRHFn FRHFt FeaFw NIMFn NIMFtib
Release group
Recoveries p
er 100,0
00 rele
ased
Basin recovery rate
Stray recovery rate
Sacramento River Fall Chinook age 4 CWT recovery rate
0.0
2.0
4.0
6.0
8.0
10.0
12.0
14.0
16.0
18.0
CFHFe CFHFh FRHFe FRHFn FRHFt FeaFw NIMFn
Release group
Recoveries p
er 100,0
00 rele
ased
Basin recovery rate
Stray recovery rate
Figure 10. 2010 fall run Chinook recovery and stray rates in the Central Valley.
37
Other CV Chinook age 2 CWT recovery rate
0
250
500
750
1000
CFHLh FRHS FRHSn MERF MOKFt MokFw
Release group
Rec
ove
ries
per
100
,000
rel
ease
d
Basin recovery rate
Stray recovery rate
Other CV Chinook age 3 CWT recovery rate
0
100
200
300
400
CFHLh FRHS FRHSn MOKF MOKFn MokFw
Release group
Rec
ove
ries
per
100
,000
rel
ease
d
Basin recovery rate
Stray recovery rate
Other CV Chinook age 4 CWT recovery rate
0
100
200
300
400
500
CFHLe CFHLh FRHS FRHSt MERF MOKF MOKFn MOKFt MokFw
Release group
Rec
ove
ries
per
100
,000
rel
ease
d
Basin recovery rate
Stray recovery rate
Figure 11. 2010 recovery and stray rates for other CV Chinook
38
California Ocean Fisheries Chinook age 2 CWT recovery rate
0
5
10
15
20
25
30
35
40
45
CFHLh FRHS FRHSn MERF MOKFt MokFw CFHFh CFHFn FRHFn FRHFe FRHFtib FeaFw NIMF NIMFn
Release group
Rec
ove
ries
per
100
,000
rel
ease
d
Ocean recovery rate
California Ocean Fisheries Chinook age 3 CWT recovery rate
0
10
20
30
40
50
60
70
80
90
CFHLh FRHS FRHSn MOKF MOKFn MokFw CFHFe CFHFh CFHFn FRHFe FRHFn FRHFt FeaFw NIMFn NIMFtib
Release group
Rec
ove
ries
per
100
,000
rel
ease
d
Ocean recovery rate
California Ocean Fisheries Chinook age 4 CWT recovery rate
0
2
4
6
8
10
12
14
16
18
CFHLe CFHLh FRHS FRHSt MERF MOKF MOKFn MOKFt MokFw CFHFe CFHFh FRHFe FRHFn FRHFt FeaFw NIMFn
Release group
Rec
ove
ries
per
100
,000
rel
ease
d
Ocean recovery rate
Figure 12. 2010 CV Chinook recovery rates in the ocean fishery. 39
Monterey Sportn = 6,348
66%34%
Natural FRHFe FRHFn FRHFt FeaFw NIMF NIMFn NIMFtn
CFHFh CFHFn CFHFe MOKF MOKFn MOKFt MokFw MERF
FRHS FRHSn FRHSt YubSw SacW CFHLh CFHLe nonCV
San Francisco Sport n = 5,927
31% 69%
Natural FRHFe FRHFn FRHFt FeaFw NIMF NIMFn NIMFtn
CFHFh CFHFn CFHFe MOKF MOKFn MOKFt MokFw MERF
FRHS FRHSn FRHSt YubSw SacW CFHLh CFHLe nonCV
Fort Bragg Sport n = 1,702
51%49%
Natural FRHFe FRHFn FRHFt FeaFw NIMF NIMFn NIMFtn
CFHFh CFHFn CFHFe MOKF MOKFn MOKFt MokFw MERF
FRHS FRHSn FRHSt YubSw SacW CFHLh CFHLe nonCV
Eureka / Crescent City Sportn = 720
63% 37%
Natural FRHFe FRHFn FRHFt FeaFw NIMF NIMFn NIMFtn
CFHFh CFHFn CFHFe MOKF MOKFn MOKFt MokFw MERF
FRHS FRHSn FRHSt YubSw SacW CFHLh CFHLe nonCV
Figure 13. Proportion of hatchery and natural-origin fish in the 2010 ocean sport fishery. 40
Monterey Commercialn =1,435
78%22%
Natural FRHFe FRHFn FRHFt FeaFw NIMF NIMFn NIMFtn
CFHFh CFHFn CFHFe MOKF MOKFn MOKFt MokFw MERF
FRHS FRHSn FRHSt SacW ButSw CFHLh CFHLe nonCV
San Francisco Commercial n = 1,086
26%74%
Natural FRHFe FRHFn FRHFt FeaFw NIMF NIMFn NIMFtn
CFHFh CFHFn CFHFe MOKF MOKFn MOKFt MokFw MERF
FRHS FRHSn FRHSt SacW ButSw CFHLh CFHLe nonCV
Fort Bragg Commercial n = 12,577
38%62%
Natural FRHFe FRHFn FRHFt FeaFw NIMF NIMFn NIMFtn
CFHFh CFHFn CFHFe MOKF MOKFn MOKFt MokFw MERF
FRHS FRHSn FRHSt SacW ButSw CFHLh CFHLe nonCV
Figure 14. Proportion of hatchery and natural-origin fish in the 2010 ocean commercial fishery. 41


![Mapua-cwts Program Module 1 [Ay11-12]](https://img.pdfslide.us/doc/110x75/544b4473b1af9f744f8b4de9/mapua-cwts-program-module-1-ay11-12.jpg)