Embed Size (px)
Citation preview
A critical tool for measurement of pace and performance in the recovery process. It is a must have for any peer related activity.
Recovery Data Platform 2020 Report
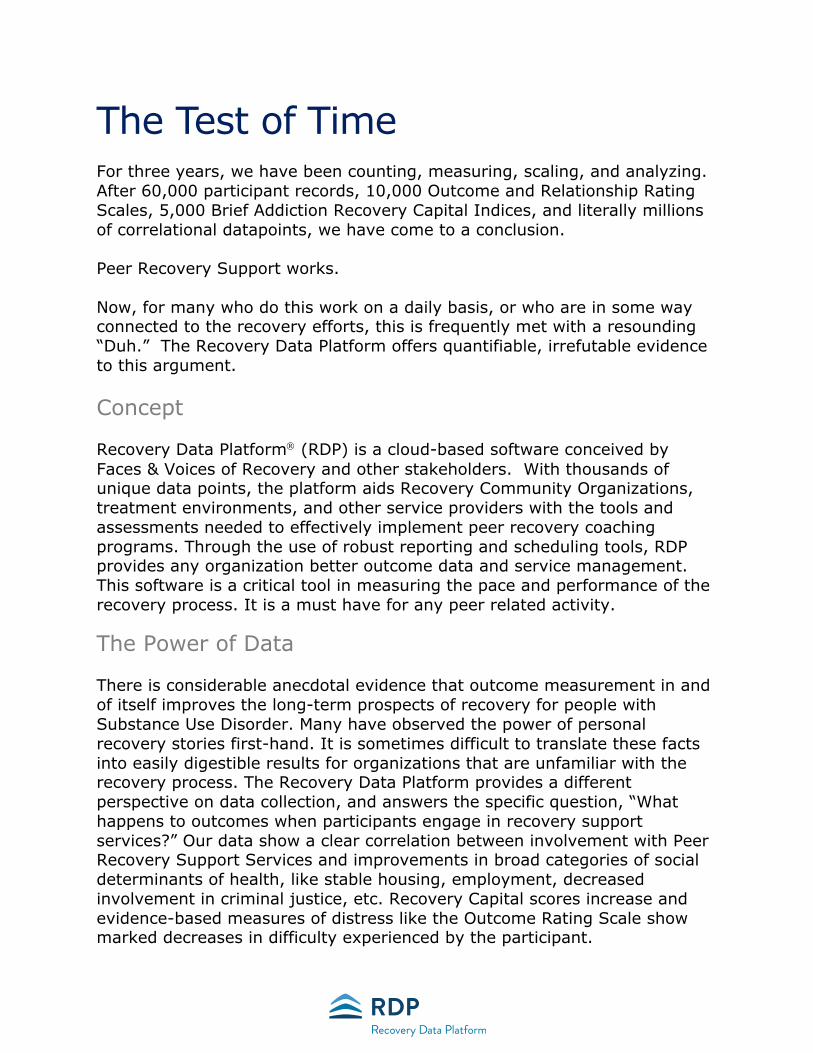
The Test of Time For three years, we have been counting, measuring, scaling, and analyzing. After 60,000 participant records, 10,000 Outcome and Relationship Rating Scales, 5,000 Brief Addiction Recovery Capital Indices, and literally millions of correlational datapoints, we have come to a conclusion. Peer Recovery Support works. Now, for many who do this work on a daily basis, or who are in some way connected to the recovery efforts, this is frequently met with a resounding “Duh.” The Recovery Data Platform offers quantifiable, irrefutable evidence to this argument. Concept Recovery Data PlatformÒ (RDP) is a cloud-based software conceived by Faces & Voices of Recovery and other stakeholders. With thousands of unique data points, the platform aids Recovery Community Organizations, treatment environments, and other service providers with the tools and assessments needed to effectively implement peer recovery coaching programs. Through the use of robust reporting and scheduling tools, RDP provides any organization better outcome data and service management. This software is a critical tool in measuring the pace and performance of the recovery process. It is a must have for any peer related activity.
The Power of Data There is considerable anecdotal evidence that outcome measurement in and of itself improves the long-term prospects of recovery for people with Substance Use Disorder. Many have observed the power of personal recovery stories first-hand. It is sometimes difficult to translate these facts into easily digestible results for organizations that are unfamiliar with the recovery process. The Recovery Data Platform provides a different perspective on data collection, and answers the specific question, “What happens to outcomes when participants engage in recovery support services?” Our data show a clear correlation between involvement with Peer Recovery Support Services and improvements in broad categories of social determinants of health, like stable housing, employment, decreased involvement in criminal justice, etc. Recovery Capital scores increase and evidence-based measures of distress like the Outcome Rating Scale show marked decreases in difficulty experienced by the participant.
Many funding and partnership opportunities hinge on the ability of a group to demonstrate command of the analytics and metrics of recovery. RDP makes this process transparent and simple.
The Toolkit The organizations using RDP are as unique as the individuals they serve. In this way RDP has been designed with the end users in mind and as a toolkit of resources. Not only does the system provide various assessments to track outcomes, it also allows end users to implement their own unique tools for measurement that are specific to their processes, procedures or funder requirements. This makes RDP a flexible and dynamic mechanism to measure the true impact of Peer Support Services.
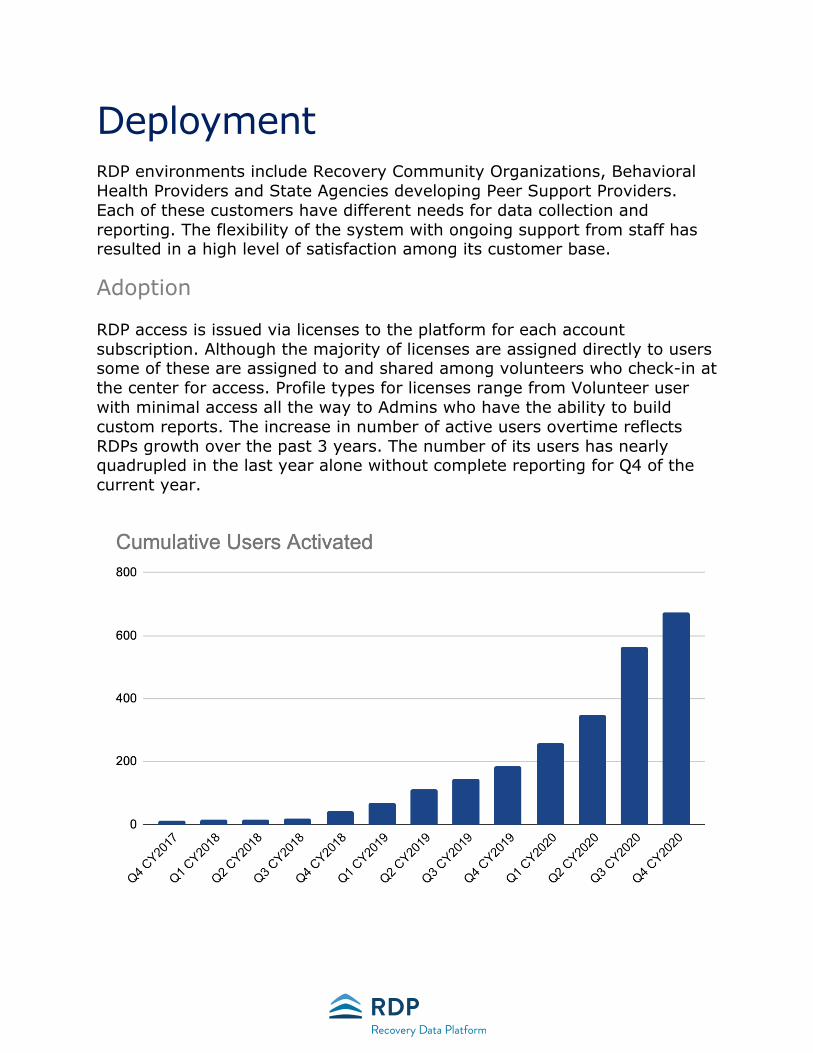
Deployment RDP environments include Recovery Community Organizations, Behavioral Health Providers and State Agencies developing Peer Support Providers. Each of these customers have different needs for data collection and reporting. The flexibility of the system with ongoing support from staff has resulted in a high level of satisfaction among its customer base.
Adoption RDP access is issued via licenses to the platform for each account subscription. Although the majority of licenses are assigned directly to users some of these are assigned to and shared among volunteers who check-in at the center for access. Profile types for licenses range from Volunteer user with minimal access all the way to Admins who have the ability to build custom reports. The increase in number of active users overtime reflects RDPs growth over the past 3 years. The number of its users has nearly quadrupled in the last year alone without complete reporting for Q4 of the current year.
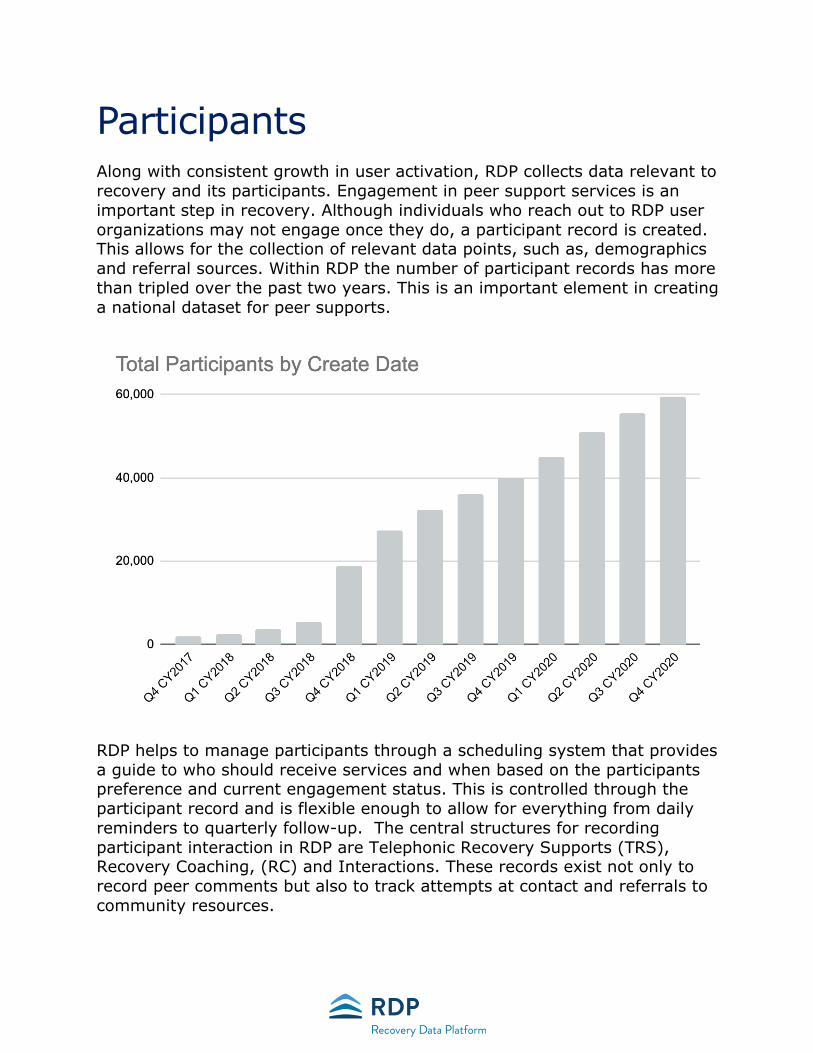
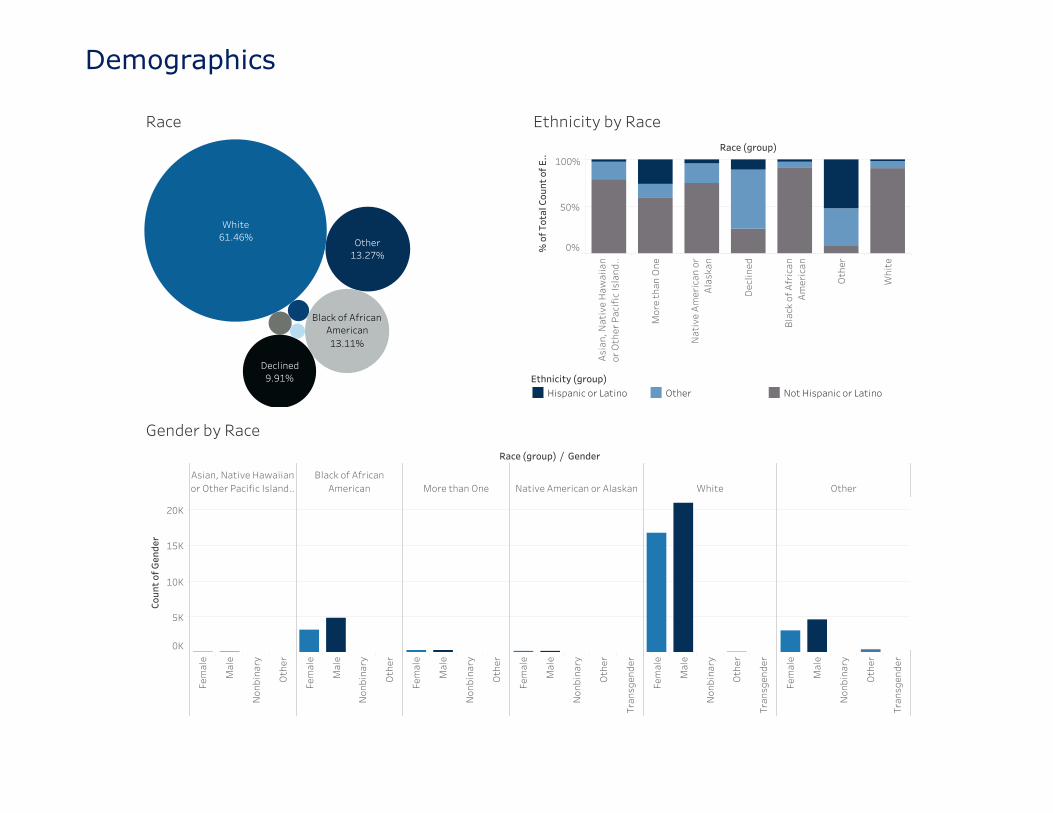
Participants Along with consistent growth in user activation, RDP collects data relevant to recovery and its participants. Engagement in peer support services is an important step in recovery. Although individuals who reach out to RDP user organizations may not engage once they do, a participant record is created. This allows for the collection of relevant data points, such as, demographics and referral sources. Within RDP the number of participant records has more than tripled over the past two years. This is an important element in creating a national dataset for peer supports.
RDP helps to manage participants through a scheduling system that provides a guide to who should receive services and when based on the participants preference and current engagement status. This is controlled through the participant record and is flexible enough to allow for everything from daily reminders to quarterly follow-up. The central structures for recording participant interaction in RDP are Telephonic Recovery Supports (TRS), Recovery Coaching, (RC) and Interactions. These records exist not only to record peer comments but also to track attempts at contact and referrals to community resources.
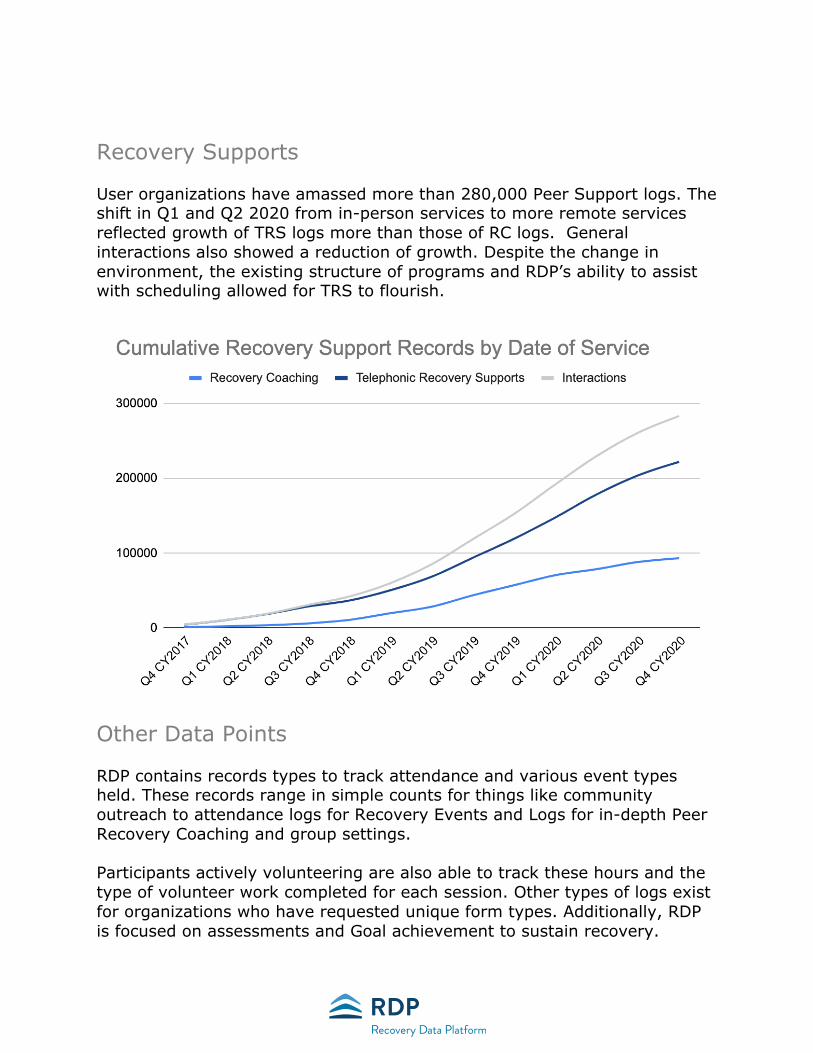
Recovery Supports User organizations have amassed more than 280,000 Peer Support logs. The shift in Q1 and Q2 2020 from in-person services to more remote services reflected growth of TRS logs more than those of RC logs. General interactions also showed a reduction of growth. Despite the change in environment, the existing structure of programs and RDP’s ability to assist with scheduling allowed for TRS to flourish.
Other Data Points RDP contains records types to track attendance and various event types held. These records range in simple counts for things like community outreach to attendance logs for Recovery Events and Logs for in-depth Peer Recovery Coaching and group settings. Participants actively volunteering are also able to track these hours and the type of volunteer work completed for each session. Other types of logs exist for organizations who have requested unique form types. Additionally, RDP is focused on assessments and Goal achievement to sustain recovery.
Other
13.27%
White
61.46%
Declined
9.91%
BlackofAfrican
American
13.11%
Race
Race(group)
Asia
n,N
ativ
eH
aw
aiian
orO
therP
acifi
cIsla
nd..
Moret
hanO
ne
Nativ
eA
meric
ano
r
Ala
skan
Declined
Bla
cko
fA
fric
an
Am
eric
an
Other
Whit
e
0%
50%
100%
%ofTotalCountofE..
EthnicitybyRace
Race(group)/Gender
Asian,NativeHawaiian
orOtherPacificIsland..
BlackofAfrican
American MorethanOne NativeAmericanorAlaskan White Other
Fem
ale
Male
Nonbin
ary
Other
Fem
ale
Male
Nonbin
ary
Other
Fem
ale
Male
Nonbin
ary
Other
Fem
ale
Male
Nonbin
ary
Other
Transgender
Fem
ale
Male
Nonbin
ary
Other
Transgender
Fem
ale
Male
Nonbin
ary
Other
Transgender
0K
5K
10K
15K
20K
CountofGender
GenderbyRace
Ethnicity(group)
HispanicorLatino Other NotHispanicorLatino
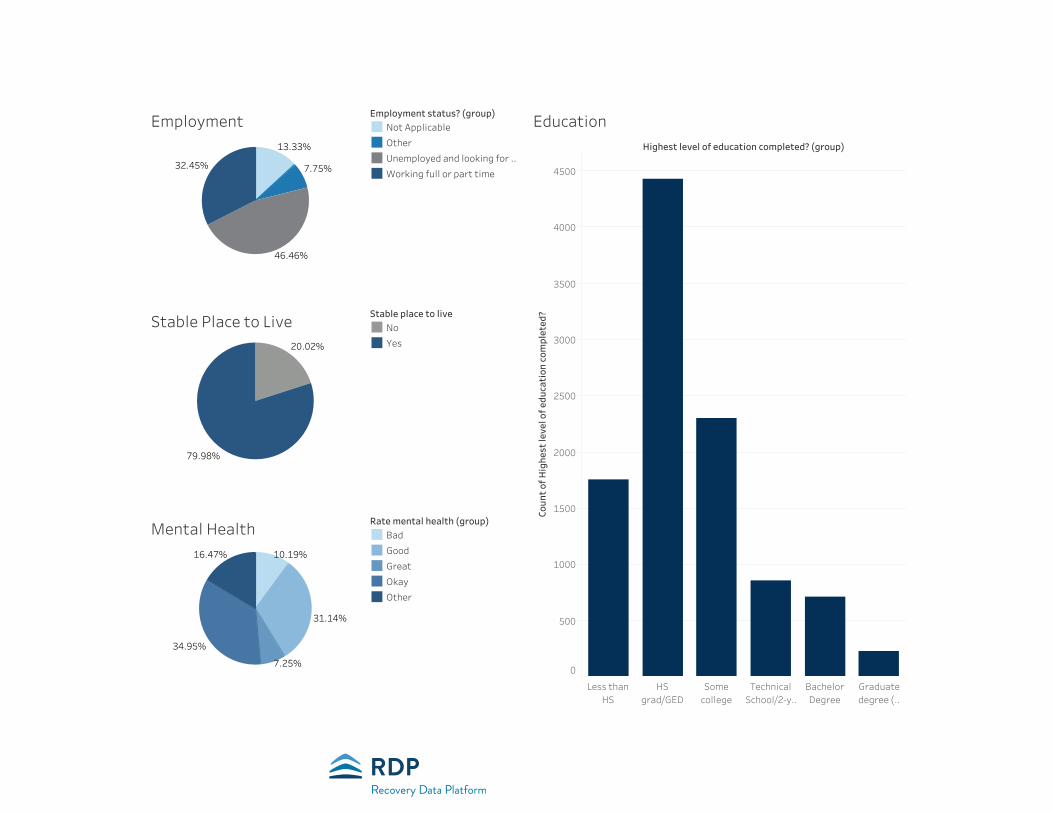
Demographics
32.45%
46.46%
13.33%
7.75%
Employment
Highestlevelofeducationcompleted?(group)
Lessthan
HS
HS
grad/GED
Some
college
Technical
School/2-y..
Bachelor
Degree
Graduate
degree(..
0
500
1000
1500
2000
2500
3000
3500
4000
4500
CountofHighestlevelofeducationcompleted?
EducationEmploymentstatus?(group)
NotApplicable
Other
Unemployedandlookingfor..
Workingfullorparttime
79.98%
20.02%
StablePlacetoLiveStableplacetolive
No
Yes
16.47%
34.95%
31.14%
10.19%
7.25%
MentalHealthRatementalhealth(group)
Bad
Good
Great
Okay
Other
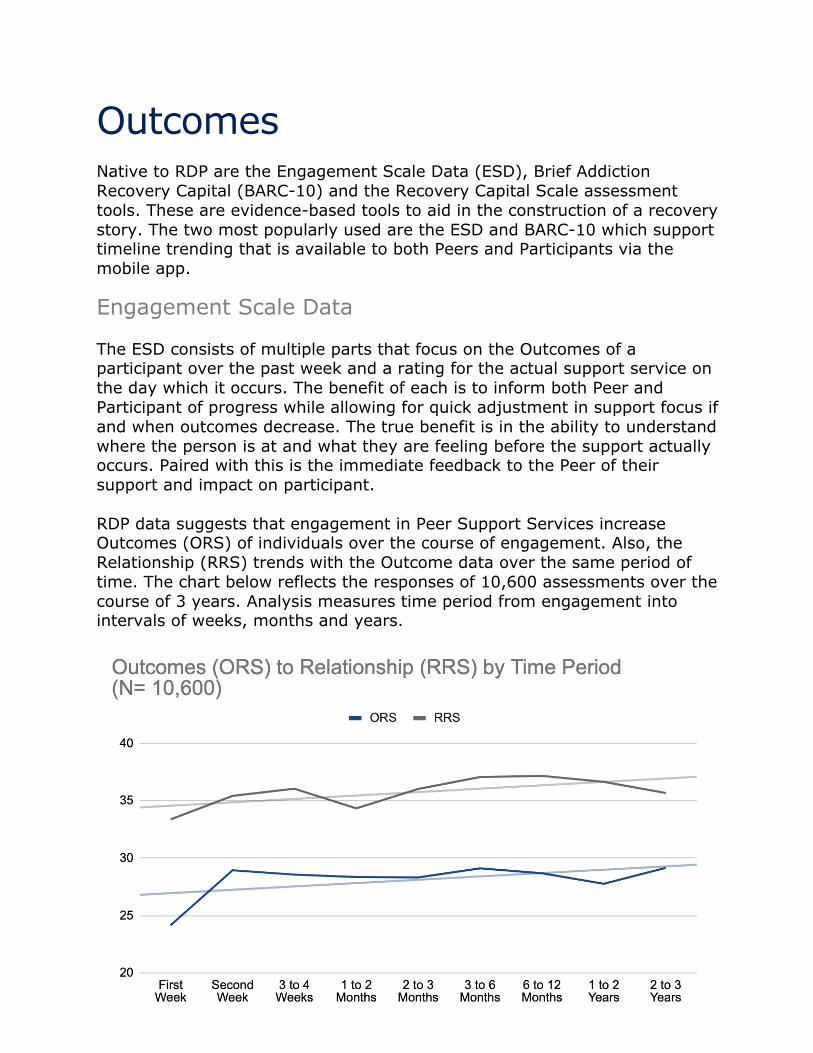
Outcomes Native to RDP are the Engagement Scale Data (ESD), Brief Addiction Recovery Capital (BARC-10) and the Recovery Capital Scale assessment tools. These are evidence-based tools to aid in the construction of a recovery story. The two most popularly used are the ESD and BARC-10 which support timeline trending that is available to both Peers and Participants via the mobile app.
Engagement Scale Data The ESD consists of multiple parts that focus on the Outcomes of a participant over the past week and a rating for the actual support service on the day which it occurs. The benefit of each is to inform both Peer and Participant of progress while allowing for quick adjustment in support focus if and when outcomes decrease. The true benefit is in the ability to understand where the person is at and what they are feeling before the support actually occurs. Paired with this is the immediate feedback to the Peer of their support and impact on participant. RDP data suggests that engagement in Peer Support Services increase Outcomes (ORS) of individuals over the course of engagement. Also, the Relationship (RRS) trends with the Outcome data over the same period of time. The chart below reflects the responses of 10,600 assessments over the course of 3 years. Analysis measures time period from engagement into intervals of weeks, months and years.
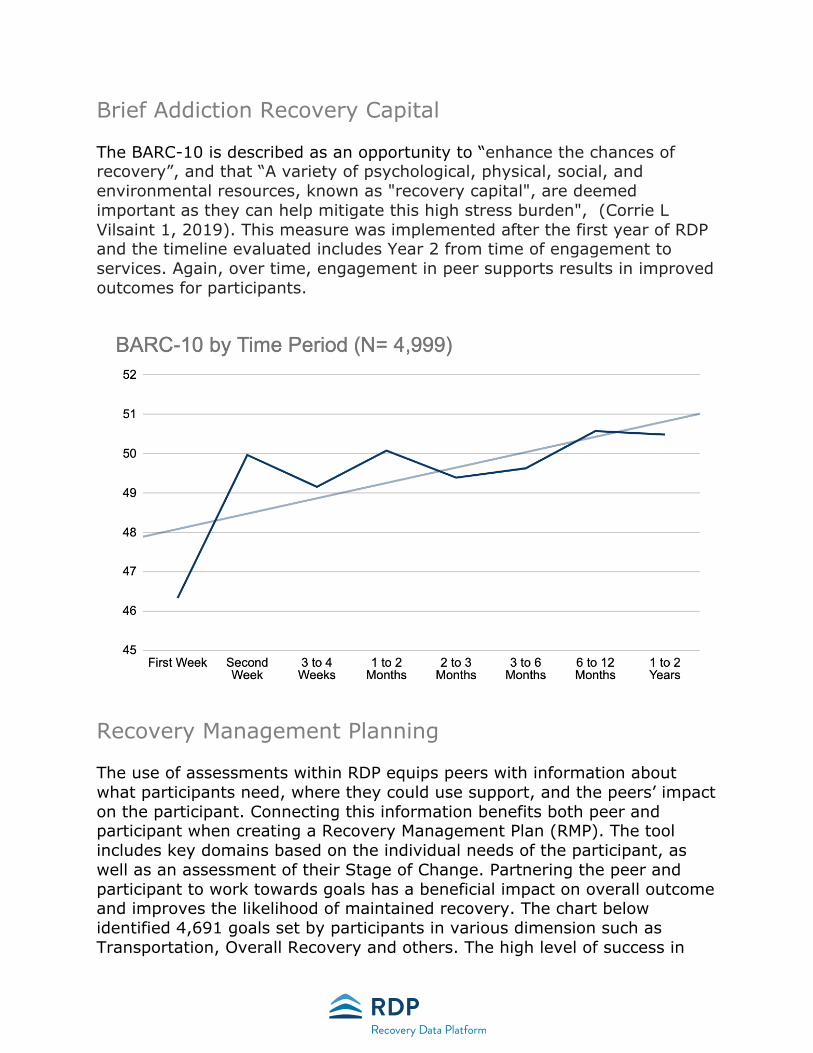
Brief Addiction Recovery Capital The BARC-10 is described as an opportunity to “enhance the chances of recovery”, and that “A variety of psychological, physical, social, and environmental resources, known as "recovery capital", are deemed important as they can help mitigate this high stress burden", (Corrie L Vilsaint 1, 2019). This measure was implemented after the first year of RDP and the timeline evaluated includes Year 2 from time of engagement to services. Again, over time, engagement in peer supports results in improved outcomes for participants.
Recovery Management Planning The use of assessments within RDP equips peers with information about what participants need, where they could use support, and the peers’ impact on the participant. Connecting this information benefits both peer and participant when creating a Recovery Management Plan (RMP). The tool includes key domains based on the individual needs of the participant, as well as an assessment of their Stage of Change. Partnering the peer and participant to work towards goals has a beneficial impact on overall outcome and improves the likelihood of maintained recovery. The chart below identified 4,691 goals set by participants in various dimension such as Transportation, Overall Recovery and others. The high level of success in
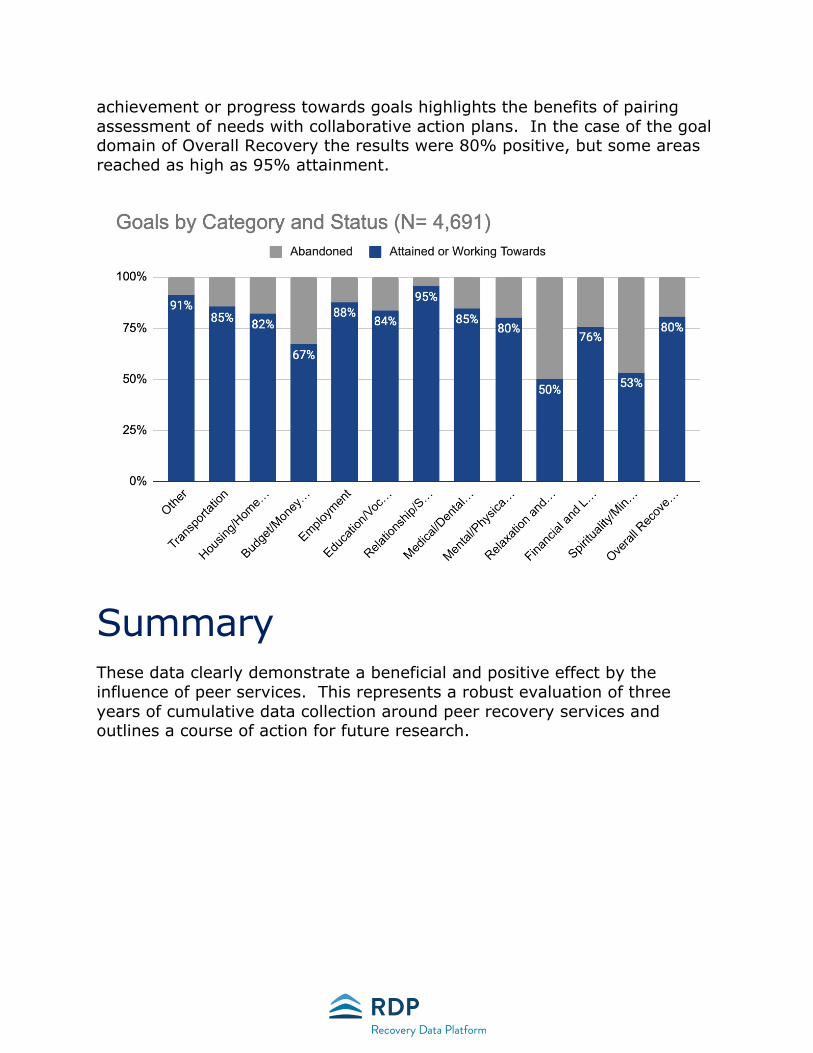
achievement or progress towards goals highlights the benefits of pairing assessment of needs with collaborative action plans. In the case of the goal domain of Overall Recovery the results were 80% positive, but some areas reached as high as 95% attainment.
Summary These data clearly demonstrate a beneficial and positive effect by the influence of peer services. This represents a robust evaluation of three years of cumulative data collection around peer recovery services and outlines a course of action for future research.
Citations Vilsaint, C. L., Kelly, J. F., Bergman, B. G., Groshkova, T., Best, D., & White, W. (2017). Development and validation of a Brief Assessment of Recovery Capital (BARC-10) for alcohol and drug use disorder. Drug and alcohol dependence, 177, 71–76. https://doi.org/10.1016/j.drugalcdep.2017.03.022


![Cloud Platform Storage Management and Data Recovery Research 2019... · recovery of the data, ensuring the safety and the reliability of the cloud storage data [7]. The recovery of](https://img.pdfslide.us/doc/110x75/5fa05885e885ad067b1bd090/cloud-platform-storage-management-and-data-recovery-research-2019-recovery.jpg)