Embed Size (px)
DESCRIPTION
PUNT RETURNS ............................................................................................................ 183 TOTAL OFFENSE ........................................................................................................... 174 RECEIVING .............................................................................................................. 180-181
Citation preview
RECORD BOOKTOTAL OFFENSE ........................................................................................................... 174
RUSHING .................................................................................................................175-176
PASSING ................................................................................................................ 1177-179
RECEIVING ..............................................................................................................180-181
ALL-PURPOSE YARDS .................................................................................................. 182
PUNT RETURNS ............................................................................................................ 183
KICKOFF RETURNS ....................................................................................................... 184
PUNTING ........................................................................................................................ 185
SCORING .................................................................................................................186-188
DEFENSE .................................................................................................................189-191
TEAM OFFENSE/TEAM DEFENSE .........................................................................192-193

2009 northwestern footbal l • NUsports.com174 2009 northwestern footbal l • NUsports.com 2009 northwestern footbal l • NUsports.com
Rush-Pass PlaysGame: 76, Sandy Schwab vs. Michigan, 1982Season: 610, Brett Basanez, 2005Career: 1,975, Brett Basanez, 2002-05
Total Net YardsGame: 548, Brett Basanez vs. TCU, 2004Season: 4,045, Brett Basanez, 2005Career: 11,576, Brett Basanez, 2002-05
Most Offensive Yards Gained by a FreshmanGame: 431, Sandy Schwab vs. Michigan, 1982Season: 2,555, Sandy Schwab, 1982
Most Offensive Yards Gained In First Game of Career298, Tom Myers vs. South Carolina, 1962
SINGle-SeaSON BeSTSTotal Offensive Yards Player Year Plays Yards avg. 1. Brett Basanez 2005 610 4,045 6.6 2. C.J. Bachér 2007 607 3,687 6.1 3. Zak Kustok 2001 579 3,272 5.7 4. Brett Basanez 2004 543 3,096 5.7 5. Zak Kustok 2000 529 2,894 5.5 6. C.J. Bachér 2008 492 2,662 5.4 7. Steve Schnur 1996 437 2,600 5.9 8. Sandy Schwab 1982 504 2,555 5.1 9. Brett Basanez 2002 392 2,300 5.910. Tim O’Brien 1989 424 2,262 5.3
SINGle-GaMe BeSTSTotal Offensive Yards 1. 548 Brett Basanez vs. TCU, 2004 2. 532 Zak Kustok vs. Bowling Green, 2001 3. 525 C.J. Bachér vs. Michigan State, 2007 4. 506 Brett Basanez vs. Purdue, 2005 5. 491 C.J. Bachér vs. Minnesota, 2007 6. 448 Brett Basanez vs. UCLA, 2005 7. 446 Mike Greenfield vs. Northern Illinois, 1985 8. 431 Sandy Schwab vs. Michigan, 1982 9. 430 Brett Basanez vs. Wisconsin, 200510. 413 Zak Kustok vs. Penn State, 2001
Player Years Plays Yards avg. Y/G 1. Brett Basanez 2002-05 1,975 11,576 5.9 246.3 2. Len Williams 1990-93 1,614 8,029 5.0 186.7 3. C.J. Bachér 2005-08 1,313 7,571 5.8 222.7 4. Zak Kustok 1999-01 1,353 7,116 5.3 237.2 5. Mike Greenfield 1984-87 1,415 6,707 4.7 172.0 6. Steve Schnur 1993-96 949 5,542 5.8 142.1 7. Sandy Schwab 1982-85 1,189 5,401 4.5 168.8 8. Damien Anderson 1998-01 953 4,485 4.7 104.3 9. Maurie Daigneau 1969-71 806 3,930 4.9 126.810. Mike Kerrigan 1979-81 918 3,856 4.2 120.511. Darnell Autry 1994-96 787 3,793 4.8 111.612. Tom Myers 1962-64 636 3,496 5.5 129.513. Mitch Anderson 1972-74 775 3,366 4.3 102.014. Tyrell Sutton 2005-08 547 2,996 5.5 96.615. Otto Graham 1941-43 573 2,938 5.1 117.5
CaReeR TOTal OFFeNSe leadeRSYeAr-BY-YeAr LOOK AT NU’S TOP 10
1. Brett Basanez..............................11,576Year rush Pass Total2002 96 2,204 2,3002003 219 1,916 2,1352004 258 2,838 3,0962005 423 3,622 4,045Totals 996 10,580 11,576
2. len Williams.................................8,029Year rush Pass Total1990 140 1,700 1,8401991 207 1,630 1,8371992 119 2,110 2,2291993 76 2,047 2,123Totals 542 7,487 8,029
3. C.J. Bachér .................................4,909Year rush Pass Total2005 25 59 842006 -34 1,172 1,1382007 31 3,656 3,6872008 230 2,432 2,662Totals 252 7,319 7,571
4. Zak Kustok....................................7,116Year rush Pass Total1999 209 741 9502000 505 2,389 2,8942001 580 2,692 3,272Totals 1,294 5,822 7,116
5. Mike Greenfield............................6,707Year rush Pass Total1984 -9 733 7241985 70 2,152 2,2221986 418 1,653 2,0711987 425 1,265 1,690Totals 904 5,803 6,707
6. Steve Schnur...............................5,542Year rush Pass Total1993 -27 289 2621994 -37 899 8621995 26 1,792 1,8181996 -32 2,632 2,600Totals -70 5,612 5,542
7. Sandy Schwab............................5,401Year rush Pass Total1982 -180 2,735 2,5551983 -75 1,838 1,7631984 -16 845 8291985 -7 261 254Totals -278 5,679 5,401
8. damien anderson.......................4,485Year rush Pass Total1998 537 0 5371999 1,128 0 1,1282000 2,063 0 2,0632001 757 0 757Totals 4,485 0 4,485
9. Maurie daigneau.........................3,930Year rush Pass Total1969 -225 1,276 1,0511970 -27 1,228 1,2011971 -55 1,733 1,678Totals -307 4,237 3,930
10. Mike Kerrigan............................3,856Year rush Pass Total1979 -66 961 8951980 -27 1,816 1,7891981 -145 1,317 1,172Totals -238 4,094 3,856
YeaR-BY-YeaR TOTal OFFeNSe leadeRS
Year Player Yards1937 Don Heap 6571938 Ollie Hahnenstein 5171939 Bill DeCorrevont 4981940 Bill DeCorrevont 4491941 Otto Graham 8561942 Otto Graham 1,3261943 Otto Graham 7561944 John Yungwirth 6131945 James Farrar 7131946 Art Murakowski 4161947 Don Burson 4041948 Art Murakowski 6221949 Don Burson 7751950 Dick Flowers 1,0251951 Bob Burson 7861952 Dick Thomas 1,2081953 Dick Thomas 9311954 Dale Pienta 4111955 Dale Pienta 3661956 Bob McKeiver 5921957 ron Burton 3891958 Dick Thornton 1,0781959 John Talley 8051960 Dick Thornton 9971961 Tom O’Grady 5711962 Tom Myers 1,4351963 Tom Myers 1,2921964 Tom Myers 7691965 Bob McKelvey 5781966 Bill Melzer 1,1701967 Bill Melzer 1,2051968 Dave Shelbourne 1,5141969 Maurie Daigneau 1,0511970 Mike Adamle 1,3251971 Maurie Daigneau 1,6781972 Mitch Anderson 1,174
Year Player Yards1972 Mitch Anderson 1,1741973 Mitch Anderson 1,0831974 Mitch Anderson 1,1091975 randy Dean 1,2991976 randy Dean 1,5611977 Scott Stranski 6401978 Kevin Strasser 1,3061979 Mike Kerrigan 8951980 Mike Kerrigan 1,7891981 Mike Kerrigan 1,1721982 Sandy Schwab 2,5551983 Sandy Schwab 1,7631984 Sandy Schwab 8291985 Mike Greenfield 2,2221986 Mike Greenfield 2,0711987 Mike Greenfield 1,6901988 Greg Bradshaw 1,6871989 Tim O’Brien 2,2621990 Len Williams 1,8401991 Len Williams 1,8371992 Len Williams 2,2291993 Len Williams 2,1231994 Steve Schnur 8991995 Steve Schnur 1,8181996 Steve Schnur 2,6001997 Tim Hughes 1,7881998 Gavin Hoffman 2,0441999 Damien Anderson 1,3122000 Zak Kustok 2,8942001 Zak Kustok 3,2722002 Brett Basanez 2,3002003 Brett Basanez 2,1352004 Brett Basanez 3,0962005 Brett Basanez 4,0452006 C.J. Bachér 1,1382007 C.J. Bachér 3,6872008 C.J. Bachér 2,2662
CaReeR YaRdS
T OTA L O F F E N S E

2009 northwestern footbal l • NUsports.com2009 northwestern footbal l • NUsports.com 2009 northwestern footbal l • NUsports.com 175
Rushing attemptsGame: 48, Mike Adamle vs. Minnesota, 1970Season: 387, Darnell Autry, 1995Career: 953, Damien Anderson, 1998-01Attempts Per GameSeason: 32.3, Darnell Autry, 1995Career: 23.1, Darnell Autry, 1994-96
Net Rushing YardsGame: 316, Mike Adamle vs. Wisconsin, 1969Season: 2,063, Damien Anderson, 2000Career: 4,485, Damien Anderson, 1998-01In First Game of Career: 192, Bill Swingle vs. Boston College, 1961By a FreshmanGame: 244, Tyrell Sutton vs. Wisconsin, 2005Season: 1,474, Tyrell Sutton, 2005By a QuarterbackGame: 217, Mike Kafka vs. Minnesota, 2008Season: 580, Zak Kustok, 2001Career: 1,294, Zak Kustok, 1999-01
Rushing Yards Per GameSeason: 171.9, Damien Anderson, 2000Career: 111.6, Darnell Autry, 1994-96
Rushing Yards Per attemptGame: (minimum 25 rushes) 8.8, Damien Anderson vs. MSU, 2000Season: (minimum 225 rushes) 6.6, Damien Anderson, 2000Career: (minimum 450 rushes) 5.5, Noah Herron, 2001-2004
Most Rushing Yards Gained in Consecutive GamesTwo Games: 511, Damien Anderson vs. Michigan State and Indiana, 2000Three Games: 685, Damien Anderson vs. Wisconsin, Michigan State and Indiana, 2000Four Games: 809, Damien Anderson vs. Minnesota, Michigan, Iowa, Illinois, 2000Five Games: 1,064, Damien Anderson vs. MSU, Indiana, Purdue, Minnesota, Michigan, 2000
Rushing TouchdownsGame: 4, Mike Adamle vs. Minnesota, 1970; Darnell Autry vs. Iowa, 1996; Damien Anderson (three times, vs. Indiana, 2000; vs. Illinois, 2000; vs. Duke, 2001), Jason Wright (four times, vs. Indiana, 2002; vs. Kansas, 2003; vs. Indiana, 2003; vs. Illinois, 2003), Tyrell Sutton vs. Northern Illinois, 2005Season: 23, Damien Anderson, 2000Career: 38, Damien Anderson, 1998-01By a FreshmanGame: 4, Tyrell Sutton vs. Northern Illinois, 2005Season: 16, Tyrell Sutton vs. Northern Illinois, 2005By a QuarterbackSeason: 11, Zak Kustok, 2001Career: 22, Zak Kustok, 1999-01
CaReeR RuShING Td leadeRSYeAr-BY-YeAr LOOK AT NU’S TOP 10
1. damien anderson, 38Year TDs1998...................................... 41999...................................... 32000.................................... 232001.................................... ..8Total.................................... 38
2. darnell autry, 35Year TDs1994.................................. .....11995.................................. ...171996..................................... 17Total.................................... .35
3. Jason Wright, 32Year TDs2000.......................................02001.......................................02002.....................................122003.....................................20Total.....................................32
4. Tyrell Sutton, 31Year TDs2005......................................162006........................................52007........................................42008 .......................................6Total......................................31
5. Noah herron, 26Year TDs2001........................................02002........................................72003........................................52004...................................... 14Total......................................26
6. Zak Kustok, 22Year TDs1999............................................ 22000............................................ 92001.......................................... 11Total.......................................... 22
7. Ron Burton, 21Year TDs1957............................................ 31958.......................................... 121959............................................ 6Total.......................................... 21
8. Bob Christian, 20Year TDs1987........................................... .01988........................................... .41989.......................................... 101990............................................ 6Total.......................................... 20
9. Brett Basanez, 18Year TDs2002............................................ 42003............................................ 22004............................................ 52005............................................ 7Total.......................................... 18
9. Greg Boykin, 18Year TDs1972............................................ 61973............................................ 31975............................................ 91976............................................ 0Total.......................................... 18
SINGle-SeaSON BeSTSNet Yards Rushing Player Year att. Yards avg. 1. Damien Anderson 2000 311 2,063 6.6 2. Darnell Autry 1995 387 1,785 4.6 3. Tyrell Sutton 2005 250 1,474 5.9 4. Darnell Autry 1996 280 1,452 5.2 5. Jason Wright 2003 267 1,388 5.2 6. Noah Herron 2004 274 1,381 5.0 7. Bob Christian 1989 277 1,291 4.7 8. Mike Adamle 1970 304 1,255 4.1 9. Jason Wright 2002 219 1,234 5.610. Damien Anderson 1999 306 1,128 3.7
Rushing Touchdowns Player Year Td 1. Damien Anderson 2000 23 2. Jason Wright 2003 20 3. Darnell Autry 1995 17 Darnell Autry 1996 17 5. Tyrell Sutton 2005 16 6. Noah Herron 2004 14 7. Jason Wright 2002 12 ron Burton 1958 12 9. Zak Kustok 2001 1110. Mike Adamle 1970 10 Bob Christian 1989 10
SINGle-GaMe RuShING BeSTS
1. 316, Mike Adamle vs. Wisconsin, 1969 2. 295, Byron Sanders vs. Minnesota, 1987 3. 292, Damien Anderson vs. Indiana, 2000 4. 268, Damien Anderson vs. Michigan, 2000 5. 251, Jason Wright vs. Illinois, 2003 6. 244, Tyrell Sutton vs. Wisconsin, 2005 7. 240, Darnell Autry vs. Iowa, 1996 8. 237, Jason Wright vs. Bowling Green, 2003 9. 230, Damien Anderson vs. Minnesota, 200010. 226, Darnell Autry vs. Purdue, 2005
lONGeST RuShING PlaYS
1. 95, Bill Swingle vs. Boston College, 1961 2. 91, Tiny Lewis vs. South Dakota, 1927 3. 90, Alton Johnson vs. Chicago, 1898 4. 89, Stanley Davenport vs. Iowa, 1986 5. 85, Pay Purdin vs. Michigan, 1959 85, Albert Potter vs. Illinois, 1896 7. 81, Vic Schwall vs. Ohio State, 1946 8. 80, ricky edwards vs. Northern Illinois, 1982 80, Ollie Hahnenstein vs. Michigan, 194010. 79, ron Burton vs. Oregon, 1957
R U S H I N G

2009 northwestern footbal l • NUsports.com176 2009 northwestern footbal l • NUsports.com 2009 northwestern footbal l • NUsports.com
daRNell auTRY holds five NU rushing records.
daMIeN aNdeRSON set 10 NU rushing records during the 2000 season.
Year Player Rushes Yds. avg.1937 Don Heap NA 564 NA1938 Ollie Hahnenstein 65 405 6.21939 Don Clawson 81 341 4.21940 Don Clawson NA 418 NA1941 Bill DeCorrevont 76 344 4.51942 ed Hirsch 119 438 4.71943 Otto Graham NA 335 NA1944 Henry Altepeter NA 301 NA1945 Dick Conners 116 671 5.81946 Art Murakowski NA 416 NA1947 Art Murakowski NA 367 NA1948 Art Murakowski 119 622 5.11949 Gasper Perricone 98 556 5.61950 rich Athan 170 688 4.11951 Chuck Hren 133 539 4.11952 Bob Lauter NA 488 NA1953 Jim Troglio 50 312 6.21954 Bob Lauter NA 371 NA1955 Jim Troglio 66 287 4.31956 Bob McKeiver 115 592 5.21957 ron Burton 74 389 5.21958 ron Burton 141 613 4.31959 Mike Stock 109 400 3.71960 Mike Stock 133 536 4.01961 Bill Swingle 79 483 6.11962 Willie Stinson NA 418 NA1963 Willie Stinson 115 368 4.01964 Steve Murphy 109 377 3.51965 Bob McKelvey 175 587 3.41966 Bob McKelvey 128 459 3.61967 Bob Olson 143 507 3.51968 Bob Olson 90 342 3.81969 Mike Adamle 140 666 4.81970 Mike Adamle 304 1,255 4.11971 Al robinson 277 881 3.21972 Greg Boykin 159 625 3.9
Year Player Rushes Yds. avg.1973 Stan Key 197 894 4.51974 Jim Pooler 216 949 4.41975 Greg Boykin 239 1,105 4.61976 Pat Geegan 154 537 3.51977 Dave Mishler 115 520 4.51978 Mike Cammon 73 322 4.41979 Jeff Cohn 117 426 3.61980 Jeff Cohn 137 503 3.71981 Jim Browne 52 162 3.11982 ricky edwards 157 688 4.41983 ricky edwards 183 561 3.11984 Casey Cummings 79 386 4.91985 Stanley Davenport 149 598 4.01986 Stanley Davenport 181 703 3.91987 Byron Sanders 187 778 4.21988 Byron Sanders 264 1,062 4.01989 Bob Christian 277 1,291 4.71990 Bob Christian 237 939 4.01991 eric Dixon 64 227 3.51992 Len Williams 148 119 0.81993 robbie Glanton 36 159 4.41994 Darnell Autry 120 556 4.61995 Darnell Autry 387 1,785 4.61996 Darnell Autry 280 1,452 5.21997 Adrian Autry 244 1,049 4.31998 Damien Anderson 164 537 3.31999 Damien Anderson 306 1,128 3.72000 Damien Anderson 311 2,063 6.62001 Damien Anderson 172 757 4.42002 Jason Wright 219 1,234 5.62003 Jason Wright 267 1,388 5.22004 Noah Herron 274 1,381 5.02005 Tyrell Sutton 250 1,474 5.92006 Tyrell Sutton 189 1,000 5.32007 Tyrell Sutton 108 522 4.82008 Tyrell Sutton 184 890 4.8
YeaR-BY-YeaR RuShING leadeRS
CaReeR RuShING leadeRSYeAr-BY-YeAr LOOK AT NU’S TOP 10
1. damien anderson...................4,485Year Att. Yards Avg.1998 164 537 3.31999 306 1,128 3.72000 311 2,063 6.62001 172 757 4.4Totals 953 4,485 4.7
2. Tyrell Sutton............................2,996Year Att. Yards Avg.2005 250 1,474 5.92006 189 1,000 5.32007 108 522 4.82008 184 890 4.8Totals 731 3,886 5.3
3. darnell autry............................3,793Year Att. Yards Avg.1994 120 556 4.61995 387 1,785 4.61996 280 1,452 5.2Totals 787 3,793 4.8
4. Bob Christian.............................2,643Year Att. Yards Avg.1987 0 0 —1988 98 413 4.21989 277 1,291 4.71990 237 939 4.0Totals 612 2,643 4.3
5. Jason Wright..............................2,625Year Att. Yards Avg.2000 0 0 —2001 3 3 1.02002 219 1,234 5.62003 267 1,388 5.2Totals 489 2,625 5.4
6. Noah herron...............................2,524Year Att. Yards Avg.2001 3 39 13.02002 66 365 5.52003 119 739 6.22004 274 1,381 5.0Totals 462 2,524 5.5
7. Greg Boykin...............................2,465Year Att. Yards Avg.1972 159 625 3.91973 98 350 3.61975 239 1,105 4.61976 105 385 3.7Totals 601 2,465 4.1
8. Mike adamle..............................2,015Year Att. Yards Avg.1968 39 94 2.41969 140 666 4.81970 304 1,255 4.1Totals 483 2,015 4.2
9. Stanley davenport....................1,946Year Att. Yards Avg.1984 84 244 2.91985 149 598 4.01986 181 703 3.91987 108 401 3.7Totals 522 1,946 3.7
10. Byron Sanders.........................1,840Year Att. Yards Avg.1987 187 778 4.21988 264 1,062 4.0Totals 451 1,840 4.1
R U S H I N G

2009 northwestern footbal l • NUsports.com2009 northwestern footbal l • NUsports.com 2009 northwestern footbal l • NUsports.com 177
Passing attemptsGame: 71, Sandy Schwab vs. Michigan, 1982Season: 521, C.J. Bachér, 2007Career: 1,584, Brett Basanez, 2002-05
Passing CompletionsGame: 45, Sandy Schwab vs. Michigan, 1982Season: 318, C.J. Bachér, 2007Career: 913, Brett Basanez, 2002-05
Passing YardsHalf: 367, Mike Greenfield vs. Northern Illinois, 1985Game: 520, C.J. Bachér vs. Michigan State, 2007Season: 3,656, C.J. Bachér, 2007Career: 10,580, Brett Basanez, 2002-05First Game of Career: 275, Tom Myers vs. South Carolina, 1962
Passing Yards Per attemptSeason: 7.4, Len Williams, 1992Career: 7.2, Dick Thomas, 1952-53
Passing Yards Per CompletionSeason: 14.0, Maurie Daigneau, 1970Career: 14.2, Maurie Daigneau, 1969-71
Most Passing Yards Gained in Consecutive GamesTwo Games: 990, C.J. Bachér vs. Michigan State and Minnesota, 2007Three Games: 1,351, C.J. Bachér vs. Michigan State, Minnesota and eastern Michigan, 2007Four Games: 1,640, C.J. Bachér vs. Michigan, Michigan State, Minnesota and eastern Michigan, 2007Five Games: 1,848, C.J. Bachér vs. Michigan, Michigan State, Minnesota, e. Michigan and Purdue, 2007
Touchdown PassesHalf: 4 (second), C.J. Bachér vs. Michigan State, 2007Game: 5, Mitch Anderson vs. Minnesota, 1973; and C.J. Bachér vs. Michigan State, 2007Season: 21, Brett Basanez, 2005Career: 44, Brett Basanez, 2002-05 & Len Williams, 1990-93First Game of Career: 2, Gavin Hoffman vs. UNLV, 1998; Sandy Schwab vs. Illinois, 1982; Tom Myers vs. South Carolina, 1962
By a Freshman Game: 3, Gavin Hoffman vs. Hawaii, 1998; Gavin Hoffman vs.Purdue, 1998; Sandy Schwab vs. Ohio State, 1982Season: 14, Sandy Schwab, 1982
Consecutive Games Throwing a Td PassSeason: 12, Zak Kustok, 2000Career: 24, Zak Kustok, 1999-01Most Touchdown Passes by a TandemSeason: 12, Steve Schnur and D’Wayne Bates, 1996Career: 17, Steve Schnur and D’Wayne Bates, 1995-96
Passing efficiency RatingSeason: 136.3, Len Williams, 1991Career: 128.0, Tim O’Brien, 1988-89
Passing Completion PercentageGame: (min. 30 atts.) 80.6 (25-31), Brett Basanez vs. Illinois, 2005Season: (min. 300 atts.) 63.2 (314-497), Brett Basanez, 2005Career: (min. 400 atts.) 60.1, C.J. Bachér, 2005-present
SINGle-GaMe BeSTS Yards Passing
1. 520 C.J. Bachér vs. Michigan State, 2007 2. 513 Brett Basanez vs. TCU, 2004 3. 470 C.J. Bachér vs. Minnesota, 2007 4. 463 Brett Basanez vs. Purdue, 2005 5. 446 Mike Greenfield vs. Northern Illinois, 1985 6. 436 Sandy Schwab vs. Michigan, 1982 7. 421 Zak Kustok vs. Bowling Green, 2001 8. 416 Brett Basanez vs. UCLA, 2005 9. 393 Sandy Schwab vs. Ohio State, 1982 10. 392 Sandy Schwab vs. Purdue, 1983
Passes attempted 1. 71 Sandy Schwab vs. Michigan, 1982 2. 70 Brett Basanez vs. UCLA, 2005 3. 62 Brett Basanez vs. TCU, 2004 4. 61 C.J. Bachér vs. Michigan State, 2008 5. 59 Sandy Schwab vs. Purdue, 1983 6. 58 C.J. Bachér vs. Minnesota, 2007 7. 55 Brett Basanez vs. Purdue, 2005 55 Mike Kerrigan vs. Illinois, 1981 55 Len Williams vs. Minnesota, 1993 10. 54 C.J. Bachér vs. Iowa, 2007
Passes Completed 1. 45 Sandy Schwab vs. Michigan, 1982 2. 41 C.J. Bachér vs. Minnesota, 2007 3. 39 Brett Basanez vs. TCU, 2004 4. 38 C.J. Bachér vs. Michigan State, 2007 38 Brett Basanez vs. UCLA, 2005 6. 37 Brett Basanez vs. Purdue, 2005 7. 36 Sandy Schwab vs. Purdue, 1983 8. 34 C.J. Bachér vs. Michigan State, 2008 9. 31 Brett Basanez vs. Iowa, 2005 31 Brett Basanez vs. Illinois, 2002 31 Len Williams vs. Minnesota, 1993 31 Sandy Schwab vs. Purdue, 1982
longest Pass Plays1. 94 Mitch Anderson to Jim Lash vs. Michigan State, 19722. 81 Gavin Hoffman to D’Wayne Bates vs. Penn State, 1998 81 Mitch Anderson to Jim Lash vs. Indiana, 19724. 80 Zak Kustok to Kunle Patrick vs. Bowling Green, 2001 80 Sandy Schwab to Jon Harvey vs. Ohio State, 1982 80 rick Venturi to ron rector vs. Illinois, 19657. 79 Kevin Strasser to Mike McGee vs. Wisconsin, 19788. 78 C.J. Bachér to Jeff Yarbrough vs. Michigan State, 2007 78 Steve Schnur to D’Wayne Bates vs. Penn State, 1996 78 Tom Myers to ron rector vs. Illinois, 1964 78 John Talley to Irv Cross vs. Notre Dame, 1959
SINGle-SeaSON BeSTSTouchdownsPlayer Year Td
1. Brett Basanez 2005 21 2. Zak Kustok 2001 20 3. C.J. Bachér 2007 19 Zak Kustok 2000 19 C.J. Bachér 2008 19 5. Steve Schnur 1996 17 6. Tim O’Brien 1989 14 Sandy Schwab 1982 14 8. Gavin Hoffman 1998 13 Tom Myers 1962 13 10. Brett Basanez 2004 12 Len Williams 1990 12 Mike Kerrigan 1980 12 Mitch Anderson 1973 12
Passing efficiencyPlayer Year att. Comp. Int. Pct. Td Rating
1. Len Williams 1991 212 131 6 61.8 10 136.3 2. Brett Basanez 2005 497 314 8 63.2 21 135.1 3. Tom Myers 1962 195 116 14 59.5 13 133.3 4. Len Williams 1992 286 181 9 63.3 11 131.7 5. Steve Schnur 1996 368 221 14 60.1 17 127.8 6. Zak Kustok 2000 363 206 7 56.7 19 125.5 7. C.J. Bachér 2007 521 318 19 61.0 19 124.7 8. Tim O’Brien 1989 334 207 15 62.0 14 122.6 9. C.J. Bachér 2006 161 95 8 59.0 6 122.5 10. Steve Schnur 1995 257 141 6 54.9 9 120.3
Yards PassingPlayer Year att. Comp. Yards 1. C.J. Bachér 2007 521 318 3,656 2. Brett Basanez 2005 497 314 3,622 3. Brett Basanez 2004 460 247 2,838 4. Sandy Schwab 1982 416 234 2,735 5. Zak Kustok 2001 404 231 2,692 6. Steve Schnur 1996 368 221 2,632 7. C.J. Bachér 2008 408 245 2,432 8. Zak Kustok 2000 363 206 2,389 9. Tim O’Brien 1989 334 207 2,21810. Brett Basanez 2002 325 190 2,204
PA S S I N G
2009 northwestern footbal l • NUsports.com178 2009 northwestern footbal l • NUsports.com 2009 northwestern footbal l • NUsports.com
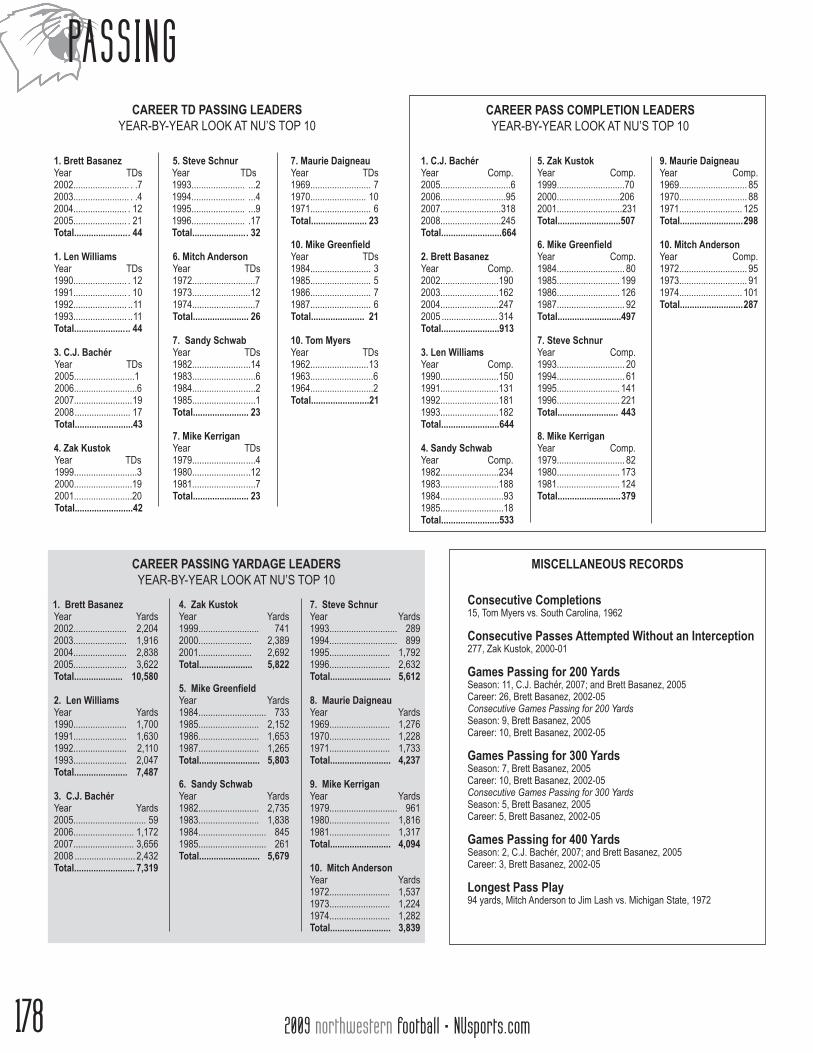
CaReeR Td PaSSING leadeRSYeAr-BY-YeAr LOOK AT NU’S TOP 10
CaReeR PaSS COMPleTION leadeRSYeAr-BY-YeAr LOOK AT NU’S TOP 10
1. Brett BasanezYear TDs2002....................... . .72003....................... . .42004...................... . 122005...................... . 21Total...................... . 44
1. len WilliamsYear TDs1990...................... . 121991...................... . 101992...................... ..111993...................... ..11Total..................... .. 44
3. C.J. Bachér Year TDs 2005.........................1 2006..........................6 2007........................ 19 2008 ....................... 17 Total.................... ....43
4. Zak Kustok Year TDs 1999..........................3 2000........................19 2001........................20 Total........................42
5. Steve SchnurYear TDs1993...................... ...21994...................... ...41995...................... ...91996...................... .17Total...................... . 32
6. Mitch anderson Year TDs 1972..........................7 1973........................ 12 1974..........................7 Total....................... 26
7. Sandy Schwab Year TDs 1982..................... ...14 1983..................... .....6 1984..................... .....2 1985..................... .....1 Total....................... 23
7. Mike Kerrigan Year TDs 1979...................... ....4 1980...................... ..12 1981...................... ....7 Total....................... 23
7. Maurie daigneau Year TDs 1969......................... 7 1970....................... 10 1971......................... 6 Total....................... 23
10. Mike Greenfield Year TDs 1984......................... 3 1985......................... 5 1986......................... 7 1987......................... 6 Total...................... 21
10. Tom Myers Year TDs 1962........................ 13 1963..........................6 1964..........................2 Total........................ 21
1. C.J. BachérYear Comp.2005............................. 62006........................... 952007......................... 3182008......................... 245Total......................... 664
2. Brett BasanezYear Comp.2002........................ 1902003........................ 1622004........................ 2472005 ....................... 314Total........................ 913
3. len WilliamsYear Comp.1990........................ 1501991........................ 1311992........................ 1811993........................ 182Total........................ 644
4. Sandy SchwabYear Comp.1982..................... ...2341983..................... ...1881984..................... .....931985..................... .....18Total..................... ...533
5. Zak KustokYear Comp.1999............................702000..........................2062001...........................231Total..........................507
6. Mike GreenfieldYear Comp.1984............................ 801985.......................... 1991986.......................... 1261987............................ 92Total........... ...............497
7. Steve SchnurYear Comp.1993............................ 201994............................ 611995.......................... 1411996.......................... 221Total......................... 443
8. Mike KerriganYear Comp.1979............................ 821980.......................... 1731981.......................... 124Total.......................... 379
9. Maurie daigneauYear Comp.1969............................ 851970............................ 881971.......................... 125Total.......................... 298
10. Mitch andersonYear Comp.1972............................ 951973............................ 911974.......................... 101Total.......................... 287
CaReeR PaSSING YaRdaGe leadeRSYeAr-BY-YeAr LOOK AT NU’S TOP 10
1. Brett BasanezYear Yards2002...................... 2,2042003...................... 1,9162004...................... 2,8382005...................... 3,622Total.................... 10,580
2. len WilliamsYear Yards1990...................... 1,7001991...................... 1,6301992...................... 2,1101993...................... 2,047Total...................... 7,487
3. C.J. BachérYear Yards2005.............................. 592006......................... 1,1722007......................... 3,656 2008 ......................... 2,432Total......................... 7,319
4. Zak KustokYear Yards1999......................... 7412000...................... 2,3892001...................... 2,692Total...................... 5,822
5. Mike GreenfieldYear Yards1984............................ 7331985......................... 2,1521986......................... 1,6531987......................... 1,265Total......................... 5,803
6. Sandy SchwabYear Yards1982......................... 2,7351983......................... 1,8381984............................ 8451985............................ 261Total......................... 5,679
7. Steve SchnurYear Yards1993............................ 2891994............................ 8991995......................... 1,7921996......................... 2,632Total......................... 5,612
8. Maurie daigneauYear Yards1969......................... 1,2761970......................... 1,2281971......................... 1,733Total......................... 4,237
9. Mike KerriganYear Yards1979............................ 9611980......................... 1,8161981......................... 1,317Total......................... 4,094
10. Mitch andersonYear Yards1972......................... 1,5371973......................... 1,2241974......................... 1,282Total......................... 3,839
MISCellaNeOuS ReCORdS
Consecutive Completions15, Tom Myers vs. South Carolina, 1962
Consecutive Passes attempted Without an Interception277, Zak Kustok, 2000-01
Games Passing for 200 YardsSeason: 11, C.J. Bachér, 2007; and Brett Basanez, 2005Career: 26, Brett Basanez, 2002-05Consecutive Games Passing for 200 YardsSeason: 9, Brett Basanez, 2005Career: 10, Brett Basanez, 2002-05
Games Passing for 300 YardsSeason: 7, Brett Basanez, 2005Career: 10, Brett Basanez, 2002-05Consecutive Games Passing for 300 YardsSeason: 5, Brett Basanez, 2005Career: 5, Brett Basanez, 2002-05
Games Passing for 400 YardsSeason: 2, C.J. Bachér, 2007; and Brett Basanez, 2005Career: 3, Brett Basanez, 2002-05
longest Pass Play94 yards, Mitch Anderson to Jim Lash vs. Michigan State, 1972
PA S S I N G

2009 northwestern footbal l • NUsports.com2009 northwestern footbal l • NUsports.com 2009 northwestern footbal l • NUsports.com 179
CaReeR PaSS eFFICIeNCY leadeRSYeAr-BY-YeAr LOOK AT NU’S TOP 10
(Minimum 200 Completions)
YeaR-BY-YeaR PaSSING leadeRS
1. Tim O’BrienYear Att. Comp. Int. Pct. Yards TD eff.1988 15 12 1 80.0 204 3 246.91989 334 207 15 62.0 2,218 14 122.6Totals 349 219 16 62.8 2,422 17 128.0
2. len WilliamsYear Att. Comp. Int. Pct. Yards TD eff.1990 262 150 9 57.3 1,700 12 120.01991 212 131 6 61.8 1,630 10 136.31992 286 181 9 63.3 2,110 11 131.71993 316 182 13 57.6 2,047 11 115.3Totals 1,076 644 37 59.9 7,487 44 125.0
3. Steve SchnurYear Att. Comp. Int. Pct. Yards TD eff.1993 43 20 4 46.5 289 2 99.71994 117 61 10 52.1 899 4 110.91995 257 141 6 54.9 1,792 9 120.31996 368 221 14 60.1 2,632 17 127.8Totals 785 443 34 56.4 5,612 32 121.3
4. C.J. BachérYear Att. Comp. Int. Pct. Yards TD eff.2005 15 6 1 40.0 59 1 81.72006 161 95 8 59.0 1,172 6 122.52007 521 318 19 61.0 3,656 19 124.72008 408 245 15 60.0 2,432 17 116.5Totals 1105 664 43 60.1 7,319 43 120.8
5. Brett BasanezYear Att. Comp. Int. Pct. Yards TD eff.2002 325 190 7 58.5 2,204 7 118.22003 302 162 12 53.6 1,916 4 103.42004 460 247 9 53.7 2,838 12 110.22005 497 314 8 63.2 3,622 21 135.1Totals 1,584 913 36 57.6 10,580 44 118.4
6. Zak KustokYear Att. Comp. Int. Pct. Yards TD eff.1999 153 70 6 45.8 741 3 85.12000 363 206 7 56.7 2,389 19 125.42001 404 231 10 57.2 2,692 20 124.5Totals 920 507 23 55.1 5,822 42 118.3
7. Tom MyersYear Att. Comp. Int. Pct. Yards TD eff.1962 195 116 14 59.5 1,537 13 133.31963 179 93 15 52.0 1,398 6 111.91964 160 72 11 45.0 901 2 82.7Totals 534 281 40 52.6 3,836 21 111.0
8. Tim hughesYear Att. Comp. Int. Pct. Yards TD eff.1994 132 61 8 .462 774 5 95.81996 10 6 1 .600 34 0 68.61997 270 142 6 .526 1,862 11 119.5Totals 412 209 15 .507 2,670 16 110.7
9. Mike GreenfieldYear Att. Comp. Int. Pct. Yards TD eff.1984 149 80 4 53.7 733 3 96.31985 335 199 12 59.4 2,152 5 111.11986 250 126 12 50.4 1,653 7 105.61987 199 92 11 46.2 1,265 6 98.5Totals 933 497 39 59.4 5,803 21 104.6
10. Mitch andersonYear Att. Comp. Int. Pct. Yards TD eff.1972 187 95 10 50.8 1,333 7 112.31973 197 91 9 46.2 1,224 12 109.41974 225 101 16 44.9 1,282 7 88.9Totals 609 287 35 47.1 3,839 26 102.7
Year Player att. Comp. Int. Td Yds.1938 Jack ryan 42 17 NA NA 2331939 Bill DeCorrevont 48 20 NA NA 2151940 Bill DeCorrevont NA NA NA NA 1891941 Otto Graham 75 36 12 NA 5791942 Otto Graham 182 89 18 3 1,0921943 Otto Graham NA NA NA NA 4011944 John Yungwirth NA NA NA NA 6131945 James Farrar NA NA NA NA 6131946 Don Burson 25 11 3 2 1931947 Don Burson 72 33 4 3 4531948 Don Burson 80 33 8 5 4931949 Don Burson 108 51 8 6 7901950 Dick Flowers 183 91 11 9 1,0611951 Bob Burson 157 61 15 7 9031952 Dick Thomas 157 78 15 10 1,2471953 Dick Thomas 145 74 5 6 9331954 Dale Pienta 62 25 5 2 3941955 Dale Pienta 42 21 5 2 3351956 Jack ellis 44 19 5 2 2481957 Chip Holcomb 91 41 8 2 3951958 Dick Thornton 122 53 8 7 8281959 John Talley 100 44 6 4 7831960 Dick Thornton 128 54 11 6 7711961 Tom O’Grady 59 28 7 1 3201962 Tom Myers 195 116 14 13 1,5371963 Tom Myers 179 93 15 6 1,3981964 Tom Myers 160 72 11 2 9011965 Dennis Boothe 102 42 9 2 4871966 Bill Melzer 176 94 12 7 1,1711967 Bill Melzer 215 101 16 1 1,1461968 Dave Shelbourne 251 105 16 7 1,3581969 Maurie Daigneau 191 85 16 7 1,2761970 Maurie Daigneau 204 88 12 10 1,2281971 Maurie Daigneau 264 125 25 6 1,7331972 Mitch Anderson 187 95 10 7 1,3331973 Mitch Anderson 197 91 9 12 1,2241974 Mitch Anderson 225 101 16 7 1,2821975 randy Dean 200 101 7 3 1,3151976 randy Dean 177 87 10 8 1,3841977 Scott Stranski 95 37 10 4 5411978 Kevin Strasser 307 151 13 6 1,5261979 Mike Kerrigan 195 82 17 4 9611980 Mike Kerrigan 337 173 17 12 1,8161981 Mike Kerrigan 265 124 13 7 1,3171982 Sandy Schwab 416 234 20 14 2,7351983 Sandy Schwab 334 188 19 6 1,8381984 Sandy Schwab 198 93 9 2 8451985 Mike Greenfield 335 199 12 5 2,1521986 Mike Greenfield 250 126 12 7 1,6531987 Mike Greenfield 199 92 11 6 1,2651988 Greg Bradshaw 257 129 11 9 1,5501989 Tim O’Brien 334 207 15 14 2,2181990 Len Williams 262 150 9 12 1,7001991 Len Williams 212 131 6 10 1,6301992 Len Williams 286 181 9 11 2,1101993 Len Williams 316 182 13 11 2,0471994 Steve Schnur 117 61 10 4 8991995 Steve Schnur 257 141 6 9 1,7921996 Steve Schnur 368 221 14 17 2,6321997 Tim Hughes 270 142 6 11 1,8621998 Gavin Hoffman 323 176 14 13 2,1991999 Nick Kreinbrink 158 60 5 4 7742000 Zak Kustok 363 206 7 19 2,3892001 Zak Kustok 404 231 10 20 2,6922002 Brett Basanez 325 190 7 7 2,2042003 Brett Basanez 302 162 12 4 1,9162004 Brett Basanez 460 247 9 12 2,8382005 Brett Basanez 497 314 8 21 3,6222006 C.J. Bachér 161 95 8 6 1,1722007 C.J. Bachér 521 318 19 19 3,6562008 C.J. Bachér 408 245 15 17 2,432
PA S S I N G
2009 northwestern footbal l • NUsports.com180 2009 northwestern footbal l • NUsports.com 2009 northwestern footbal l • NUsports.com
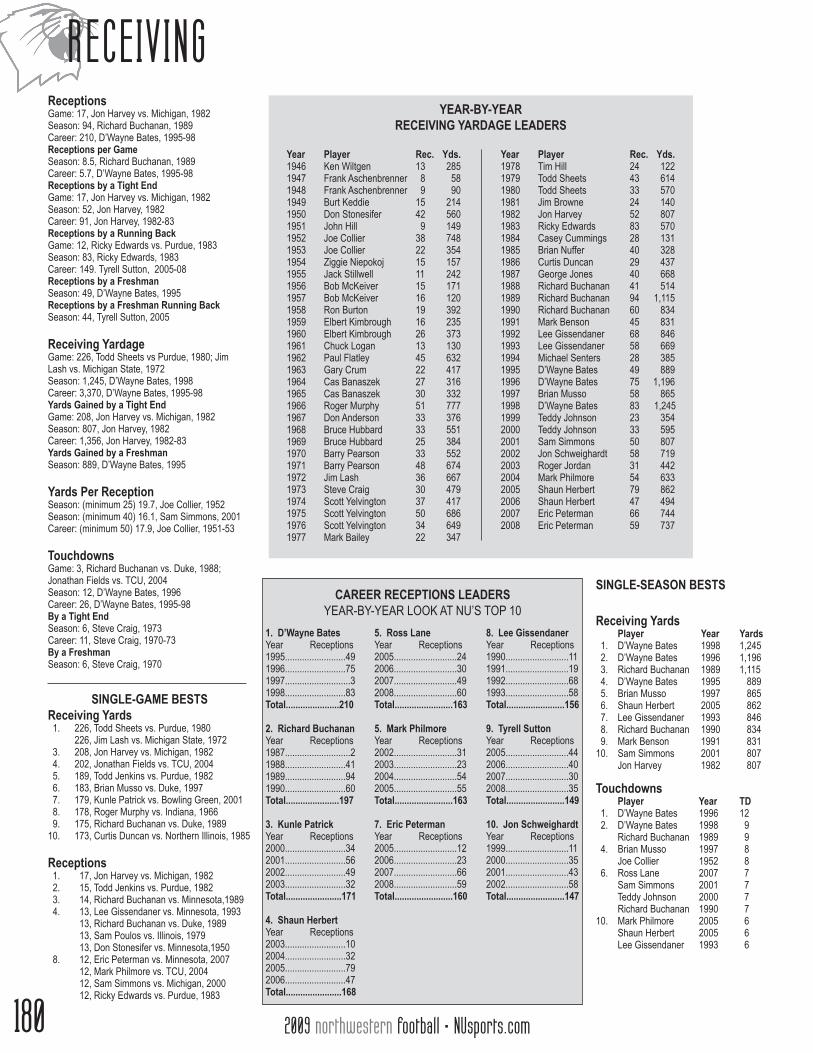
ReceptionsGame: 17, Jon Harvey vs. Michigan, 1982Season: 94, richard Buchanan, 1989Career: 210, D’Wayne Bates, 1995-98Receptions per GameSeason: 8.5, richard Buchanan, 1989Career: 5.7, D’Wayne Bates, 1995-98 Receptions by a Tight endGame: 17, Jon Harvey vs. Michigan, 1982Season: 52, Jon Harvey, 1982Career: 91, Jon Harvey, 1982-83Receptions by a Running BackGame: 12, ricky edwards vs. Purdue, 1983Season: 83, ricky edwards, 1983Career: 149. Tyrell Sutton, 2005-08 Receptions by a FreshmanSeason: 49, D’Wayne Bates, 1995Receptions by a Freshman Running BackSeason: 44, Tyrell Sutton, 2005
Receiving YardageGame: 226, Todd Sheets vs Purdue, 1980; Jim Lash vs. Michigan State, 1972Season: 1,245, D’Wayne Bates, 1998Career: 3,370, D’Wayne Bates, 1995-98Yards Gained by a Tight endGame: 208, Jon Harvey vs. Michigan, 1982Season: 807, Jon Harvey, 1982Career: 1,356, Jon Harvey, 1982-83Yards Gained by a FreshmanSeason: 889, D’Wayne Bates, 1995
Yards Per ReceptionSeason: (minimum 25) 19.7, Joe Collier, 1952Season: (minimum 40) 16.1, Sam Simmons, 2001Career: (minimum 50) 17.9, Joe Collier, 1951-53
TouchdownsGame: 3, richard Buchanan vs. Duke, 1988; Jonathan Fields vs. TCU, 2004Season: 12, D’Wayne Bates, 1996Career: 26, D’Wayne Bates, 1995-98By a Tight endSeason: 6, Steve Craig, 1973Career: 11, Steve Craig, 1970-73By a FreshmanSeason: 6, Steve Craig, 1970
SINGle-GaMe BeSTSReceiving Yards 1. 226, Todd Sheets vs. Purdue, 1980 226, Jim Lash vs. Michigan State, 1972 3. 208, Jon Harvey vs. Michigan, 1982 4. 202, Jonathan Fields vs. TCU, 2004 5. 189, Todd Jenkins vs. Purdue, 1982 6. 183, Brian Musso vs. Duke, 1997 7. 179, Kunle Patrick vs. Bowling Green, 2001 8. 178, roger Murphy vs. Indiana, 1966 9. 175, richard Buchanan vs. Duke, 198910. 173, Curtis Duncan vs. Northern Illinois, 1985
Receptions 1. 17, Jon Harvey vs. Michigan, 1982 2. 15, Todd Jenkins vs. Purdue, 1982 3. 14, richard Buchanan vs. Minnesota,1989 4. 13, Lee Gissendaner vs. Minnesota, 1993 13, richard Buchanan vs. Duke, 1989 13, Sam Poulos vs. Illinois, 1979 13, Don Stonesifer vs. Minnesota,1950 8. 12, eric Peterman vs. Minnesota, 2007 12, Mark Philmore vs. TCU, 2004 12, Sam Simmons vs. Michigan, 2000 12, ricky edwards vs. Purdue, 1983
SINGle-SeaSON BeSTS
Receiving Yards Player Year Yards 1. D’Wayne Bates 1998 1,245 2. D’Wayne Bates 1996 1,196 3. richard Buchanan 1989 1,115 4. D’Wayne Bates 1995 889 5. Brian Musso 1997 865 6. Shaun Herbert 2005 862 7. Lee Gissendaner 1993 846 8. richard Buchanan 1990 834 9. Mark Benson 1991 83110. Sam Simmons 2001 807 Jon Harvey 1982 807
Touchdowns Player Year Td 1. D’Wayne Bates 1996 12 2. D’Wayne Bates 1998 9 richard Buchanan 1989 9 4. Brian Musso 1997 8 Joe Collier 1952 8 6. ross Lane 2007 7 Sam Simmons 2001 7 Teddy Johnson 2000 7 richard Buchanan 1990 710. Mark Philmore 2005 6 Shaun Herbert 2005 6 Lee Gissendaner 1993 6
1. d’Wayne BatesYear receptions1995......................... 491996......................... 751997.......................... .31998......................... 83Total...................... 210
2. Richard BuchananYear receptions1987......................... ..21988......................... 411989......................... 941990......................... 60Total...................... 197
3. Kunle PatrickYear receptions2000......................... 342001......................... 562002......................... 492003......................... 32 Total....................... 171
4. Shaun herbertYear receptions2003......................... 102004......................... 322005......................... 792006......................... 47Total....................... 168
5. Ross laneYear receptions2005.......................... 242006.......................... 302007.......................... 492008.......................... 60 Total........................ 163
5. Mark PhilmoreYear receptions2002.......................... 312003.......................... 232004.......................... 542005.......................... 55 Total........................ 163
7. eric PetermanYear receptions2005.......................... 122006.......................... 232007.......................... 662008.......................... 59 Total........................ 160
8. lee GissendanerYear receptions1990.......................... 111991.......................... 191992.......................... 681993.......................... 58Total........................ 156
9. Tyrell SuttonYear receptions2005..........................442006.......................... 402007.......................... 302008.......................... 35Total........................ 149
10. Jon SchweighardtYear receptions1999.......................... 112000.......................... 352001.......................... 432002.......................... 58Total........................ 147
Year Player Rec. Yds.1946 Ken Wiltgen 13 2851947 Frank Aschenbrenner 8 581948 Frank Aschenbrenner 9 901949 Burt Keddie 15 2141950 Don Stonesifer 42 5601951 John Hill 9 1491952 Joe Collier 38 7481953 Joe Collier 22 3541954 Ziggie Niepokoj 15 1571955 Jack Stillwell 11 2421956 Bob McKeiver 15 1711957 Bob McKeiver 16 1201958 ron Burton 19 3921959 elbert Kimbrough 16 2351960 elbert Kimbrough 26 3731961 Chuck Logan 13 1301962 Paul Flatley 45 6321963 Gary Crum 22 4171964 Cas Banaszek 27 3161965 Cas Banaszek 30 3321966 roger Murphy 51 7771967 Don Anderson 33 3761968 Bruce Hubbard 33 5511969 Bruce Hubbard 25 3841970 Barry Pearson 33 5521971 Barry Pearson 48 6741972 Jim Lash 36 6671973 Steve Craig 30 4791974 Scott Yelvington 37 4171975 Scott Yelvington 50 6861976 Scott Yelvington 34 6491977 Mark Bailey 22 347
Year Player Rec. Yds.1978 Tim Hill 24 1221979 Todd Sheets 43 6141980 Todd Sheets 33 5701981 Jim Browne 24 1401982 Jon Harvey 52 8071983 ricky edwards 83 5701984 Casey Cummings 28 1311985 Brian Nuffer 40 3281986 Curtis Duncan 29 4371987 George Jones 40 6681988 richard Buchanan 41 5141989 richard Buchanan 94 1,1151990 richard Buchanan 60 8341991 Mark Benson 45 8311992 Lee Gissendaner 68 8461993 Lee Gissendaner 58 6691994 Michael Senters 28 3851995 D’Wayne Bates 49 8891996 D’Wayne Bates 75 1,1961997 Brian Musso 58 8651998 D’Wayne Bates 83 1,2451999 Teddy Johnson 23 3542000 Teddy Johnson 33 5952001 Sam Simmons 50 8072002 Jon Schweighardt 58 7192003 roger Jordan 31 4422004 Mark Philmore 54 6332005 Shaun Herbert 79 8622006 Shaun Herbert 47 4942007 eric Peterman 66 7442008 eric Peterman 59 737
CaReeR ReCePTIONS leadeRSYeAr-BY-YeAr LOOK AT NU’S TOP 10
YeaR-BY-YeaR ReCeIVING YaRdaGe leadeRS
R E C E I V I N G

2009 northwestern footbal l • NUsports.com2009 northwestern footbal l • NUsports.com 2009 northwestern footbal l • NUsports.com 181
CaReeR ReCeIVING YaRdaGe leadeRS YeAr-BY-YeAr LOOK AT NU’S TOP 10
1. d’Wayne BatesYear receiving Yards1995 ...................... 8891996 ................... 1,1961997 ........................ 401998 ................... 1,245Total ................... 3,370
2. Richard BuchananYear receiving Yards1987 ....................... .111988 ...................... 5141989 ................... 1,1151990 ...................... 834Total ................... 2,474
3. Ross laneYear receiving Yards2005 ...................... 3782006 ..................... .4012007 ...................... 6492008 ...................... 640Total ................... 2,068
4. eric PetermanYear receiving Yards2005 ...................... 1812006 ..................... .3492007 ...................... 7442008 ...................... 737Total ................... 2,011
5. Shaun herbertYear receiving Yards2003 ...................... 1052004 ..................... .4652005 ...................... 8622006 ...................... 494Total ................... 1,926
6. lee GissendanerYear receiving Yards1990......................... 1291991......................... 2341992......................... 8461993......................... 669Total ..................... 1,878
7. Kunle PatrickYear receiving Yards2000......................... 3692001......................... 6722002......................... 5582003......................... 274Total ..................... 1,873
8. Mark PhilmoreYear receiving Yards2002......................... 2452003......................... 2282004......................... 6332005......................... 662Total ..................... 1,768
9. Scott YelvingtonYear receiving Yards1973........................... 101974......................... 4171975......................... 6861976......................... 649Total ..................... 1,762
10. Brian MussoYear receiving Yards1994........................... 781995......................... 2511996......................... 5151997......................... 865Total ..................... 1,709
CaReeR ReCeIVING Td leadeRSYeAr-BY-YeAr LOOK AT NU’S TOP 10
1. d’Wayne BatesYear TD1995...................51996.................121997...................01998...................9Total ................26
2. Richard BuchananYear TD1987...................01988...................61989...................91990...................7Total ................22
3. Sam SimmonsYear TD1998...................11999...................12000...................52001...................7Total ................14
4. lee GissendanerYear TD1990...................01991...................21992...................61993...................5Total ................13
4. Joe CollierYear TD1951...................31952...................81953...................2Total ................13
4. Ross laneYear TD2005...................12006...................22007...................72008...................3Total ................13
5. eric PetermanYear TD2005...................22006...................12007...................32008...................6Total ................12
8. Brian MussoYear TD1994...................01995...................01996...................31997...................8Total ................11
8. Steve CraigYear TD1971...................11972...................41973...................6Total ................11
8. Teddy JohnsonYear TD1997...................01998...................01999...................42000...................7Total ................11
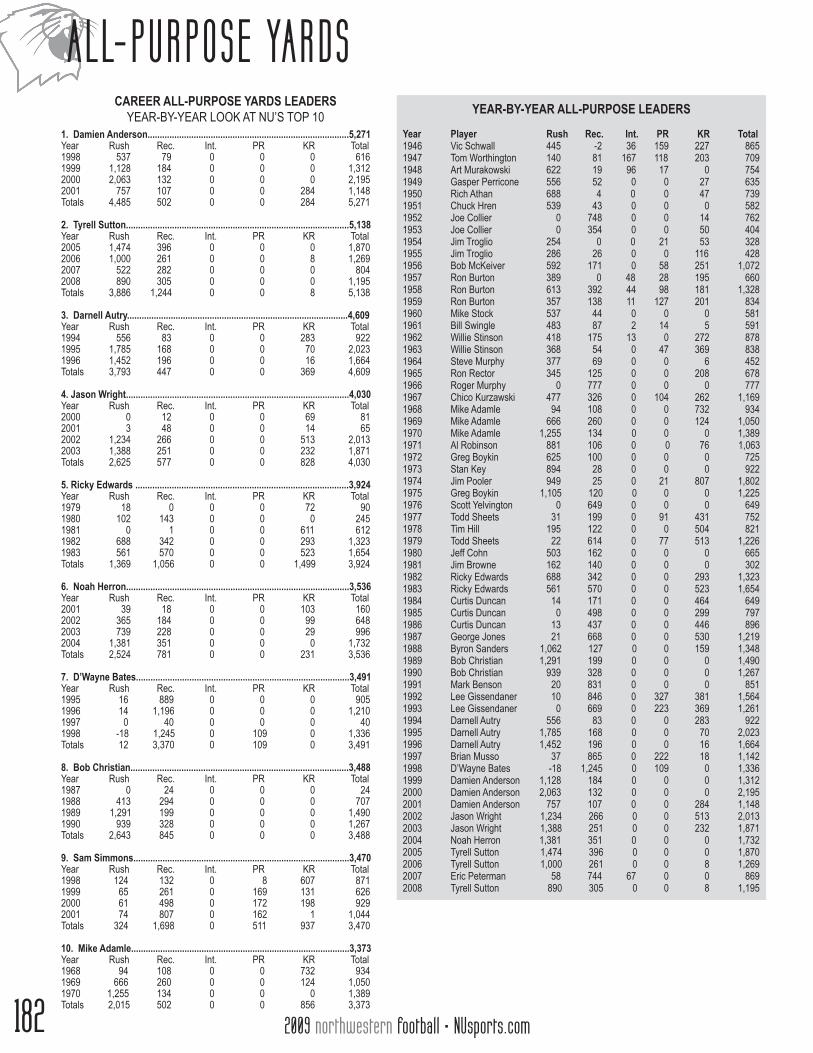
PlaysGame: 51, ricky edwards vs. Indiana, 1983Season: 417, Darnell Autry, 1995Career: 1,022, Damien Anderson, 1998-01
all-Purpose Yards Game: 336, Jason Wright vs. Bowling Green, 2003Season: 2,195, Damien Anderson, 2000Career: 5,271, Damien Anderson, 1998-01By a FreshmanGame: 253, Tyrell Sutton vs. Wisconsin, 2005Season: 1,870, Tyrell Sutton, 2005
CaReeR all-PuRPOSe leadeRSYeAr-BY-YeAr LOOK AT NU’S TOP 20
Player Years Rush Rec. Int. PR KR Yds. 1. Damien Anderson 1998-01 4,485 502 0 0 284 5,271 2. Tyrell Sutton 2005-08 3,886 1,244 0 0 8 5,138 3. Darnell Autry 1994-96 3,793 447 0 0 369 4,609 4. Jason Wright 2000-03 2,625 577 0 0 828 4,030 5. ricky edwards 1979-83 1,369 1,056 0 0 1,499 3,924 6. Noah Herron 2001-04 2,524 781 0 0 231 3,536 7. D’Wayne Bates 1995-98 12 3,370 0 109 0 3,491 8. Bob Christian 1987-90 2,643 845 0 0 0 3,488 9. Sam Simmons 1998-01 324 1,698 0 511 937 3,470 10. Mike Adamle 1968-70 2,015 502 0 0 856 3,373 11. Lee Gissendaner 1990-93 10 1,878 0 606 750 3,24412. Todd Sheets 1976-80 53 1,515 0 241 1,423 3,232 13. Jim Pooler 1973-75 1,323 236 0 139 1,325 3,02314. Brian Musso 1994-97 37 1,709 0 1,075 55 2,876 15. ron Burton 1957-59 1,359 530 103 253 577 2,82216. richard Buchanan 1987-90 69 2,474 0 196 0 2,73917. Greg Boykin 1972-76 2,465 267 0 0 0 2,732 18. Al robinson 1969-71 1,526 348 0 0 637 2,511 19. Curtis Duncan 1983-86 41 1,159 0 0 1,308 2,508 20. Stanley Davenport 1984-87 1,996 472 0 0 0 2,468
SINGle-SeaSON BeSTS Receptions Player Year Rec. Yards Td 1. richard Buchanan 1989 94 1,115 9 2. D’Wayne Bates 1998 83 1,245 9 ricky edwards 1983 83 570 0 4. Shaun Herbert 2005 79 862 6 5. D’Wayne Bates 1996 75 1,196 12 6. Lee Gissendaner 1992 68 846 6 7. eric Peterman 2007 66 744 3 8. ross Lane 2008 60 640 3 Jonathan Fields 2005 60 555 0 richard Buchanan 1990 60 834 710. eric Peterman 2008 59 737 6
MISCellaNeOuS ReCORdSGames Gaining 100 YardsSeason: 5, D’Wayne Bates, 1996, 1998 and richard Buchanan, 1989Career: 15, D’Wayne Bates, 1995-98
Games Gaining 200 YardsSeason: 1, Jonathan Fields, 2004; Jon Harvey, 1982; Todd Sheets, 1980; Jim Lash, 1972
Consecutive Games Catching a PassSeason: 13, Kunle Patrick, 2003Career: 47, Kunle Patrick, 2000-03
Games Catching a Td PassSeason: 10, D’Wayne Bates, 1996Career: 20, D’Wayne Bates, 1995-98
Consecutive Games Catching a Td PassSeason: 5, Teddy Johnson, 2000Career: 6, richard Buchanan, 1989-90
longest Gain94 yards, Mitch Anderson to Jim Lash vs Michigan State, 1972
SINGle-SeaSON BeSTSall-Purpose Yards Player Year Rush Rec. Int. PR KR Total 1. Damien Anderson 2000 2,063 132 0 0 0 2,195 2. Darnell Autry 1995 1,785 168 0 0 70 2,023 3. Jason Wright 2002 1,234 266 0 0 513 2,013 4. Jason Wright 2003 1,388 251 0 0 232 1,871 5. Tyrell Sutton 2005 1,474 396 0 0 0 1,870 6. Jim Pooler 1974 949 25 0 21 807 1,802 7. Noah Herron 2004 1,381 351 0 0 0 1,732 8. Darnell Autry 1996 1,452 196 0 0 16 1,664 9. ricky edwards 1983 561 570 0 0 523 1,65410. Lee Gissendaner 1993 10 846 0 327 381 1,564
R E C E I V I N G /A L L- P U R P O S E
2009 northwestern footbal l • NUsports.com182 2009 northwestern footbal l • NUsports.com 2009 northwestern footbal l • NUsports.com
CaReeR all-PuRPOSe YaRdS leadeRSYeAr-BY-YeAr LOOK AT NU’S TOP 10
1. damien anderson...................................................................................5,271Year rush rec. Int. Pr Kr Total1998 537 79 0 0 0 6161999 1,128 184 0 0 0 1,3122000 2,063 132 0 0 0 2,1952001 757 107 0 0 284 1,148Totals 4,485 502 0 0 284 5,271
2. Tyrell Sutton............................................................................................5,138Year rush rec. Int. Pr Kr Total2005 1,474 396 0 0 0 1,8702006 1,000 261 0 0 8 1,2692007 522 282 0 0 0 8042008 890 305 0 0 0 1,195Totals 3,886 1,244 0 0 8 5,138
3. darnell autry...........................................................................................4,609Year rush rec. Int. Pr Kr Total1994 556 83 0 0 283 9221995 1,785 168 0 0 70 2,0231996 1,452 196 0 0 16 1,664Totals 3,793 447 0 0 369 4,609
4. Jason Wright............................................................................................4,030Year rush rec. Int. Pr Kr Total2000 0 12 0 0 69 812001 3 48 0 0 14 652002 1,234 266 0 0 513 2,0132003 1,388 251 0 0 232 1,871Totals 2,625 577 0 0 828 4,030
5. Ricky edwards ........................................................................................3,924Year rush rec. Int. Pr Kr Total1979 18 0 0 0 72 901980 102 143 0 0 0 2451981 0 1 0 0 611 6121982 688 342 0 0 293 1,3231983 561 570 0 0 523 1,654Totals 1,369 1,056 0 0 1,499 3,924
6. Noah herron............................................................................................3,536Year rush rec. Int. Pr Kr Total2001 39 18 0 0 103 1602002 365 184 0 0 99 6482003 739 228 0 0 29 9962004 1,381 351 0 0 0 1,732Totals 2,524 781 0 0 231 3,536
7. d’Wayne Bates........................................................................................3,491Year rush rec. Int. Pr Kr Total1995 16 889 0 0 0 9051996 14 1,196 0 0 0 1,2101997 0 40 0 0 0 401998 -18 1,245 0 109 0 1,336Totals 12 3,370 0 109 0 3,491
8. Bob Christian..........................................................................................3,488Year rush rec. Int. Pr Kr Total1987 0 24 0 0 0 241988 413 294 0 0 0 7071989 1,291 199 0 0 0 1,4901990 939 328 0 0 0 1,267Totals 2,643 845 0 0 0 3,488
9. Sam Simmons.........................................................................................3,470Year rush rec. Int. Pr Kr Total1998 124 132 0 8 607 8711999 65 261 0 169 131 6262000 61 498 0 172 198 9292001 74 807 0 162 1 1,044Totals 324 1,698 0 511 937 3,470
10. Mike adamle..........................................................................................3,373Year rush rec. Int. Pr Kr Total1968 94 108 0 0 732 9341969 666 260 0 0 124 1,0501970 1,255 134 0 0 0 1,389Totals 2,015 502 0 0 856 3,373
YeaR-BY-YeaR all-PuRPOSe leadeRS
Year Player Rush Rec. Int. PR KR Total1946 Vic Schwall 445 -2 36 159 227 8651947 Tom Worthington 140 81 167 118 203 7091948 Art Murakowski 622 19 96 17 0 7541949 Gasper Perricone 556 52 0 0 27 6351950 rich Athan 688 4 0 0 47 7391951 Chuck Hren 539 43 0 0 0 5821952 Joe Collier 0 748 0 0 14 7621953 Joe Collier 0 354 0 0 50 4041954 Jim Troglio 254 0 0 21 53 3281955 Jim Troglio 286 26 0 0 116 4281956 Bob McKeiver 592 171 0 58 251 1,0721957 ron Burton 389 0 48 28 195 6601958 ron Burton 613 392 44 98 181 1,3281959 ron Burton 357 138 11 127 201 8341960 Mike Stock 537 44 0 0 0 5811961 Bill Swingle 483 87 2 14 5 5911962 Willie Stinson 418 175 13 0 272 8781963 Willie Stinson 368 54 0 47 369 8381964 Steve Murphy 377 69 0 0 6 4521965 ron rector 345 125 0 0 208 6781966 roger Murphy 0 777 0 0 0 7771967 Chico Kurzawski 477 326 0 104 262 1,1691968 Mike Adamle 94 108 0 0 732 9341969 Mike Adamle 666 260 0 0 124 1,0501970 Mike Adamle 1,255 134 0 0 0 1,3891971 Al robinson 881 106 0 0 76 1,0631972 Greg Boykin 625 100 0 0 0 7251973 Stan Key 894 28 0 0 0 9221974 Jim Pooler 949 25 0 21 807 1,8021975 Greg Boykin 1,105 120 0 0 0 1,2251976 Scott Yelvington 0 649 0 0 0 6491977 Todd Sheets 31 199 0 91 431 7521978 Tim Hill 195 122 0 0 504 8211979 Todd Sheets 22 614 0 77 513 1,2261980 Jeff Cohn 503 162 0 0 0 6651981 Jim Browne 162 140 0 0 0 3021982 ricky edwards 688 342 0 0 293 1,3231983 ricky edwards 561 570 0 0 523 1,6541984 Curtis Duncan 14 171 0 0 464 6491985 Curtis Duncan 0 498 0 0 299 7971986 Curtis Duncan 13 437 0 0 446 8961987 George Jones 21 668 0 0 530 1,2191988 Byron Sanders 1,062 127 0 0 159 1,3481989 Bob Christian 1,291 199 0 0 0 1,4901990 Bob Christian 939 328 0 0 0 1,2671991 Mark Benson 20 831 0 0 0 8511992 Lee Gissendaner 10 846 0 327 381 1,5641993 Lee Gissendaner 0 669 0 223 369 1,2611994 Darnell Autry 556 83 0 0 283 9221995 Darnell Autry 1,785 168 0 0 70 2,0231996 Darnell Autry 1,452 196 0 0 16 1,6641997 Brian Musso 37 865 0 222 18 1,1421998 D’Wayne Bates -18 1,245 0 109 0 1,3361999 Damien Anderson 1,128 184 0 0 0 1,3122000 Damien Anderson 2,063 132 0 0 0 2,1952001 Damien Anderson 757 107 0 0 284 1,1482002 Jason Wright 1,234 266 0 0 513 2,0132003 Jason Wright 1,388 251 0 0 232 1,8712004 Noah Herron 1,381 351 0 0 0 1,7322005 Tyrell Sutton 1,474 396 0 0 0 1,8702006 Tyrell Sutton 1,000 261 0 0 8 1,2692007 eric Peterman 58 744 67 0 0 8692008 Tyrell Sutton 890 305 0 0 8 1,195
A L L- P U R P O S E YA R D S

2009 northwestern footbal l • NUsports.com2009 northwestern footbal l • NUsports.com 2009 northwestern footbal l • NUsports.com 183
Punt ReturnsGame: 6, by many, most recent: Brian Musso at Notre Dame, 1995Season: 28, Brian Musso, 1995Career: 96, Brian Musso, 1994-97
Punt Return YardsGame: 121, Lee Gissendaner vs. Stanford, 1992Season: 547, Pug rentner, 1931Career: 1,075, Brian Musso, 1994-97
average Gain Per Punt ReturnGame: (minimum 3) 40.3, Lee Gissendaner vs. Stanford, 1992Game: (minimum 5) 17.3, Gene Miller vs. Minnesota, 1950Season: (minimum 1.0 per game) 21.8, Lee Gissendaner, 1992Career: (minimum 1.0 per game) 14.8, Lee Gissendaner, 1990-93
Punt Return Touchdowns Game: 1, by many, most recent: Marquice Cole vs. Northern Illinois, 2005Season: 2, Tom Worthington, 1949Career: 3, Brian Musso, 1994-97; Tom Worthington, 1946-49
PuNT ReTuRNS
CaReeR PuNT ReTuRN aVeRaGe v Player Years No. Yards avg. 1. Lee Gissendaner 1990-93 41 606 14.8 2. Sam Simmons 1998-01 40 511 12.8 3. Brian Musso 1993-97 96 1,075 11.2 4. Steve Tasker 1982-84 28 303 10.8 5. roland Wahl 1962-63 20 194 9.7 6. Walter Jones 1950-52 31 255 8.2 7. Brian Nuffer 1985-86 28 210 7.5 8. Barry Pearson 1969-71 56 394 7.0 9. Kunle Patrick 2000-03 50 334 6.710. Larry Gates 1965-66 30 178 5.9
SINGle-SeaSON PuNT ReTuRN aVeRaGe v Player Year No. Yards avg. 1. Lee Gissendaner 1992 15 327 21.8 2. Tom Worthington 1949 16 296 18.5 3. Vic Schwall 1946 10 159 15.9 4. Sam Simmons 1999 11 169 15.4 5. ron Burton 1959 9 127 14.1 6. Brian Musso 1995 28 393 14.0 7. Lee Gissendaner 1993 16 223 13.9 8. Sam Simmons 2000 13 172 13.2 9. Otto Graham 1942 13 167 12.810. Loran Day 1948 17 214 12.6 v average 1.0 per game
lONGeST PuNT ReTuRNS 1. 93 Otto Graham vs. Kansas State, 1941 2. 87 Sam Simmons vs. TCU, 1999 3. 86 Brian Musso vs. Indiana, 1995 4. 81 Marquice Cole vs. Northern Illinois, 2005 81 Dirk Adams vs. Duke, 1987 6. 80 Pug rentner vs. Minnesota, 1931 7. 79 Art Murakowski vs. Wisconsin, 1949 8. 77 Don Heap vs. Wisconsin, 1936 9. 73 Jeff Backes vs. Illinois, 200410. 72 Lee Gissendaner vs. Stanford, 1992 72 Lee Gissendaner vs. Purdue, 1992
YeaR-BY-YeaR PuNT ReTuRN leadeRS
Year Player No. Yards avg.1946 Vic Schwall 10 159 15.91947 Frank Aschenbrenner 9 90 10.01948 Loran Day 17 214 12.61949 Tom Worthington 16 296 18.51950 Dick Alban 11 113 10.31951 Dick Alban 9 55 6.11952 Walter Jones 23 180 7.81953 richard ranicke 7 52 7.41954 richard ranicke 13 67 5.21955 richard Widmark 5 46 9.21956 Willmer Fowler 5 65 13.01957 Bob McKeiver 5 22 4.41958 ron Burton 10 98 9.81959 ron Burton 9 127 14.11960 Albert Kimbrough 5 28 5.61961 Albert Kimbrough 5 22 4.41962 roland Wahl 15 151 10.11963 roland Wahl 5 43 8.61964 Dick McCauley 8 60 7.51965 Larry Gates 11 73 6.61966 Larry Gates 19 105 5.51967 Chico Kurzawski 15 104 6.91968 rich Dean 16 119 7.41969 Barry Pearson 13 76 5.91970 Barry Pearson 23 195 8.41971 Barry Pearson 20 123 6.11972 Greg Strunk 12 139 11.51973 Neil Little 6 37 6.21974 Pat Geegan 6 38 6.31975 Pete Shaw 12 110 9.21976 Pete Shaw 10 87 8.71977 Todd Sheets 11 91 8.31978 Pat Geegan 7 45 6.41979 Todd Sheets 8 77 9.61980 Todd Sheets 2 15 7.51981 Steve Bogan 6 42 7.01982 Steve Tasker 16 129 8.11983 Steve Tasker 5 92 18.41984 Steve Tasker 7 82 11.71985 Brian Nuffer 15 133 8.91986 Brian Nuffer 13 77 5.91987 Dirk Adams 3 82 27.31988 Pat New 7 70 10.01989 richard Buchanan 8 71 8.91990 Patrick Wright 9 64 7.11991 Lee Gissendaner 10 56 5.61992 Lee Gissendaner 15 327 v 21.81993 Lee Gissendaner 16 223 13.91994 Brian Musso 20 180 9.01995 Brian Musso 28 393 14.01996 Brian Musso 25 280 11.21997 Brian Musso 22 222 9.71998 Josh Barnes 22 189 8.61999 Sam Simmons 11 169 15.42000 Sam Simmons 13 172 13.22001 Sam Simmons 15 162 10.82002 Kunle Patrick 19 142 7.52003 Kunle Patrick 25 150 6.02004 Mark Philmore 14 145 10.42005 Marquice Cole 8 216 27.02006 Brendan Smith 4 47 11.82007 eric Peterman 11 67 6.12008 Brendan Smith 15 118 7.9
v Ranked first nationally in NCaa statistics
P U N T R E T U R N S
2009 northwestern footbal l • NUsports.com184 2009 northwestern footbal l • NUsports.com 2009 northwestern footbal l • NUsports.com
Kickoff ReturnsGame: 8, Byron Sanders vs. Michigan, 1988Season: 38, Patrick Wright, 1990; Jim Pooler, 1974Career: 72, Todd Sheets, 1976-80
Kickoff Return YardsGame: 191, Jason Wright vs. TCU, 2002Season: 807, Jim Pooler, 1974Career: 1,499, ricky edwards, 1979-83
Kickoff Return averageGame: (minimum 3) 63.7, Jason Wright vs. TCU, 2002Season: (minimum 1.2 per game) 28.5, Jason Wright, 2002Career: (minimum 1.5 per game) 24.3, Steve Tasker, 1982-84
Kickoff Touchdowns Game: 1, by many, most recent: Stephen Simmons vs. Ohio State, 2007Season: 1, by many, most recent: Stephen Simmons vs. Ohio State, 2007Career: 2, Pug rentner, 1930-31
longest Kickoff Return100 yards, Jason Wright vs. TCU, 2002
KICKOFF ReTuRNS
CaReeR KICKOFF ReTuRN aVeRaGe v Player Years No. Yards avg. 1. Jeff Backes 2002-04 38 1,007 26.5 2. Curtis Duncan 1983-86 50 1,308 26.2 3. Willie Stinson 1961-63 28 718 25.6 4. Steve Tasker 1982-84 31 752 24.3 5. Stephen Simmons 2006-present 35 830 23.7 6. Lee Gissendaner 1990-93 34 750 22.1 Sherrick McManis 2006-present 59 1,306 22.1 8. A.J. Owens 1972 22 476 21.6 eric Scott 1993 24 518 21.610. Jim Pooler 1973-75 62 1,325 21.4
SINGle-SeaSON KICKOFF ReTuRN aVeRaGe v Player Year No. Yards avg. 1. Jason Wright 2002 18 513 28.5 2. Willie Stinson 1963 13 369 28.3 3. Sam Simmons 1998 22 607 27.6 4. ron rector 1964 13 358 27.5 5. Curtis Duncan 1984 17 464 27.3 6. Curtis Duncan 1985 11 299 27.2 7. Jeff Backes 2002 18 472 26.2 8. Damien Anderson 2001 11 284 25.8 9. Willmer Fowler 1955 14 359 25.610. Tim Hill 1978 20 504 25.2
v average 1.0 per game
lONGeST KICKOFF ReTuRNS 1. 100 Jason Wright vs. TCU, 2002 2. 99 Stephen Simmons vs. Ohio State, 2007 99 Curtis Duncan vs. Indiana, 1984 4. 98 Pug rentner vs. Illinois, 1930 98 Wilbur Hightower vs. Indiana, 1913 6. 97 Jeff Backes vs. Minnesota, 2004 7. 95 Pug rentner vs. Minnesota, 1931 8. 93 Teddy Johnson vs. Minnesota, 2000 93 Todd Sheets vs. Iowa, 1976 93 Greg Strunk vs. Ohio State, 1971 93 Frank Aschenbrenner vs. UCLA, 1947
YeaR-BY-YeaR KICKOFF ReTuRN leadeRS
Year Player No. Yards avg.1946 Vic Schwall 12 227 18.91947 Frank Aschenbrenner 9 195 21.71948 Frank Aschenbrenner 7 91 13.01949 John Miller 7 145 20.71950 Dick Alban 6 126 21.01951 Dick Alban 5 93 18.61952 Walter Jones 11 228 20.71953 Nick Chandler 5 126 25.21954 robert King 6 87 14.51955 Frank Jeske 7 147 21.01956 Bob McKeiver 11 251 22.81957 Willmer Fowler 14 358 25.61958 ron Burton 8 181 22.61959 ray Purdin 11 236 21.41960 Dick Thornton 6 199 33.21961 Larry Benz 4 75 18.81962 Willie Stinson 12 272 22.71963 Willie Stinson 13 369 28.31964 ron rector 13 358 27.51965 Dick Smith 11 253 23.01966 Mike Bradburn 12 253 21.11967 Chico Kurzawski 13 262 20.11968 Mike Adamle 34 732 21.51969 Al robinson 27 522 19.31970 Johnny Cooks 17 322 18.91971 Greg Strunk 8 211 26.31972 A.J. Owens 22 476 21.61973 Jim Pooler 7 142 20.31974 Jim Pooler 38 807 21.21975 Jim Pooler 17 376 22.11976 Todd Sheets 20 430 21.51977 Todd Sheets 23 431 18.71978 Tim Hill 20 504 25.21979 Todd Sheets 26 513 19.71980 Lou Tiberi 18 402 22.31981 ricky edwards 30 611 20.41982 Steve Tasker 17 410 24.11983 ricky edwards 24 523 21.81984 Curtis Duncan 17 464 27.31985 Curtis Duncan 11 299 27.21986 Walter Ding 7 188 26.91987 Marcus Lang 9 158 17.61988 Pat New 21 450 21.41989 Terry Smith 19 367 19.31990 Patrick Wright 38 659 17.31991 Mike Senters 19 337 17.71992 Lee Gissendaner 17 381 22.41993 Lee Gissendaner 17 369 21.71994 Michael Senters 22 483 22.01995 Hudhaifa Ismaeli 7 209 29.91996 Hudhaifa Ismaeli 14 315 22.51997 Teddy Johnson 15 343 22.91998 Sam Simmons 22 607 27.61999 Louis Ayeni 17 295 17.42000 Teddy Johnson 18 432 24.02001 Damien Anderson 11 284 15.82002 Jason Wright 18 513 28.52003 Derell Jenkins 18 320 17.82004 Jeff Backes 11 333 30.32005 Gerard Hamlett 21 468 22.32006 Sherrick McManis 28 588 21.02007 Sherrick McManis 31 718 23.22008 Stephen Simmons 23 509 22.1
K I C K O F F R E T U R N S

2009 northwestern footbal l • NUsports.com2009 northwestern footbal l • NUsports.com 2009 northwestern footbal l • NUsports.com 185
PuntsGame: 13, J.J. Standring vs. Ohio State, 1998Season: 84, J.J. Standring, 1999Career: 305, J.J. Standring, 1998-01
Punting YardsGame: 551, J.J. Standring vs. Ohio State, 1998Season: 3,404, J.J. Standring, 1999Career: 12,639, J.J. Standring, 1998-01
Punting averageGame: (minimum 5) 56.6, Paul Burton vs. Air Force, 1994: vs. Indiana, 1995Season: (minimum 50) 45.6, John Kidd, 1982Career: (minimum 175) 41.8, John Kidd, 1980-83
Punts Over 50 YardsSeason: 19, J.J. Standring, 2001Career: 57, John Kidd, 1980-83
longest Punt90, Paul Burton vs. Indiana, 1995; Steve Toth vs. Wisconsin, 1934
PuNTS
CaReeR PuNT aVeRaGe Player Years No. Yards avg. 1. John Kidd 1980-83 261 10,916 41.8 2. J.J. Standring 1998-01 305 12,639 41.4 3. Paul Burton 1993-96 216 8,948 41.4 4. ed Sutter 1988-91 218 8,803 40.4 5. Brian Huffman 2000, 2002-04 191 7,683 40.2 6. Stefan demos 2006-present 118 4,667 39.6 7. Marty McGann 1970-72 182 7,114 39.1 8. randy Dean 1974-76 154 5,925 38.5 minimum 100 punts
SINGle SeaSON PuNT aVeRaGe Player Year No. Yards avg. 1. John Kidd 1982 52 2,371 45.6 2. Paul Burton 1996 45 1,972 43.8 3. ed Sutter 1989 33 1,436 43.5 4. J.J. Standring 2001 69 2,971 43.1 5. Paul Burton 1994 51 2,193 43.0 6. randy Dean 1975 58 2,463 42.5 7. John Kidd 1983 67 2,808 41.9 8. John Kidd 1981 79 3,296 41.7 9. J.J. Standring 1998 78 3,240 41.510. Brian Huffman 2002 66 2,737 41.5 average 1.0 per game
lONGeST PuNTS 1. 90 Paul Burton vs. Indiana, 1995 90 Steve Toth vs. Wisconsin, 1934 3. 88 Ollie Olson vs. Illinois, 1932 4. 80 Merlin Norenberg vs. Minnesota, 1963 5. 79 ed Sutter vs. Illinois, 1990 6. 78 John Kidd vs. Wisconsin, 1980 7. 76 ed Sutter vs. rutgers, 1989 8. 75 ed Sutter vs. Duke, 1990 75 ed Sutter vs. Wisconsin, 1988 75 John Kidd vs. Wisconsin, 1982 75 Steve Toth vs. Ohio State, 1936
YeaR-BY-YeaR PuNTING leadeRS Year Player avg.1946 Frank Aschenbrenner 32.81947 Tom Worthington 35.81948 Frank Aschenbrenner 36.91949 Tom Worthington 39.81950 Norm Kragseth 34.61951 Norm Kragseth 32.51952 Norm Kragseth 35.01953 Dick Thomas 37.31954 George Gondek 36.01955 Jim Troglio 34.61956 Bob McKeiver 39.61957 Bob McKeiver 39.01958 Dick Thornton 35.21959 Mike Stock 34.71960 Dick Thornton 34.41961 Dave Cox 35.41962 Merlin Norenberg 37.41963 Merlin Norenberg 41.41964 Tom Myers 35.01965 ron rector 40.51966 Cas Banaszek 35.81967 Chico Kurzawski 38.21968 Dick emmerich 36.61969 rick Telander 37.01970 Marty McGann 40.51971 Marty McGann 37.31972 Marty McGann 39.21973 Wayne Frederickson 36.81974 randy Dean 36.41975 randy Dean 42.51976 randy Dean 35.31977 Bob Schmidt 34.41978 Jeff Christensen 36.01979 Bob Schmidt 34.51980 John Kidd 38.71981 John Kidd 41.71982 John Kidd 45.61983 John Kidd 41.91984 Shawn Carpenter 36.91985 Shawn Carpenter 36.51986 Shawn Carpenter 36.51987 Shawn Carpenter 39.51988 ed Sutter 41.41989 ed Sutter 43.51990 ed Sutter 38.41991 ed Sutter 39.81992 Matt Dzierwa 37.31993 Paul Burton 40.11994 Paul Burton 43.01995 Paul Burton 39.71996 Paul Burton 43.81997 Tim Hughes 40.51998 J.J. Standring 41.51999 J.J. Standring 40.52000 J.J. Standring 40.92001 J.J. Standring 43.12002 Brian Huffman 41.52003 Brian Huffman 39.92004 Brian Huffman 39.12005 ryan Pederson 39.62006 Slade Larscheid 37.22007 Stefan Demos 40.12008 Stefan Demos 39.0
J.J. STaNdRING
P U N T I N G

2009 northwestern footbal l • NUsports.com186 2009 northwestern footbal l • NUsports.com 2009 northwestern footbal l • NUsports.com
PointsGame: 27, Otto Graham vs. Wisconsin, 1943Season: 138, Damien Anderson, 2000Career: 262, Brian Gowins, 1995-98Points Scored per GameSeason: 11.5, Damien Anderson, 2000Career: 6.5, Darnell Autry, 1994-96
Points Scored—KickingGame: 17, Tim Long vs. Michigan, 2000; Brian Gowins vs. Hawaii, 1998Season: 90, Amado Villarreal, 2008Career: 262, Brian Gowins, 1995-98
Touchdowns ScoredGame: 4, Tyrell Sutton (two times, vs. Northern Illinois, 2005; vs. Wisconsin, 2005), Jason Wright (four times, vs. Indiana, 2002; vs. Kansas, 2003; vs. Indiana, 2003; vs. Illinois, 2003), Damien Anderson (three times, vs. Duke, 2001; vs. Indiana, 2000; vs. Illinois, 2000), Darnell Autry vs. Iowa 1996;ricky edwards vs. Northern Illinois, 1982; Mike Adamle vs. Minnesota,1970; Otto Graham vs. Wisconsin, 1943Season: 23, Damien Anderson, 2000Career: 38, Damien Anderson, 1998-01By a FreshmanGame: 4, Tyrell Sutton (twice, vs. Northern Illinois and Wisconsin), 2005Season: 18, Tyrell Sutton, 2005Touchdowns Scored in Consecutive GamesTwo games: 6, Tyrell Sutton, 2005 (twice, Ohio and Northern Illinois, and Penn State and Wisconsin), Damien Anderson, 2000 (Michigan State and Indiana); Darnell Autry, 1996 (Iowa and Purdue)Three games: 8, Darnell Autry, 1996; (Iowa,Purdue and Tennessee)Consecutive Games Scoring a TouchdownSeason: 9, Damien Anderson, 2000Career: 9, Damien Anderson, 2000Most Games Scoring a TouchdownSeason: 10, Noah Herron, 2004; Jason Wright, 2003; Damien Anderson, 2000Career: 22, Damien Anderson, 1998-01Most Games Scoring Two or More TouchdownsSeason: 8, Damien Anderson, 2000Career: 12, Darnell Autry 1994-96
PaTs attemptedGame: 7, Amado Villarreal vs. Michigan State, 2007; David Wasielewski vs. Navy, 2002; Tim Long vs. Illinois, 2000; Tim Long vs. Indiana, 2000; Bill Planisek vs. Illinois, 1970Season: 52, Tim Long, 2000Career: 95, Brian Gowins, 1995-98
PaTs MadeGame: 7, David Wasielewski vs. Navy, 2002; Tim Long vs. Illinois, 2000; Tim Long vs. Indiana, 2000Season: 50, Tim Long, 2000Career: 88, Brian Gowins, 1995-98Highest PercentageSeason: (minimum 20 attempts) 100.0, Ira Adler, 1990; John Duvic, 1986; Sam Valenzisi, 1994; Brian Gowins, 1998Career: (minimum 50 attempts) 98.4, John Duvic, 1983-86
Consecutive PaTsGame: 7, Tim Long vs. Illinois, 2000; Tim Long vs. Indiana, 2000Season: 47, Tim Long, 2000Career: 54, Tim Long, 1999-2000
Field Goals attemptedGame: 6, Brian Huffman vs. TCU, 2004; Sam Valenzisi vs. Minnesota, 1994Season: 27, Brian Gowins, 1997Career: 85, Brian Gowins, 1995-98Beyond 50 yardsSeason: 5, John Duvic, 1984Career: 9, Brian Gowins, 1995-98
Field Goals MadeGame: 5, Joel Howells vs. Penn State, 2005Season: 20, Brian Gowins, 1997; Amado Villarreal, 2008Career: 58, Brian Gowins, 1995-98Consecutive: 13, Sam Valenzisi, 1995Beyond 50 yardsGame: 1, by many, most recent: David Wasielewski vs. Air Force, 2002Season: 2, Sam Valenzisi, 1994Career: 3, Brian Gowins, 1995-98By a FreshmanGame: 2, Nick Mirkopulos vs. Arizona, 1975Season: 6, Nick Mirkopulos, 1975Highest PercentageGame: (minimum 4 attempts) 100.0, Sam Valenzisi vs. Michigan, 1995Season: (minimum 10 attempts) 93.8, Sam Valenzisi, 1995Career: (minimum 25 attempts) 75.0, Amado Villarreal, 2005-08
Most Games Kicking a Field Goal32, Brian Gowins, 1995-98
Consecutive Games Kicking a Field Goal9, Brian Gowins, 1997
Most Times Kicking Two or More Field Goals in a Game
Season: 8, Brian Gowins, 1997 Career: 20, Brian Gowins, 1995-98
Most Times Kicking Three or More Field Goals in a GameSeason: 4, John Duvic, 1986Career: 6, John Duvic, 1983-86; Sam Valenzisi, 1992-95
longest Field Goal Made54 yards, Nick Mirkopulos vs. Arizona, 1975By a Freshman54 yards, Nick Mirkopulos vs. Arizona, 1975
BRIaN GOWINS
S C O R I N G
2009 northwestern footbal l • NUsports.com2009 northwestern footbal l • NUsports.com 2009 northwestern footbal l • NUsports.com 187
SINGle-GaMe BeSTSPoints 1. 27 Otto Graham vs. Wisconsin, 1943 2. 24 Tyrell Sutton vs. Wisconsin, 2005 24 Tyrell Sutton vs. Northern Illinois, 2005 24 Jason Wright vs. Illinois, 2003 24 Jason Wright vs. Indiana, 2003 24 Jason Wright vs. Kansas, 2003 24 Jason Wright vs. Indiana, 2002 24 Damien Anderson vs. Duke, 2001 24 Damien Anderson vs. Illinois, 2000 24 Damien Anderson vs. Indiana, 2000 24 Darnell Autry vs. Iowa, 1996 24 ricky edwards vs. Northern Illinois, 1982 24 Mike Adamle vs. Minnesota, 1970 14. 22 Dick emmerich vs. Iowa, 1968 15. 20 Bob Christian vs. Air Force, 1988 20 Vic Gustafson vs. South Dakota, 1929
Field Goals 1. 5 Joel Howells vs. Penn State, 2005 2. 4 Tim Long vs. Michigan, 2000 4 Brian Gowins vs. Hawaii, 1998 4 Sam Valenzisi vs. Michigan, 1995 4 Sam Valenzisi vs. Minnesota, 1993 6. 3 Accomplished 28 times; most recently by Amado Villarreal vs. Michigan, 2007
SINGle-SeaSON BeSTSPoints Player Year Td PaT FG Pts 1. Damien Anderson 2000 23 0 0 138 2. Jason Wright 2003 21 0 0 126 3. Tyrell Sutton 2005 18 0 0 108 Darnell Autry 1996 18 0 0 108 Darnell Autry 1995 18 0 0 108 6. Noah Herron 2004 15 0 0 90 Amado Villarreal 2008 0 30 20 90 8. Tim Long 2000 0 50 13 89 9. Brian Gowins 1996 0 34 16 8210. Brian Gowins 1997 0 19 20 79
Field Goals Made Player Year No. Pct. -40 40+ lng 1. Brian Gowins 1997 20-27 .741 12 8 52 Amado Villarreal 2008 20-25 .800 19 1 46 3. John Duvic 1986 19-23 .826 14 5 52 4. Brian Gowins 1998 17-24 .708 11 6 51 5. Brian Gowins 1996 16-24 .666 13 3 48 6. Sam Valenzisi 1995 15-16 .938 13 2 46 7. Tim Long 2000 13-17 .765 7 6 46 Sam Valenzisi 1994 13-19 .684 8 5 52 9. Amado Villarreal 2007 12-18 .667 9 3 49 Tim Long 1999 12-18 .667 11 1 43 Ira Adler 1990 12-16 .750 6 6 50 John Duvic 1984 12-19 .632 5 7 49
Year Player Points1938 Bernie Jefferson 241939 Don Clawson 321940 Don Clawson 451941 Otto Graham 481942 ed Hirsch 241943 Otto Graham 611944 Duane Sickles 181945 Dick Conners 301946 Vic Schwall 501947 Art Murakowski 301948 Frank Aschenbrenner 24 Art Murakowski 241949 Art Murakowski 301950 rich Athan 421951 Chuck Hren 241952 Joe Collier 48 Chuck Hren 481953 Bob Lauter 301954 George Gondek 12 John rearden 121955 Jack Weber 181956 Bob McKeiver 381957 ron Burton 181958 ron Burton 761959 ron Burton 361960 Mike Stock 391961 Bill Swingle 301962 Steve Murphy 561963 Steve Murphy 361964 Steve Murphy 361965 Bob McKelvey 481966 Dick emmerich 291967 Chico Kurzawski 421968 Dick emmerich 351969 Mike Adamle 301969 Mike Hudson 301970 Mike Adamle 601971 randy Anderson 601972 Greg Boykin 38
Year Player Points1973 Steve Craig 36 Stan Key 361974 Jim Pooler 541975 Greg Boykin 541976 Mark Bailey 24 Scott Yelvington 241977 Sam Poulos 241978 Steve Bogan 361979 Steve Bogan 24 Dave Mishler 241980 Jay Anderson 371981 Steve Bogan 241982 ricky edwards 541983 John Duvic 271984 John Duvic 481985 John Duvic 481986 John Duvic 771987 Ira Adler 581988 Bob Christian 441989 Bob Christian 741990 Ira Adler 481991 Mark Benson 421992 Lee Gissendaner 541993 Sam Valenzisi 491994 Sam Valenzisi 601995 Darnell Autry 1081996 Darnell Autry 1081997 Brian Gowins 791998 Brian Gowins 721999 Tim Long 472000 Damien Anderson 1382001 Zak Kustok 662002 Jason Wright 782003 Jason Wright 1262004 Noah Herron 902005 Tyrell Sutton 1082006 Joel Howells 482007 Amado Villarreal 722008 Amado Villarreal 90
CaReeR SCORING leadeRSYeAr-BY-YeAr LOOK AT NU’S TOP 10
1. Brian Gowins.....................................262Year TD PAT 2PT Saf FG Pts1995 — 14 — — 5 291996 — 34 — — 16 821997 — 19 — — 20 791998 — 21 — — 17 72Totals — 88 — — 58 262
2. damien anderson ............................228Year TD PAT 2PT Saf FG Pts1998 4 — — — — 241999 3 — — — — 182000 23 — — — — 1382001 8 — — — — 48Totals 38 — — — — 228
3. darnell autry.....................................222Year TD PAT 2PT Saf FG Pts1994 1 — — — — 61995 18 — — — — 1081996 18 — — — — 108Totals 37 — — — — 222
3. Tyrell Sutton......................................222Year TD PAT 2PT Saf FG Pts2005 18 — — — — 1082006 7 — — — — 422007 4 — — — — 242008 8 — — — — 48Totals 37 — — — — 222
5. Jason Wright.....................................210Year TD PAT 2PT Saf FG Pts2000 — — — — — 02001 1 — — — — 62002 13 — — — — 782003 21 — — — — 126Totals 35 — — — — 210
6. John duvic........................................200Year TD PAT 2PT Saf FG Pts1983 — 12 — — 5 271984 — 12 — — 12 481985 — 18 — — 10 481986 — 20 — — 19 77Totals — 62 — — 46 200
7. Ira adler .............................................188Year TD PAT 2PT Saf FG Pts1987 — 15 — — 11 481988 — 18 — — 7 391989 — 16 — — 9 431990 — 22 — — 12 58Totals — 71 — — 39 188
8. Bob Christian....................................174Year TD PAT 2PT Saf FG Pts1987 — — — — — 01988 7 — 1 — — 441989 11 — 4 — — 741990 9 — 1 — — 56Totals 27 — 6 — — 174
9. Sam Valenzisi....................................169Year TD PAT 2PT Saf FG Pts1992 — — — — — 01993 — 16 — — 11 491994 — 21 — — 13 601995 — 15 — — 15 60Totals — 52 — — 39 169
10. Noah herron....................................168Year TD PAT 2PT Saf FG Pts2001 — — — — — 02002 7 — — — — 422003 6 — — — — 362004 15 — — — — 90Totals 28 — — — — 168
YeaR-BY-YeaR SCORING leadeRS
S C O R I N G

2009 northwestern footbal l • NUsports.com188 2009 northwestern footbal l • NUsports.com 2009 northwestern footbal l • NUsports.com
NICK MIRKOPulOS kicked a 54-yard field goal in 1975, the longest in NU history.
CaReeR KICK SCORING leadeRSYeAr-BY-YeAr LOOK AT NU’S TOP SIX
1. Brian Gowins...............................262Year PAT-Att FG-Att Pts1995 14-15 5-10 291996 34-37 16-24 821997 19-22 20-27 791998 21-21 17-24 72Totals 88-95 58-85 262
2. John duvic...................................200Year PAT-Att FG-Att Pts1983 12-12 5-11 271984 12-12 12-19 481985 18-19 10-17 481986 20-20 19-23 77Totals 62-63 46-70 200
3. Ira adler ........................................188Year PAT-Att FG-Att Pts1987 15-16 11-13 481988 18-19 7-12 391989 16-17 9-13 431990 22-22 12-16 58Totals 71-74 39-54 188
4. Sam Valenzisi...............................169Year PAT-Att FG-Att Pts1993 16-17 11-18 491994 21-21 13-19 601995 15-16 15-16 60Totals 52-54 39-53 169
5. amado Villarreal..........................166Year PAT-Att FG-Att Pts2005 1-1 0-0 22006 — — 02007 36-37 12-18 722008 30-34 20-25 90Totals 67-72 33-44 166
6. Joel howells.................................147Year PAT-Att FG-Att Pts2003 0-1 0-1 02004 9-10 4-5 212005 45-48 11-21 782006 24-25 8-12 48Totals 78-84 23-39 147
CaReeR FIeld GOalS leadeRSYeAr-BY-YeAr LOOK AT NU’S TOP 10
Player Years No. Pct. -40 +40 long 1. Brian Gowins 1995-98 58-85 .682 38 20 52 2. John Duvic 1983-86 46-70 .657 30 16 52 3. Ira Adler 1987-90 39-54 .722 26 13 50 Sam Valenzisi 1992-95 39-53 .736 29 10 52 5. Amado Villarreal 2005-08 33-44 .750 29 4 49 6. Tim Long 1998-00 25-35 .714 18 7 46 7. Joel Howells 2003-06 23-39 .590 18 5 46 8. David Wasielewski 2001-02 17-31 .548 10 7 51 9. Bill Planisek 1969-71 15-26 .577 12 3 4510. Sam Poulos 1976-79 14-25 .560 13 1 43
lONGeST FIeld GOalS Made
Yards Player Opponent Year 1. 54 Nick Mirkopulos Arizona 1975 2. 52 Brian Gowins Michigan 1997 52 Sam Valenzisi Ohio State 1994 52 John Duvic Purdue 1986 5. 51 David Wasielewski Air Force 2002 51 Brian Gowins Hawaii 1998 51 Sam Valenzisi Michigan State 1994 7. 50 Brian Gowins Iowa 1995 50 Ira Adler Michigan State 1990 50 Ira Adler Wisconsin 1989 50 Nick Mirkopulos Arizona 1976 IRa adleR ranks in the top 10 in six different scoring categories. Adler was
the team’s leading scorer in 1987.
S C O R I N G
2009 northwestern footbal l • NUsports.com2009 northwestern footbal l • NUsports.com 2009 northwestern footbal l • NUsports.com 189
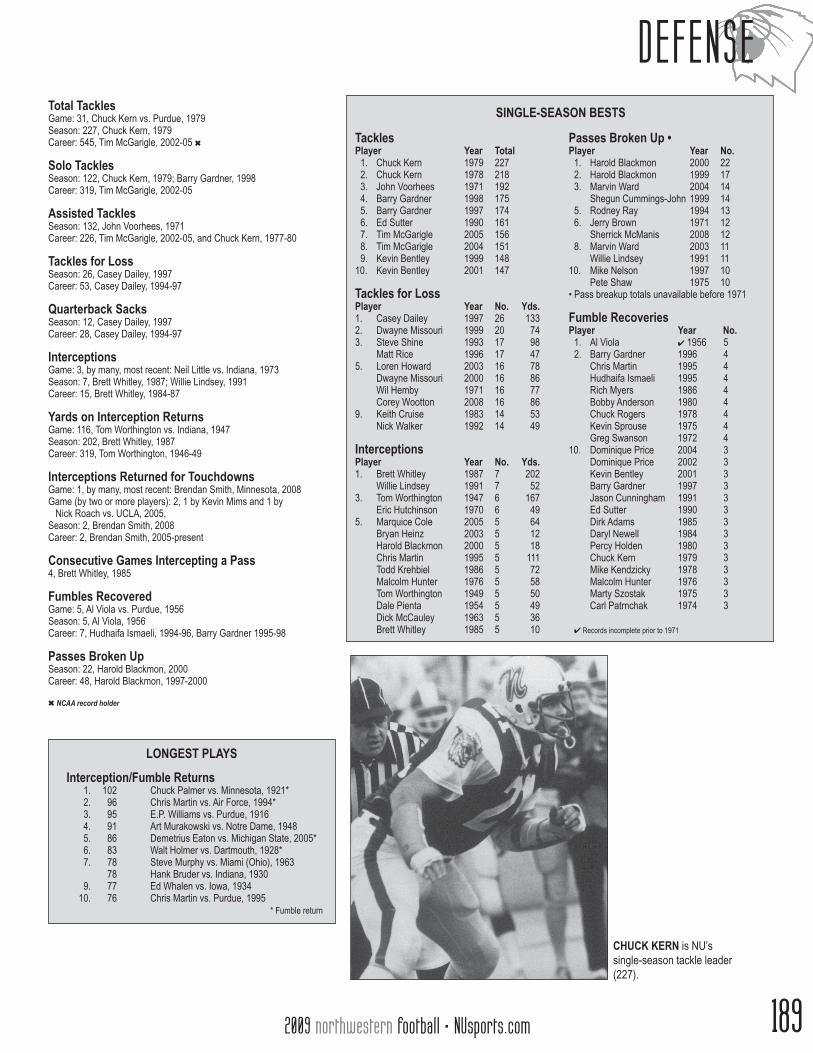
Total TacklesGame: 31, Chuck Kern vs. Purdue, 1979Season: 227, Chuck Kern, 1979Career: 545, Tim McGarigle, 2002-05 6
Solo TacklesSeason: 122, Chuck Kern, 1979; Barry Gardner, 1998Career: 319, Tim McGarigle, 2002-05
assisted TacklesSeason: 132, John Voorhees, 1971Career: 226, Tim McGarigle, 2002-05, and Chuck Kern, 1977-80
Tackles for lossSeason: 26, Casey Dailey, 1997Career: 53, Casey Dailey, 1994-97
Quarterback SacksSeason: 12, Casey Dailey, 1997Career: 28, Casey Dailey, 1994-97
InterceptionsGame: 3, by many, most recent: Neil Little vs. Indiana, 1973Season: 7, Brett Whitley, 1987; Willie Lindsey, 1991Career: 15, Brett Whitley, 1984-87
Yards on Interception ReturnsGame: 116, Tom Worthington vs. Indiana, 1947Season: 202, Brett Whitley, 1987Career: 319, Tom Worthington, 1946-49
Interceptions Returned for TouchdownsGame: 1, by many, most recent: Brendan Smith, Minnesota, 2008 Game (by two or more players): 2, 1 by Kevin Mims and 1 by Nick roach vs. UCLA, 2005,Season: 2, Brendan Smith, 2008Career: 2, Brendan Smith, 2005-present
Consecutive Games Intercepting a Pass4, Brett Whitley, 1985
Fumbles RecoveredGame: 5, Al Viola vs. Purdue, 1956Season: 5, Al Viola, 1956Career: 7, Hudhaifa Ismaeli, 1994-96, Barry Gardner 1995-98
Passes Broken upSeason: 22, Harold Blackmon, 2000Career: 48, Harold Blackmon, 1997-2000
6 NCAA record holder
lONGeST PlaYS
Interception/Fumble Returns 1. 102 Chuck Palmer vs. Minnesota, 1921* 2. 96 Chris Martin vs. Air Force, 1994* 3. 95 e.P. Williams vs. Purdue, 1916 4. 91 Art Murakowski vs. Notre Dame, 1948 5. 86 Demetrius eaton vs. Michigan State, 2005* 6. 83 Walt Holmer vs. Dartmouth, 1928* 7. 78 Steve Murphy vs. Miami (Ohio), 1963 78 Hank Bruder vs. Indiana, 1930 9. 77 ed Whalen vs. Iowa, 1934 10. 76 Chris Martin vs. Purdue, 1995
* Fumble return
TacklesPlayer Year Total 1. Chuck Kern 1979 227 2. Chuck Kern 1978 218 3. John Voorhees 1971 192 4. Barry Gardner 1998 175 5. Barry Gardner 1997 174 6. ed Sutter 1990 161 7. Tim McGarigle 2005 156 8. Tim McGarigle 2004 151 9. Kevin Bentley 1999 14810. Kevin Bentley 2001 147
Tackles for lossPlayer Year No. Yds.1. Casey Dailey 1997 26 1332. Dwayne Missouri 1999 20 743. Steve Shine 1993 17 98 Matt rice 1996 17 475. Loren Howard 2003 16 78 Dwayne Missouri 2000 16 86 Wil Hemby 1971 16 77 Corey Wootton 2008 16 86 9. Keith Cruise 1983 14 53 Nick Walker 1992 14 49
InterceptionsPlayer Year No. Yds. 1. Brett Whitley 1987 7 202 Willie Lindsey 1991 7 523. Tom Worthington 1947 6 167 eric Hutchinson 1970 6 49 5. Marquice Cole 2005 5 64 Bryan Heinz 2003 5 12 Harold Blackmon 2000 5 18 Chris Martin 1995 5 111 Todd Krehbiel 1986 5 72 Malcolm Hunter 1976 5 58 Tom Worthington 1949 5 50 Dale Pienta 1954 5 49 Dick McCauley 1963 5 36 Brett Whitley 1985 5 10
Passes Broken Up •Player Year No. 1. Harold Blackmon 2000 22 2. Harold Blackmon 1999 17 3. Marvin Ward 2004 14 Shegun Cummings-John 1999 14 5. rodney ray 1994 13 6. Jerry Brown 1971 12 Sherrick McManis 2008 12 8. Marvin Ward 2003 11 Willie Lindsey 1991 1110. Mike Nelson 1997 10 Pete Shaw 1975 10 • Pass breakup totals unavailable before 1971
Fumble RecoveriesPlayer Year No. 1. Al Viola 4 1956 5 2. Barry Gardner 1996 4 Chris Martin 1995 4 Hudhaifa Ismaeli 1995 4 rich Myers 1986 4 Bobby Anderson 1980 4 Chuck rogers 1978 4 Kevin Sprouse 1975 4 Greg Swanson 1972 410. Dominique Price 2004 3 Dominique Price 2002 3 Kevin Bentley 2001 3 Barry Gardner 1997 3 Jason Cunningham 1991 3 ed Sutter 1990 3 Dirk Adams 1985 3 Daryl Newell 1984 3 Percy Holden 1980 3 Chuck Kern 1979 3 Mike Kendzicky 1978 3 Malcolm Hunter 1976 3 Marty Szostak 1975 3 Carl Patrnchak 1974 3 4 records incomplete prior to 1971
SINGle-SeaSON BeSTS
ChuCK KeRN is NU’s single-season tackle leader (227).
D E F E N S E

2009 northwestern footbal l • NUsports.com190 2009 northwestern footbal l • NUsports.com 2009 northwestern footbal l • NUsports.com
CaReeR TaCKle leadeRSYeAr-BY-YeAr LOOK AT NU’S TOP 10
CaReeR TaCKle-FOR-lOSS leadeRSYeAr-BY-YeAr LOOK AT NU’S TOP 10
1. Tim McGarigle................................545Year Solo Asst. Tack.2002 50 48 982003 86 54 1402004 102 49 1512005 81 75 156Totals 319 226 545
2. Chuck Kern...................................503Year Solo Asst. Tack.1977 5 2 71978 121 97 218 1979 122 105 2271980 29 22 51Totals 277 226 503
3. Barry Gardner...............................468Year Solo Asst. Tack.1995 9 4 131996 68 38 106 1997 112 62 1741998 122 53 175Totals 311 157 468
4. ed Sutter.......................................429Year Solo Asst. Tack.1988 25 25 501989 35 58 931990 85 76 1611991 62 63 125Totals 207 222 429
5. William Bennett............................418Year Solo Asst. Tack.1992 45 55 1001993 70 46 1161994 72 28 1001995 57 45 102Totals 244 174 418
6. Kevin Bentley................................390Year Solo Asst. Tack.1998 4 5 91999 91 57 1482000 53 33 862001 82 65 147Totals 230 160 390
7. Paul Maly.......................................343Year Solo Asst. Tack.1973 35 36 711975 43 32 751976 54 55 1091977 52 36 88Totals 184 159 343
8. eric Collier....................................342Year Solo Asst. Tack.1994 12 6 181995 53 47 1001996 55 52 1071997 61 56 117Totals 181 161 342
9. Napoleon harris...........................334Year Solo Asst. Tack.1998 18 13 311999 57 53 1102000 66 49 1152001 45 33 78Totals 186 148 334
10. Thomas homco.........................333Year Solo Asst. Tack.1988 44 27 711989 60 64 1241990 35 30 651991 41 32 73Totals 180 153 333
1. Casey daileyYear TFL Yds1994 4 181995 12 761996 11 471997 26 133Totals 53 274
2. dwayne MissouriYear TFL Yds1997 2 81998 7 221999 20 742000 16 86Totals 45 190
3. Matt RiceYear TFL Yds1993 1 21994 13 391995 11 581996 17 49Totals 42 148
4. Keith CruiseYear TFL Yds1981 4 141982 7 271983 14 531984 12 52Totals 37 146
5. Steve ShineYear TFL Yds1990 3 231991 2 61992 12 591993 17 98Totals 34 186
5. Kevin BentleyYear TFL Yds1998 1 51999 10 392000 11 562001 12 33Totals 34 133
5. loren howardYear TFL Yds2002 13.5 332003 16 782004 4.5 30Totals 34 141
8. Corey WoottonYear TFL Yds2006 9 322007 7 162008 16 86Total 32 134
9. Mike GuendlingYear TFL Yds1980 4 241981 4 111982 13 581983 8 54Total 29 147
9. Napoleon harrisYear TFL Yds1998 2 51999 5 332000 13 602001 9 33Totals 29 131
CaReeR deFeNSIVe leadeRSPASS BREAKUPS • fUmBlE REcovERiES
Pass Breakups • Player Years No.1. Harold Blackmon 1997-00 482. Marvin Ward 2001-04 403. raheem Covington 1998-02 244. Sherrick McManis 2006-08 23 rodney ray 1991-95 236. Brett Whitley 1984-87 227. Pete Shaw 1972-76 218. Napoleon Harris 1998-01 189. William Bennett 1992-95 16 Dwight James 1988-91 16 Terry Thomas 1987-90 16 roosevelt Groves 1979-82 16 • Pass breakup totals unavailable before 1971
Fumble Recoveries • Player Years No.1. Kevin Bentley 1998-01 7 Barry Gardner 1995-98 7 Hudhaifa Ismaeli 1994-96 73. Dominique Price 2001-04 6 Daryl Newell 1982-85 6 Chris Martin 1992-95 66. Steve Ostrowski 1990-93 5 Greg Gill 1989-92 5 ed Sutter 1988-91 5 Dirk Adams 1984-88 5 Bobby Anderson 1979-82 5 Scott Duncan 1975-78 5 Kevin Sprouse 1973-76 5 Carl Patrnchak 1973-74 5 rob Mason 1972-74 5 Al Viola 1955-57 5 • fumble recovery totals unavailable before 1971
KeVIN BeNTleY
D E F E N S E
2009 northwestern footbal l • NUsports.com2009 northwestern footbal l • NUsports.com 2009 northwestern footbal l • NUsports.com 191
YeaR-BY-YeaR INTeRCePTION leadeRS
Year Player No. Yds. avg.1946 Vic Schwall 2 36 18.01947 Tom Worthington 6 167 27.81948 Dick Flowers 4 53 13.31949 Tom Worthington 5 50 10.01950 Charles Bennett 3 45 15.01951 Walter Jones 4 47 11.81952 Walter Jones 2 42 21.01953 Gerald Weber 3 27 9.01954 Dale Pienta 5 49 9.81955 Jim Thompson 1 71 71.01956 ed Quinn 3 36 12.01957 ron Burton 2 48 24.01958 Dick Thornton 3 99 33.01959 Larry Wood 3 14 4.71960 Larry Wood 3 30 10.01961 Larry Onesti 3 47 15.71962 Dick McCauley 2 12 6.01963 Dick McCauley 5 36 7.21964 Phil Clark 2 30 15.01965 Phil Clark 2 60 30.01966 Phil Clark 2 66 33.01967 Harold Daniels 2 1 0.51968 rich Field 2 23 11.51969 Gary Holland 3 34 11.31970 eric Hutchinson 6 49 8.21971 eric Hutchinson 3 77 25.71972 Greg Swanson 3 15 5.01973 Neil Little 4 38 9.51974 Malcolm Hunter 4 62 15.51975 Pete Shaw 2 54 27.01976 Malcolm Hunter 5 58 11.61977 Steve Bobowski 3 30 10.01978 Pat Geegan 3 33 11.01979 Bobby Anderson 2 19 9.51980 Bobby Anderson 4 24 6.01981 J. Gatewood 2 0 0.0 Scott Sanderson 2 0 0.01982 rich raffin 2 31 15.51983 Charles Plant 3 78 26.01984 ellery Bennett 2 40 20.01985 Brett Whitley 5 10 2.01986 Todd Krehbiel 5 72 14.41987 Brett Whitley 7 202 28.91988 Kevin Peterson 1 30 30.01989 Dwight James 4 66 16.51990 Pat New 2 23 11.51991 Willie Lindsey 7 52 7.41992 Greg Gill 4 28 7.01993 rodney ray 3 15 5.01994 William Bennett 3 0 0.01995 Chris Martin 5 111 22.21996 Josh Barnes 3 0 0.01997 Barry Gardner 2 17 8.5 Josh Barnes 2 0 0.01998 Mike Nelson 3 0 0.01999 Harold Blackmon 2 75 37.52000 Harold Blackmon 5 18 3.62001 Jarvis Adams 2 51 25.5 Dominique Price 2 17 8.5 Billy Silva 2 5 2.5 raheem Covington 2 0 0.02002 raheem Covington 4 17 4.32003 Bryan Heinz 5 12 2.42004 Marvin Ward 3 17 5.72005 Marquice Cole 5 64 12.82006 Brendan Smith 3 82 27.32007 Nine players with 1 each2008 Jordan Mabin 3 4 1.3 Brad Phillips 3 4 1.3
CaReeR SaCK leadeRSYeAr-BY-YeAr LOOK AT NU’S TOP 15
1. Casey daileyYear Sacks Yds1994 2 141995 6 511996 8 441997 12 100Totals 28 209
2. Steve ShineYear Sacks Yds1990 3 231991 0 01992 11 581993 7 55Totals 21 136
3. dwayne MissouriYear Sacks Yds1997 0 01998 3 151999 5 392000 9 62Totals 17 116
4. Corey WoottonYear Sacks Yds2006 4.5 132007 1 52008 10 64Totals 15.5 82
4. Matt RiceYear Sacks Yds1993 0 01994 3 231995 6 461996 3 20Totals 12 89
5. loren howardYear Sacks Yds2002 0 02003 8 462004 3 27Totals 11 73
5. J. CunninghamYear Sacks Yds1989 1 31990 2 131991 6 751992 2 11Totals 11 102
7. Keith lozowskiYear Sacks Yds1994 2 201995 1 81996 4 361997 3 18Totals 10 82
8. John BroekerYear Sacks Yds1987 0 0 1988 4 NA1989 1 31990 4 38Totals 9 Na
8. Thor SchmidtYear Sacks Yds1995 0 01996 1 31997 2 141998 6 35Totals 9 52
8. Nick RoachYear Sacks Yds2003 1 122004 5 252005 1 52006 2 17Totals 9 49
11. Napoleon harrisYear Sacks Yds1998 0 01999 3 272000 2.5 252001 2.5 16Totals 8 68
11. Javiar CollinsYear Sacks Yds1997 0 01998 1 81999 4 212000 3 11Totals 8 40
11. hudhaifa IsmaeliYear Sacks Yds1994 0 01995 7 501996 1 5Totals 8 55
11. Thomas homcoYear Sacks Yds1988 1 NA1989 0 01990 0 01991 7 51Totals 8 Na
11. Frank BoudreauxYear Sacks Yds1989 0 01990 2 141991 2 171992 4 22Totals 8 53
CaReeR INTeRCePTION leadeRSYeAr-BY-YeAr LOOK AT NU’S TOP 10
4. harold BlackmonYear Int.1997......................11998......................21999......................22000......................5Total....................10
4. eric hutchinsonYear Int.1969......................11970......................61971......................3Total....................10
6. Willie lindseyYear Int.1989......................01990......................11991......................71992......................1Total......................9
7. Bobby andersonYear Int.1979......................21980......................41981......................11982......................1Total......................8
7. dick McCauleyYear Int.1962......................21963......................51964......................1Total......................8
9. Marquice ColeYear Int.2002......................0 2003......................02005......................52006......................2Total......................7
9. Bryan heinzYear Int.2003......................52004......................12005......................1Total......................7
9. Marvin WardYear Int.2001......................02002......................02003......................42004......................3Total......................7
9. Raheem CovingtonYear Int.1999.....................02000.....................12001.....................22002.....................4Total.....................7
9. Walter JonesYear Int.1950......................11951......................41952......................2Total......................7
9. dale PientaYear Int.1954......................51955......................11956......................1Total......................7
9. Brendan SmithYear Int.2005......................22006......................32007......................02008......................2Total......................7
1. Brett WhitleyYear Int.1984...................01985...................51986...................31987...................7Total.................15
2. Tom Worthing-tonYear Int.1946...................01947...................61948...................31949...................5Total.................14
3. Malcolm hunterYear Int.1974...................41975...................01976...................5
D E F E N S E
2009 northwestern footbal l • NUsports.com192 2009 northwestern footbal l • NUsports.com 2009 northwestern footbal l • NUsports.com
TOTal OFFeNSePass-Rush PlaysGame: 106 vs. Purdue, 1989Season: 992, 2000
Yards GainedGame: 674 vs. Wisconsin, 2005Season: 6,004, 2005
average Yards Per GameSeason: 500.3, 2005
average Yards Per PlayGame: 8.3 vs. Wisconsin, 2005Season: 6.2, 2005
RuShINGattemptsGame: 77 vs. Indiana, 1975; vs. Minnesota, 1970; vs. Iowa, 1965Season: 603, 2000
Yards GainedGame: 478 vs. Boston College, 1961Season: 3,062, 2000
average Gain Per RushGame: 8.1 vs. Iowa State, 1953Season: 5.1, 2000Season: (Per Game) 255.2, 2000
Players Gaining 100 Yards Game: 2, many times, most recent: vs. Illinois, 2003
TouchdownsGame: 8 vs. Illinois, 2000Season: 37, 2000
PaSSINGattemptsGame: 71 vs. Michigan, 1982Season: 529, 2007
Fewest Passes attemptedGame: 1 vs. Minnesota, 1956
Passes attempted Without InterceptionGame: 58 vs. Purdue, 1989; and vs. Minnesota, 2007
CompletionsGame: 45 vs. Michigan, 1982Season: 320, 2005
Passing YardsGame: 520 vs. Michigan State, 2007Season: 3,695, 2007
TouchdownsGame: 5 vs. Minnesota, 1973; and vs. Michigan State, 2007Season: 22, 2005
had Intercepted (Most)Game: 7 vs. Notre Dame, 1971Season: 29, 1971
average YardsSeason: (per completion)(minimum 100 comp.) 15.5, 1976(minimum 175 comp.) 12.8, 1975(minimum 225 comp.) 11.8, 1982Season: (per game) 307.9, 2007
Completion PercentageGame: (minimum 20 comp.) 80.6 vs. Illinois, 2005 (25 of 31) Season: 62.5, 2005 (320 of 512)
Passing efficiency Rating Season: 133.56, 2005
PuNTINGPuntsGame: 13 vs. Ohio State, 1998Season: 87, 1978
Fewest PuntsGame: 0 vs. Illinois, 1962Season: 47, 1996
average Per PuntGame: (minimum 5 punts) 56.6 vs. Air Force, 1994; vs. Indiana, 1995Game: (minimum 10 punts) 47.5 vs. Illinois, 1990Season: 45.3, 1982
Opponents Punts BlockedGame: 3 vs. Indiana, 1933
PuNT ReTuRNSReturnsGame: 9 vs. Minnesota, 1950
YardsGame: 148 vs. Minnesota, 1950Season: 418, 1995
average Per ReturnGame: (minimum 5 returns) 17.2 vs Northern Illinois, 1982Season: (minimum 15 returns) 21.8, 1992
Touchdowns Season: 1, many times, most recent: vs. Northern Illinois, 2005
KICKOFF ReTuRNSReturnsGame: 12 vs. Michigan State, 1989Season: 85, 1981 (11 games)
YardsGame: 270 vs. TCU, 2002Season: 1,229, 2002 (12 games)
average Per ReturnGame: (minimum 3 returns) 43.0 vs. Boston College, 1993Season: 24.1 yards, 2002 (12 games)
Touchdowns Game: 1, many times, most recent: vs. Ohio State, 2007
SCORINGPointsGame: 61 vs Illinois, 2000; 97 vs. oshkosh Normal, 1904 •Season: 441, 2000 (12 games)
Points per GameSeason: 36.8, 2000
largest Scoring MarginSeason: 25.7, 1904
Points Scored, Both TeamsGame: 105 vs. Michigan, 2000
Points Scored by an OpponentGame: 78 vs. Iowa, 1913
TouchdownsGame: (since 1946) 9 vs. Illinois, 2000Season: 58 in 2000 (12 games)
Field GoalsGame: 5 vs. Penn State, 2005Season: 20 in 1995 & 2008
PaTsGame: 7, many times, most recent: vs. Navy, 2002Season: 50 in 2000 (12 games)
Consecutive extra PointsSeason: 47, 2000
2-Point attempts MadeGame: 2 vs. Wisconsin, 1999; vs. Iowa, 1989; vs. Minnesota, 1972; vs. Michigan, 1958
First downsGame: 36 vs. Illinois, 2005Season: 328, 2005 (12 games); 273, 2001 (11 games)
First downs, Both TeamsGame: 64 vs. Bowling Green, 2001
First downs Per GameSeason: 27.3, 2005
First downs RushingGame: 26 vs. Illinois, 2003Season: 146, 2003 (13 games)
First downs PassingGame: 24 vs. Purdue, 2005Season: 175, 2007 (12 games)
Fewest First downsGame: 0 vs. DePauw, 1944Season: 103, 1960 (9 games)
FuMBleSFumblesGame: 10 vs. Southern California, 1954Season: 50, 1947 (9 games)
Fumbles lostGame: 6 vs. Wisconsin, 1956; vs. Illinois, 1954; vs. SouthernCalifornia, 1954; vs. rice, 1991Season: 24, 1977 (11 games)
Fewest Fumbles lostSeason: 2, 2004
Opponent FumblesGame: 7, vs. Wyoming, 1979 Season: 48, 1979 (11 games)
Opponent Fumbles RecoveredGame: 5 vs. Wisconsin, 1995Season: 23, 1972 (11 games); 1979 (11 games)
PeNalTIeSPenaltiesGame: 16 vs. Duke, 2002Season: 112, 2000 (12 games)
Penalties, Both TeamsGame: 24 vs. Purdue, 1989; vs. Pittsburgh, 1950
Yards PenalizedGame: 146 vs. Duke, 2002Season: 960, 2000 (12 games)
Opponent PenaltiesSeason: 86, 1996 (12 games)
Opponent Penalty YardsSeason: 758, 1991 (11 games)
TuRNOVeRSTurnoversGame: 9 vs. Notre Dame, 1971Season: 43, 1977
Fewest TurnoversSeason: 11, 2004
Total Plays Without a TurnoverGame: 103 vs. Illinois, 2000
Turnovers, Both TeamsGame: 15 vs. Wisconsin, 1956
T E A M O F F E N S E
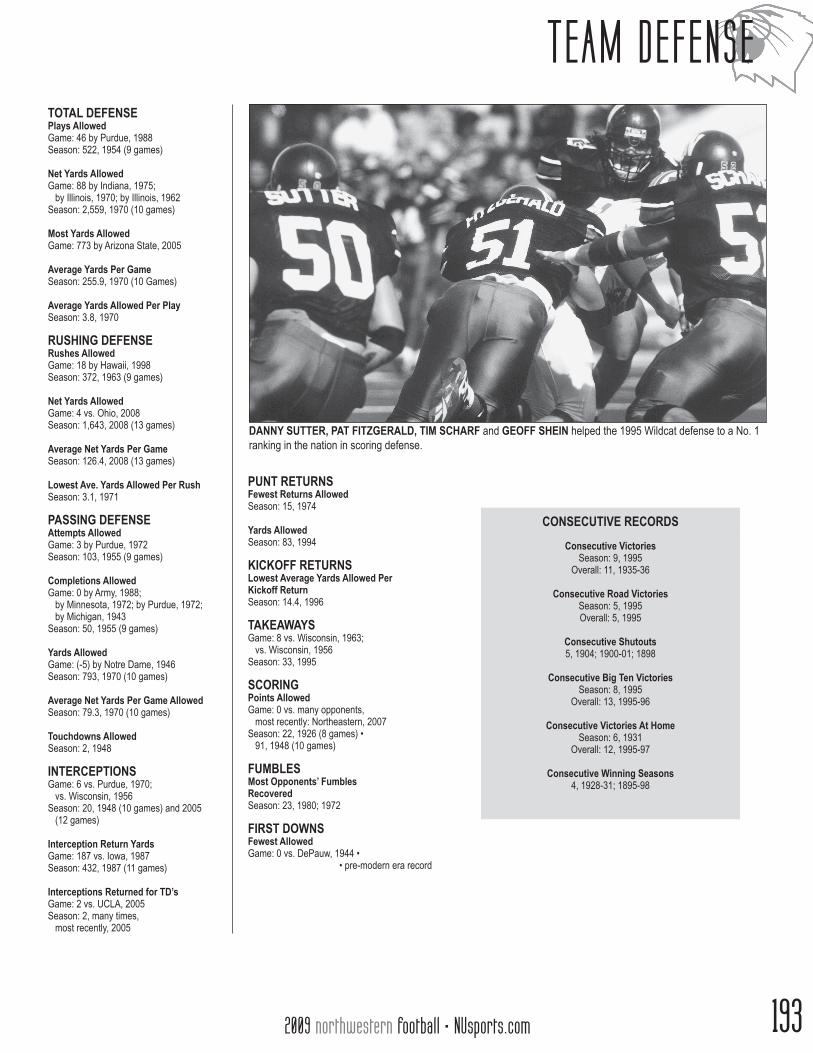
2009 northwestern footbal l • NUsports.com2009 northwestern footbal l • NUsports.com 2009 northwestern footbal l • NUsports.com 193
TOTal deFeNSePlays allowedGame: 46 by Purdue, 1988Season: 522, 1954 (9 games)
Net Yards allowedGame: 88 by Indiana, 1975; by Illinois, 1970; by Illinois, 1962Season: 2,559, 1970 (10 games)
Most Yards allowedGame: 773 by Arizona State, 2005
average Yards Per GameSeason: 255.9, 1970 (10 Games)
average Yards allowed Per PlaySeason: 3.8, 1970
RuShING deFeNSeRushes allowedGame: 18 by Hawaii, 1998Season: 372, 1963 (9 games)
Net Yards allowedGame: 4 vs. Ohio, 2008Season: 1,643, 2008 (13 games)
average Net Yards Per GameSeason: 126.4, 2008 (13 games)
lowest ave. Yards allowed Per RushSeason: 3.1, 1971
PaSSING deFeNSeattempts allowedGame: 3 by Purdue, 1972Season: 103, 1955 (9 games)
Completions allowedGame: 0 by Army, 1988; by Minnesota, 1972; by Purdue, 1972; by Michigan, 1943Season: 50, 1955 (9 games)
Yards allowedGame: (-5) by Notre Dame, 1946Season: 793, 1970 (10 games)
average Net Yards Per Game allowedSeason: 79.3, 1970 (10 games)
Touchdowns allowedSeason: 2, 1948
INTeRCePTIONSGame: 6 vs. Purdue, 1970; vs. Wisconsin, 1956Season: 20, 1948 (10 games) and 2005 (12 games)
Interception Return YardsGame: 187 vs. Iowa, 1987Season: 432, 1987 (11 games)
Interceptions Returned for Td’sGame: 2 vs. UCLA, 2005Season: 2, many times, most recently, 2005
PuNT ReTuRNSFewest Returns allowedSeason: 15, 1974
Yards allowedSeason: 83, 1994
KICKOFF ReTuRNSlowest average Yards allowed Per Kickoff ReturnSeason: 14.4, 1996
TaKeaWaYSGame: 8 vs. Wisconsin, 1963; vs. Wisconsin, 1956Season: 33, 1995
SCORING Points allowedGame: 0 vs. many opponents, most recently: Northeastern, 2007Season: 22, 1926 (8 games) • 91, 1948 (10 games)
FuMBleSMost Opponents’ Fumbles RecoveredSeason: 23, 1980; 1972
FIRST dOWNSFewest allowedGame: 0 vs. DePauw, 1944 •
• pre-modern era record
daNNY SuTTeR, PaT FITZGeRald, TIM SChaRF and GeOFF SheIN helped the 1995 Wildcat defense to a No. 1 ranking in the nation in scoring defense.
Consecutive VictoriesSeason: 9, 1995
Overall: 11, 1935-36
Consecutive Road VictoriesSeason: 5, 1995Overall: 5, 1995
Consecutive Shutouts5, 1904; 1900-01; 1898
Consecutive Big Ten VictoriesSeason: 8, 1995
Overall: 13, 1995-96
Consecutive Victories at homeSeason: 6, 1931
Overall: 12, 1995-97
Consecutive Winning Seasons4, 1928-31; 1895-98
CONSeCuTIVe ReCORdS
T E A M D E F E N S E


