Embed Size (px)
Citation preview
Recording and ATP Simulation of Ferroresonance Phenomenon in an SVC of Mexican Electrical
System
E. Godoy A. and E. Martinez M.
Abstract—The Mexican Electrical System has a lot of Static Var
Compensators (SVC) distributed in the three main CFE (for its
initials in Spanish; Federal Electricity Commission) systems. Four
SVCs are located in the 400 kV ring and one in the 230 kV network
in the metropolitan area of Mexico City. This SVC-230 kV is located
in the Cerro Gordo substation and is a fundamental part in
supporting the local voltage requirements of the industrial and
commercial area. The Cerro Gordo (CRG) substation has nine
interconnecting transmission lines, two transformers of 230/85 kV,
two transformers of 230/23 kV, and SVC with capacity of 75
inductive and 300 capacitive Mvar. All elements of the substation are
connected in one and a half breaker configuration, except the SVC,
which is connected in a double breaker arrangement. On June 17,
2013, at 7:46 pm, when it was necessary to de-energize the SVC to
modernize its services, workers proceeded to open the switch
connected to BUS 2 without problems. Later, when opening the
breaker to BUS 1, only the poles of phases "A" and "B" were opened,
while the "C" phase remained closed, causing explosion of surge
arresters of "A" and "B" phases, producing a series of cascading
failures that led to the destruction of the 7th harmonic filter and other
damage to the peripheral SVC equipment. Through ATP simulations
it was possible to reproduce the events and determine the cause of the
surge that occurred in the 230 kV bus, calculating that the energy
dissipation capacity exceeded the arrester and verifying the presence
of the ferroresonance phenomenon, , which caused the explosion of
the "A" and "B" phases. In addition, this document is supported with
videos of the explosion through synchronized PMUs recordings,
power quality recorders and registers, which were reproduced in the
ATP simulator to determine the cause of the failure and the corrective
and preventive actions taken, including modifications in the
operating logic of breaker failure (50BF) protection.
Keywords: Static Var Compensator SVC, ferroresonance,
Alternative Transient Program ATP, surger arrester, Phasor
Measurement Unit PMU, Wide Area Measurement System WAMS.
I. INTRODUCTION
he Mexican Electric System consists of three electric
systems operating independently. The National Grid is the
most complex system, as it integrates the power grids of
Elizabeth Godoy A. Comisión Federal de Electricidad, Subdirección de
Transmisión. Don Manuelito N°32 Col. Olivar de los Padres, México, D. F.,
México ([email protected] ).
Enrique Martínez M. Comisión Federal de Electricidad, Subdirección de
Transmisión. Don Manuelito N°32 Col. Olivar de los Padres, México, D. F.,
México ([email protected] ).
Paper submitted to the International Conference on Power Systems
Transients (IPST2015) in Cavtat, Croatia June 15-18, 2015
Mexico and Central America, the load that feeds without
Central America is of 40 GW, the backbone of this network is
composed of 400 and 230 kV lines. The second is the Baja
California Norte Electric System, it feeds a load of 2000 MW
and exchanges energy with the US and Canada. The third is
the Baja California Sur Electric System with a load of
approximately 300 MW (see Fig. 1).
In all three electrical systems, until 2014, 23 SVC with a total
capacity of 2830 Mvar inductive and 4840 Mvar capacitive
were installed.
Fig. 1 Mexican Electric System
II. LOCATION AND DESCRIPTION OF THE CERRO
GORDO (CRG) SUBSTATION
The metropolitan area of Mexico City has a 25% load of the
national grid, the grid of this zone is formed by a double ring
of 400 kV and 230 kV. To maintain it permanently integrated
with controlled voltages at different system demand
conditions, it was necessary to reinforce the network with
capacitor banks at levels of low and medium voltage, as well
as with Static Var Compensators in ring 400 and 230 kV. The
metropolitan area of Mexico City has 5 SVC with a total
capacity of 645 Mvar inductive and 1500 Mvar capacitive.
The only SVC in the 230 kV grid in this zone is the CRG
substation.
T
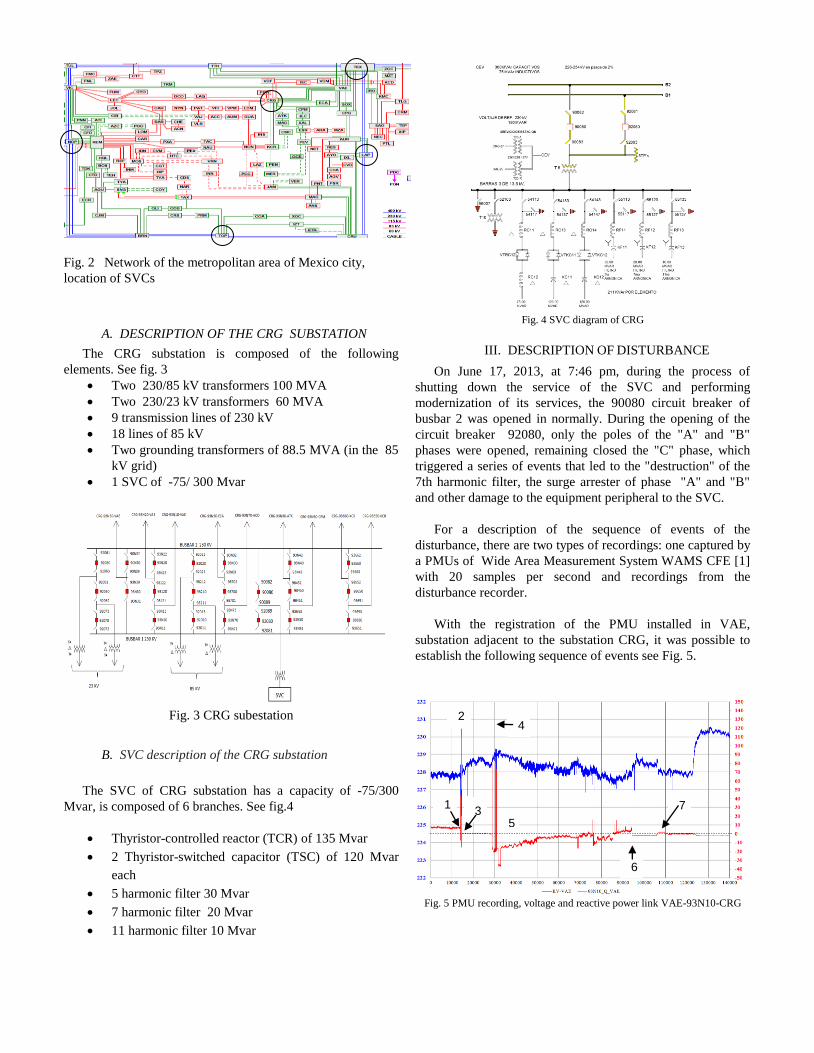
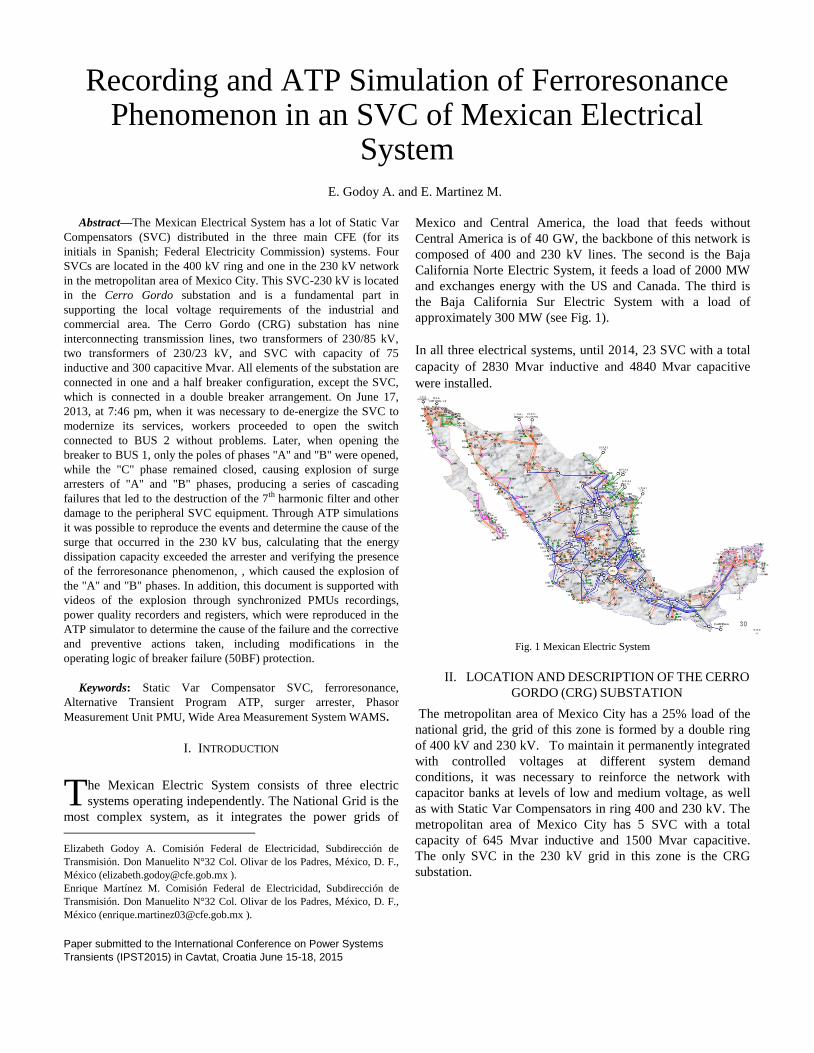
Fig. 2 Network of the metropolitan area of Mexico city,
location of SVCs
A. DESCRIPTION OF THE CRG SUBSTATION
The CRG substation is composed of the following
elements. See fig. 3
Two 230/85 kV transformers 100 MVA
Two 230/23 kV transformers 60 MVA
9 transmission lines of 230 kV
18 lines of 85 kV
Two grounding transformers of 88.5 MVA (in the 85
kV grid)
1 SVC of -75/ 300 Mvar
Fig. 3 CRG subestation
B. SVC description of the CRG substation
The SVC of CRG substation has a capacity of -75/300
Mvar, is composed of 6 branches. See fig.4
Thyristor-controlled reactor (TCR) of 135 Mvar
2 Thyristor-switched capacitor (TSC) of 120 Mvar
each
5 harmonic filter 30 Mvar
7 harmonic filter 20 Mvar
11 harmonic filter 10 Mvar
Fig. 4 SVC diagram of CRG
III. DESCRIPTION OF DISTURBANCE
On June 17, 2013, at 7:46 pm, during the process of
shutting down the service of the SVC and performing
modernization of its services, the 90080 circuit breaker of
busbar 2 was opened in normally. During the opening of the
circuit breaker 92080, only the poles of the "A" and "B"
phases were opened, remaining closed the "C" phase, which
triggered a series of events that led to the "destruction" of the
7th harmonic filter, the surge arrester of phase "A" and "B"
and other damage to the equipment peripheral to the SVC.
For a description of the sequence of events of the
disturbance, there are two types of recordings: one captured by
a PMUs of Wide Area Measurement System WAMS CFE [1]
with 20 samples per second and recordings from the
disturbance recorder.
With the registration of the PMU installed in VAE,
substation adjacent to the substation CRG, it was possible to
establish the following sequence of events see Fig. 5.
Fig. 5 PMU recording, voltage and reactive power link VAE-93N10-CRG
7
6
2 4
1 3
5
1. 07: 46: 24.1 h Opening operation of CRG-90080
2. 7:46:44 h Opening of CRG-90082 and substation failure by
explosion of surge arresters
3. 7:46:50 h Moment when the Substation had not potential for
the operation of backup protection
4.07:58:42 h Energization of CRG substation by transmission
line VAE-93N10-CRG.
5. 08:00:07 and 08:00:28 h Arcing in the low side of the SVC
6. 08:54:38 h Opening of switch under load and operation
differential protection of busbar 1
7. 09:05:02 h Restoration of substation CRG
Due to failures of the communication channel, the real
situation was unknown at the substation, hence, at 7:58 pm the
first attempt to restore substation CRG with the closing of the
VAE-93N10-CRG line was performed. By having in
operation the differential protection transformer with open
circuit breakers, it was concluded that there was a problem
with one of the SVC circuit breakers. It was erroneously
determined that the problem was with the CRG-90080 instead
of the 92080.
Due to the above, at 08:54 h opening of the switches 92081
was performed under load, because pole "c" was closed, with
the arcing to the metal structure, bus differential protection
operate, opening all circuit breakers of busbar 1.
At 9:05:02, finally CRG substation was energized through
busbar 2.
The disturbance recorder the SVC, in which the voltage was
monitored at high and low sides of the transformer as well as
currents in each of the branches, allowing reconstructing the
sequence of events from the opening operation of the circuit
breaker CRG-92080 until the busbars of 230 kV had no
potential. This part of the event was reproduced using the ATP
simulator.
IV. SEQUENCE OF EVENTS
The events identified in the recordings are shown in detail
in the graphs of Figures 1-6.
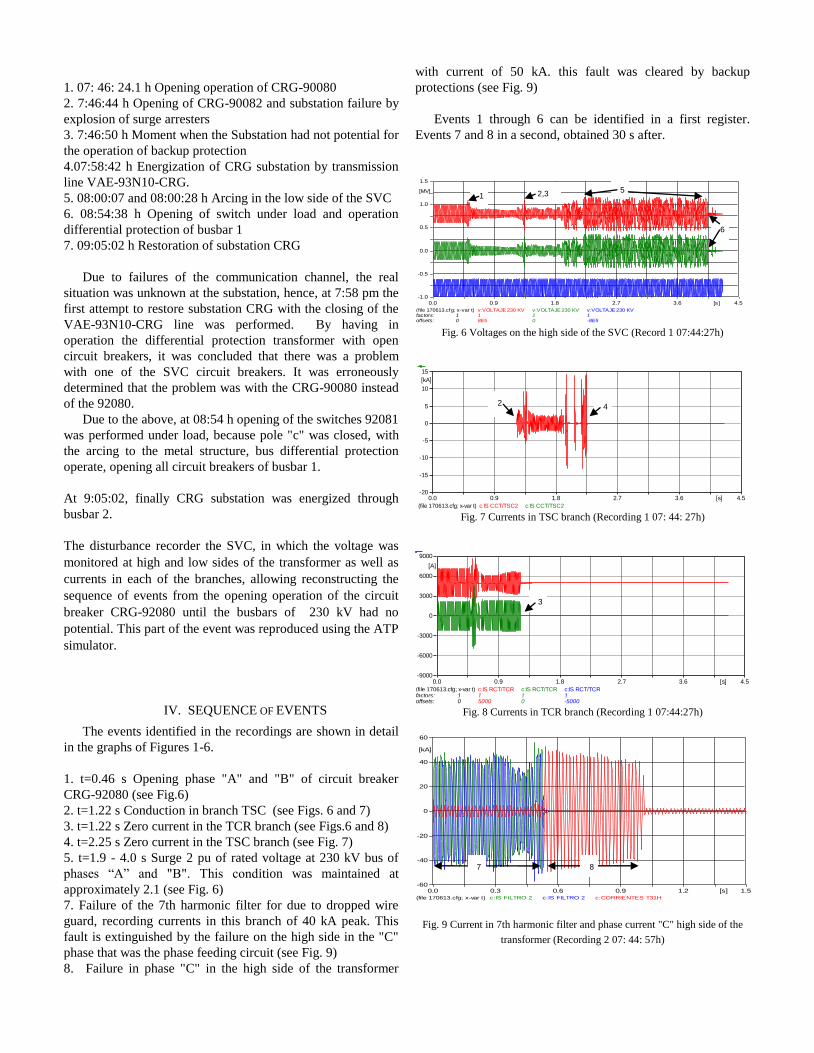
1. t=0.46 s Opening phase "A" and "B" of circuit breaker
CRG-92080 (see Fig.6)
2. t=1.22 s Conduction in branch TSC (see Figs. 6 and 7)
3. t=1.22 s Zero current in the TCR branch (see Figs.6 and 8)
4. t=2.25 s Zero current in the TSC branch (see Fig. 7)
5. t=1.9 - 4.0 s Surge 2 pu of rated voltage at 230 kV bus of
phases “A” and "B". This condition was maintained at
approximately 2.1 (see Fig. 6)
7. Failure of the 7th harmonic filter for due to dropped wire
guard, recording currents in this branch of 40 kA peak. This
fault is extinguished by the failure on the high side in the "C"
phase that was the phase feeding circuit (see Fig. 9)
8. Failure in phase "C" in the high side of the transformer
with current of 50 kA. this fault was cleared by backup
protections (see Fig. 9)
Events 1 through 6 can be identified in a first register.
Events 7 and 8 in a second, obtained 30 s after.
(f ile 170613.cfg; x-var t) factors:offsets:
10
v:VOLTAJE 230 KV 18E5
v:VOLTAJE 230 KV 10
v:VOLTAJE 230 KV 1-8E5
0.0 0.9 1.8 2.7 3.6 4.5[s]-1.0
-0.5
0.0
0.5
1.0
1.5
[MV]
Fig. 6 Voltages on the high side of the SVC (Record 1 07:44:27h)
(file 170613.cfg; x-var t) c:IS CCT/TSC2 c:IS CCT/TSC2
0.0 0.9 1.8 2.7 3.6 4.5[s]-20
-15
-10
-5
0
5
10
15
[kA]
Fig. 7 Currents in TSC branch (Recording 1 07: 44: 27h)
(file 170613.cfg; x-var t) factors:offsets:
10
c:IS RCT/TCR 15000
c:IS RCT/TCR 10
c:IS RCT/TCR 1-5000
0.0 0.9 1.8 2.7 3.6 4.5[s]-9000
-6000
-3000
0
3000
6000
9000
[A]
Fig. 8 Currents in TCR branch (Recording 1 07:44:27h)
(file 170613.cfg; x-var t) c:IS FILTRO 2 c:IS FILTRO 2 c:CORRIENTES T31H
0.0 0.3 0.6 0.9 1.2 1.5[s]-60
-40
-20
0
20
40
60
[kA]
Fig. 9 Current in 7th harmonic filter and phase current "C" high side of the
transformer (Recording 2 07: 44: 57h)
1 2,3 5
6
2 4
3
7 8
V. REPRODUCTION OF RECORDINGS IN THE ATP
SIMULATOR
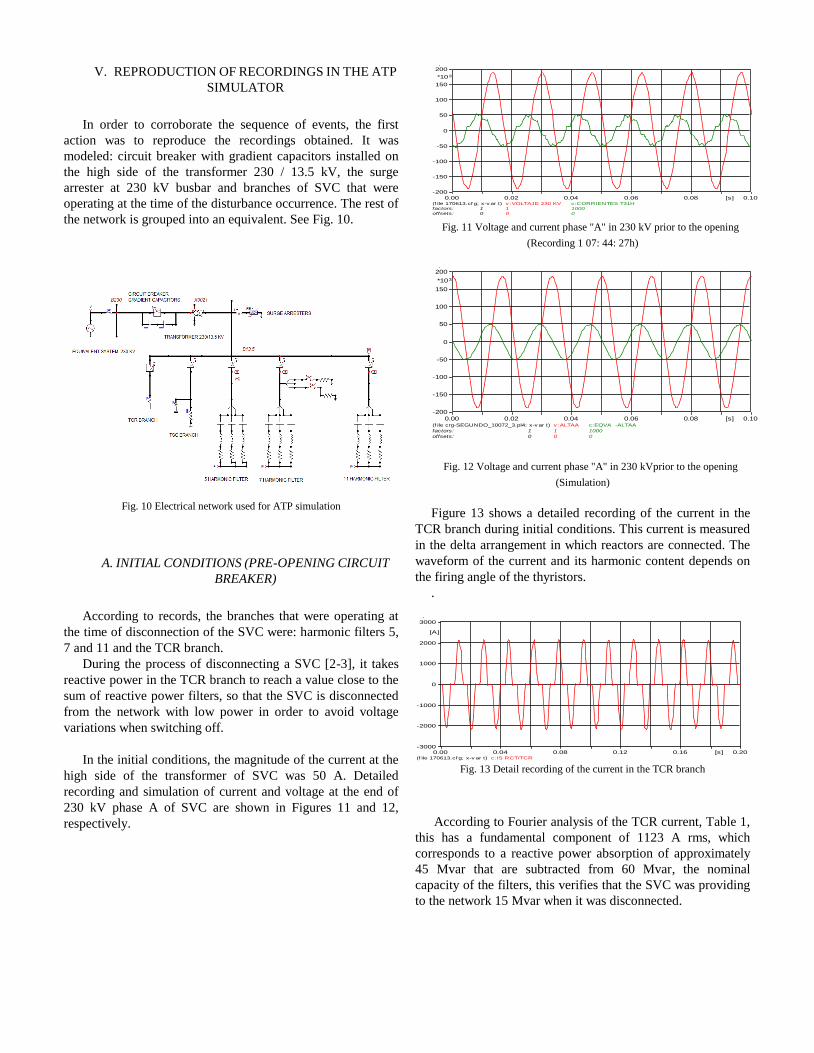
In order to corroborate the sequence of events, the first
action was to reproduce the recordings obtained. It was
modeled: circuit breaker with gradient capacitors installed on
the high side of the transformer 230 / 13.5 kV, the surge
arrester at 230 kV busbar and branches of SVC that were
operating at the time of the disturbance occurrence. The rest of
the network is grouped into an equivalent. See Fig. 10.
Fig. 10 Electrical network used for ATP simulation
A. INITIAL CONDITIONS (PRE-OPENING CIRCUIT
BREAKER)
According to records, the branches that were operating at
the time of disconnection of the SVC were: harmonic filters 5,
7 and 11 and the TCR branch.
During the process of disconnecting a SVC [2-3], it takes
reactive power in the TCR branch to reach a value close to the
sum of reactive power filters, so that the SVC is disconnected
from the network with low power in order to avoid voltage
variations when switching off.
In the initial conditions, the magnitude of the current at the
high side of the transformer of SVC was 50 A. Detailed
recording and simulation of current and voltage at the end of
230 kV phase A of SVC are shown in Figures 11 and 12,
respectively.
(f ile 170613.cf g; x-v ar t)
factors:
offsets:
1
0
v :VOLTAJE 230 KV
1
0
c:CORRIENTES T31H
1000
0
0.00 0.02 0.04 0.06 0.08 0.10[s]
-200
-150
-100
-50
0
50
100
150
200
*103
Fig. 11 Voltage and current phase "A" in 230 kV prior to the opening
(Recording 1 07: 44: 27h)
(f ile crg-SEGUNDO_10072_3.pl4; x-v ar t)
factors:
offsets:
1
0
v :ALTAA
1
0
c:EQVA -ALTAA
1000
0
0.00 0.02 0.04 0.06 0.08 0.10[s]
-200
-150
-100
-50
0
50
100
150
200
*103
Fig. 12 Voltage and current phase "A" in 230 kVprior to the opening
(Simulation)
Figure 13 shows a detailed recording of the current in the
TCR branch during initial conditions. This current is measured
in the delta arrangement in which reactors are connected. The
waveform of the current and its harmonic content depends on
the firing angle of the thyristors.
.
(f ile 170613.cf g; x-v ar t) c:IS RCT/TCR
0.00 0.04 0.08 0.12 0.16 0.20[s]-3000
-2000
-1000
0
1000
2000
3000
[A]
Fig. 13 Detail recording of the current in the TCR branch
According to Fourier analysis of the TCR current, Table 1,
this has a fundamental component of 1123 A rms, which
corresponds to a reactive power absorption of approximately
45 Mvar that are subtracted from 60 Mvar, the nominal
capacity of the filters, this verifies that the SVC was providing
to the network 15 Mvar when it was disconnected.
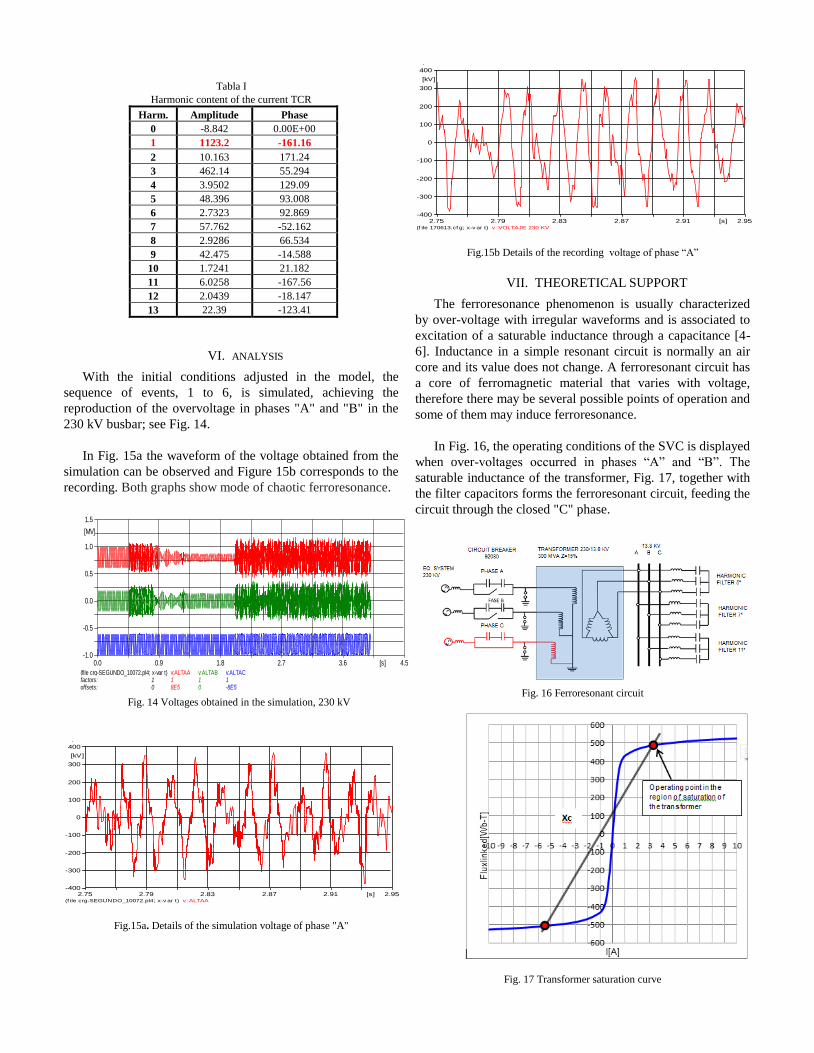
Tabla I
Harmonic content of the current TCR
Harm. Amplitude Phase
0 -8.842 0.00E+00
1 1123.2 -161.16
2 10.163 171.24
3 462.14 55.294
4 3.9502 129.09
5 48.396 93.008
6 2.7323 92.869
7 57.762 -52.162
8 2.9286 66.534
9 42.475 -14.588
10 1.7241 21.182
11 6.0258 -167.56
12 2.0439 -18.147
13 22.39 -123.41
VI. ANALYSIS
With the initial conditions adjusted in the model, the
sequence of events, 1 to 6, is simulated, achieving the
reproduction of the overvoltage in phases "A" and "B" in the
230 kV busbar; see Fig. 14.
In Fig. 15a the waveform of the voltage obtained from the
simulation can be observed and Figure 15b corresponds to the
recording. Both graphs show mode of chaotic ferroresonance.
(file crg-SEGUNDO_10072.pl4; x-var t) factors:offsets:
10
v:ALTAA 18E5
v:ALTAB 10
v:ALTAC 1-8E5
0.0 0.9 1.8 2.7 3.6 4.5[s]-1.0
-0.5
0.0
0.5
1.0
1.5
[MV]
Fig. 14 Voltages obtained in the simulation, 230 kV
(f ile crg-SEGUNDO_10072.pl4; x-v ar t) v :ALTAA
2.75 2.79 2.83 2.87 2.91 2.95[s]-400
-300
-200
-100
0
100
200
300
400
[kV]
Fig.15a. Details of the simulation voltage of phase "A"
(f ile 170613.cf g; x-v ar t) v :VOLTAJE 230 KV
2.75 2.79 2.83 2.87 2.91 2.95[s]-400
-300
-200
-100
0
100
200
300
400
[kV]
Fig.15b Details of the recording voltage of phase “A”
VII. THEORETICAL SUPPORT
The ferroresonance phenomenon is usually characterized
by over-voltage with irregular waveforms and is associated to
excitation of a saturable inductance through a capacitance [4-
6]. Inductance in a simple resonant circuit is normally an air
core and its value does not change. A ferroresonant circuit has
a core of ferromagnetic material that varies with voltage,
therefore there may be several possible points of operation and
some of them may induce ferroresonance.
In Fig. 16, the operating conditions of the SVC is displayed
when over-voltages occurred in phases “A” and “B”. The
saturable inductance of the transformer, Fig. 17, together with
the filter capacitors forms the ferroresonant circuit, feeding the
circuit through the closed "C" phase.
Fig. 16 Ferroresonant circuit
Fig. 17 Transformer saturation curve
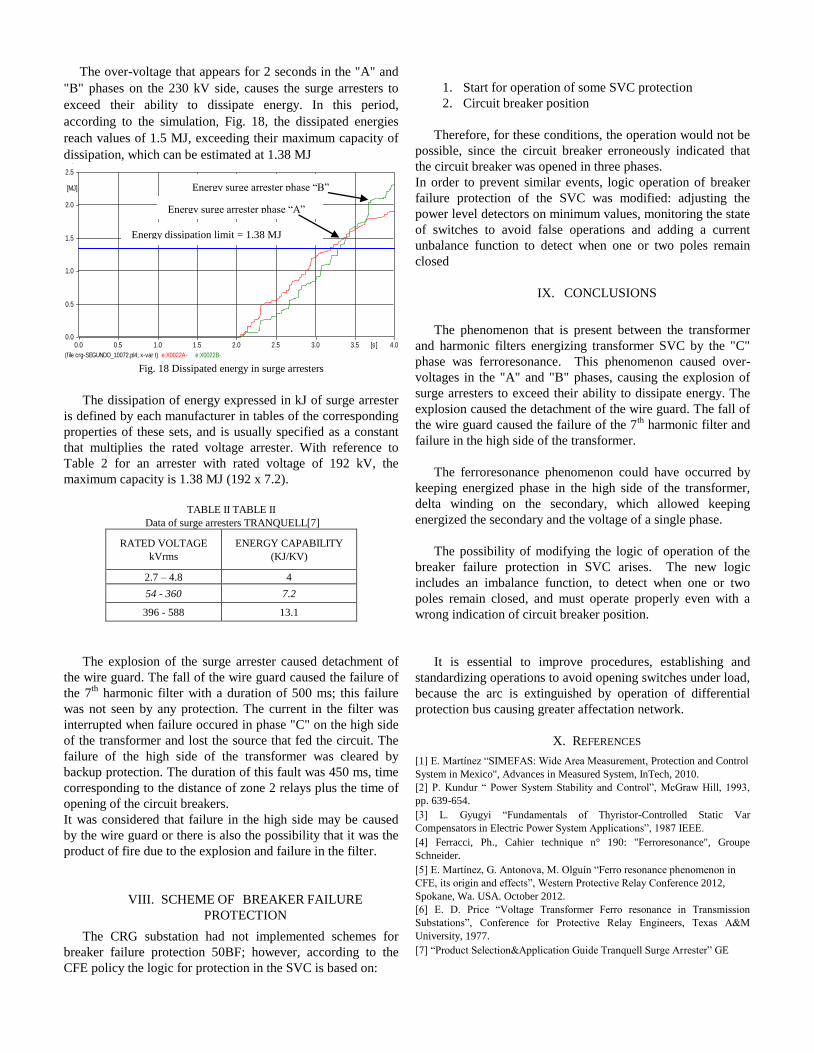
The over-voltage that appears for 2 seconds in the "A" and
"B" phases on the 230 kV side, causes the surge arresters to
exceed their ability to dissipate energy. In this period,
according to the simulation, Fig. 18, the dissipated energies
reach values of 1.5 MJ, exceeding their maximum capacity of
dissipation, which can be estimated at 1.38 MJ
(f ile crg-SEGUNDO_10072.pl4; x-var t) e:X0022A- e:X0022B-
0.0 0.5 1.0 1.5 2.0 2.5 3.0 3.5 4.0[s]0.0
0.5
1.0
1.5
2.0
2.5
[MJ]
Fig. 18 Dissipated energy in surge arresters
The dissipation of energy expressed in kJ of surge arrester
is defined by each manufacturer in tables of the corresponding
properties of these sets, and is usually specified as a constant
that multiplies the rated voltage arrester. With reference to
Table 2 for an arrester with rated voltage of 192 kV, the
maximum capacity is 1.38 MJ (192 x 7.2).
TABLE II TABLE II
Data of surge arresters TRANQUELL[7]
RATED VOLTAGE
kVrms
ENERGY CAPABILITY
(KJ/KV)
2.7 – 4.8 4
54 - 360 7.2
396 - 588 13.1
The explosion of the surge arrester caused detachment of
the wire guard. The fall of the wire guard caused the failure of
the 7th
harmonic filter with a duration of 500 ms; this failure
was not seen by any protection. The current in the filter was
interrupted when failure occured in phase "C" on the high side
of the transformer and lost the source that fed the circuit. The
failure of the high side of the transformer was cleared by
backup protection. The duration of this fault was 450 ms, time
corresponding to the distance of zone 2 relays plus the time of
opening of the circuit breakers.
It was considered that failure in the high side may be caused
by the wire guard or there is also the possibility that it was the
product of fire due to the explosion and failure in the filter.
VIII. SCHEME OF BREAKER FAILURE
PROTECTION
The CRG substation had not implemented schemes for
breaker failure protection 50BF; however, according to the
CFE policy the logic for protection in the SVC is based on:
1. Start for operation of some SVC protection
2. Circuit breaker position
Therefore, for these conditions, the operation would not be
possible, since the circuit breaker erroneously indicated that
the circuit breaker was opened in three phases.
In order to prevent similar events, logic operation of breaker
failure protection of the SVC was modified: adjusting the
power level detectors on minimum values, monitoring the state
of switches to avoid false operations and adding a current
unbalance function to detect when one or two poles remain
closed
IX. CONCLUSIONS
The phenomenon that is present between the transformer
and harmonic filters energizing transformer SVC by the "C"
phase was ferroresonance. This phenomenon caused over-
voltages in the "A" and "B" phases, causing the explosion of
surge arresters to exceed their ability to dissipate energy. The
explosion caused the detachment of the wire guard. The fall of
the wire guard caused the failure of the 7th
harmonic filter and
failure in the high side of the transformer.
The ferroresonance phenomenon could have occurred by
keeping energized phase in the high side of the transformer,
delta winding on the secondary, which allowed keeping
energized the secondary and the voltage of a single phase.
The possibility of modifying the logic of operation of the
breaker failure protection in SVC arises. The new logic
includes an imbalance function, to detect when one or two
poles remain closed, and must operate properly even with a
wrong indication of circuit breaker position.
It is essential to improve procedures, establishing and
standardizing operations to avoid opening switches under load,
because the arc is extinguished by operation of differential
protection bus causing greater affectation network.
X. REFERENCES
[1] E. Martínez “SIMEFAS: Wide Area Measurement, Protection and Control
System in Mexico", Advances in Measured System, InTech, 2010.
[2] P. Kundur “ Power System Stability and Control”, McGraw Hill, 1993,
pp. 639-654.
[3] L. Gyugyi “Fundamentals of Thyristor-Controlled Static Var
Compensators in Electric Power System Applications”, 1987 IEEE.
[4] Ferracci, Ph., Cahier technique n° 190: "Ferroresonance", Groupe
Schneider.
[5] E. Martínez, G. Antonova, M. Olguín “Ferro resonance phenomenon in
CFE, its origin and effects”, Western Protective Relay Conference 2012,
Spokane, Wa. USA. October 2012.
[6] E. D. Price “Voltage Transformer Ferro resonance in Transmission
Substations”, Conference for Protective Relay Engineers, Texas A&M
University, 1977.
[7] “Product Selection&Application Guide Tranquell Surge Arrester” GE
Energy dissipation limit = 1.38 MJ
Energy surge arrester phase “A”
Energy surge arrester phase “B”