Embed Size (px)
Citation preview
INTERNATIONAL JOURNAL OF CLIMATOLOGY
Int. J. Climatol. 18: 1345–1355 (1998)
RECONSTRUCTION OF THE SOUTHERN OSCILLATION FROMDRYNESS/WETNESS IN CHINA FOR THE LAST 500 YEARS
JIE SONG*Department of Geography, Northern Illinois Uni6ersity, DeKalb IL 60115, USA
Recei6ed 7 October 1996Re6ised 7 April 1998
Accepted 21 April 1998
ABSTRACT
Examination of instrumental data shows that a close relationship exists between the Southern Oscillation Index (SOI)and precipitation in China. In order to examine the anomalies of the climate in historic time, the 500-year proxyrainfall data in China were used to reconstruct the past seasonal SOI by the canonical correlation method. Thereconstructed SOIs calibrate an average of 40% of the Southern Oscillation (SO) variance with about an average of20% of variance verified over an independent period. The results exhibit that the activity of the SO in the past wasnot stable and varied in several periods. The SO was more active during 1472–1544, 1626–1708, with low SOI yearsoccurring 10–12 times per half century, and less active during 1708–1960, with low SOI years occurring 6–8 timesper half century. The second half of the 20th century sees even more frequent low SOI occurrences in comparisonwith the past. The more frequent low SOI years appear to be associated with cooler periods in China and severalother mid-latitude areas in the Northern Hemisphere. Significant spectral peaks of the SO activity are identified in arange of 2–10 years. © 1998 Royal Meteorological Society.
KEY WORDS: China; canonical correlation; reconstruction; SOI; dryness/wetness
1. INTRODUCTION
El Nino/Southern Oscillation (ENSO) events influence many parts of the globe, and they are a mostimportant source of year-to-year variability in climate (Whetton and Rutherfurd, 1994). A commonlyused ENSO indicator is the Southern Oscillation Index (SOI), which is based on the atmospheric pressuredifference between Tahiti and Darwin. Our knowledge of the large-scale climate anomalies prior to theinstrumental record is poor. Is the Southern Oscillation (SO) a very stable phenomenon, or have therebeen times in the past when it was inactive, or more active than it is today? How active is the SO duringwarm or cold historical periods? These questions have implications both for interpreting past climates andfor predicting future climatic change.
Climatic phenomena, such as floods and droughts that occurred in different parts of the world, are aresult of large-scale interactions between the atmosphere and the tropical oceans (Michaelsen, 1989;Whetton and Rutherfurd, 1994; Wu and Lough, 1987). For example, regional anomalous conditions ofwinter and spring temperature and precipitation in the US, and of summer rainfall in China were foundto be related with the extreme phases in the ENSO (Diaz and Fu, 1984). Based on the link betweenclimate in North American and ENSO events, Lough and Fritts (1985) reconstructed the SOI back to1600 by using North America tree-ring data, and calibrated about 50% of the SO variance with about20% of the variance verified over an independent period.
China has a long documented history, and it occupies a vast area. Climate data in China are highlycorrelated with the data from the Northern Hemisphere land area (Bradley et al., 1984; Lough et al., 1984;Wang et al., 1984). In particular, the Asia monsoon as well as rainfall in northern China, is significantly
* Correspondence to: Department of Geography, Northern Illinois University, DeKalb IL 60115, USA; e-mail: [email protected]
CCC 0899–8418/98/121345–11$17.50© 1998 Royal Meteorological Society
J. SONG1346
Table I. Classification of dryness/wetness from historical data
TypeGrade Index Description
Long lasting, intense precipitation over large areas1 Very wetWet2 Single season moderate lasting precipitation locallyNormal Good harvest, no record of flood or drought3Dry4 Single season moderate drought locally
Long lasting severe drought over large areas5 Very dry
correlated with the SOI (Guo, 1984; Wang and Li, 1990; Whetton et al., 1990). It is possible thatlong-term proxy records in China could provide valuable indications of climatic fluctuations over a muchlarger area and in a longer time period. However, little work has been done to use the available historicalproxy records in China to reconstruct past SO activity. The objective of this research is to reconstruct theSOI back to 1470 by using 500-year dryness/wetness data in China and to examine its temporalvariabilities over this extended period.
2. DATA
2.1. Dryness/wetness data in China
Since the 15th century, the compilation of local annals that documented events of drought and floodhas been very popular in the eastern half of China. ‘Yearly charts of dryness/wetness in China for the last500-year period’, edited by the Academy of Meteorological Science (1981), was compiled according tothese documentations. In the atlas, the territory of China is divided into 120 regions; the majority of theregions are concentrated east of 100°E. The dryness/wetness index of each year in each region is classifiedinto five-grade categories to represent the overall rainfall from spring to autumn, approximate to ourcurrent records from May to September (Table I). In the following analysis, the dryness or wetness ofeach year refers to this time period. Since 1951, the instrumentation record of precipitation has becomeavailable. The recorded precipitation data up to 1979 are also classified into five-grade indices defined inTable II in order to be consistent with the classification of the historical record1. The research by Wangand Zhao (1981) has been the most representative work using these data to study the past climate.
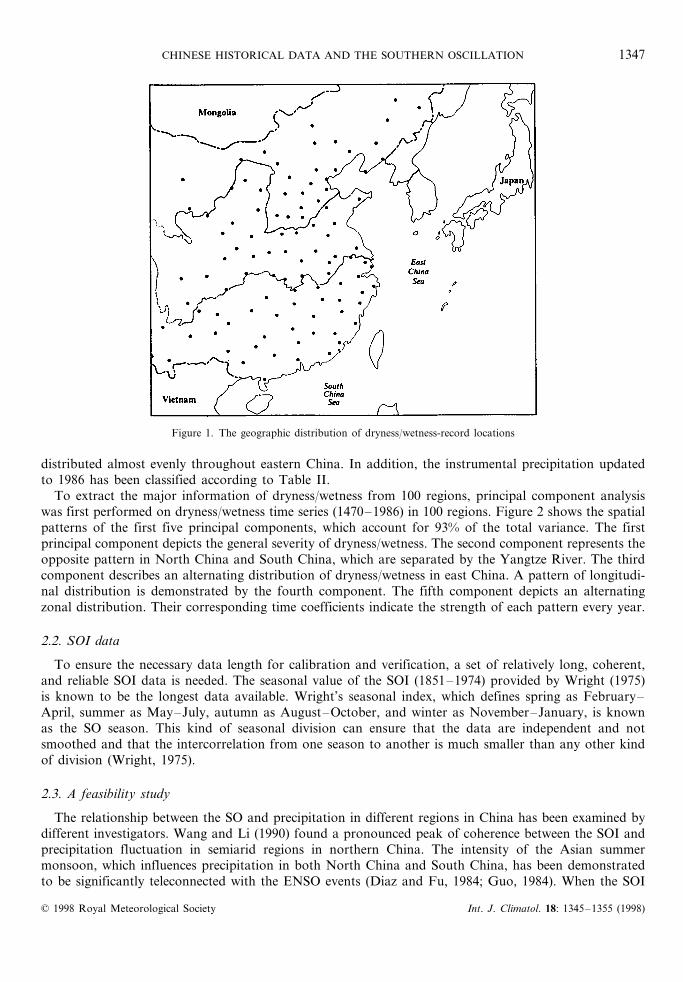
In this study, 100 regions where most of the historical records (1470–1979) are available are selectedfrom 120 regions, and their geographic distribution is shown in Figure 1. The missing values in some yearsin some regions were replaced by the mean value of the surrounding regions. Most regions are distributedaround the Yellow River and the middle and lower reaches of the Yangtze River. The selected regions are
Table II. Classification of dryness/wetness from instrumental precipitation
Grade Index Standard
1 Ri\(R+1.17s)2 (R+0.33s)BRi5 (R+1.17s)3 (R−0.33s)BRi5 (R+0.33s)4 (R−1.17s)BRi5 (R−0.33s)5 Ri5 (R−1.17s)
Ri, total precipitation from May to September each year.R, climate average of the total precipitation from May to September 1951–1979.s, standard deviation (S.D.).
1 Table I and the text in Jiang et al. (1997) contain an error when the grades of dryness/wetness were introduced. The RR shouldrepresent the anomaly that is the observed rainfall minus the average rainfall, rather than the observed rainfall itself.
© 1998 Royal Meteorological Society Int. J. Climatol. 18: 1345–1355 (1998)
CHINESE HISTORICAL DATA AND THE SOUTHERN OSCILLATION 1347
Figure 1. The geographic distribution of dryness/wetness-record locations
distributed almost evenly throughout eastern China. In addition, the instrumental precipitation updatedto 1986 has been classified according to Table II.
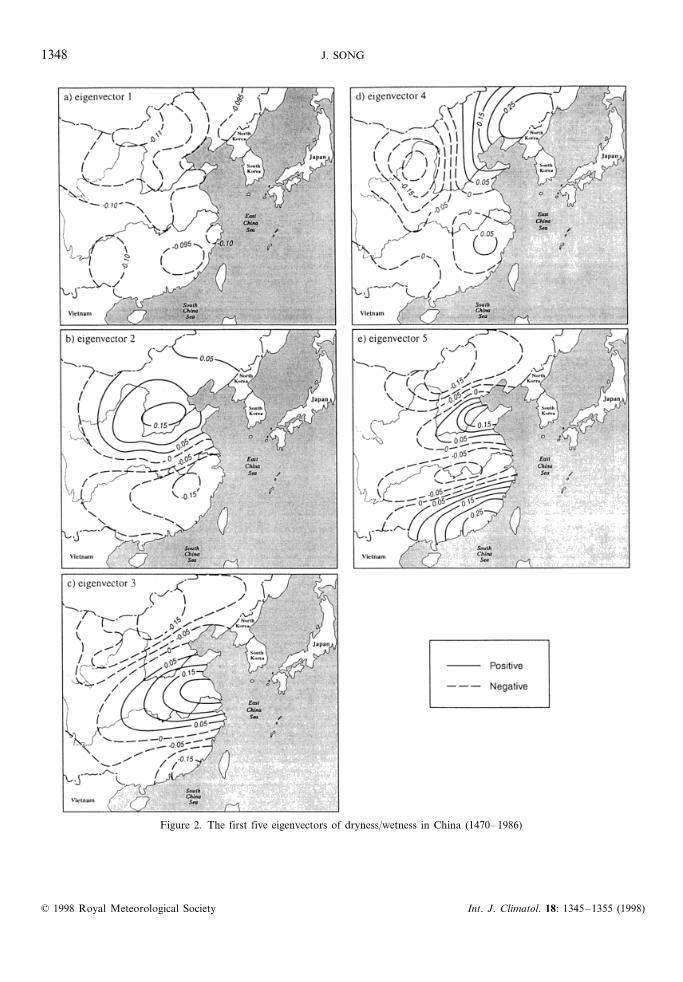
To extract the major information of dryness/wetness from 100 regions, principal component analysiswas first performed on dryness/wetness time series (1470–1986) in 100 regions. Figure 2 shows the spatialpatterns of the first five principal components, which account for 93% of the total variance. The firstprincipal component depicts the general severity of dryness/wetness. The second component represents theopposite pattern in North China and South China, which are separated by the Yangtze River. The thirdcomponent describes an alternating distribution of dryness/wetness in east China. A pattern of longitudi-nal distribution is demonstrated by the fourth component. The fifth component depicts an alternatingzonal distribution. Their corresponding time coefficients indicate the strength of each pattern every year.
2.2. SOI data
To ensure the necessary data length for calibration and verification, a set of relatively long, coherent,and reliable SOI data is needed. The seasonal value of the SOI (1851–1974) provided by Wright (1975)is known to be the longest data available. Wright’s seasonal index, which defines spring as February–April, summer as May–July, autumn as August–October, and winter as November–January, is knownas the SO season. This kind of seasonal division can ensure that the data are independent and notsmoothed and that the intercorrelation from one season to another is much smaller than any other kindof division (Wright, 1975).
2.3. A feasibility study
The relationship between the SO and precipitation in different regions in China has been examined bydifferent investigators. Wang and Li (1990) found a pronounced peak of coherence between the SOI andprecipitation fluctuation in semiarid regions in northern China. The intensity of the Asian summermonsoon, which influences precipitation in both North China and South China, has been demonstratedto be significantly teleconnected with the ENSO events (Diaz and Fu, 1984; Guo, 1984). When the SOI
© 1998 Royal Meteorological Society Int. J. Climatol. 18: 1345–1355 (1998)
J. SONG1348
Figure 2. The first five eigenvectors of dryness/wetness in China (1470–1986)
© 1998 Royal Meteorological Society Int. J. Climatol. 18: 1345–1355 (1998)
CHINESE HISTORICAL DATA AND THE SOUTHERN OSCILLATION 1349
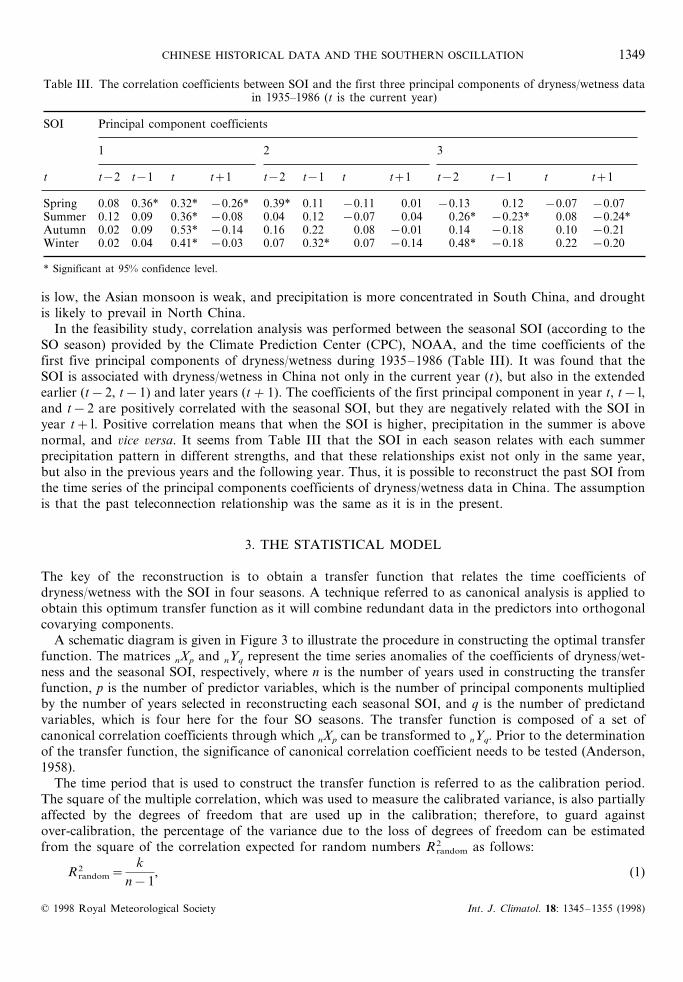
Table III. The correlation coefficients between SOI and the first three principal components of dryness/wetness datain 1935–1986 (t is the current year)
SOI Principal component coefficients
1 2 3
t t+1 t−2 t−1 t t+1 t−2 t−1 tt t−2 t+1t−1
0.39* 0.11 −0.11 0.01 −0.13 −0.070.12 −0.07Spring 0.08 0.36* 0.32* −0.26*−0.08 0.04 0.12 −0.07 0.04 0.26* −0.23* 0.08Summer 0.12 0.09 −0.24*0.36*
0.14Autumn −0.010.080.220.16−0.140.53*0.090.02 −0.210.10−0.180.07 −0.14 −0.20−0.030.41*0.040.02Winter 0.220.48* −0.180.07 0.32*
* Significant at 95% confidence level.
is low, the Asian monsoon is weak, and precipitation is more concentrated in South China, and droughtis likely to prevail in North China.
In the feasibility study, correlation analysis was performed between the seasonal SOI (according to theSO season) provided by the Climate Prediction Center (CPC), NOAA, and the time coefficients of thefirst five principal components of dryness/wetness during 1935–1986 (Table III). It was found that theSOI is associated with dryness/wetness in China not only in the current year (t), but also in the extendedearlier (t−2, t−1) and later years (t+ 1). The coefficients of the first principal component in year t, t− l,and t−2 are positively correlated with the seasonal SOI, but they are negatively related with the SOI inyear t+ l. Positive correlation means that when the SOI is higher, precipitation in the summer is abovenormal, and 6ice 6ersa. It seems from Table III that the SOI in each season relates with each summerprecipitation pattern in different strengths, and that these relationships exist not only in the same year,but also in the previous years and the following year. Thus, it is possible to reconstruct the past SOI fromthe time series of the principal components coefficients of dryness/wetness data in China. The assumptionis that the past teleconnection relationship was the same as it is in the present.
3. THE STATISTICAL MODEL
The key of the reconstruction is to obtain a transfer function that relates the time coefficients ofdryness/wetness with the SOI in four seasons. A technique referred to as canonical analysis is applied toobtain this optimum transfer function as it will combine redundant data in the predictors into orthogonalcovarying components.
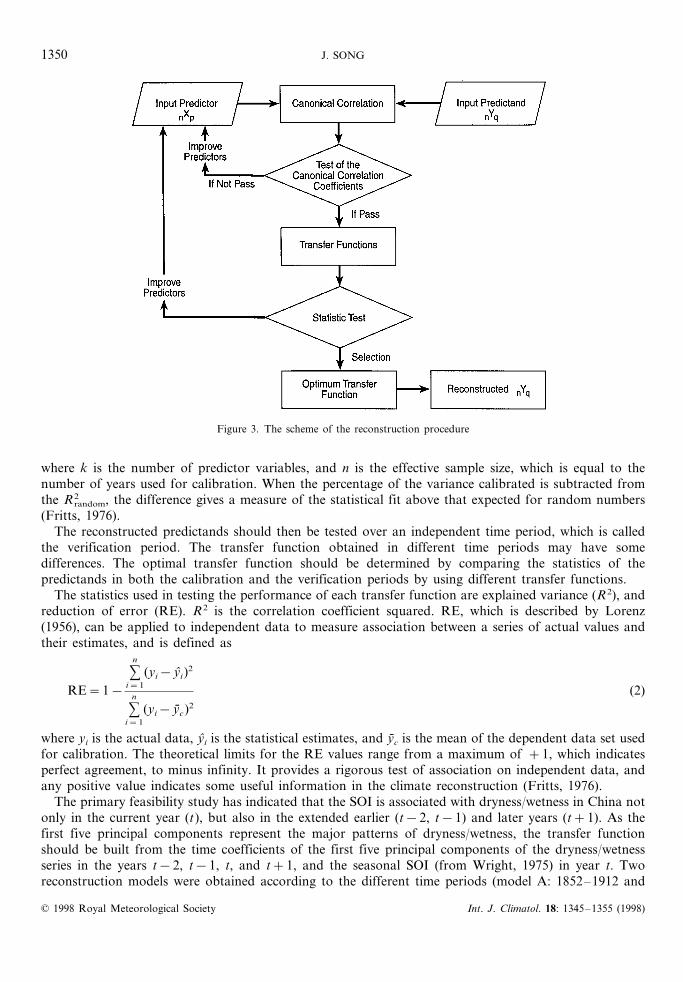
A schematic diagram is given in Figure 3 to illustrate the procedure in constructing the optimal transferfunction. The matrices nXp and nYq represent the time series anomalies of the coefficients of dryness/wet-ness and the seasonal SOI, respectively, where n is the number of years used in constructing the transferfunction, p is the number of predictor variables, which is the number of principal components multipliedby the number of years selected in reconstructing each seasonal SOI, and q is the number of predictandvariables, which is four here for the four SO seasons. The transfer function is composed of a set ofcanonical correlation coefficients through which nXp can be transformed to nYq. Prior to the determinationof the transfer function, the significance of canonical correlation coefficient needs to be tested (Anderson,1958).
The time period that is used to construct the transfer function is referred to as the calibration period.The square of the multiple correlation, which was used to measure the calibrated variance, is also partiallyaffected by the degrees of freedom that are used up in the calibration; therefore, to guard againstover-calibration, the percentage of the variance due to the loss of degrees of freedom can be estimatedfrom the square of the correlation expected for random numbers R2
random as follows:
R random2 =
kn−1
, (1)
© 1998 Royal Meteorological Society Int. J. Climatol. 18: 1345–1355 (1998)
J. SONG1350
Figure 3. The scheme of the reconstruction procedure
where k is the number of predictor variables, and n is the effective sample size, which is equal to thenumber of years used for calibration. When the percentage of the variance calibrated is subtracted fromthe R2
random, the difference gives a measure of the statistical fit above that expected for random numbers(Fritts, 1976).
The reconstructed predictands should then be tested over an independent time period, which is calledthe verification period. The transfer function obtained in different time periods may have somedifferences. The optimal transfer function should be determined by comparing the statistics of thepredictands in both the calibration and the verification periods by using different transfer functions.
The statistics used in testing the performance of each transfer function are explained variance (R2), andreduction of error (RE). R2 is the correlation coefficient squared. RE, which is described by Lorenz(1956), can be applied to independent data to measure association between a series of actual values andtheir estimates, and is defined as
RE=1−%n
i=1
(yi− yi)2
%n
i=1
(yi− yc)2
(2)
where yi is the actual data, yi is the statistical estimates, and yc is the mean of the dependent data set usedfor calibration. The theoretical limits for the RE values range from a maximum of +1, which indicatesperfect agreement, to minus infinity. It provides a rigorous test of association on independent data, andany positive value indicates some useful information in the climate reconstruction (Fritts, 1976).
The primary feasibility study has indicated that the SOI is associated with dryness/wetness in China notonly in the current year (t), but also in the extended earlier (t−2, t−1) and later years (t+1). As thefirst five principal components represent the major patterns of dryness/wetness, the transfer functionshould be built from the time coefficients of the first five principal components of the dryness/wetnessseries in the years t−2, t−1, t, and t+1, and the seasonal SOI (from Wright, 1975) in year t. Tworeconstruction models were obtained according to the different time periods (model A: 1852–1912 and
© 1998 Royal Meteorological Society Int. J. Climatol. 18: 1345–1355 (1998)
CHINESE HISTORICAL DATA AND THE SOUTHERN OSCILLATION 1351
model B: 1913–1973) in which the transfer function was derived. The verification periods for each modelwere then switched. Further, the SOI (CPC) from 1974–1985 was also used as independent data to verifythe reconstructed values.
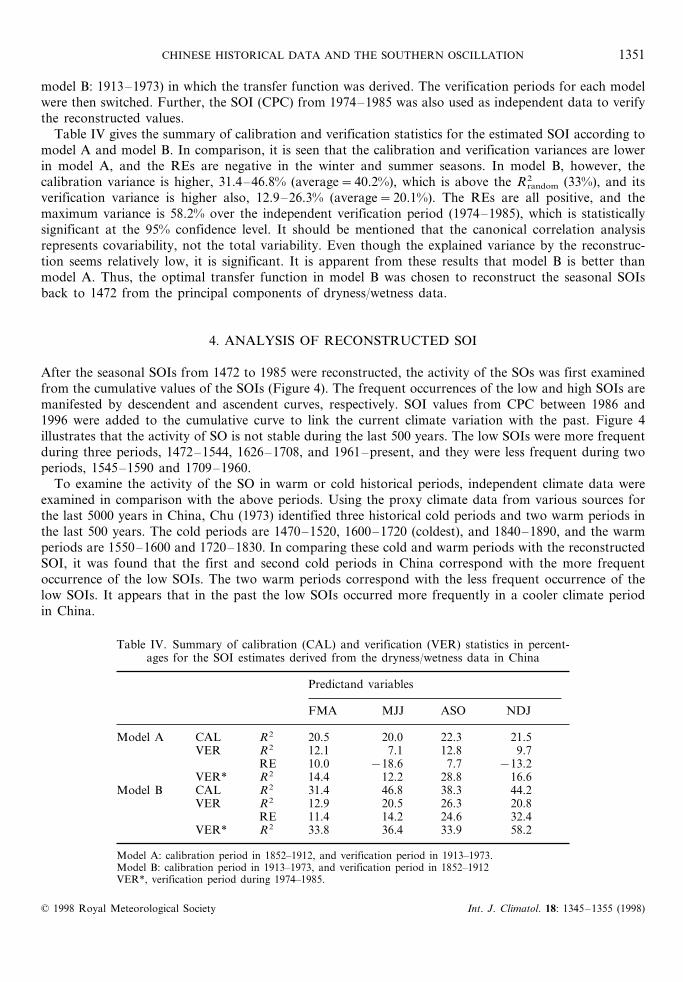
Table IV gives the summary of calibration and verification statistics for the estimated SOI according tomodel A and model B. In comparison, it is seen that the calibration and verification variances are lowerin model A, and the REs are negative in the winter and summer seasons. In model B, however, thecalibration variance is higher, 31.4–46.8% (average=40.2%), which is above the R2
random (33%), and itsverification variance is higher also, 12.9–26.3% (average=20.1%). The REs are all positive, and themaximum variance is 58.2% over the independent verification period (1974–1985), which is statisticallysignificant at the 95% confidence level. It should be mentioned that the canonical correlation analysisrepresents covariability, not the total variability. Even though the explained variance by the reconstruc-tion seems relatively low, it is significant. It is apparent from these results that model B is better thanmodel A. Thus, the optimal transfer function in model B was chosen to reconstruct the seasonal SOIsback to 1472 from the principal components of dryness/wetness data.
4. ANALYSIS OF RECONSTRUCTED SOI
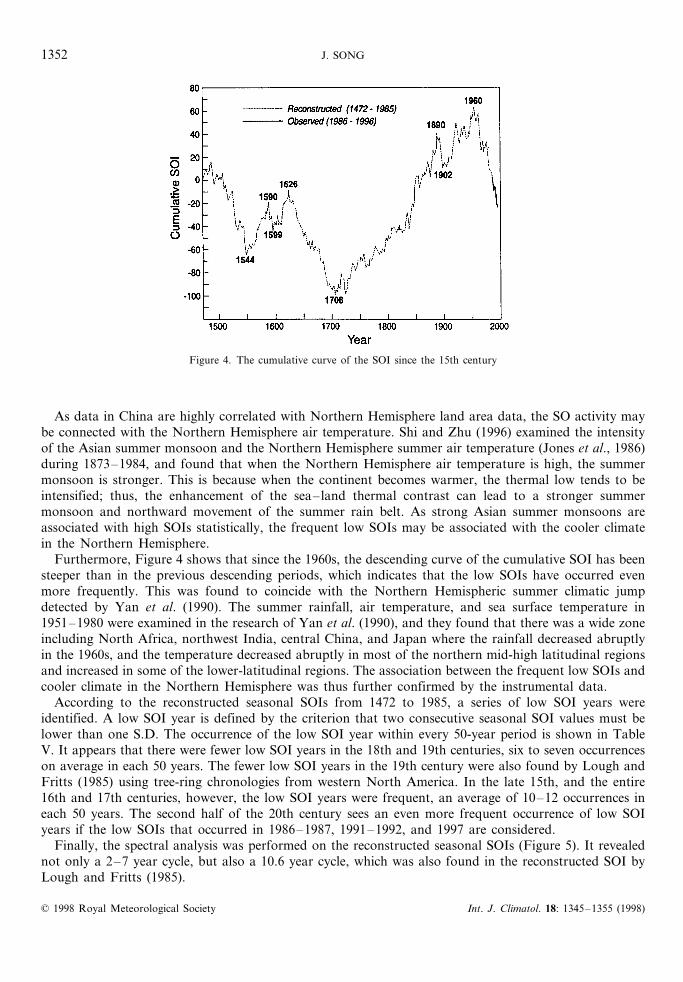
After the seasonal SOIs from 1472 to 1985 were reconstructed, the activity of the SOs was first examinedfrom the cumulative values of the SOIs (Figure 4). The frequent occurrences of the low and high SOIs aremanifested by descendent and ascendent curves, respectively. SOI values from CPC between 1986 and1996 were added to the cumulative curve to link the current climate variation with the past. Figure 4illustrates that the activity of SO is not stable during the last 500 years. The low SOIs were more frequentduring three periods, 1472–1544, 1626–1708, and 1961–present, and they were less frequent during twoperiods, 1545–1590 and 1709–1960.
To examine the activity of the SO in warm or cold historical periods, independent climate data wereexamined in comparison with the above periods. Using the proxy climate data from various sources forthe last 5000 years in China, Chu (1973) identified three historical cold periods and two warm periods inthe last 500 years. The cold periods are 1470–1520, 1600–1720 (coldest), and 1840–1890, and the warmperiods are 1550–1600 and 1720–1830. In comparing these cold and warm periods with the reconstructedSOI, it was found that the first and second cold periods in China correspond with the more frequentoccurrence of the low SOIs. The two warm periods correspond with the less frequent occurrence of thelow SOIs. It appears that in the past the low SOIs occurred more frequently in a cooler climate periodin China.
Table IV. Summary of calibration (CAL) and verification (VER) statistics in percent-ages for the SOI estimates derived from the dryness/wetness data in China
Predictand variables
ASO NDJMJJFMA
21.520.0 22.3Model A CAL R2 20.57.1 12.8 9.7VER R2 12.1
10.0 −18.6 7.7RE −13.212.214.4 28.8 16.6R2VER*
31.4 46.8 38.3Model B CAL R2 44.220.826.320.512.9R2VER
11.4 14.2 24.6RE 32.433.8 36.4 33.9VER* R2 58.2
Model A: calibration period in 1852–1912, and verification period in 1913–1973.Model B: calibration period in 1913–1973, and verification period in 1852–1912VER*, verification period during 1974–1985.
© 1998 Royal Meteorological Society Int. J. Climatol. 18: 1345–1355 (1998)
J. SONG1352
Figure 4. The cumulative curve of the SOI since the 15th century
As data in China are highly correlated with Northern Hemisphere land area data, the SO activity maybe connected with the Northern Hemisphere air temperature. Shi and Zhu (1996) examined the intensityof the Asian summer monsoon and the Northern Hemisphere summer air temperature (Jones et al., 1986)during 1873–1984, and found that when the Northern Hemisphere air temperature is high, the summermonsoon is stronger. This is because when the continent becomes warmer, the thermal low tends to beintensified; thus, the enhancement of the sea–land thermal contrast can lead to a stronger summermonsoon and northward movement of the summer rain belt. As strong Asian summer monsoons areassociated with high SOIs statistically, the frequent low SOIs may be associated with the cooler climatein the Northern Hemisphere.
Furthermore, Figure 4 shows that since the 1960s, the descending curve of the cumulative SOI has beensteeper than in the previous descending periods, which indicates that the low SOIs have occurred evenmore frequently. This was found to coincide with the Northern Hemispheric summer climatic jumpdetected by Yan et al. (1990). The summer rainfall, air temperature, and sea surface temperature in1951–1980 were examined in the research of Yan et al. (1990), and they found that there was a wide zoneincluding North Africa, northwest India, central China, and Japan where the rainfall decreased abruptlyin the 1960s, and the temperature decreased abruptly in most of the northern mid-high latitudinal regionsand increased in some of the lower-latitudinal regions. The association between the frequent low SOIs andcooler climate in the Northern Hemisphere was thus further confirmed by the instrumental data.
According to the reconstructed seasonal SOIs from 1472 to 1985, a series of low SOI years wereidentified. A low SOI year is defined by the criterion that two consecutive seasonal SOI values must belower than one S.D. The occurrence of the low SOI year within every 50-year period is shown in TableV. It appears that there were fewer low SOI years in the 18th and 19th centuries, six to seven occurrenceson average in each 50 years. The fewer low SOI years in the 19th century were also found by Lough andFritts (1985) using tree-ring chronologies from western North America. In the late 15th, and the entire16th and 17th centuries, however, the low SOI years were frequent, an average of 10–12 occurrences ineach 50 years. The second half of the 20th century sees an even more frequent occurrence of low SOIyears if the low SOIs that occurred in 1986–1987, 1991–1992, and 1997 are considered.
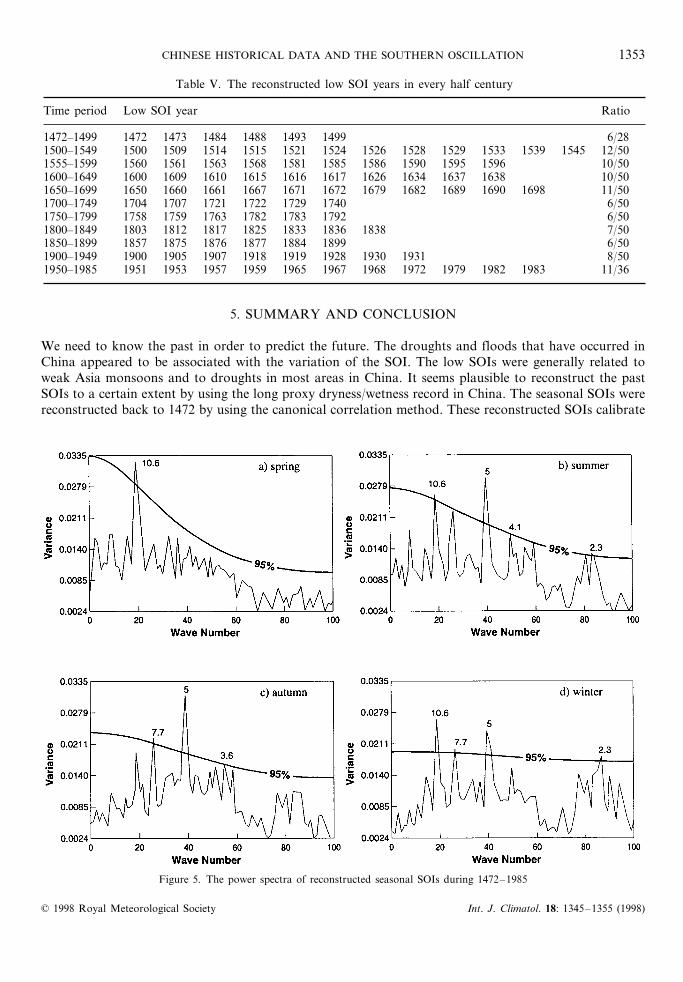
Finally, the spectral analysis was performed on the reconstructed seasonal SOIs (Figure 5). It revealednot only a 2–7 year cycle, but also a 10.6 year cycle, which was also found in the reconstructed SOI byLough and Fritts (1985).
© 1998 Royal Meteorological Society Int. J. Climatol. 18: 1345–1355 (1998)
CHINESE HISTORICAL DATA AND THE SOUTHERN OSCILLATION 1353
Table V. The reconstructed low SOI years in every half century
Time period Low SOI year Ratio
1472–1499 1472 1473 1484 1488 1493 1499 6/281500–1549 1500 1509 1514 1515 1521 1524 1526 1528 1529 1533 1539 1545 12/501555–1599 1560 1561 1563 1568 1581 1585 1586 1590 1595 1596 10/501600–1649 1600 1609 1610 1615 1616 1617 1626 1634 1637 1638 10/501650–1699 1650 1660 1661 1667 1671 1672 1679 1682 1689 1690 1698 11/501700–1749 1704 1707 1721 1722 1729 1740 6/501750–1799 1758 1759 1763 1782 1783 1792 6/501800–1849 1803 1812 1817 1825 1833 1836 1838 7/501850–1899 1857 1875 1876 1877 1884 1899 6/501900–1949 1900 1905 1907 1918 1919 1928 1930 1931 8/501950–1985 1951 1953 1957 1959 1965 1967 1968 1972 1979 1982 1983 11/36
5. SUMMARY AND CONCLUSION
We need to know the past in order to predict the future. The droughts and floods that have occurred inChina appeared to be associated with the variation of the SOI. The low SOIs were generally related toweak Asia monsoons and to droughts in most areas in China. It seems plausible to reconstruct the pastSOIs to a certain extent by using the long proxy dryness/wetness record in China. The seasonal SOIs werereconstructed back to 1472 by using the canonical correlation method. These reconstructed SOIs calibrate
Figure 5. The power spectra of reconstructed seasonal SOIs during 1472–1985
© 1998 Royal Meteorological Society Int. J. Climatol. 18: 1345–1355 (1998)
J. SONG1354
an average of 40% of the SO variance with about an average of 20% of variance verified over anindependent period.
The results of the reconstruction show that the low SOIs are less frequent in the 18th and 19thcenturies, but more frequent in the late 15th and in the entire 16th and 17th centuries. When thereconstructed SOI was extended to the present by including the current observed seasonal SOIs, therewere unprecedentedly more low SOI years in the second half of the 20th century. Comparing the activityof SO with independent cold and warm periods in history, it appears that the frequent occurrence of lowSOI years is associated with a cooler climate period in China and in most mid–high latitudinal areas inthe Northern Hemisphere. In addition, significant spectral peaks are identified from reconstructed SOIsat periods in the 2–10 year range, which are similar to those found in the 20th century data.
Certain limitations need to be noted in the reconstruction procedure. It has been assumed that therelationship between predictor and predictand drawn from instrument records can be extended to thepast. The categorization of the dryness/wetness grade may also present some errors when beingtransferred from descriptive information.
ACKNOWLEDGEMENTS
The author thanks Xian-Gong Zhang of the Academy of Meteorological Science, State MeteorologicalAdministration, Beijing, China, for his help in data acquisition and many useful suggestions. Specialthanks go to Richard Vaupel of the Northern Illinois University cartography laboratory for assisting withthe figures. The efforts of David Changnon and Steve Silberberg in making constructive comments on thismanuscript are appreciated. Finally, the author is very grateful to two anonymous reviewers, whoprovided constructive criticism.
REFERENCES
Academy of Meteorological Science (ed.), 1981. Yearly Charts of Dryness/Wetness in China for the Last 500-Year Period,Cartographic Public House, Beijing, 332 pp.
Anderson, T.W. 1958. An Introduction to Multi6ariate Statistical Analysis, John Wiley and Sons, New York, 374 pp.Bradley, R.S., Diaz, H.F., Jones, P.D. and Kelly, P.M. 1984. ‘Secular fluctuations of temperature over Northern Hemisphere land
areas and mainland China since the mid-19th century’, in Ye, D., Fu, C., Chao, J. and Yoshino, M. (eds), The Climate of Chinaand Global Climate, China Ocean Press, Beijing, pp. 76–87.
Chu, K. 1973. ‘A preliminary study on the climate fluctuations during the last 5000 years in China’, Sci. Sin. (Ser. B), 16, 226–256.Diaz, H.F. and Fu, C. 1984. ‘Regional precipitation and temperature variability and its relationship to the Southern Oscillation’, in
Ye, D., Fu, C., Chao, J. and Yoshino, M. (eds), The Climate of China and Global Climate, China Ocean Press, Beijing, pp.213–223.
Fritts, H.C. 1976. Tree Rings and Climate, Academic Press, London, 567 pp.Guo, Q. 1984. ‘The East Asia summer monsoon and the Southern Oscillation, 1871–1980’, in Ye, D., Fu, C., Chao, J. and Yoshino,
M. (eds), The Climate of China and Global Climate, China Ocean Press, Beijing, pp. 249–255.Jiang, J., Zhang, D. and Fraedrich, K. 1997.‘Historic climate variability of wetness in East China (960–1992): A wavelet analysis’,
Int. J. Climatol., 17, 969–981.Jones, P.D., Raper, S.C.B., Bradley, R.S., Diaz, H.P., Kelly, P.M. and Wigley, T.M.L. 1986. ‘Northern Hemisphere surface air
temperature variations: 1851–1984’, J. Clim. Appl. Meteorol., 25, 161–179.Lorenz, E.N. 1956. Empirical Orthogonal Functions and Statistical Weather Prediction, M.I.T. Statistical Forecasting Project,
Scientific Report 1, Contract AF 19 (604)–1566.Lough, J.M. and Fritts, H.C. and Wu, X. 1984.‘Relationships between the climates of China and North America over the past four
centuries: a comparison of proxy records’, in Ye, D., Fu, C., Chao, J. and Yoshino, M. (eds), The Climate of China and GlobalClimate, China Ocean Press, Beijing, pp. 89–105.
Lough, J.M. and Fritts, H.C. 1985.‘The Southern Oscillation and tree rings: 1600–1961’, J. Clim. Appl. Meteorol., 24, 952–966.Michaelsen, J. 1989. ‘Long period fluctuations in E1 Nino amplitude and frequency reconstructed from Tree Rings’, in Peterson,
D.H. (ed.), Aspects of Climate Variability in the Pacific and the Western Americas, Geophysical Monograph, 55, AmericanGeophysical Union, pp. 69–74.
Shi, N. and Zhu, Q. 1996.‘An abrupt change in the intensity of the east Asian summer monsoon index and its relationship withtemperature and precipitation over east China’, Int. J. Climatol., 16, 757–764.
Wang, S. and Zhao, Z. 1981.‘Droughts and floods in China, 1470–1979’, in Wigley, T.M.L., Ingram, M.J. and Farmer, G. (eds),Climate History, Cambridge University Press, Cambridge, pp. 271–288.
Wang, S., Zhao, Z., Chen, Z. and Tang, Z. 1984.‘Drought/Flood variations for the last 2000 years in China and comparison withglobal climatic change’ in Ye, D., Fu, C., Chao, J. and Yoshino, M. (eds), The Climate of China and Global Climate, Beijing,China Ocean Press, pp. 20–29.
© 1998 Royal Meteorological Society Int. J. Climatol. 18: 1345–1355 (1998)
CHINESE HISTORICAL DATA AND THE SOUTHERN OSCILLATION 1355
Wang, W. and Li, K. 1990.‘Precipitation fluctuation over semiarid region in northern China and the relationship with E1Nino/Southern Oscillation’, J. Climate, 3, 769–783.
Whetton, P. and Adamson, D. and Williams, M.A.J. 1990.‘Rainfall and river flow variability in Africa, Australia and East Asialinked to El Nino-Southern Oscillation Events’, Geol. Soc. Austral. Symp. Proc., 1, pp. 21–26.
Whetton, P. and Rutherfurd, I. 1994.‘Historical ENSO teleconnections in the Eastern Hemisphere’, Clim. Change, 28, 221–253.Wright, P.B. An index of the Southern Oscillation, QURP4, Climate Research Unit, Norwich, England, 1975.Wu, X. and Lough, J.M. 1987. ‘Estimating North Pacific summer sea level pressure back to 1600 using proxy climate records from
China and North America’, Ad6. Atmos. Sci., 4, 74–84.Yan, Z., Ji, J. and Ye, D. 1990.‘Northern Hemispheric summer climatic jump in the 1960s (I)—rainfall and temperature’, Sci. China,
33(9), 1092–1101.
© 1998 Royal Meteorological Society Int. J. Climatol. 18: 1345–1355 (1998)