Embed Size (px)
Citation preview
Reconstructing the density and temperature structure of
prestellar cores from Herschel data: A case study for
B68 and L1689B
A. Roy, Ph. Andre, P. Palmeirim, M. Attard, V. Konyves, N. Schneider, N.
Peretto, A. Men’shchikov, D. Ward-Thompson, J. Kirk, et al.
To cite this version:
A. Roy, Ph. Andre, P. Palmeirim, M. Attard, V. Konyves, et al.. Reconstructing the density andtemperature structure of prestellar cores from Herschel data: A case study for B68 and L1689B.Astronomy and Astrophysics - A&A, EDP Sciences, 2014, 562, pp.A138. <10.1051/0004-6361/201322236>. <cea-01162420>
HAL Id: cea-01162420
https://hal-cea.archives-ouvertes.fr/cea-01162420
Submitted on 10 Jun 2015
HAL is a multi-disciplinary open accessarchive for the deposit and dissemination of sci-entific research documents, whether they are pub-lished or not. The documents may come fromteaching and research institutions in France orabroad, or from public or private research centers.
L’archive ouverte pluridisciplinaire HAL, estdestinee au depot et a la diffusion de documentsscientifiques de niveau recherche, publies ou non,emanant des etablissements d’enseignement et derecherche francais ou etrangers, des laboratoirespublics ou prives.

A&A 562, A138 (2014)DOI: 10.1051/0004-6361/201322236c© ESO 2014
Astronomy&
Astrophysics
Reconstructing the density and temperature structure of prestellarcores from Herschel data: A case study for B68 and L1689B�
A. Roy1, Ph. André1, P. Palmeirim1, M. Attard1, V. Könyves1,2, N. Schneider1,3, N. Peretto1,4, A. Men’shchikov1,D. Ward-Thompson5, J. Kirk5, M. Griffin4, K. Marsh4, A. Abergel2, D. Arzoumanian2, M. Benedettini6, T. Hill1,7,F. Motte1, Q. Nguyen Luong8, S. Pezzuto6, A. Rivera-Ingraham9,10, H. Roussel11, K. L. J. Rygl6, L. Spinoglio6,
D. Stamatellos5, and G. White12,13
1 Laboratoire AIM, CEA/DSM-CNRS-Université Paris Diderot, IRFU/Service d’Astrophysique, C.E. Saclay, Orme des Merisiers,91191 Gif-sur-Yvette, Francee-mail: [Arabindo.Roy;philippe.andre]@cea.fr
2 Institut d’Astrophysique Spatiale, CNRS/Université Paris-Sud 11, 91405 Orsay, France3 Université de Bordeaux, Laboratoire d’Astrophysique de Bordeaux, CNRS/INSU, UMR 5804, BP 89, 33271 Floirac Cedex, France4 School of Physics & Astronomy, Cardiff University, Cardiff CF29 3AA, UK5 Jeremiah Horrocks Institute, University of Central Lancashire, Preston PR1 2HE, UK6 INAF-Istituto di Astrofisica e Planetologia Spaziali, via Fosso del Cavaliere 100, 00133 Rome, Italy7 Joint ALMA Observatory, Alonso de Córdova 3107, Vitacura, Santiago, Chile8 Canadian Institute for Theoretical Astrophysics, University of Toronto, 60 St. George Street, Toronto, ON M5S 3H8, Canada9 Université de Toulouse, UPS-OMP, IRAP, Toulouse, France
10 CNRS, IRAP, 9 Av. colonel Roche, BP 44346, 31028 Toulouse Cedex 4, France11 Institut d’Astrophysique de Paris, UMR7095 CNRS, Université Pierre & Marie Curie, 98 bis boulevard Arago, 75014 Paris, France12 Department of Physics and Astronomy, The Open University, Walton Hall, Milton Keynes MK7 6AA, UK13 RAL Space, STFC Rutherford Appleton Laboratory, Chilton Didcot OX11 0QX, UK
Received 9 July 2013 / Accepted 8 November 2013
ABSTRACT
Utilizing multiwavelength dust emission maps acquired with Herschel, we reconstruct local volume density and dust temperatureprofiles for the prestellar cores B68 and L1689B using an inverse-Abel transform-based technique. We present intrinsic radial dusttemperature profiles of starless cores directly from dust continuum emission maps disentangling the effect of temperature variationsalong the line of sight, which were previously limited to the radiative transfer calculations. The reconstructed dust temperatureprofiles show a significant drop in the core center, a flat inner part, and a rising outward trend until the background cloud temperatureis reached. The central beam-averaged dust temperatures obtained for B68 and L1689B are 9.3 ± 0.5 K and 9.8 ± 0.5 K, respectively,which are lower than the temperatures of 11.3 K and 11.6 K obtained from direct SED fitting. The best mass estimates derived byintegrating the volume density profiles of B68 and L1689B are 1.6 M� and 11 M�, respectively. Comparing our results for B68 with
the near-infrared extinction studies, we find that the dust opacity law adopted by the HGBS project, κλ = 0.1 ×(
λ300 μm
)−2cm2 g−1
agrees to within 50% with the dust extinction constraints.
Key words. stars: formation – submillimeter: general – ISM: individual objects: B68 – ISM: individual objects: L1689B –dust, extinction
1. Introduction
Recent submillimeter observations with the Herschel SpaceObservatory (Pilbratt et al. 2010) and particularly the results ob-tained as part of the Herschel Gould Belt Survey (HGBS; Andréet al. 2010) have significantly improved our global understand-ing of the early stages of low-mass star formation. It is now be-coming clear that the formation of prestellar cores is intimatelyrelated to the ubiquitous filamentary structure present in the coldinterstellar medium (ISM; Arzoumanian et al. 2011). On onehand one of the main objectives of the HGBS is to measure theprestellar core mass function (CMF) in nearby cloud complexesand to clarify the relationship between the CMF and the stellar
� Appendices are available in electronic form athttp://www.aanda.org
initial mass function (IMF) on the other hand we also look atthe link with the structure of the ISM (cf. Könyves et al. 2010;André et al. 2010, for preliminary results).
An accurate determination of the prestellar CMF requiresreliable estimates of core masses. In the context of theHGBS project, core masses are derived from dust continuumemission maps obtained with Herschel between 160 μm and500 μm. Dust emission is almost always optically thin at thesewavelengths and can thus act as a surrogate tracer of the total(gas + dust) mass along the line of sight (LOS). This requires anassumption about the dust opacity in the submillimeter regimeand reliable estimates of the dust temperature, Td. Herschelmultiwavelength data can be used to estimate 〈Td〉LOS throughsingle-temperature greybody fits to the observed spectral energydistributions (SEDs; cf. Könyves et al. 2010). A complication,
Article published by EDP Sciences A138, page 1 of 10
A&A 562, A138 (2014)
however, is that such fits only provide the average temperaturealong the LOS and do not account for temperature gradientswithin the target sources. This is potentially a very significantproblem when studying self-gravitating starless (or protostellar)cores with stratified density structures heated by an external orinternal radiation field. The central temperatures of cold, star-less cores and sometimes their mass-averaged temperatures canbe overestimated due to the relatively strong emission from thescreen of warmer dust in the outer layers of the cores which biascore mass estimates to lower values (cf. Malinen et al. 2011).Likewise, temperature variations along the LOS may hamper thederivation of reliable density profiles for prestellar cores (e.g.,Kirk et al. 2005; Ysard et al. 2012) using submillimeter emis-sion maps (e.g., Kirk et al. 2005; Ysard et al. 2012). Radiativetransfer calculations (e.g., Evans et al. 2001; Stamatellos et al.2007) have been performed to predict the dust temperature pro-files of starless cores whose outer surfaces are exposed to heat-ing by the local interstellar radiation field (ISRF). These calcu-lations generally find a significant drop in Td at the center ofstarless cores, but the actual magnitude of this temperature dropremained poorly constrained observationally before the adventof Herschel (see Ward-Thompson et al. 2002 for early resultswith ISO, however).
Here, we use Herschel observations to quantify the dust tem-perature gradient within two well-studied starless cores, B68 andL1689B. We introduce a simple yet powerful inversion tech-nique based on the Abel integral transform to simultaneously re-construct the 3D density and dust temperature profiles of densecores by using the inputs of Herschel maps in four bands be-tween 160 μm and 500 μm (also see Marsh et al. 2014 for an in-dependent approach of solving similar problem). The basic goalof the present paper is to demonstrate the performance of theAbel inversion technique. We apply our algorithm to B68 andL1689B and compare the results with previous infrared extinc-tion/absorption studies, which allow us to validate the dust opac-ity assumption made in earlier HGBS papers. We also test ourtechnique on synthetic core models with known density and tem-perature profiles. While the method assumes spherically sym-metric cores, we show that it yields satisfactory results for pro-late or oblate ellipsoidal cores with realistic aspect ratios thatare <∼2.
2. Herschel observations of B68 and L1689B
As part of the HGBS key project, two fields in the Pipeand Ophiuchus molecular cloud complexes containing B68 andL1689B with areas of ∼1.◦5× 1.◦5 and ∼3.◦0× 3.◦5 were observedfor an integration time of 2.6 and 10.2 h, respectively. These tar-get fields were mapped1 in two orthogonal scan directions at ascanning speed of 60′′ s−1 in parallel mode, acquiring data si-multaneously in five bands with the SPIRE (Griffin et al. 2010)and PACS (Poglitsch et al. 2010) bolometer cameras. The datawere reduced using HIPE version 7.0. The SPIRE data were pro-cessed with modified pipeline scripts. Observations during theturnaround of the telescope were included, and a destriper mod-ule with a zero-order polynomial baseline was applied. The de-fault “naïve” mapper was used to produce the final map. Forthe PACS data, we applied the standard HIPE data reduction
1 A more detailed description about the observations anddata reductions are available on the HGBS archives webpage:http://gouldbelt-herschel.cea.fr/archives. The reducedSPIRE/PACS maps for B68 and L1689B as well as the column densityand temperature maps can also be retrieved from the same website.
pipeline up to level 1 with improved calibration. Further process-ing of the data, such as subtraction of (thermal and non-thermal)low-frequency noise and map projection was performed withScanamorphos v11 (Roussel 2012). Note that the Scanamorphosmap-maker avoids any high-pass filtering, which is crucial forpreserving extended emission.
3. Description of the Abel inversion method
Consider a spherically symmetric core with radial density pro-file, ρ(r), embedded in a uniform background and isotropicISRF. Assuming optically thin dust emission, the specific inten-sity Iν(p) of the core when observed at impact parameter, p, maybe expressed as
Iν(p) = 2∫ +∞
pρ(r) Bν [Td(r)] κν
r dr√r2 − p2
+ Iν,bg + Iν,N, (1)
where Iν,bg and Iν,N represent the background emission and in-strumental noise, respectively, Bν[Td(r)] is the Planck functionfor the dust temperature Td(r) at radius r from core center,and κν is the frequency-dependent dust opacity2, which is as-sumed here to be uniform throughout the core. Given the sym-metry of the problem, we can use the inverse Abel transform(e.g. Bracewell 1986) to obtain the integrand of Eq. (1) at eachobserved frequency ν:
ρ(r) Bν [Td(r)] κν = −1π
∫ +∞r
dIνdp
dp√p2 − r2
· (2)
From Eq. (2), we see that the physical parameters of interest,ρ(r) and Td(r), only depend on the first derivatives of the ra-dial intensity profiles. With a pre-defined assumption about thedust opacity law κν, one may thus estimate Td(r) at each radius rby fitting a single-temperature modified blackbody to the SEDobtained from evaluating the right-hand side of Eq. (2) at eachobserved band between 160 μm and 500 μm (see Sect. 3.1 forfurther details). The density profile, ρ(r), can be derived simul-taneously from the normalization of the fit at each radius.
For simplicity, Eq. (1) above neglects the convolution withthe telescope beam. However, simulations confirm that beamsmearing has little effect in the case of well-resolved cores (seeAppendix B). In the case of starless cores, such as B68 andL1689B, with a flat inner density profile inside a radius Rflat,or angular radius θflat, we find that the beam effect can be pa-rameterized by the ratio θflat/HPBW (where HPBW is the half-power beam width), and that the reconstructed column densityprofile agrees with the intrinsic profile within 20% (in the ab-sence of noise) for θflat/HPBW >∼ 1 as is the case for B68and L1689B. More generally, simulations indicate that the re-constructed temperature and column density profiles essentiallycoincide with the corresponding intrinsic profiles convolved tothe effective beam resolution (see Appendix B) in the absence ofnoise. Importantly, our Abel inversion technique does not de-pend on the subtraction of a flat background level, since thederivative of a constant background3 does not contribute to theintegral of Eq. (2). The reconstruction is, however, quite sensi-tive to noise fluctuations in the outer parts of the core.
2 Note the dust-to-gas fraction of 1% is implicitly included in ourdefinition of the dust opacity (see also Sect. 3.1) so that ρ(r) representsthe radial gas density of the object.3 If the background is not flat, the input data can be pre-processed bysubtracting e.g., a linear plane.
A138, page 2 of 10
A. Roy et al.: Reconstructing density and temperature profiles
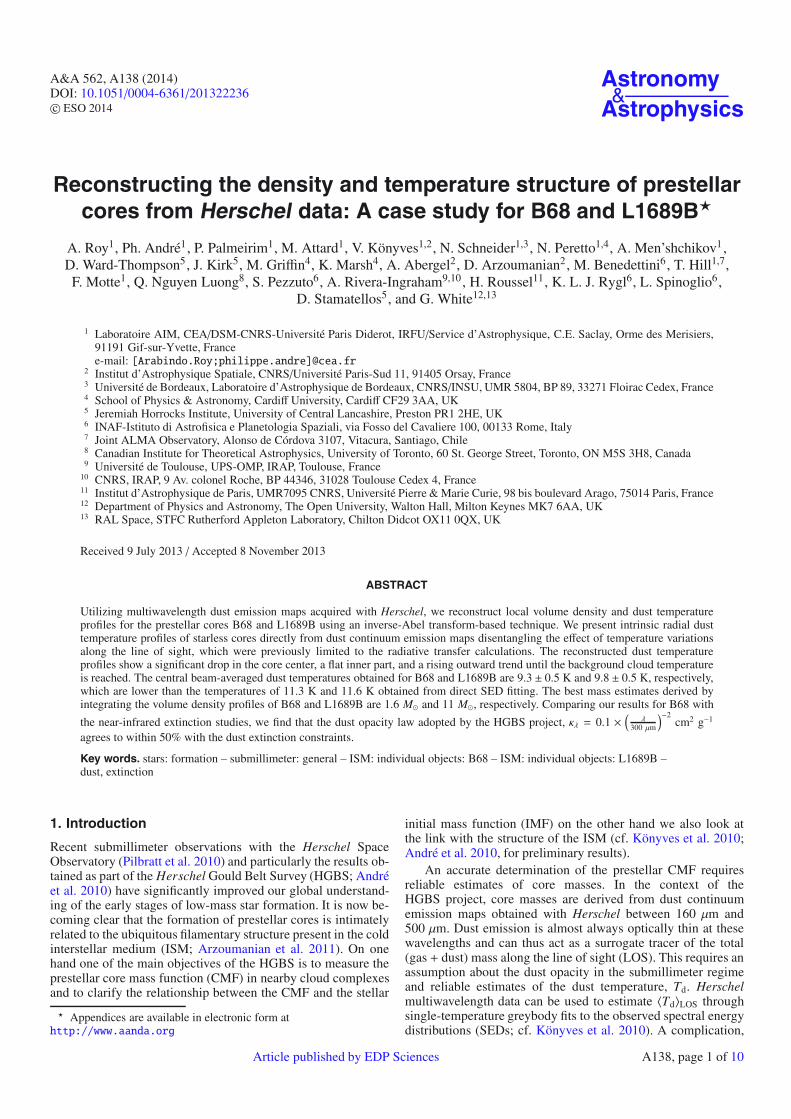
Fig. 1. Column density map (left) and LOS dust temperature map(right) of B68, which is derived by fitting modified blackbody SEDsto the Herschel data between 160 μm and 500 μm on a pixel-by-pixel basis (see Sect. 3.1 for details). The column density contoursgo from 1.6 × 10²¹ to 9.6 × 10²² in steps of 1.6 × 10²¹ in units ofH2 molecules per cm2 (left), and the temperature contours are 16, 15,14, and 13 K (right). The cross symbol shows the center of the coreobtained by fitting a 2D-Gaussian to the column density map.
Table 1. Planck offsets in MJy sr−1.
Target 160 μm 250 μm 350 μm 500 μm
B68 91.2 77.0 41.6 16.6L1689B 89.3 136.3 64.4 26.6
3.1. SED fitting and profile reconstruction
Column density and corresponding LOS-averaged dust temper-ature maps are shown in Figs. 1 and 3 for B68 and L1689B,respectively. They were obtained by fitting modified blackbodyfunctions to the Herschel SEDs longward of 160 μm on a pixel-by-pixel basis, as seen in earlier HGBS papers (Könyves et al.2010; see also Hill et al. 2011 for HOBYS). While fitting theSEDs, we weighted each data point by the corresponding cali-bration errors at SPIRE (∼10%) and PACS (∼15%) wavelengths.Appropriate zero-level offsets were added to each image (seeTable 1), which were obtained by correlating the Herschel datawith the Planck and IRAS data of the same fields (see Bernardet al. 2010). The same dust opacity law as in earlier HGBS (seealso Motte et al. 2010 for the HOBYS key program) papersis adopted in the present paper (similar to Hildebrand 1983):
κλ = 0.1 ×(
λ300 μm
)−βcm2 per g (of gas + dust) with a dust
emissivity index of β = 2. Our dust opacity value at the nor-malizing wavelength is also close to the Ossenkopf & Henning(1994) opacity model for dust grains with thin ice mantles. Amean molecular weight μH2 = 2.8 is assumed4 to express col-umn density in units of H2 molecules per cm2. Using our adopteddust opacity law, we find that even the central LOSs for B68 andL1689B with NH2 ≤ 5×1022 cm−2 has small optical depths�0.08at 160 μm, confirming that the core emission is optically thinlongward of 160 μm.
The same assumptions have been adopted for the modifiedblackbody fits required at each radius by the Abel inversion tech-nique. A single-temperature description of the SEDs is suitablein this case because we are sampling both local density and
4 Note that this differs from the first HGBS papers (e.g. André et al.2010; Könyves et al. 2010; Arzoumanian et al. 2011), where μ = 2.33was assumed and column density was expressed in units of mean freeparticles per cm2.
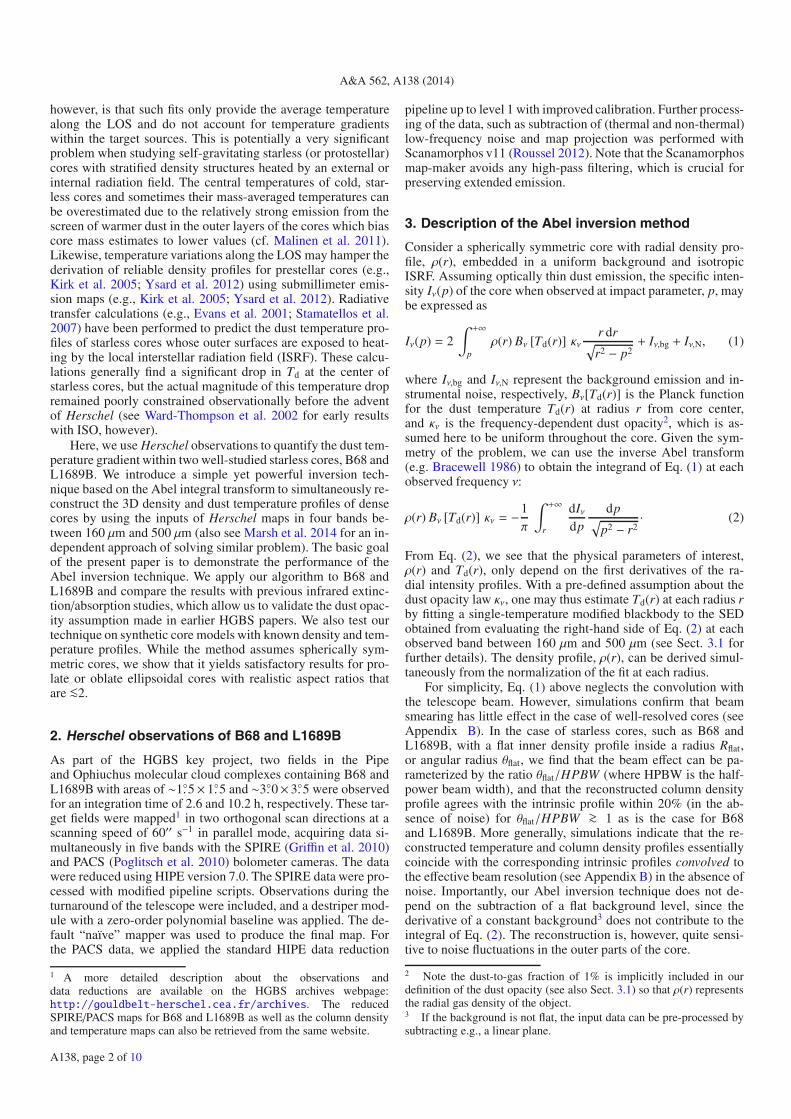
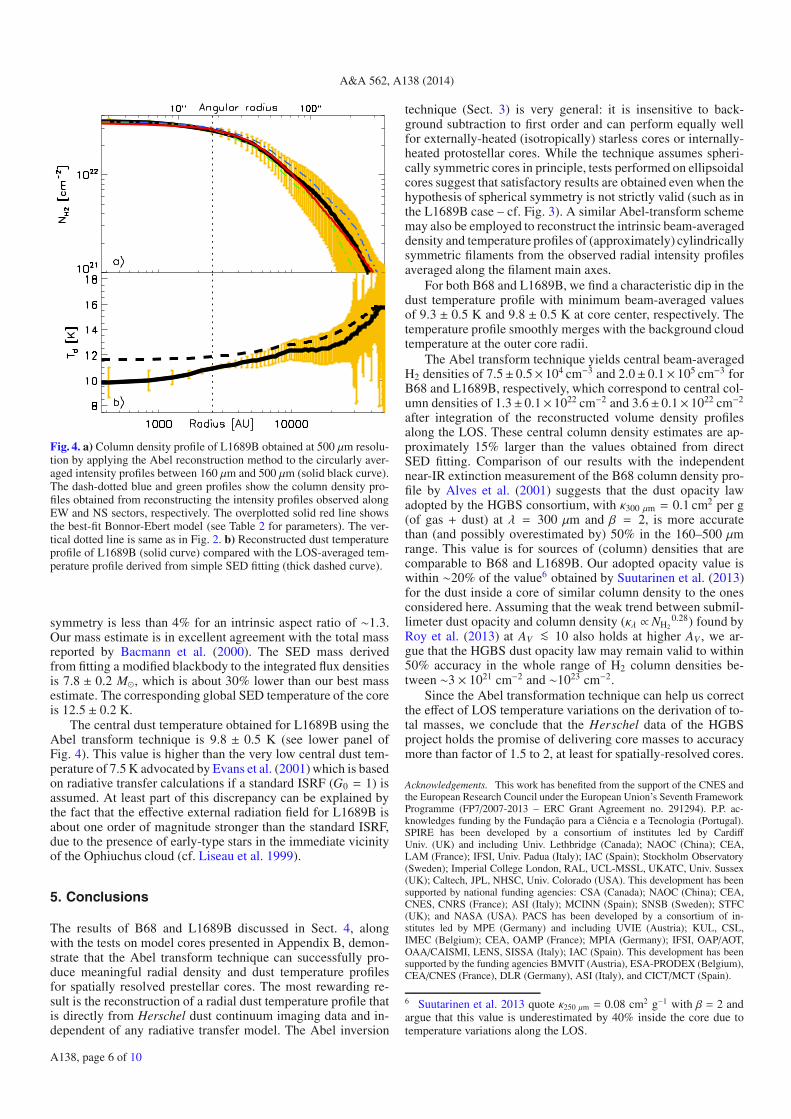
Fig. 2. Column density a) and dust temperature b) profiles of B68 ob-tained at 500 μm resolution by applying the Abel inversion method tothe circularly averaged intensity profiles observed with Herschel be-tween 160 μm and 500 μm. a) Comparison between the column den-sity profiles derived from the Abel reconstruction (solid black line) andLOS-averaged SED fitting (thick dashed line). The red curve shows thebest-fit Bonnor-Ebert model to the Abel-inverted profile (see Table 2for parameters). The vertical dotted line represents the half powerbeam radius of 36.′′3/2 (effective 500 μm resolution). b) Comparison ofthe Abel-inverted (solid line) and LOS-averaged SED (dashed curve)temperature profiles. The error bars represent the standard deviationof NH2 (r) and Td(r) values obtained from independent profile recon-structions along sixteen angular directions.
dust temperature at a given radius r. Prior to the SED fitting,the Herschel data are convolved to a common resolution of ei-ther 36.′′3 (i.e., HPBW resolution of SPIRE at 500 μm) or 24.′′9(i.e., HPBW resolution of SPIRE at 350 μm when the 500 μmdata are not used). At each wavelength, a circularly averagedintensity profile about the core center is first derived from theHerschel data, and the derivative of this average profile is thennumerically evaluated and integrated over the kernel shown inthe right-hand side of Eq. (2). The central position of the core isobtained from fitting a 2D-Gaussian model to the column den-sity map (see the cross symbols in Figs. 1 and 3 for B68 andL1689B, respectively). The integration is performed up to anouter radius corresponding to ∼2–2.5 times the FWHM diam-eter of the core as estimated from the 2D-Gaussian fit to thecolumn density map. In practice, the integral on the right-handside of Eq. (2) converges rapidly and does not depend much onthe precise value of the integration outer radius as long as it en-compasses the entire core – see Appendix A and Fig. A.1.
3.2. Assessment of uncertainties
The errors bars on the reconstructed profiles at each radius canbe estimated from the standard deviations of the density andtemperature profiles obtained by repeating the Abel reconstruc-tion along different angular directions around the source (i.e.,averaging the data separately over a series of angular sectors in-stead of circularly averaging the data). In the case of the recon-structed profiles of B68 and L1689B as shown in Figs. 2 and 4,
A138, page 3 of 10
A&A 562, A138 (2014)
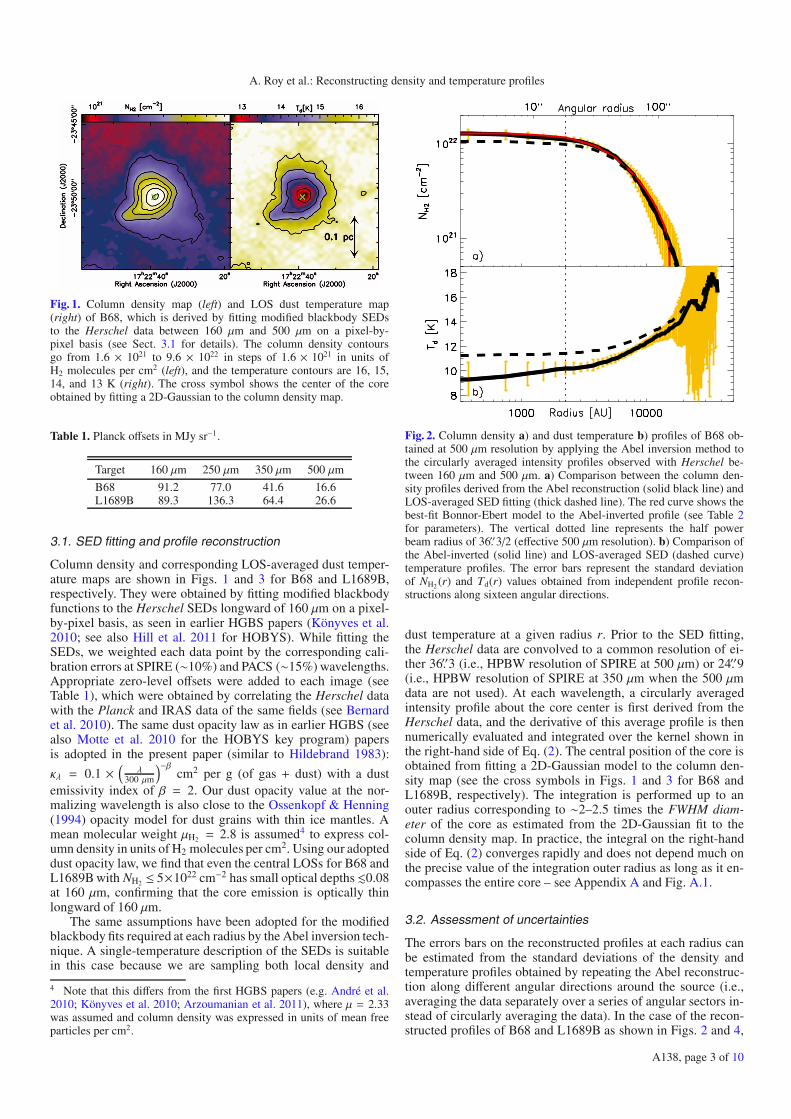
Fig. 3. Same as Fig. 1 but for L1689B. The column density contoursare 6 × 10²¹, 1 × 10²², 1.4 × 10²², 1.8 × 10²², and 2.6 × 10²² H2 cm−2
(left), and the temperature contours are 16.5, 15.5, 14.5, and 13.5 K(right). The column density image shows that L1689B is embedded in-side a filamentary structure.
sixteen equally-spaced angular sectors were used to derive theerror bars. The errors we report on the best estimates of the (col-umn) density and temperature at core center correspond to thestandard error in the mean, σ/
√n, where n is the number of in-
dependently measured sectors.The uncertainty in the normalization of the dust opacity law
directly affects the column density estimates but not the tem-perature estimates, whereas the uncertainty in the emissivityindex β influences both the dust temperature and the columndensity estimates in an anti-correlated fashion. When β is var-ied from 2 to 1.5, for instance, the dust temperature increasesby ∼10% and the column density decreases by ∼40%. The un-certainty in the central position of the core also introduces errorson the derived parameters. To assess the magnitude of this effectin the case of B68, we varied the central position within a ra-dius of 6′′ and found that the resulting central dust temperatureand central column density had standard deviations of ±0.3 Kand ±0.04 × 1022 cm−2, respectively. Additionally, departuresfrom spherical symmetry due to asymmetries in the density dis-tribution (cf. L1689B in Fig. 3) or an anisotropic backgroundradiation field (cf. Nielbock et al. 2012) may break the symme-try of the quantity ρ(r)Bν(T (r)) in Eqs. (1) and (2), introducingadditional errors. In principle the latter are included in the errorbars estimated from the fluctuations of the radial profiles recon-structed along various angular directions. Moreover, we show inAppendix B that cores with moderate departures from sphericalsymmetry (such as prolate or oblate ellipsoidal cores with aspectratios <∼2) can be reconstructed with reasonable accuracy.
For both B68 and L1689B, the net measurement errors inthe derived central Td and NH2 values are estimated to be ±0.5 Kand ±0.1×1022 cm−2, respectively, excluding the systematic un-certainties associated with our assumptions on the dust opacityand the calibration errors. In Appendix B.1 we show that thecalibration errors lead to an additional uncertainty of ∼12% oncolumn density and ∼5% on temperature estimates.
4. Detailed results for B68 and L1689B
4.1. B68 core
B68 is a well studied isolated bok globule in the Pipe nebulacloud complex (e.g. Alves et al. 2001; Nielbock et al. 2012).We adopt a distance of 125 pc (de Geus et al. 1989) for thepresent study. Figure 2 shows the reconstructed column density
and temperature profiles obtained from our Herschel observa-tions of B68 with the Abel inversion method described as inSect. 3.
In Fig. 2b, the Abel-inverted radial dust temperature profile(solid curve) is compared with the LOS-averaged SED tempera-ture profile (dashed curve). While both temperature profiles ex-hibit similar features with a broad minimum around the corecenter, a positive gradient outside the flat inner plateau of thecolumn density profile, and similar values (Td ∼ 16.5 ± 2 K)at large radii, the minimum Abel-reconstructed temperature atcore center is ∼2 K lower than the minimum SED tempera-ture observed through the central LOS. Accordingly, the cen-tral column density derived with the Abel inversion method(1.3 ± 0.1 × 1022 cm−2) is 30% higher than the LOS-averagedcolumn density of ∼1.0 × 1022 cm−2 that is derived from stan-dard SED fitting for the central LOS. The difference between theAbel-reconstructed and the LOS-averaged column density be-comes negligible in the outer parts of the core. This is indicativeof stronger temperature variations along the central LOS com-pared to the outer LOSs.
Recently, Nielbock et al. (2012) constrained the dust tem-perature and volume density profiles of B68 using an iterativeapproach based on 3D radiative transfer modeling of multiwave-length dust continuum data. This included Herschel observationsthat were obtained as a part of the EPoS (Launhardt et al. 2013)key project. They employed a 3-dimensional grid of Plummer-like (Plummer 1911) density profiles and obtained initial guessesof the parameters from LOS-averaged SED fits. Altogether theirmodel was tuned with eight free parameters, yielding a cen-tral dust temperature of Td = 8.2+2.1
−0.7 K. The primary reason forthe dispersion in the central dust temperature in Nielbock et al.(2012) is the uncertainty of a factor of ∼2 on the dust opacityin the infrared regime. Although we obtain a higher central dusttemperature, Td = 9.3 ± 0.5 K, with our Abel-inversion method,our results agree with the Nielbock et al. analysis within therange of the quoted uncertainties.
Based on extinction measurements (Alves et al. 2001), thecolumn density profile of B68 closely resembles that of aBonnor-Ebert (BE; e.g., Bonnor 1956) isothermal sphere witha flattened inner region. The overplotted red curve in Fig. 2shows the best-fit BE model to the reconstructed column den-sity profile. The best-fit BE parameters along with the physi-cal properties that follow directly from the fit such as the radiusof the flat inner plateau, Rflat ≡ 2 cs/
√4πGρc, the density con-
trast, ρc/ρs, and the external pressure, Pext, are summarized inTable 2. They are consistent with the BE parameters found byAlves et al. (2001).
The NH2 column density profile obtained by integrating theAbel-inverted volume density profile is shown in Fig. 2. Thiscan be directly compared with the near-infrared extinction re-sults Alves et al. (2001) because extinction traces material in-dependently of temperature. For this comparison, we adopted astandard conversion factor, NH2 /AV of 9.4 × 1020 cm−2 mag−1
(Bohlin et al. 1978), to translate column density to equiva-lent visual extinction AV at low column densities (i.e., NH2
<∼6 × 1021 cm−2). For higher column densities, we used the con-version NH2 /AV = 6.9 × 1020 cm−2 mag−1 given by Draine(2003) and later adopted by Evans et al. (2009), which is consis-tent with an extinction curve with a total-to-selective extinction,RV ≡ AV/E(B − V) = 5.5 that is appropriate in higher densityregions.
Using the Bohlin conversion factor, we obtain an AVof 3.2 mag at a radius of 104 AU, which agrees within ∼60%with the value of 5 mag reported by Alves et al. (2001) at the
A138, page 4 of 10
A. Roy et al.: Reconstructing density and temperature profiles
Table 2. Best-fit parameters of Bonnor-Ebert core models for B68 and L1689B.
Source ξmax ρc/ρsa cs
b Pext Rflatc Rout nc
profile (km s−1) (K cm−3) (AU) (AU) (cm−3)×104 ×103 ×104 ×104
B68 7.0 ± 0.1 17 0.17 3.9 4.4 1.5 8.3
L1689B-C 16.6 ± 0.7 145 0.27 2.9 4.5 3.7 20
L1689B-NS 13.5 ± 0.3 88 0.24 3.2 4.4 2.9 17
L1689B-EW 16.2 ± 1.7 137 0.26 2.2 4.7 3.8 16.5
Notes. (a) ρc and ρs denote central density and density at the outer surface of the BE sphere, respectively. (b) Isothermal sound speed. (c) Flat innerradius, defined as Rflat ≡ 2 cs/
√4πGρc.
same radius. Furthermore, if we correct our estimate for theweak empirical trend between submillimeter dust opacity andcolumn density, κλ ∝NH2
0.28, as inferred by Roy et al. (2013)in the regime of 1 <∼ AV <∼ 10 and interpreted as evidenceof dust grain evolution, then we find a corrected column den-sity Ncorr
H2≈ 5 × 1021 cm−2, which is equivalent to a corrected
AcorrV = 5.3 mag. This is in excellent (10%) agreement with Alves
et al. (2001) at 104 AU.Using the Draine conversion factor, we derive an AV of 19±
2 mag through the center of the B68 core as compared to the AVof 30 mag obtained from extinction by Alves et al. (2001), cor-responding to a 60% agreement. However, the effective angularresolution of the Alves et al. extinction map was about ∼10′′, ap-proximately four times higher than the beam resolution (36.′′3) ofSPIRE at 500 μm. For better comparison, we performed a sim-ilar Abel reconstruction analysis at the beam resolution (24.′′9)of the SPIRE 350 μm observations, ignoring the 500 μm data.In this case, the central Abel-reconstructed column density cor-responds to AV = 20 ± 2 mag, which agrees within 50% withthe results of Alves et al. (2001). (The central dust temperaturederived at 350 μm resolution coincides within the uncertaintieswith the 500 μm resolution estimate.)
Likewise, the total mass of 1.6 ± 0.07 M�, which is de-rived by integrating the Abel-reconstructed density profile ofB68 within the outer radius of 1.4 × 10⁴ AU, agrees within 30%with the mass of 2.1 M� as obtained by Alves et al. (2001)from the extinction data. For comparison, the mass derivedfrom fitting a modified blackbody to the integrated flux densi-ties is 1.4 ± 0.05 M�. The latter does not account for tempera-ture variations along the LOS and thus slightly underestimatesthe intrinsic total mass of the core. For a moderate density coresuch as B68, however, we stress that the global SED temperature(12.5±0.1 K here) is close to the mass-averaged dust temperatureand the SED mass agrees within∼15% of the Abel-reconstructedmass.
Using the above results on the density and temperaturestructure, we can check the energy balance of the B68 core.Assuming optically thin submillimeter emission, a total outputluminosity of 0.35±0.04 L� is obtained by integrating the quan-tity 4π
∫ρ(r)Bν[Td(r)]κνdν over the volume of the core. A very
similar output luminosity (0.41 ± 0.05 L�) is estimated by inte-grating the observed SED over wavelengths. These output esti-mates should be compared to the input luminosity of ∼0.40 L�provided to the core by the local ISRF (Mathis et al. 1983; withG0 ∼ 1), which are calculated from the total ISRF flux densitythat is absorbed5 by a spherical object with the same density
5 The ISRF energy is mostly absorbed at short wavelengths (0.095 μmto 100 μm). In calculating the absorbed energy we adopted the dustabsorption model of Draine (2003) with RV = 3.1.
profile and outer radius as B68 using Eq. (4) of Lehtinen et al.(1998). Note that the three luminosity values above agree withone another.
4.2. L1689B
Compared to B68, L1689B is a slightly denser and morecentrally condensed core (e.g. André et al. 1996; Bacmannet al. 2000) located in the Ophiuchus complex at a distanceof ∼140 pc. The Herschel images reveal that it is embeddedwithin a larger-scale filamentary structure (see Fig. 3). Giventhe elongated morphology that is observed in the plane of thesky and the mean apparent aspect ratio ∼1.3 of the core, the hy-pothesis of spherical symmetry underlying Eq. (1) is not strictlyverified.
To assess the validity of our Abel-inversion scheme in thiscase, we therefore performed test reconstructions for prolate andoblate ellipsoidal model cores with similar aspect ratios. Thesetests suggest that small departures from spherical symmetry havelittle impact on the reconstruction results (see Appendix B).
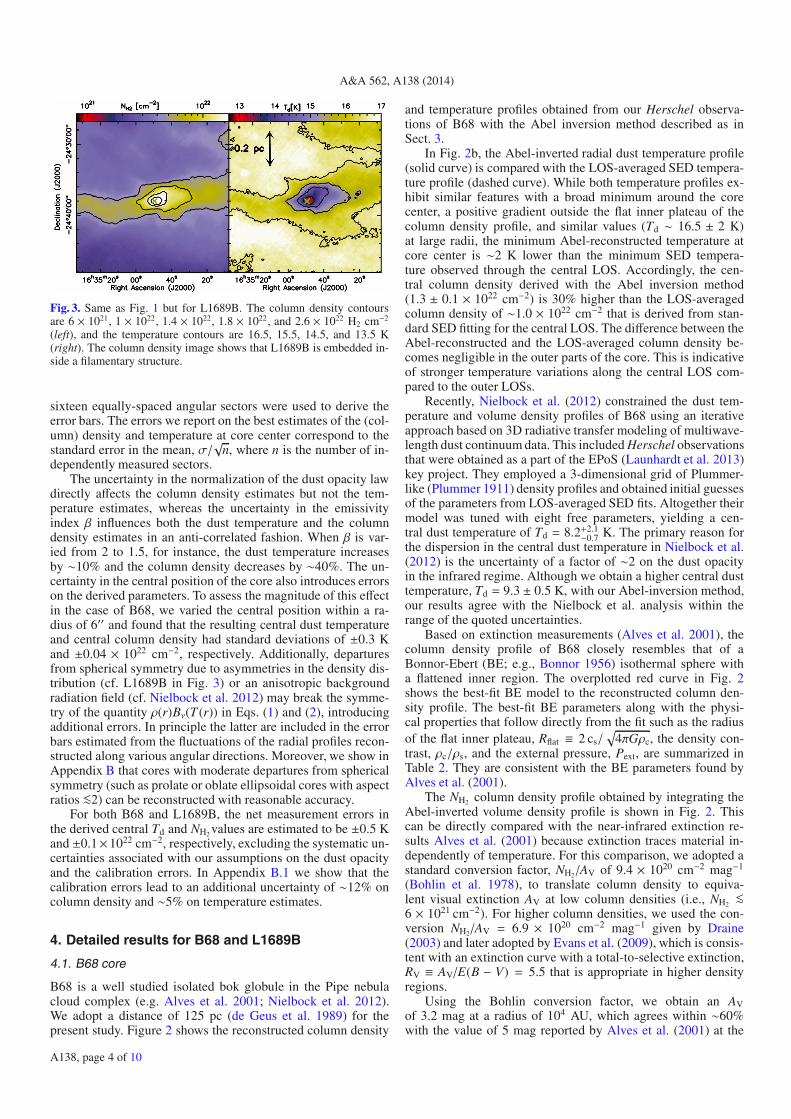
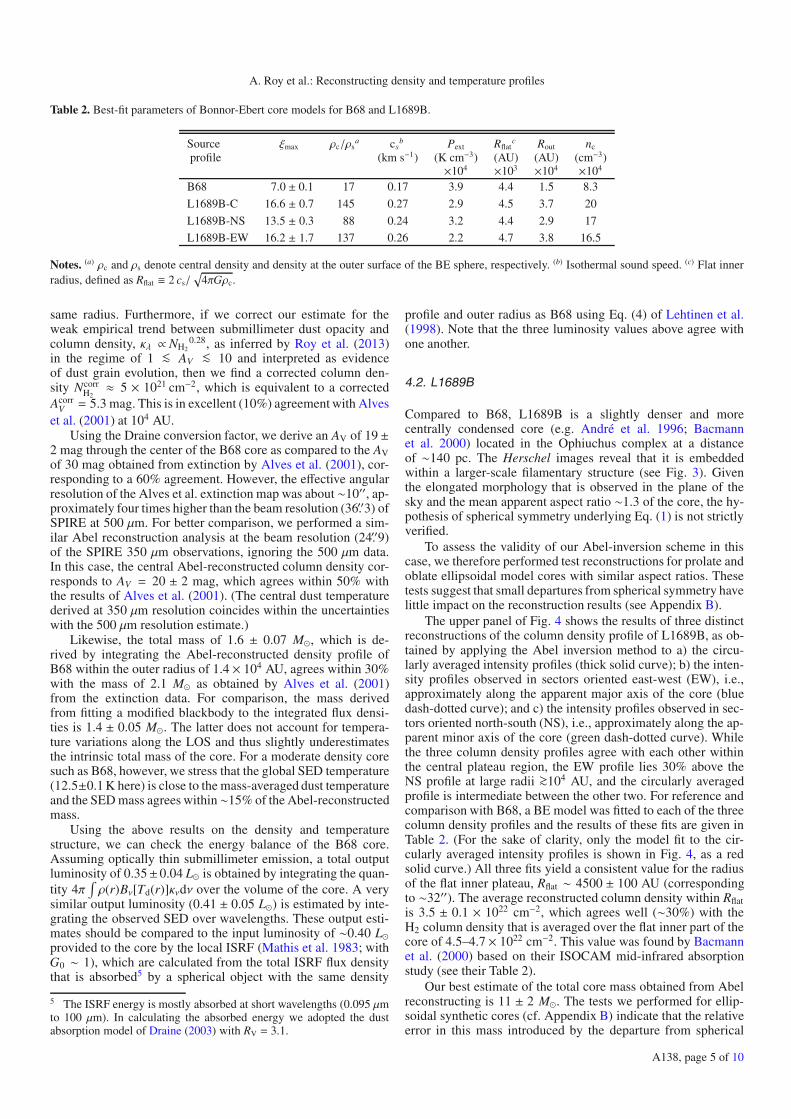
The upper panel of Fig. 4 shows the results of three distinctreconstructions of the column density profile of L1689B, as ob-tained by applying the Abel inversion method to a) the circu-larly averaged intensity profiles (thick solid curve); b) the inten-sity profiles observed in sectors oriented east-west (EW), i.e.,approximately along the apparent major axis of the core (bluedash-dotted curve); and c) the intensity profiles observed in sec-tors oriented north-south (NS), i.e., approximately along the ap-parent minor axis of the core (green dash-dotted curve). Whilethe three column density profiles agree with each other withinthe central plateau region, the EW profile lies 30% above theNS profile at large radii >∼104 AU, and the circularly averagedprofile is intermediate between the other two. For reference andcomparison with B68, a BE model was fitted to each of the threecolumn density profiles and the results of these fits are given inTable 2. (For the sake of clarity, only the model fit to the cir-cularly averaged intensity profiles is shown in Fig. 4, as a redsolid curve.) All three fits yield a consistent value for the radiusof the flat inner plateau, Rflat ∼ 4500 ± 100 AU (correspondingto ∼32′′). The average reconstructed column density within Rflatis 3.5 ± 0.1 × 1022 cm−2, which agrees well (∼30%) with theH2 column density that is averaged over the flat inner part of thecore of 4.5–4.7 × 1022 cm−2. This value was found by Bacmannet al. (2000) based on their ISOCAM mid-infrared absorptionstudy (see their Table 2).
Our best estimate of the total core mass obtained from Abelreconstructing is 11 ± 2 M�. The tests we performed for ellip-soidal synthetic cores (cf. Appendix B) indicate that the relativeerror in this mass introduced by the departure from spherical
A138, page 5 of 10
A&A 562, A138 (2014)
Fig. 4. a) Column density profile of L1689B obtained at 500 μm resolu-tion by applying the Abel reconstruction method to the circularly aver-aged intensity profiles between 160 μm and 500 μm (solid black curve).The dash-dotted blue and green profiles show the column density pro-files obtained from reconstructing the intensity profiles observed alongEW and NS sectors, respectively. The overplotted solid red line showsthe best-fit Bonnor-Ebert model (see Table 2 for parameters). The ver-tical dotted line is same as in Fig. 2. b) Reconstructed dust temperatureprofile of L1689B (solid curve) compared with the LOS-averaged tem-perature profile derived from simple SED fitting (thick dashed curve).
symmetry is less than 4% for an intrinsic aspect ratio of ∼1.3.Our mass estimate is in excellent agreement with the total massreported by Bacmann et al. (2000). The SED mass derivedfrom fitting a modified blackbody to the integrated flux densitiesis 7.8 ± 0.2 M�, which is about 30% lower than our best massestimate. The corresponding global SED temperature of the coreis 12.5 ± 0.2 K.
The central dust temperature obtained for L1689B using theAbel transform technique is 9.8 ± 0.5 K (see lower panel ofFig. 4). This value is higher than the very low central dust tem-perature of 7.5 K advocated by Evans et al. (2001) which is basedon radiative transfer calculations if a standard ISRF (G0 = 1) isassumed. At least part of this discrepancy can be explained bythe fact that the effective external radiation field for L1689B isabout one order of magnitude stronger than the standard ISRF,due to the presence of early-type stars in the immediate vicinityof the Ophiuchus cloud (cf. Liseau et al. 1999).
5. Conclusions
The results of B68 and L1689B discussed in Sect. 4, alongwith the tests on model cores presented in Appendix B, demon-strate that the Abel transform technique can successfully pro-duce meaningful radial density and dust temperature profilesfor spatially resolved prestellar cores. The most rewarding re-sult is the reconstruction of a radial dust temperature profile thatis directly from Herschel dust continuum imaging data and in-dependent of any radiative transfer model. The Abel inversion
technique (Sect. 3) is very general: it is insensitive to back-ground subtraction to first order and can perform equally wellfor externally-heated (isotropically) starless cores or internally-heated protostellar cores. While the technique assumes spheri-cally symmetric cores in principle, tests performed on ellipsoidalcores suggest that satisfactory results are obtained even when thehypothesis of spherical symmetry is not strictly valid (such as inthe L1689B case – cf. Fig. 3). A similar Abel-transform schememay also be employed to reconstruct the intrinsic beam-averageddensity and temperature profiles of (approximately) cylindricallysymmetric filaments from the observed radial intensity profilesaveraged along the filament main axes.
For both B68 and L1689B, we find a characteristic dip in thedust temperature profile with minimum beam-averaged valuesof 9.3 ± 0.5 K and 9.8 ± 0.5 K at core center, respectively. Thetemperature profile smoothly merges with the background cloudtemperature at the outer core radii.
The Abel transform technique yields central beam-averagedH2 densities of 7.5± 0.5× 104 cm−3 and 2.0± 0.1× 105 cm−3 forB68 and L1689B, respectively, which correspond to central col-umn densities of 1.3± 0.1× 1022 cm−2 and 3.6± 0.1× 1022 cm−2
after integration of the reconstructed volume density profilesalong the LOS. These central column density estimates are ap-proximately 15% larger than the values obtained from directSED fitting. Comparison of our results with the independentnear-IR extinction measurement of the B68 column density pro-file by Alves et al. (2001) suggests that the dust opacity lawadopted by the HGBS consortium, with κ300 μm = 0.1 cm2 per g(of gas + dust) at λ = 300 μm and β = 2, is more accuratethan (and possibly overestimated by) 50% in the 160–500 μmrange. This value is for sources of (column) densities that arecomparable to B68 and L1689B. Our adopted opacity value iswithin ∼20% of the value6 obtained by Suutarinen et al. (2013)for the dust inside a core of similar column density to the onesconsidered here. Assuming that the weak trend between submil-limeter dust opacity and column density (κλ ∝NH2
0.28) found byRoy et al. (2013) at AV <∼ 10 also holds at higher AV , we ar-gue that the HGBS dust opacity law may remain valid to within50% accuracy in the whole range of H2 column densities be-tween ∼3 × 1021 cm−2 and ∼1023 cm−2.
Since the Abel transformation technique can help us correctthe effect of LOS temperature variations on the derivation of to-tal masses, we conclude that the Herschel data of the HGBSproject holds the promise of delivering core masses to accuracymore than factor of 1.5 to 2, at least for spatially-resolved cores.
Acknowledgements. This work has benefited from the support of the CNES andthe European Research Council under the European Union’s Seventh FrameworkProgramme (FP7/2007-2013 – ERC Grant Agreement no. 291294). P.P. ac-knowledges funding by the Fundação para a Ciência e a Tecnologia (Portugal).SPIRE has been developed by a consortium of institutes led by CardiffUniv. (UK) and including Univ. Lethbridge (Canada); NAOC (China); CEA,LAM (France); IFSI, Univ. Padua (Italy); IAC (Spain); Stockholm Observatory(Sweden); Imperial College London, RAL, UCL-MSSL, UKATC, Univ. Sussex(UK); Caltech, JPL, NHSC, Univ. Colorado (USA). This development has beensupported by national funding agencies: CSA (Canada); NAOC (China); CEA,CNES, CNRS (France); ASI (Italy); MCINN (Spain); SNSB (Sweden); STFC(UK); and NASA (USA). PACS has been developed by a consortium of in-stitutes led by MPE (Germany) and including UVIE (Austria); KUL, CSL,IMEC (Belgium); CEA, OAMP (France); MPIA (Germany); IFSI, OAP/AOT,OAA/CAISMI, LENS, SISSA (Italy); IAC (Spain). This development has beensupported by the funding agencies BMVIT (Austria), ESA-PRODEX (Belgium),CEA/CNES (France), DLR (Germany), ASI (Italy), and CICT/MCT (Spain).
6 Suutarinen et al. 2013 quote κ250 μm = 0.08 cm2 g−1 with β = 2 andargue that this value is underestimated by 40% inside the core due totemperature variations along the LOS.
A138, page 6 of 10
A. Roy et al.: Reconstructing density and temperature profiles
References
Alves, J. F., Lada, C. J., & Lada, E. A. 2001, Nature, 409, 159André, P., Ward-Thompson, D., & Motte, F. 1996, A&A, 314, 625André, P., Bouwman, J., Belloche, A., & Hennebelle, P. 2003, in Proc. SFChem
2002: Chemistry as a Diagnostic of Star Formation, eds. C. L. Curry, &M. Fich (Ottawa: NRC Press), 127
André, P., Men’shchikov, A., Bontemps, S., et al. 2010, A&A, 518, L102Arzoumanian, D., André, P., Didelon, P., et al. 2011, A&A, 529, L6Bacmann, A., André, P., Puget, J.-L., et al. 2000, A&A, 361, 555Bernard, J.-P., Paradis, D., Marshall, D. J., et al. 2010, A&A, 518, L88Bohlin, R. C., Savage, B. D., & Drake, J. F. 1978, ApJ, 224, 132Bonnor, W. B. 1956, MNRAS, 116, 351Bouwman, J., Meeus, G., de Koter, A., et al. 2001, A&A, 375, 950Bracewell, R. N. 1986, The Fourier Transform and its applications, 2nd edn.
(New York: McGraw-Hill)de Geus, E. J., de Zeeuw, P. T., & Lub, J. 1989, A&A, 216, 44Draine, B. T. 2003, ARA&A, 41, 241Evans, II, N. J., Rawlings, J. M. C., Shirley, Y. L., & Mundy, L. G. 2001, ApJ,
557, 193Evans, II, N. J., Dunham, M. M., Jørgensen, J. K., et al. 2009, ApJS, 181, 321Griffin, M. J., Abergel, A., Abreu, A., et al. 2010, A&A, 518, L3Hildebrand, R. H. 1983, QJRAS, 24, 267Hill, T., Motte, F., Didelon, P., et al. 2011, A&A, 533, A94
Kirk, J. M., Ward-Thompson, D., & André, P. 2005, MNRAS, 360, 1506Könyves, V., André, P., Men’shchikov, A., et al. 2010, A&A, 518, L106Launhardt, R., Stutz, A. M., Schmiedeke, A., et al. 2013, A&A, 551, A98Lehtinen, K., Lemke, D., Mattila, K., & Haikala, L. K. 1998, A&A, 333, 702Liseau, R., White, G. J., Larsson, B., et al. 1999, A&A, 344, 342Malinen, J., Juvela, M., Collins, D. C., Lunttila, T., & Padoan, P. 2011, A&A,
530, A101Marsh, K. A., Griffin, M. J., André, P., et al. 2014, MNRAS, submitted
[arXiv:1401.7871]Mathis, J. S., Mezger, P. G., & Panagia, N. 1983, A&A, 128, 212Men’shchikov, A., André, P., Didelon, P., et al. 2012, A&A, 542, A81Motte, F., Zavagno, A., Bontemps, S., et al. 2010, A&A, 518, L77Nielbock, M., Launhardt, R., Steinacker, J., et al. 2012, A&A, 547, A11Ossenkopf, V., & Henning, T. 1994, A&A, 291, 943Pilbratt, G. L., Riedinger, J. R., Passvogel, T., et al. 2010, A&A, 518, L1Plummer, H. C. 1911, MNRAS, 71, 460Poglitsch, A., Waelkens, C., Geis, N., et al. 2010, A&A, 518, L2Roussel, H. 2012, PASP, 125, 1126Roy, A., Martin, P. G., Polychroni, D., et al. 2013, ApJ, 763, 55Stamatellos, D., Whitworth, A. P., & Ward-Thompson, D. 2007, MNRAS, 379,
1390Suutarinen, A., Haikala, L. K., Harju, J., et al. 2013, A&A, 555, A140Ward-Thompson, D., André, P., & Kirk, J. M. 2002, MNRAS, 329, 257Ysard, N., Juvela, M., Demyk, K., et al. 2012, A&A, 542, A21
Pages 8 to 10 are available in the electronic edition of the journal at http://www.aanda.org
A138, page 7 of 10
A&A 562, A138 (2014)
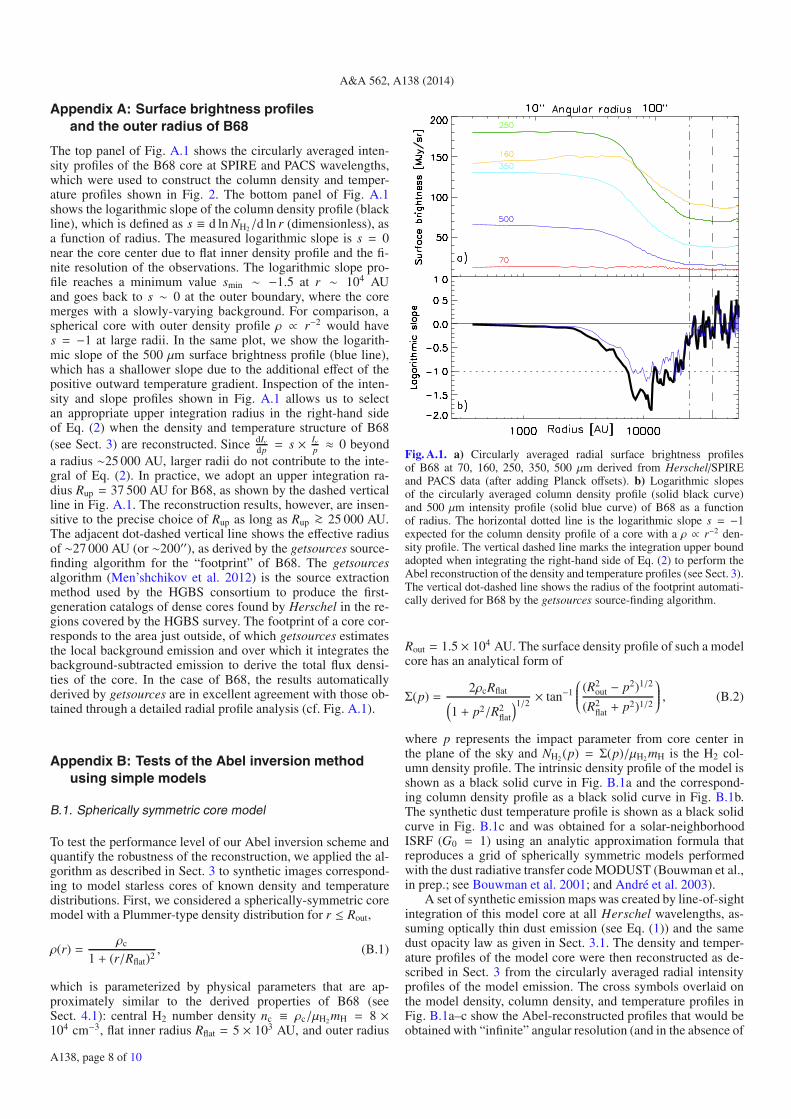
Appendix A: Surface brightness profilesand the outer radius of B68
The top panel of Fig. A.1 shows the circularly averaged inten-sity profiles of the B68 core at SPIRE and PACS wavelengths,which were used to construct the column density and temper-ature profiles shown in Fig. 2. The bottom panel of Fig. A.1shows the logarithmic slope of the column density profile (blackline), which is defined as s ≡ d ln NH2/d ln r (dimensionless), asa function of radius. The measured logarithmic slope is s = 0near the core center due to flat inner density profile and the fi-nite resolution of the observations. The logarithmic slope pro-file reaches a minimum value smin ∼ −1.5 at r ∼ 104 AUand goes back to s ∼ 0 at the outer boundary, where the coremerges with a slowly-varying background. For comparison, aspherical core with outer density profile ρ ∝ r−2 would haves = −1 at large radii. In the same plot, we show the logarith-mic slope of the 500 μm surface brightness profile (blue line),which has a shallower slope due to the additional effect of thepositive outward temperature gradient. Inspection of the inten-sity and slope profiles shown in Fig. A.1 allows us to selectan appropriate upper integration radius in the right-hand sideof Eq. (2) when the density and temperature structure of B68(see Sect. 3) are reconstructed. Since dIν
dp = s × Iνp ≈ 0 beyond
a radius ∼25 000 AU, larger radii do not contribute to the inte-gral of Eq. (2). In practice, we adopt an upper integration ra-dius Rup = 37 500 AU for B68, as shown by the dashed verticalline in Fig. A.1. The reconstruction results, however, are insen-sitive to the precise choice of Rup as long as Rup >∼ 25 000 AU.The adjacent dot-dashed vertical line shows the effective radiusof ∼27 000 AU (or ∼200′′), as derived by the getsources source-finding algorithm for the “footprint” of B68. The getsourcesalgorithm (Men’shchikov et al. 2012) is the source extractionmethod used by the HGBS consortium to produce the first-generation catalogs of dense cores found by Herschel in the re-gions covered by the HGBS survey. The footprint of a core cor-responds to the area just outside, of which getsources estimatesthe local background emission and over which it integrates thebackground-subtracted emission to derive the total flux densi-ties of the core. In the case of B68, the results automaticallyderived by getsources are in excellent agreement with those ob-tained through a detailed radial profile analysis (cf. Fig. A.1).
Appendix B: Tests of the Abel inversion methodusing simple models
B.1. Spherically symmetric core model
To test the performance level of our Abel inversion scheme andquantify the robustness of the reconstruction, we applied the al-gorithm as described in Sect. 3 to synthetic images correspond-ing to model starless cores of known density and temperaturedistributions. First, we considered a spherically-symmetric coremodel with a Plummer-type density distribution for r ≤ Rout,
ρ(r) =ρc
1 + (r/Rflat)2, (B.1)
which is parameterized by physical parameters that are ap-proximately similar to the derived properties of B68 (seeSect. 4.1): central H2 number density nc ≡ ρc/μH2 mH = 8 ×104 cm−3, flat inner radius Rflat = 5 × 10³ AU, and outer radius
Fig. A.1. a) Circularly averaged radial surface brightness profilesof B68 at 70, 160, 250, 350, 500 μm derived from Herschel/SPIREand PACS data (after adding Planck offsets). b) Logarithmic slopesof the circularly averaged column density profile (solid black curve)and 500 μm intensity profile (solid blue curve) of B68 as a functionof radius. The horizontal dotted line is the logarithmic slope s = −1expected for the column density profile of a core with a ρ ∝ r−2 den-sity profile. The vertical dashed line marks the integration upper boundadopted when integrating the right-hand side of Eq. (2) to perform theAbel reconstruction of the density and temperature profiles (see Sect. 3).The vertical dot-dashed line shows the radius of the footprint automati-cally derived for B68 by the getsources source-finding algorithm.
Rout = 1.5 × 10⁴ AU. The surface density profile of such a modelcore has an analytical form of
Σ(p) =2ρcRflat(
1 + p2/R2flat
)1/2 × tan−1
⎛⎜⎜⎜⎜⎝ (R2out − p2)1/2
(R2flat + p2)1/2
⎞⎟⎟⎟⎟⎠ , (B.2)
where p represents the impact parameter from core center inthe plane of the sky and NH2 (p) = Σ(p)/μH2 mH is the H2 col-umn density profile. The intrinsic density profile of the model isshown as a black solid curve in Fig. B.1a and the correspond-ing column density profile as a black solid curve in Fig. B.1b.The synthetic dust temperature profile is shown as a black solidcurve in Fig. B.1c and was obtained for a solar-neighborhoodISRF (G0 = 1) using an analytic approximation formula thatreproduces a grid of spherically symmetric models performedwith the dust radiative transfer code MODUST (Bouwman et al.,in prep.; see Bouwman et al. 2001; and André et al. 2003).
A set of synthetic emission maps was created by line-of-sightintegration of this model core at all Herschel wavelengths, as-suming optically thin dust emission (see Eq. (1)) and the samedust opacity law as given in Sect. 3.1. The density and temper-ature profiles of the model core were then reconstructed as de-scribed in Sect. 3 from the circularly averaged radial intensityprofiles of the model emission. The cross symbols overlaid onthe model density, column density, and temperature profiles inFig. B.1a–c show the Abel-reconstructed profiles that would beobtained with “infinite” angular resolution (and in the absence of
A138, page 8 of 10
A. Roy et al.: Reconstructing density and temperature profiles
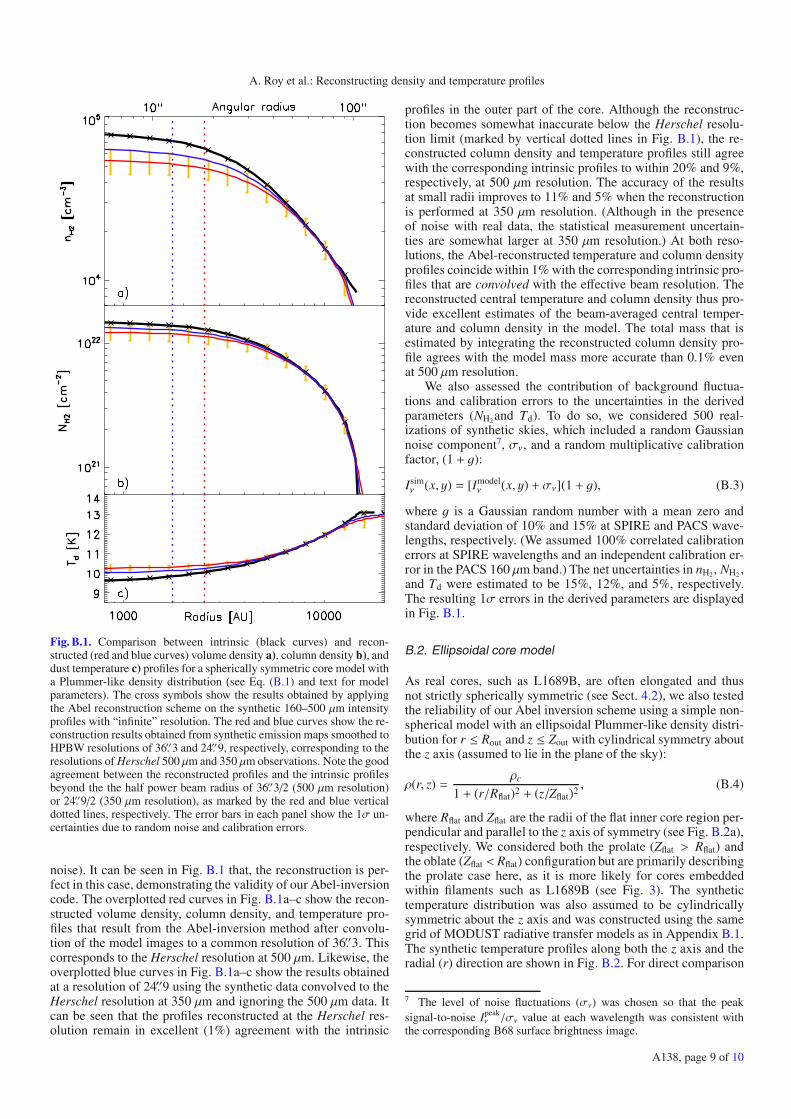
Fig. B.1. Comparison between intrinsic (black curves) and recon-structed (red and blue curves) volume density a), column density b), anddust temperature c) profiles for a spherically symmetric core model witha Plummer-like density distribution (see Eq. (B.1) and text for modelparameters). The cross symbols show the results obtained by applyingthe Abel reconstruction scheme on the synthetic 160–500 μm intensityprofiles with “infinite” resolution. The red and blue curves show the re-construction results obtained from synthetic emission maps smoothed toHPBW resolutions of 36.′′3 and 24.′′9, respectively, corresponding to theresolutions of Herschel 500 μm and 350 μm observations. Note the goodagreement between the reconstructed profiles and the intrinsic profilesbeyond the the half power beam radius of 36.′′3/2 (500 μm resolution)or 24.′′9/2 (350 μm resolution), as marked by the red and blue verticaldotted lines, respectively. The error bars in each panel show the 1σ un-certainties due to random noise and calibration errors.
noise). It can be seen in Fig. B.1 that, the reconstruction is per-fect in this case, demonstrating the validity of our Abel-inversioncode. The overplotted red curves in Fig. B.1a–c show the recon-structed volume density, column density, and temperature pro-files that result from the Abel-inversion method after convolu-tion of the model images to a common resolution of 36.′′3. Thiscorresponds to the Herschel resolution at 500 μm. Likewise, theoverplotted blue curves in Fig. B.1a–c show the results obtainedat a resolution of 24.′′9 using the synthetic data convolved to theHerschel resolution at 350 μm and ignoring the 500 μm data. Itcan be seen that the profiles reconstructed at the Herschel res-olution remain in excellent (1%) agreement with the intrinsic
profiles in the outer part of the core. Although the reconstruc-tion becomes somewhat inaccurate below the Herschel resolu-tion limit (marked by vertical dotted lines in Fig. B.1), the re-constructed column density and temperature profiles still agreewith the corresponding intrinsic profiles to within 20% and 9%,respectively, at 500 μm resolution. The accuracy of the resultsat small radii improves to 11% and 5% when the reconstructionis performed at 350 μm resolution. (Although in the presenceof noise with real data, the statistical measurement uncertain-ties are somewhat larger at 350 μm resolution.) At both reso-lutions, the Abel-reconstructed temperature and column densityprofiles coincide within 1% with the corresponding intrinsic pro-files that are convolved with the effective beam resolution. Thereconstructed central temperature and column density thus pro-vide excellent estimates of the beam-averaged central temper-ature and column density in the model. The total mass that isestimated by integrating the reconstructed column density pro-file agrees with the model mass more accurate than 0.1% evenat 500 μm resolution.
We also assessed the contribution of background fluctua-tions and calibration errors to the uncertainties in the derivedparameters (NH2 and Td). To do so, we considered 500 real-izations of synthetic skies, which included a random Gaussiannoise component7, σν, and a random multiplicative calibrationfactor, (1 + g):
Isimν (x, y) = [Imodel
ν (x, y) + σν](1 + g), (B.3)
where g is a Gaussian random number with a mean zero andstandard deviation of 10% and 15% at SPIRE and PACS wave-lengths, respectively. (We assumed 100% correlated calibrationerrors at SPIRE wavelengths and an independent calibration er-ror in the PACS 160 μm band.) The net uncertainties in nH2, NH2 ,and Td were estimated to be 15%, 12%, and 5%, respectively.The resulting 1σ errors in the derived parameters are displayedin Fig. B.1.
B.2. Ellipsoidal core model
As real cores, such as L1689B, are often elongated and thusnot strictly spherically symmetric (see Sect. 4.2), we also testedthe reliability of our Abel inversion scheme using a simple non-spherical model with an ellipsoidal Plummer-like density distri-bution for r ≤ Rout and z ≤ Zout with cylindrical symmetry aboutthe z axis (assumed to lie in the plane of the sky):
ρ(r, z) =ρc
1 + (r/Rflat)2 + (z/Zflat)2, (B.4)
where Rflat and Zflat are the radii of the flat inner core region per-pendicular and parallel to the z axis of symmetry (see Fig. B.2a),respectively. We considered both the prolate (Zflat > Rflat) andthe oblate (Zflat < Rflat) configuration but are primarily describingthe prolate case here, as it is more likely for cores embeddedwithin filaments such as L1689B (see Fig. 3). The synthetictemperature distribution was also assumed to be cylindricallysymmetric about the z axis and was constructed using the samegrid of MODUST radiative transfer models as in Appendix B.1.The synthetic temperature profiles along both the z axis and theradial (r) direction are shown in Fig. B.2. For direct comparison
7 The level of noise fluctuations (σν) was chosen so that the peaksignal-to-noise Ipeak
ν /σν value at each wavelength was consistent withthe corresponding B68 surface brightness image.
A138, page 9 of 10
A&A 562, A138 (2014)
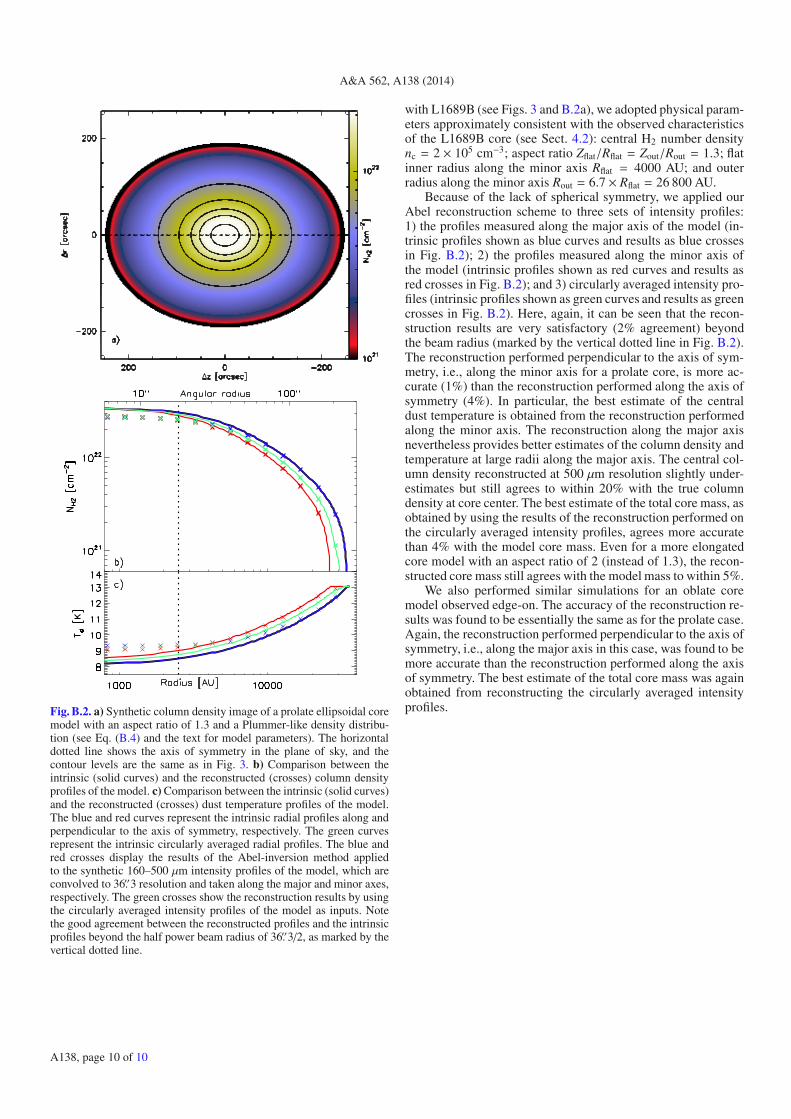
Fig. B.2. a) Synthetic column density image of a prolate ellipsoidal coremodel with an aspect ratio of 1.3 and a Plummer-like density distribu-tion (see Eq. (B.4) and the text for model parameters). The horizontaldotted line shows the axis of symmetry in the plane of sky, and thecontour levels are the same as in Fig. 3. b) Comparison between theintrinsic (solid curves) and the reconstructed (crosses) column densityprofiles of the model. c) Comparison between the intrinsic (solid curves)and the reconstructed (crosses) dust temperature profiles of the model.The blue and red curves represent the intrinsic radial profiles along andperpendicular to the axis of symmetry, respectively. The green curvesrepresent the intrinsic circularly averaged radial profiles. The blue andred crosses display the results of the Abel-inversion method appliedto the synthetic 160–500 μm intensity profiles of the model, which areconvolved to 36.′′3 resolution and taken along the major and minor axes,respectively. The green crosses show the reconstruction results by usingthe circularly averaged intensity profiles of the model as inputs. Notethe good agreement between the reconstructed profiles and the intrinsicprofiles beyond the half power beam radius of 36.′′3/2, as marked by thevertical dotted line.
with L1689B (see Figs. 3 and B.2a), we adopted physical param-eters approximately consistent with the observed characteristicsof the L1689B core (see Sect. 4.2): central H2 number densitync = 2 × 105 cm−3; aspect ratio Zflat/Rflat = Zout/Rout = 1.3; flatinner radius along the minor axis Rflat = 4000 AU; and outerradius along the minor axis Rout = 6.7 × Rflat = 26 800 AU.
Because of the lack of spherical symmetry, we applied ourAbel reconstruction scheme to three sets of intensity profiles:1) the profiles measured along the major axis of the model (in-trinsic profiles shown as blue curves and results as blue crossesin Fig. B.2); 2) the profiles measured along the minor axis ofthe model (intrinsic profiles shown as red curves and results asred crosses in Fig. B.2); and 3) circularly averaged intensity pro-files (intrinsic profiles shown as green curves and results as greencrosses in Fig. B.2). Here, again, it can be seen that the recon-struction results are very satisfactory (2% agreement) beyondthe beam radius (marked by the vertical dotted line in Fig. B.2).The reconstruction performed perpendicular to the axis of sym-metry, i.e., along the minor axis for a prolate core, is more ac-curate (1%) than the reconstruction performed along the axis ofsymmetry (4%). In particular, the best estimate of the centraldust temperature is obtained from the reconstruction performedalong the minor axis. The reconstruction along the major axisnevertheless provides better estimates of the column density andtemperature at large radii along the major axis. The central col-umn density reconstructed at 500 μm resolution slightly under-estimates but still agrees to within 20% with the true columndensity at core center. The best estimate of the total core mass, asobtained by using the results of the reconstruction performed onthe circularly averaged intensity profiles, agrees more accuratethan 4% with the model core mass. Even for a more elongatedcore model with an aspect ratio of 2 (instead of 1.3), the recon-structed core mass still agrees with the model mass to within 5%.
We also performed similar simulations for an oblate coremodel observed edge-on. The accuracy of the reconstruction re-sults was found to be essentially the same as for the prolate case.Again, the reconstruction performed perpendicular to the axis ofsymmetry, i.e., along the major axis in this case, was found to bemore accurate than the reconstruction performed along the axisof symmetry. The best estimate of the total core mass was againobtained from reconstructing the circularly averaged intensityprofiles.
A138, page 10 of 10