Embed Size (px)
Citation preview

Reconstructing Reconstructing the 1-in-100-yr Flood the 1-in-100-yr Flood
in in Northern ThailandNorthern Thailand
Renée Kidson
University of Cambridge
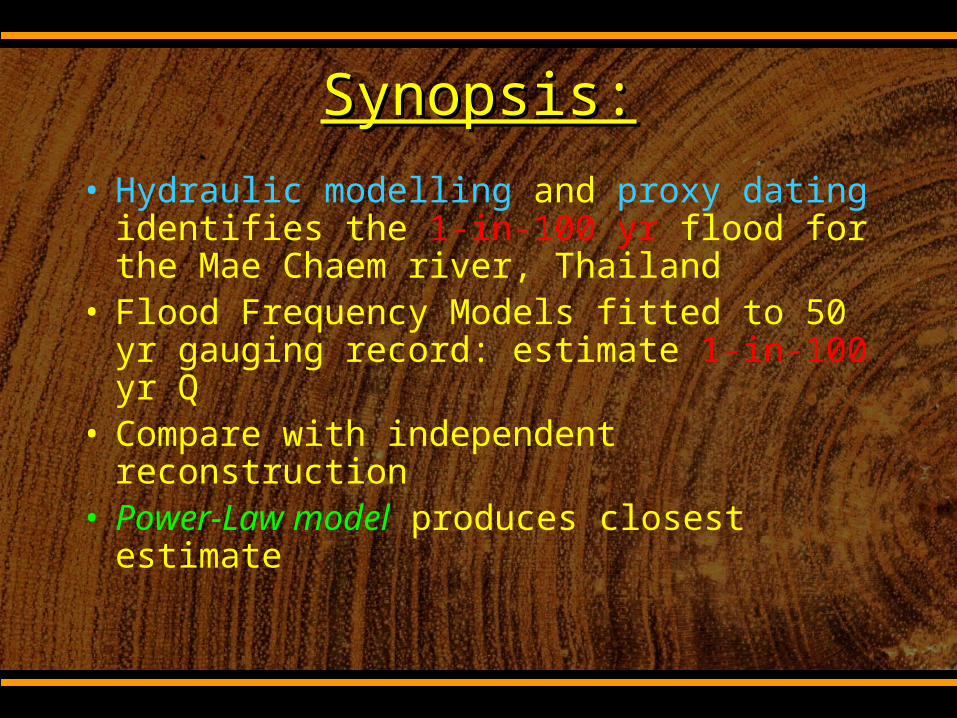
Synopsis:Synopsis:
• Hydraulic modelling and proxy dating identifies the 1-in-100 yr flood for the Mae Chaem river, Thailand
• Flood Frequency Models fitted to 50 yr gauging record: estimate 1-in-100 yr Q
• Compare with independent reconstruction
• Power-Law model produces closest estimate
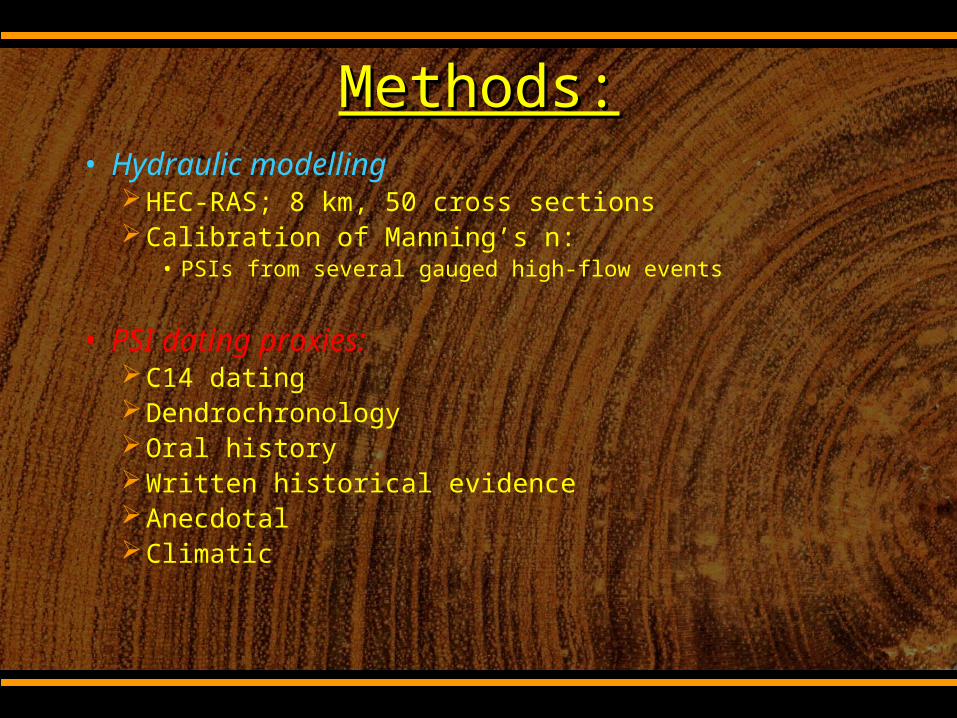
Methods:Methods:• Hydraulic modelling
HEC-RAS; 8 km, 50 cross sectionsCalibration of Manning’s n:
• PSIs from several gauged high-flow events
• PSI dating proxies:C14 datingDendrochronologyOral historyWritten historical evidence AnecdotalClimatic
Methods (cont)Methods (cont)
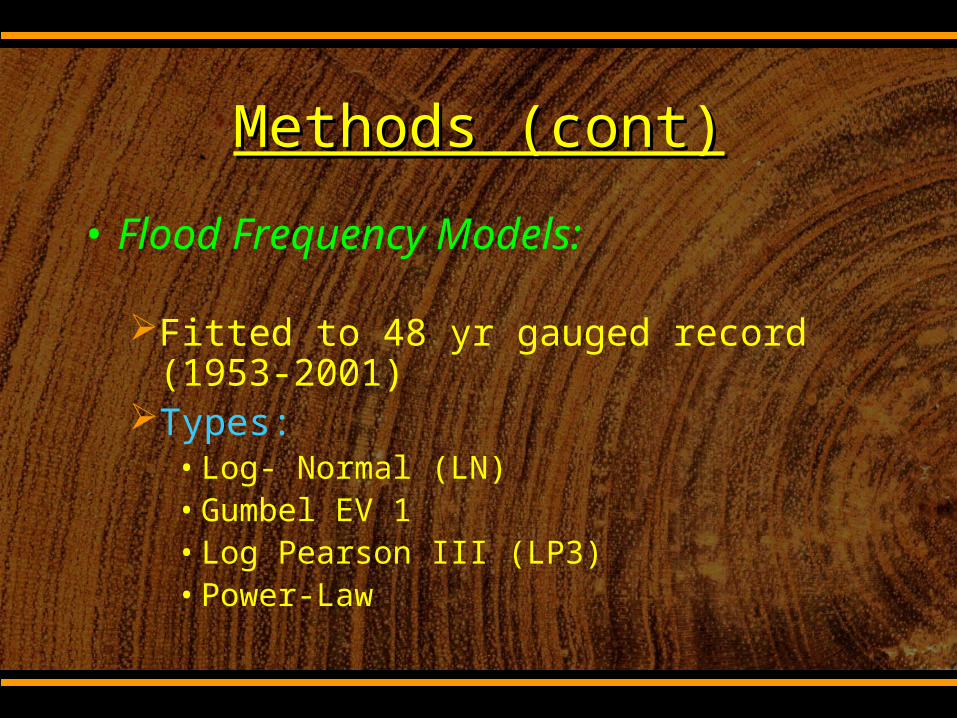
• Flood Frequency Models:
Fitted to 48 yr gauged record (1953-2001)
Types:• Log- Normal (LN)• Gumbel EV 1• Log Pearson III (LP3)• Power-Law

Study SiteStudy Site
• Northern Thailand: South West (Indian) monsoon climate
• Tropical cyclone incursion from South China Sea
• Steep topography: orographic rainfall enhancement – prone to extreme events

Year
1960 1970 1980 1990 2000
Mon
th o
f the
Yea
r
4
5
6
7
8
9
10
11
12
4
5
6
7
8
9
10
11
12

1. Hydraulic Model Calibration
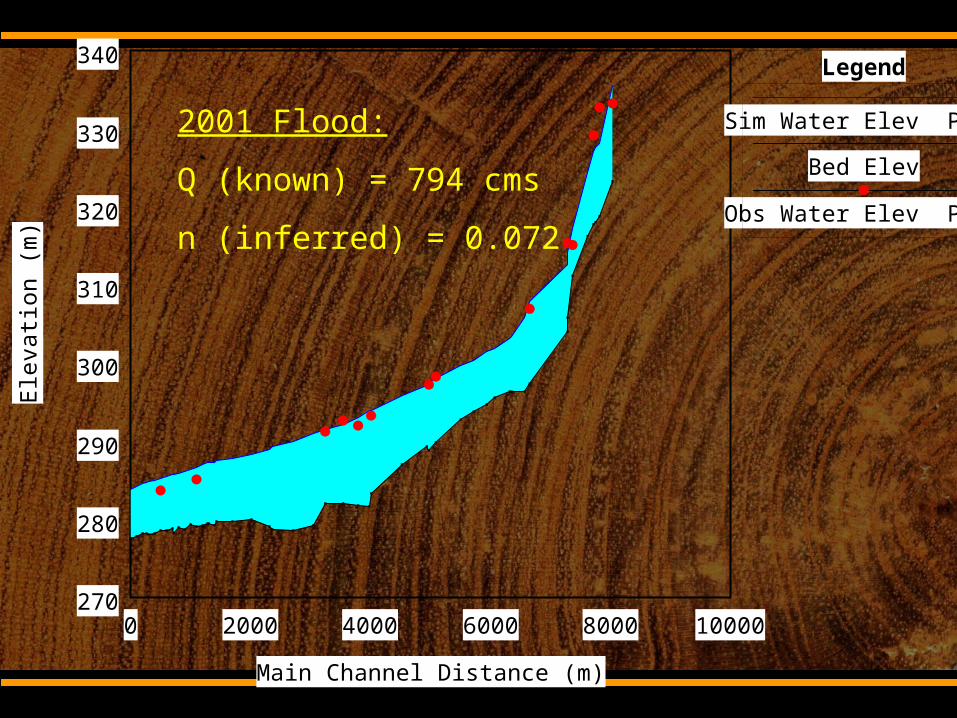
0 2000 4000 6000 8000 10000270
280
290
300
310
320
330
340
Main Channel Distance (m)
Ele
vatio
n (
m)
Legend
Sim Water Elev PF 1
Bed Elev
Obs Water Elev PF 1
2001 Flood:
Q (known) = 794 cms
n (inferred) = 0.072
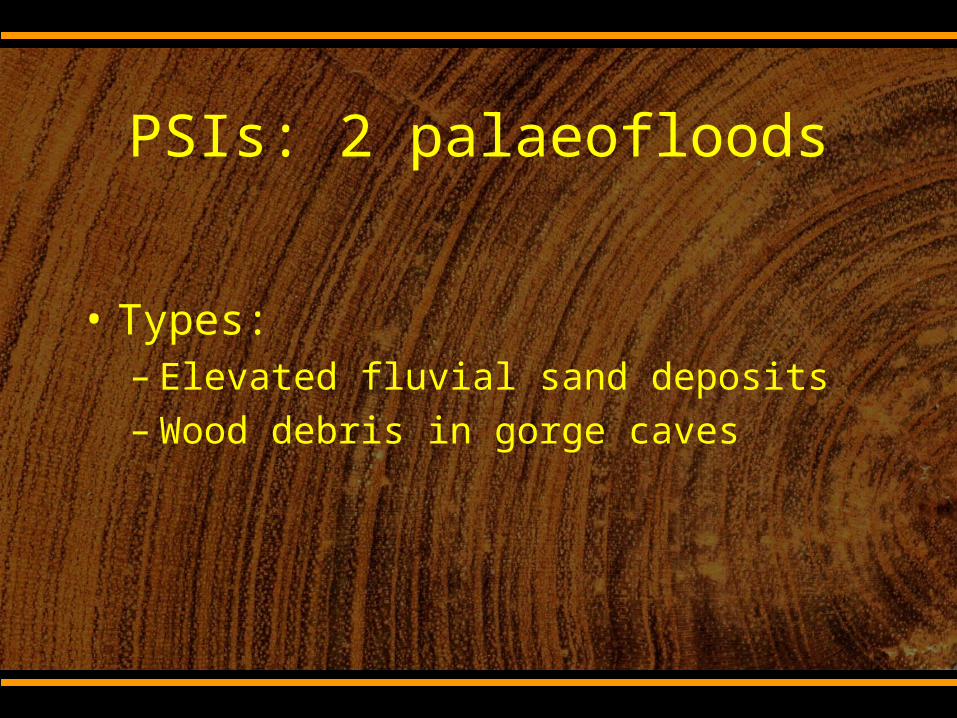
PSIs: 2 palaeofloods
• Types:– Elevated fluvial sand deposits– Wood debris in gorge caves
0 2000 4000 6000 8000 10000270
280
290
300
310
320
330
340
Main Channel Distance (m)
Ele
vatio
n (
m)
Legend
Sim Water Elev PF 1
Bed Elev
Obs Water Elev PF 1
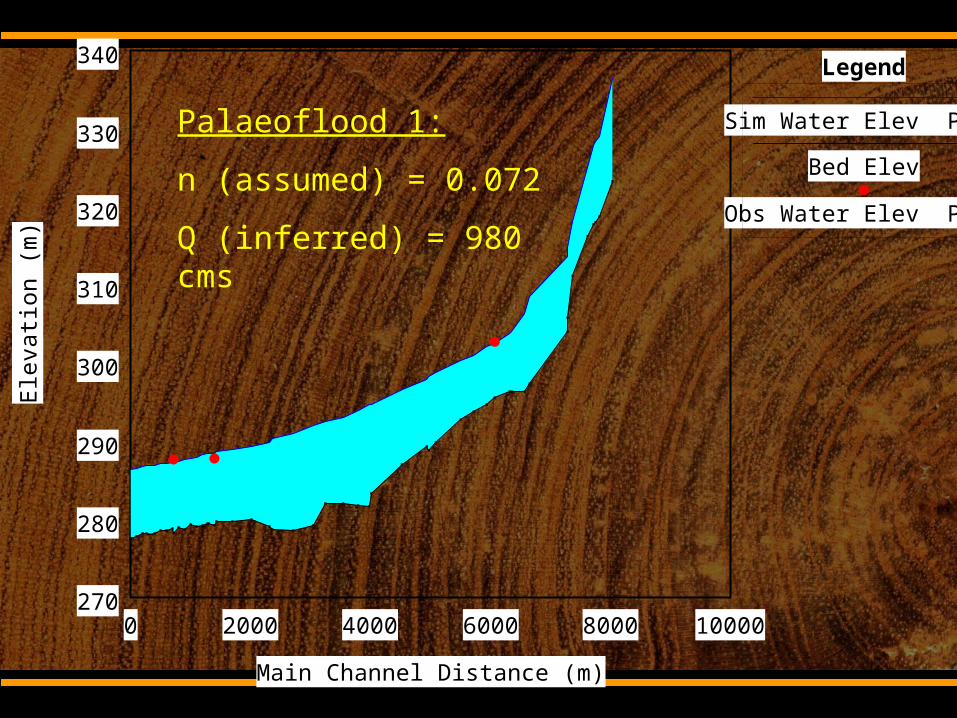
Palaeoflood 1:
n (assumed) = 0.072
Q (inferred) = 980 cms
Palaeoflood 1Palaeoflood 1
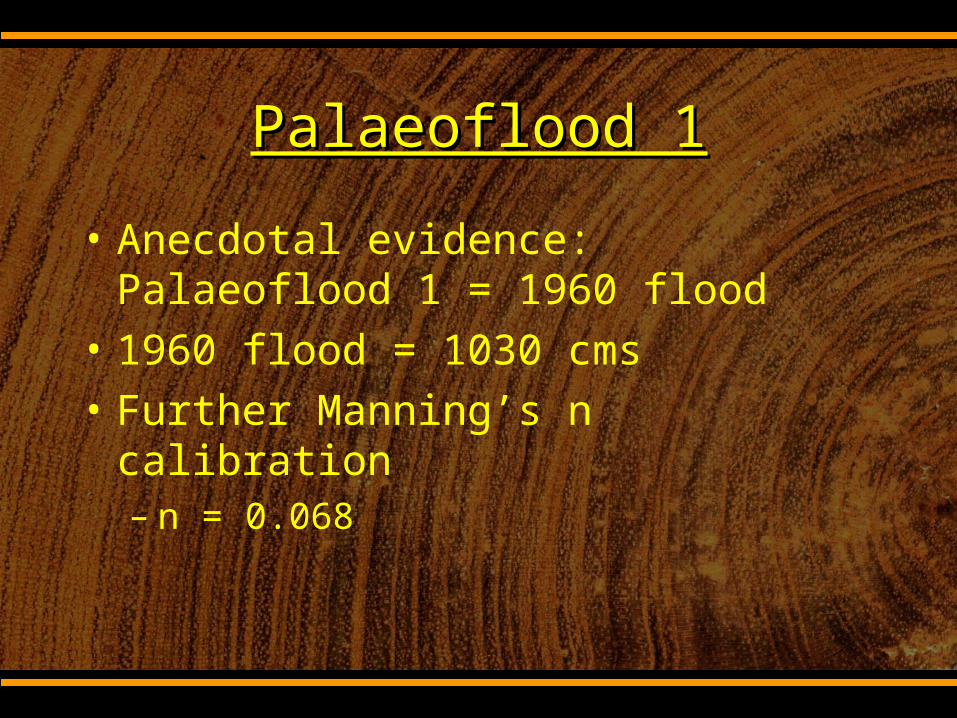
• Anecdotal evidence: Palaeoflood 1 = 1960 flood
• 1960 flood = 1030 cms
• Further Manning’s n calibration– n = 0.068
0 2000 4000 6000 8000 10000270
280
290
300
310
320
330
340
350
Main Channel Distance (m)
Ele
vatio
n (
m)
Legend
Sim Water Elev PF 1
Bed Elev
Obs Water Elev PF 1
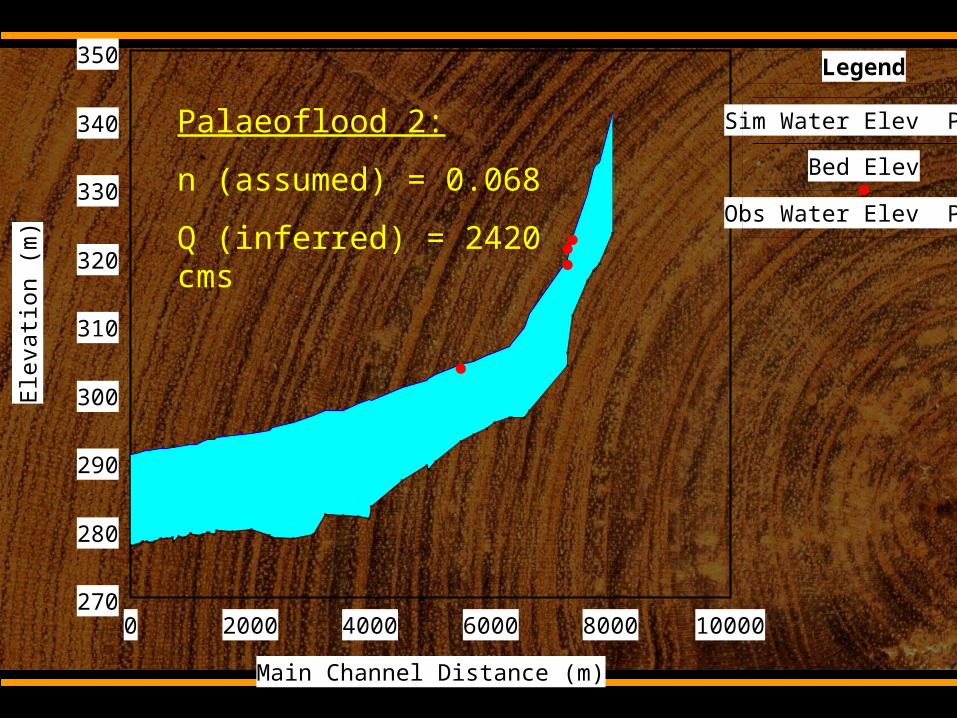
Palaeoflood 2:
n (assumed) = 0.068
Q (inferred) = 2420 cms

2. Proxy Dating of
Palaeoflood 2
CC1414 Dating Dating
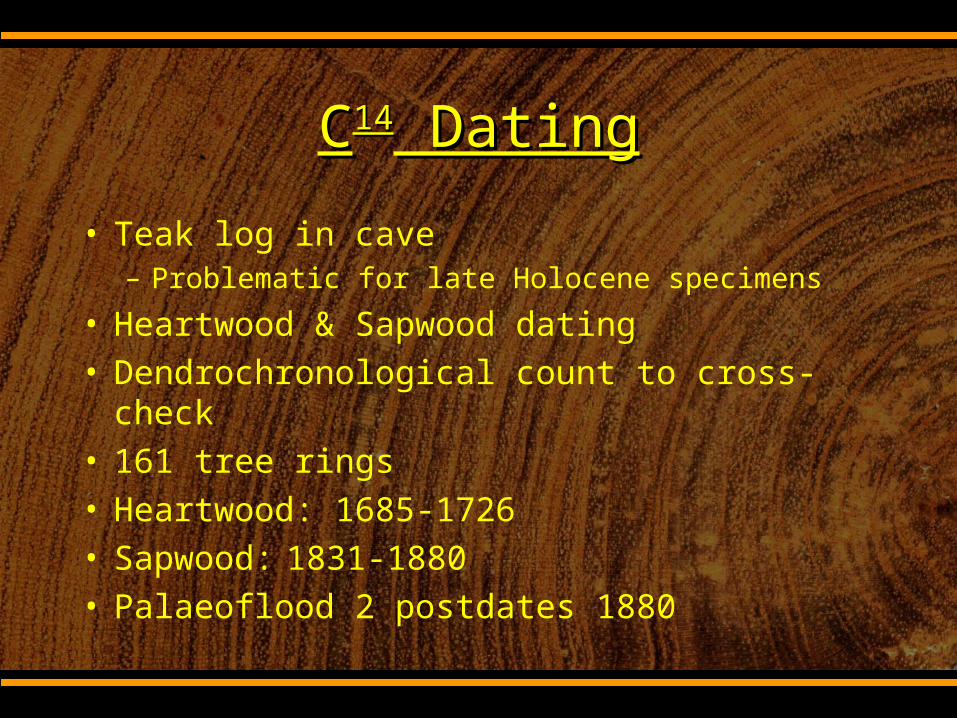
• Teak log in cave– Problematic for late Holocene specimens
• Heartwood & Sapwood dating• Dendrochronological count to cross-check• 161 tree rings• Heartwood: 1685-1726 • Sapwood: 1831-1880 • Palaeoflood 2 postdates 1880

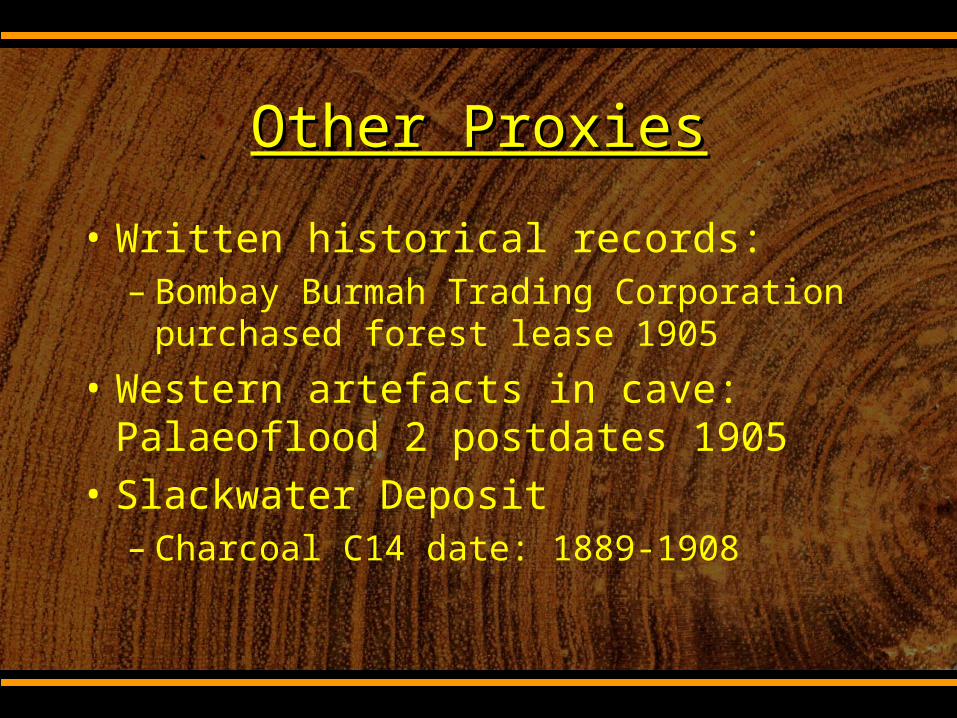
• Written historical records:– Bombay Burmah Trading Corporation
purchased forest lease 1905
• Western artefacts in cave: Palaeoflood 2 postdates 1905
• Slackwater Deposit– Charcoal C14 date: 1889-1908
Other ProxiesOther Proxies
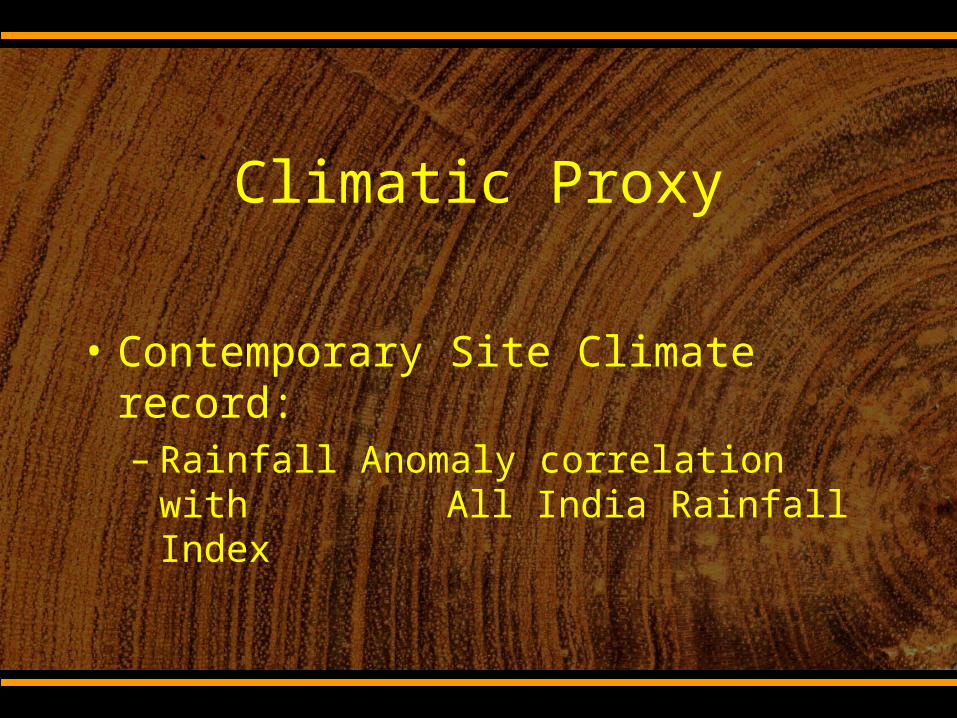
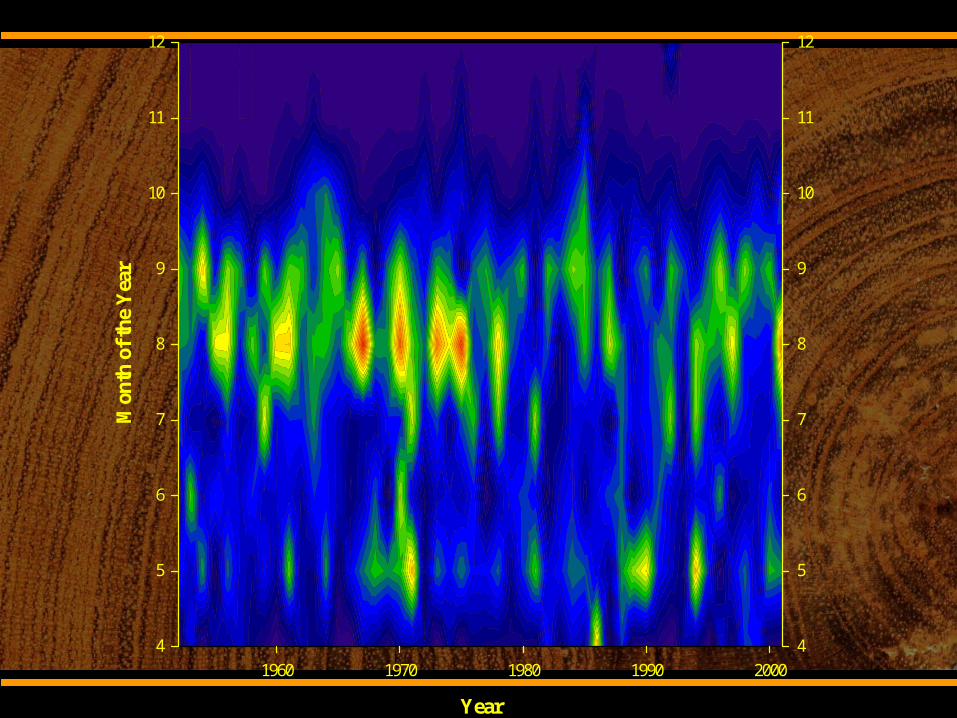
Climatic Proxy
• Contemporary Site Climate record:– Rainfall Anomaly correlation with
All India Rainfall Index
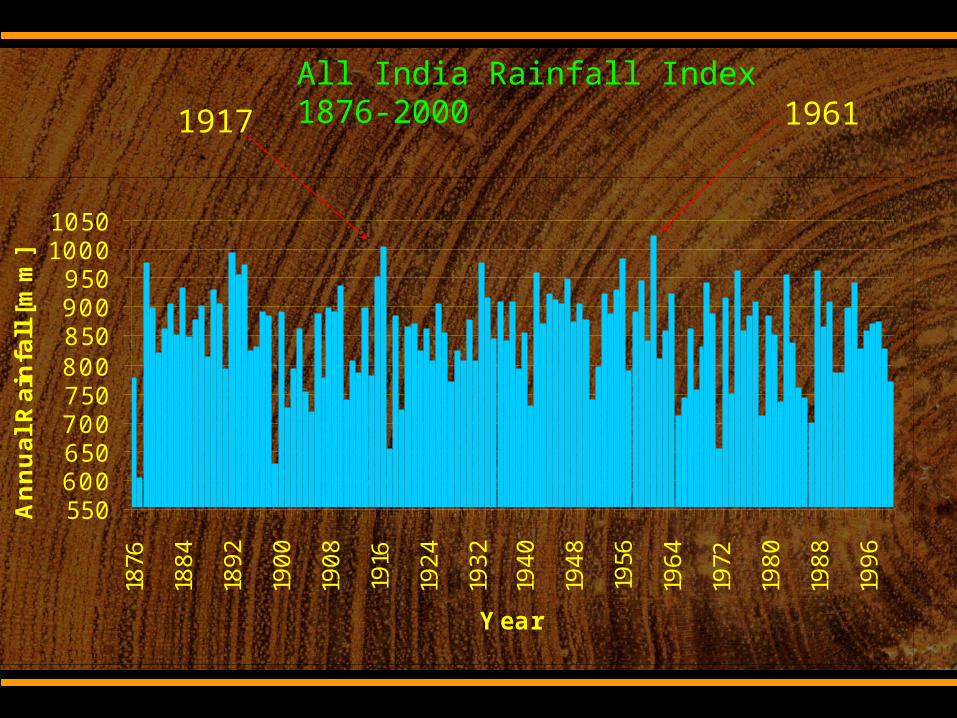
All India Rainfall Index 1876-2000
550600650700750800850900950
10001050
1876
1884
1892
1900
1908
1916
1924
1932
1940
1948
1956
1964
1972
1980
1988
1996
Year
Annual
Rai
nfa
ll [m
m]
1917 1961
Year [AD]
1880 1900 1920 1940 1960 1980 2000
Per
iod
[yrs
]
3
4
5
6789
20
30
40
50
60708090
10
100
3
4
5
6789
20
30
40
50
60708090
3. Flood Frequency Analysis
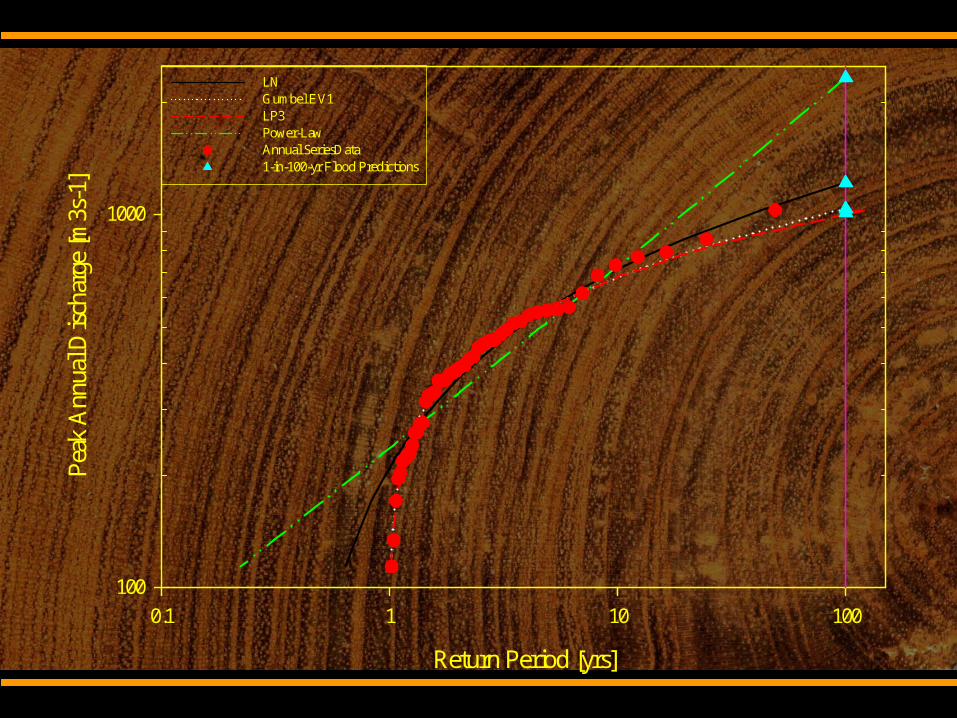
Return Period [yrs]
0.1 1 10 100
Peak
Ann
ual D
isch
arge
[m3s
-1]
100
1000
LNGumbel EV1LP3Power-LawAnnual SeriesData1-in-100-yr Flood Predictions
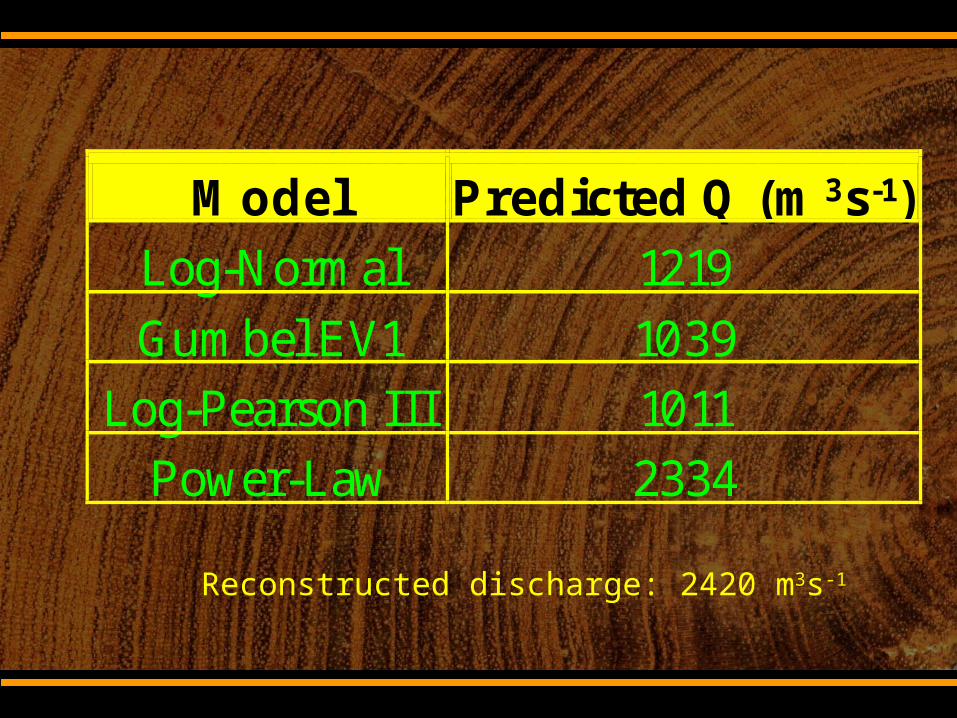
Model Predicted Q (m3s-1) Log-Normal 1219 Gumbel EV1 1039
Log-Pearson III 1011 Power-Law 2334
Reconstructed discharge: 2420 m3s-1
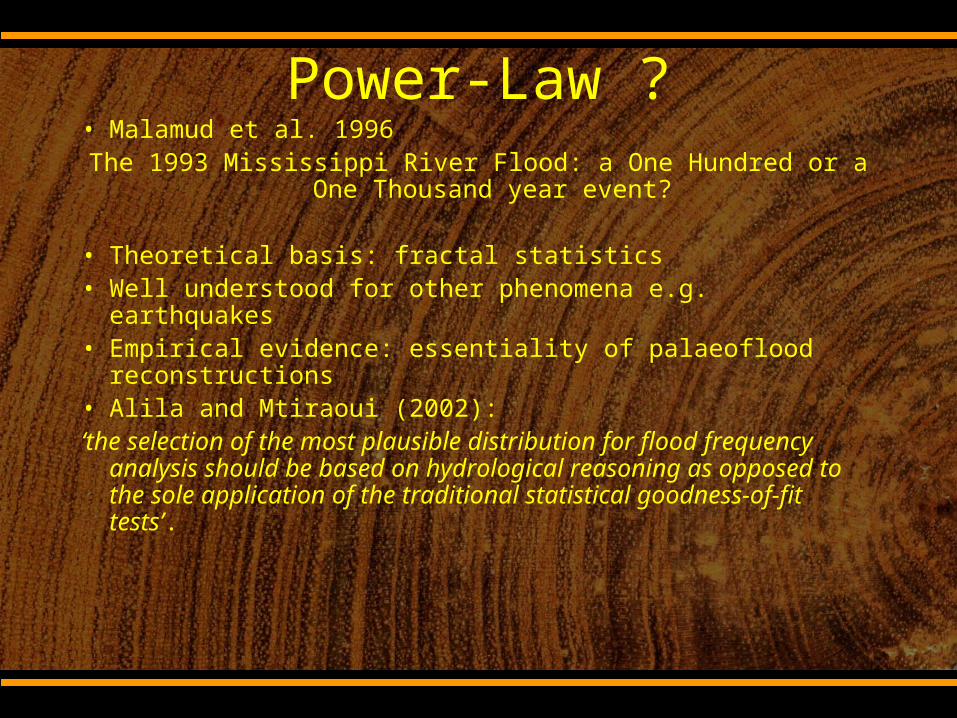
Power-Law ?• Malamud et al. 1996The 1993 Mississippi River Flood: a One Hundred or a One Thousand
year event?
• Theoretical basis: fractal statistics• Well understood for other phenomena e.g. earthquakes• Empirical evidence: essentiality of palaeoflood reconstructions• Alila and Mtiraoui (2002): ‘the selection of the most plausible distribution for flood frequency
analysis should be based on hydrological reasoning as opposed to the sole application of the traditional statistical goodness-of-fit tests’.
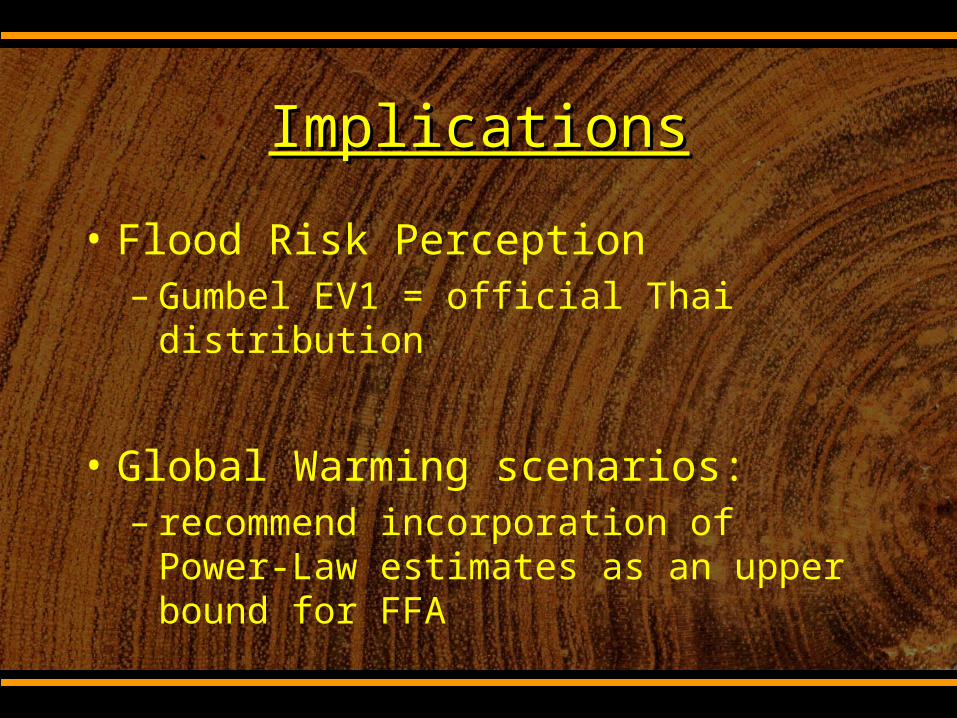
ImplicationsImplications
• Flood Risk Perception– Gumbel EV1 = official Thai distribution
• Global Warming scenarios:– recommend incorporation of Power-Law
estimates as an upper bound for FFA
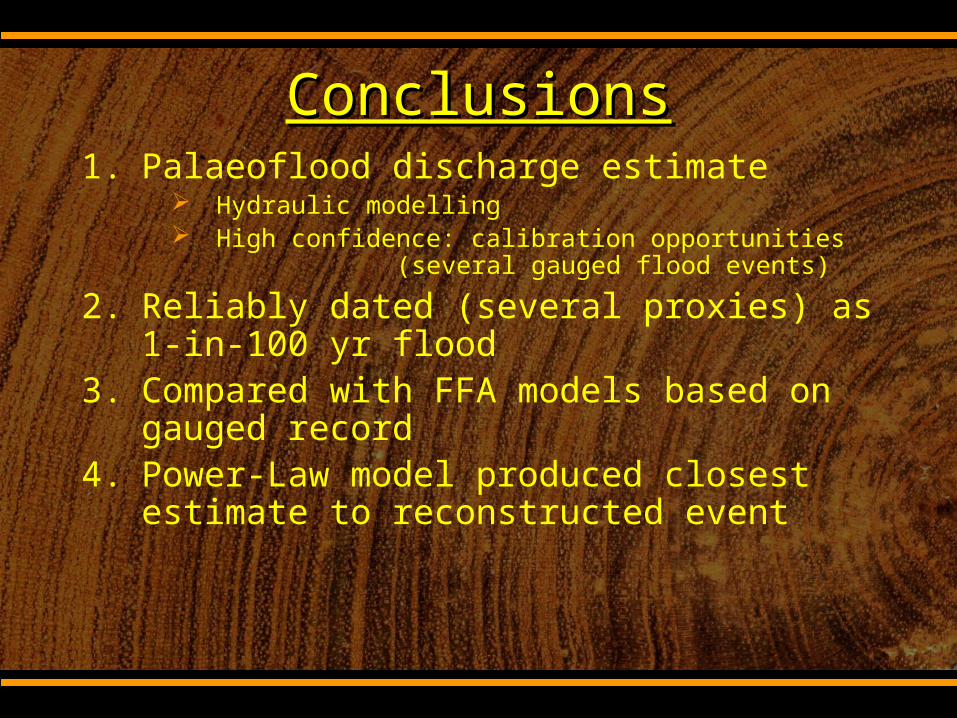
ConclusionsConclusions1. Palaeoflood discharge estimate
Hydraulic modelling High confidence: calibration opportunities
(several gauged flood events)
2. Reliably dated (several proxies) as 1-in-100 yr flood
3. Compared with FFA models based on gauged record
4. Power-Law model produced closest estimate to reconstructed event