Embed Size (px)
Citation preview
Reconstructing Historical Riparian Conditions of Two RiverBasins in Eastern Oregon, USA
Lynne S. McAllister
Received: 30 March 2007 / Accepted: 14 April 2008 / Published online: 6 June 2008
� Springer Science+Business Media, LLC 2008
Abstract As land use continues to alter riparian areas,
historical information is increasingly needed to help estab-
lish reference conditions for monitoring and assessment. I
developed and applied a procedure in the John Day and
Deschutes river basins of eastern Oregon for synthesizing
historical documentary records available across broad spa-
tial areas to reconstruct 19th-century riparian conditions.
The study area was stratified by ecoregion and stream
physical characteristics to partition regional variability.
Three primary data sources—General Land Office survey
notes, historical photographs, and written accounts—pro-
vided descriptive records, which were grouped by topic to
develop common riparian attributes. The number of records
for each attribute was tallied by stratum to compare and
contrast riparian structure and composition across strata and
ecoregions. Detailed descriptions of historical riparian con-
ditions using the original documentary records further
illustrated the unique riparian conditions in each stratum.
Similarities and differences in historical riparian structure
and composition at the stratum and ecoregion levels were
evident based on the distributional pattern and numbers of
records of attributes across strata. A high number of repeated
observations within and among primary data sources helped
to corroborate descriptive data. Although these reference
data cannot provide the detail needed for rigorous quantita-
tive assessments, they do describe a range of conditions
approaching a minimally disturbed condition and provide an
important perspective for conducting riparian assessments in
highly disturbed regions where least-disturbed reference
sites are often poor examples of a desired condition.
Keywords Historical reconstruction � Streamside
vegetation � Reference condition � John Day River �Deschutes River � Stream monitoring and assessment
Stream monitoring and management activities are often
challenged by the lack of adequate reference data for
assessing biological integrity and setting future priorities.
Least-disturbed stream sites are those subjected to the least
amount of ambient human disturbance in a particular
region and are often used to define the best available
physical, chemical, and biological habitat conditions given
the current state of the landscape. However, the least-dis-
turbed condition is not always a desired condition
(Stoddard and others 2006). Resource management agen-
cies have a growing need for alternative reference data,
particularly in highly disturbed regions where increasing
human alteration of landscapes results in more impaired
least-disturbed sites with time.
The use of an impaired condition as reference is inef-
fective for assessing the biological integrity of a resource
or monitoring change through time. It also risks a reduction
in expectations and compromises interpretation and man-
agement actions if, over time, the least-disturbed condition
is construed as an acceptable or target condition.
In addition, least-disturbed sites are a relatively short-
term representation of current conditions in few locations
and might not reveal a range of natural conditions that
occur as a result of long-term and multiscale processes.
They therefore may provide a limited context for making
L. S. McAllister
Dynamac Corporation, National Health and Environmental
Effects Research Laboratory, 200 SW 35th Street, Corvallis,
OR, USA
L. S. McAllister (&)
Oregon Department of State Lands, 775 Summer Street NE,
Suite 100, Salem, OR 97301, USA
e-mail: [email protected]
123
Environmental Management (2008) 42:412–425
DOI 10.1007/s00267-008-9127-1
judgments about other sites or locations to which they are
compared.
Historical reconstruction offers an additional source of
data for defining reference conditions. Using historical data
to restore landscapes to their historical condition is usually
not realistic or desired. Instead, historical data can help to
assess the relative deviation of current condition from a
minimally disturbed condition and promote better-
informed management decisions within the context of
present-day land uses and range of attainable conditions.
The natural range of riparian conditions during a pre-
defined period of minimal human influence can serve as a
fixed benchmark and will change only as new techniques
and approaches to reconstruct and describe it are devel-
oped. In contrast, using the present condition at least-
disturbed sites as reference establishes a moving bench-
mark, which is likely to deteriorate as human land uses and
cumulative impacts increase over time. Historical data can
be used alone or interactively with current data to set ref-
erence benchmarks.
Researchers have been reconstructing historical condi-
tions for many years (e.g., Sears 1925; Lutz 1930; Leopold
1951; Cooper 1960; Habeck 1961) using a variety of
approaches. Historical reconstruction has more recently
gained new attention, as evidenced by recent overviews
(Egan and Howell 2001a; Swetnam and others 1999;
Steedman and others 1996) and methods papers (Black and
Abrams 2001; Mladenoff and others 2002), recommenda-
tions for inclusion in ecosystem management and
restoration projects (Kauffman and others 1994; Manley
and others 1995; Egan and Howell 2001b), and numerous
applications (e.g., Swetnam and others 1999; Thoms
and others 1999; Dawdy 1989; Collins and others 2002;
Steen-Adams 2002; Wallin and others 1996). Historical
reconstructions can address questions at large spatial scales
(Kaufmann and others 1998; Steedman and others 1996),
and many authors emphasize the importance of character-
izing a range of historical conditions (Swetnam and others
1999; Landres and others 1999; White and Walker 1997;
Egan and Howell 2001b; Morgan and others 1994).
A number of stream reconstructions have addressed
riparian conditions in portions of river basins, usually
valley or floodplain segments (e.g., Sedell and Froggatt
1984; Johnson 1994; Boyle and others 1997; McDowell
2000), but no known applied studies have attempted to
reconstruct riparian conditions for more varied landscapes
and stream types throughout river basins. The goal of this
work was to apply and evaluate an approach for recon-
structing presettlement riparian conditions for broad areas
and ecophysiographic categories using existing documen-
tary records. Of particular interest were the types, structural
characteristics, and extent of streamside vegetation and its
spatial variation. Whereas most vegetation reconstruction
studies report upland forest composition, this research
focused on the streamside community—including tree,
shrub, and herbaceous vegetation—as one aspect of stream
function and biological integrity. The specific objectives
were (1) to devise a method for synthesizing and analyzing
descriptive historical information from multiple sources;
(2) to develop descriptions of presettlement riparian con-
ditions in multiple ecophysiographic strata of a region; (3)
to determine whether descriptions of historical conditions
can be differentiated among strata; and (4) to assess the
suitability of documentary records for reconstructing his-
torical riparian conditions by evaluating data quality.
I use the term ‘‘riparian’’ to refer to the corridor along
streams that includes banks and the high-water zone,
encompassing terraces and floodplains. In describing veg-
etation, I use ‘‘riparian’’ to describe typical riparian species
that are adapted to live in or near water and ‘‘streamside’’
to describe vegetation occurring in the riparian corridor
that includes, or is composed entirely of, upland species.
Because the historical literature examined in this project
almost always reported common names of plants, I also use
common names, with the scientific name in parentheses
when provided. Many of the adjectives used in historical
summaries were preserved from original 19th-century
writings to avoid altering the original meaning.
Methods
Study Area and History
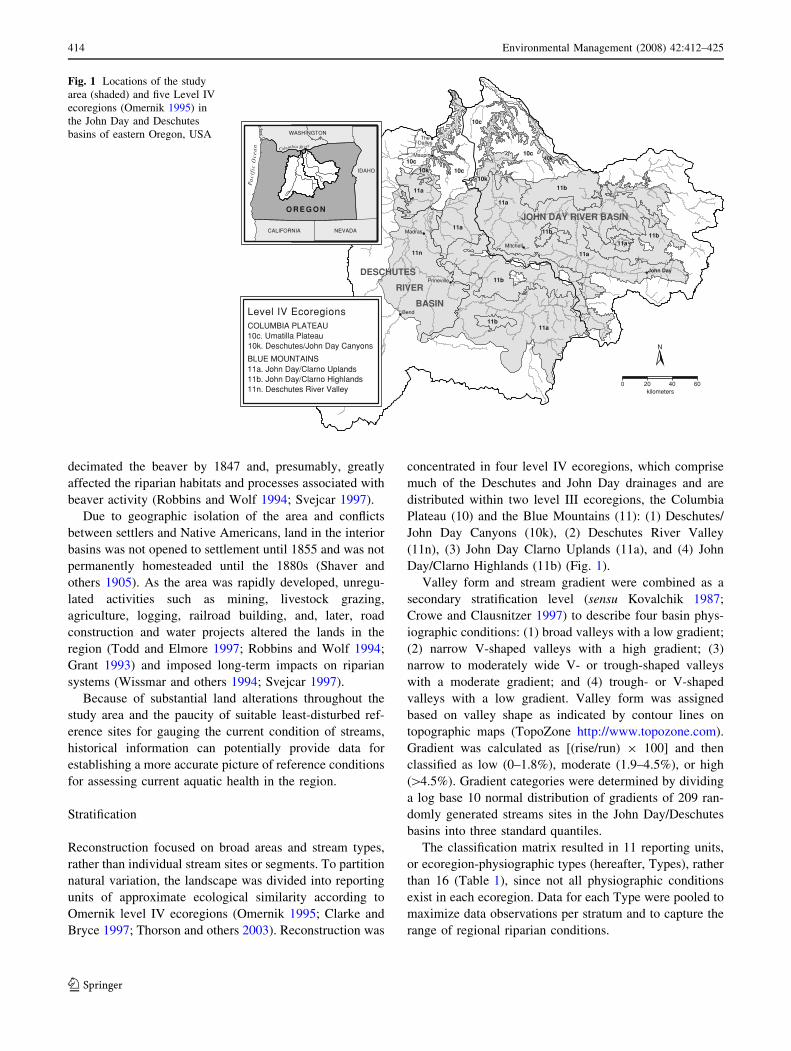
Reconstruction was done for portions of the Deschutes and
John Day river drainages in eastern Oregon, USA (Fig. 1).
Both drainages are part of the Columbia River Basin and
drain dry forest and shrub steppe regions east of the Cas-
cade Range.
Beginning with very early European exploration of the
Pacific Northwest, the area has undergone substantial and
rapid change. Although Native Americans had been prac-
ticing land management such as burning for thousands of
years prior to European arrival (Robbins and Wolf 1994;
Meinig 1968), the changes that occurred during western
expansion were more significant in their degree and extent
(Todd and Elmore 1997; Barker 1996), with a greater focus
on extraction of resources and hydrological modifications.
The Lewis and Clark expedition and many of the sub-
sequent explorations of the region did not enter the interior
Deschutes and John Day Basins; most of the overland
travel by immigrants traveling west over the Cascade
Range skirted only the northern boundaries of these basins,
near the river mouths. The Northwest and Hudson Bay
Companies led fur trapping operations and explorations
into the region beginning in 1811. Trapping nearly
Environmental Management (2008) 42:412–425 413
123
decimated the beaver by 1847 and, presumably, greatly
affected the riparian habitats and processes associated with
beaver activity (Robbins and Wolf 1994; Svejcar 1997).
Due to geographic isolation of the area and conflicts
between settlers and Native Americans, land in the interior
basins was not opened to settlement until 1855 and was not
permanently homesteaded until the 1880s (Shaver and
others 1905). As the area was rapidly developed, unregu-
lated activities such as mining, livestock grazing,
agriculture, logging, railroad building, and, later, road
construction and water projects altered the lands in the
region (Todd and Elmore 1997; Robbins and Wolf 1994;
Grant 1993) and imposed long-term impacts on riparian
systems (Wissmar and others 1994; Svejcar 1997).
Because of substantial land alterations throughout the
study area and the paucity of suitable least-disturbed ref-
erence sites for gauging the current condition of streams,
historical information can potentially provide data for
establishing a more accurate picture of reference conditions
for assessing current aquatic health in the region.
Stratification
Reconstruction focused on broad areas and stream types,
rather than individual stream sites or segments. To partition
natural variation, the landscape was divided into reporting
units of approximate ecological similarity according to
Omernik level IV ecoregions (Omernik 1995; Clarke and
Bryce 1997; Thorson and others 2003). Reconstruction was
concentrated in four level IV ecoregions, which comprise
much of the Deschutes and John Day drainages and are
distributed within two level III ecoregions, the Columbia
Plateau (10) and the Blue Mountains (11): (1) Deschutes/
John Day Canyons (10k), (2) Deschutes River Valley
(11n), (3) John Day Clarno Uplands (11a), and (4) John
Day/Clarno Highlands (11b) (Fig. 1).
Valley form and stream gradient were combined as a
secondary stratification level (sensu Kovalchik 1987;
Crowe and Clausnitzer 1997) to describe four basin phys-
iographic conditions: (1) broad valleys with a low gradient;
(2) narrow V-shaped valleys with a high gradient; (3)
narrow to moderately wide V- or trough-shaped valleys
with a moderate gradient; and (4) trough- or V-shaped
valleys with a low gradient. Valley form was assigned
based on valley shape as indicated by contour lines on
topographic maps (TopoZone http://www.topozone.com).
Gradient was calculated as [(rise/run) 9 100] and then
classified as low (0–1.8%), moderate (1.9–4.5%), or high
([4.5%). Gradient categories were determined by dividing
a log base 10 normal distribution of gradients of 209 ran-
domly generated streams sites in the John Day/Deschutes
basins into three standard quantiles.
The classification matrix resulted in 11 reporting units,
or ecoregion-physiographic types (hereafter, Types), rather
than 16 (Table 1), since not all physiographic conditions
exist in each ecoregion. Data for each Type were pooled to
maximize data observations per stratum and to capture the
range of regional riparian conditions.
TheDalles
Maupin
John Day
Prineville
Mitchell
Madras
BendLevel IV Ecoregions
10c. Umatilla Plateau 10k. Deschutes/John Day Canyons
COLUMBIA PLATEAU
BLUE MOUNTAINS11a. John Day/Clarno Uplands11b. John Day/Clarno Highlands11n. Deschutes River Valley
DESCHUTES
RIVER
BASIN
JOHN DAY RIVER BASIN11a
11a
11n
10c
10k10k
10k10c
10c
10c
11a
11a
11a
11a
11b
11b
11b
11b
11b
CALIFORNIA
IDAHO
NEVADA
Pa
cifi
c O
cea
n
O R E G O N
Columbia River
WASHINGTON
20 40 600kilometers
N
Fig. 1 Locations of the study
area (shaded) and five Level IV
ecoregions (Omernik 1995) in
the John Day and Deschutes
basins of eastern Oregon, USA
414 Environmental Management (2008) 42:412–425
123
Time Frame and Primary Data Sources
Although the original intent was to document a minimally
disturbed riparian condition, defined as the time before
European settlement, little information was available for the
period prior to 1860. I acquired the earliest documentary data
available, although many records were from the late 1800s to
about 1910. The data therefore reflect varying degrees of
impacts and alterations that had already occurred due to early
European influence. Native American impacts and tradi-
tional land management practices were considered part of a
minimally disturbed condition. Any impact of macroclimate
on vegetation over the past 200 years was considered
inconsequential to this assessment (Schoonmaker and Foster
1991; Hann and others 1997).
Large-scale stream monitoring and assessment are often
implemented in a multiagency/tribal framework, requiring
standard methods. In the interest of employing techniques
that can be applied throughout the West by diverse agency
staff, often confined by resource limitations, I intentionally
utilized approaches that are widely applicable and can be
transferred and applied easily. Documentary records used
in this analysis came from three primary data sources
(PDSs): (1) General Land Office (GLO) survey notes, (2)
historical photographs, and (3) written accounts from dia-
ries, journals, scientific explorations, and expedition
reports.
General Land Office Survey Notes
Records are readily available throughout most of the
western and midwestern United States and have been used
in various applications (e.g., Sedell and Froggatt 1984;
Johnson 1994; Nelson 1997; McDowell 2000), though they
are limited in their range of uses and interpretations
(Schulte and Mladenoff 2001; Manies and others 2001).
Surveyors collected data systematically on a square-mile
grid denoted by township sections corners. Details of the
survey procedures are described elsewhere (Bourdo 1956;
Galatowitsch 1990; Schulte and Mladenoff 2001).
In the study area GLO surveys were conducted in the
late 1870s and early 1880s. Records stored on microfiche
were obtained through the Bureau of Land Management
office in Portland, Oregon, and summarized for 29 stream
segments of *15 km (or less, depending on the stream
size). Stream segments were arbitrarily selected from a set
of randomly selected sample sites used for a larger stream
assessment program in the western United States and
evenly distributed across the four ecoregions of the study
area. Sample sites were not selected relative to stream
gradient or valley form, which resulted in an uneven dis-
tribution of GLO sites across Types. Since the intent was to
collect data on riparian attributes, only the GLO notes for
section lines that crossed or closely paralleled a stream
were utilized.
The synthesis of GLO notes relied heavily on section
line descriptive summaries, which often included specific
mention of streamside plant composition of the overstory,
understory, and ground cover. The species and diameter of
bearing trees occurring in streamside forests and soil
quality ratings were also extracted. In the study area, the
usefulness of GLO data was limited for several reasons: (1)
because riparian habitat comprises a relatively small pro-
portion of the western landscape, the 1-mi surveying grid
was too large to evaluate streamside forest composition
based on bearing-tree data; (2) black cottonwood, the pri-
mary riparian tree species in the study area, was considered
a poor choice as a bearing tree because of its low dura-
bility, and its occurrence at section corners was possibly
underrepresented in GLO data; (3) shrub communities are
often dominant in riparian areas, but the quantitative GLO
data pertain to trees; and (4) possibly because of the desert
landscape, GLO notes were scant, and riparian character-
istics were inconsistently reported.
Historical Photographs
Historical photographs were obtained primarily from the
private collection of Steve Lent, stored at the A. R. Bowman
Memorial Museum in Prineville, Oregon, and acquired in
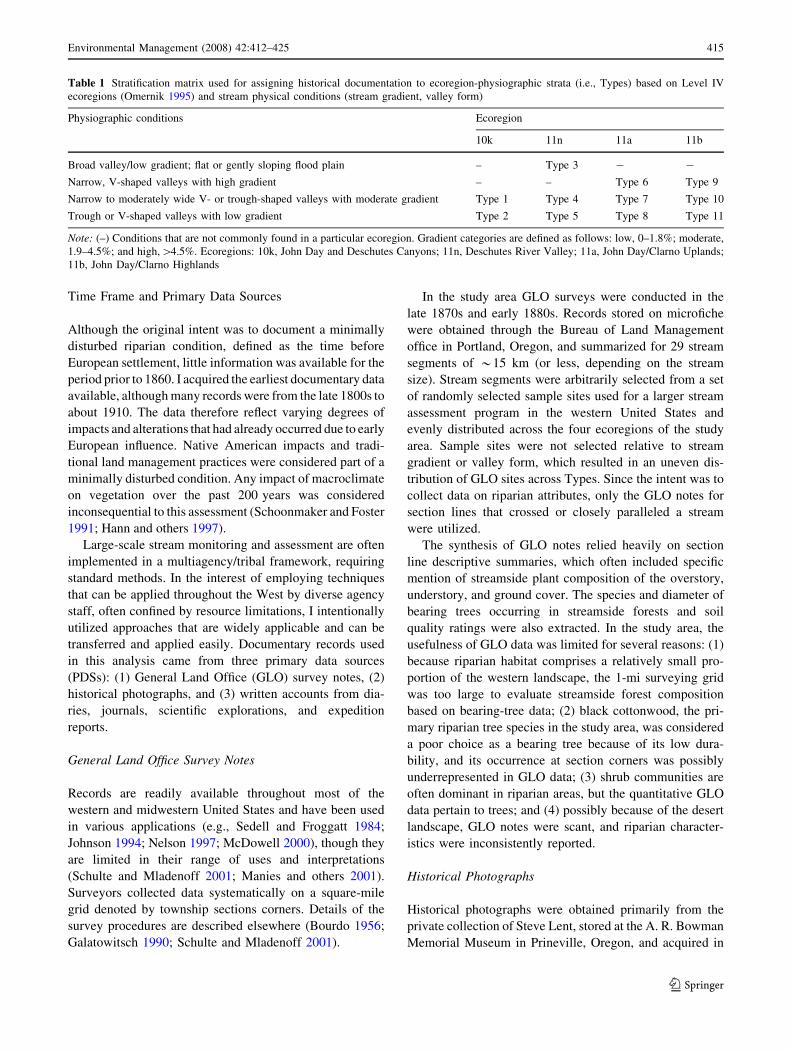
Table 1 Stratification matrix used for assigning historical documentation to ecoregion-physiographic strata (i.e., Types) based on Level IV
ecoregions (Omernik 1995) and stream physical conditions (stream gradient, valley form)
Physiographic conditions Ecoregion
10k 11n 11a 11b
Broad valley/low gradient; flat or gently sloping flood plain – Type 3 - -
Narrow, V-shaped valleys with high gradient – – Type 6 Type 9
Narrow to moderately wide V- or trough-shaped valleys with moderate gradient Type 1 Type 4 Type 7 Type 10
Trough or V-shaped valleys with low gradient Type 2 Type 5 Type 8 Type 11
Note: (–) Conditions that are not commonly found in a particular ecoregion. Gradient categories are defined as follows: low, 0–1.8%; moderate,
1.9–4.5%; and high,[4.5%. Ecoregions: 10k, John Day and Deschutes Canyons; 11n, Deschutes River Valley; 11a, John Day/Clarno Uplands;
11b, John Day/Clarno Highlands
Environmental Management (2008) 42:412–425 415
123
2000. Additional photographs came from the Salem, Oregon,
Public Library Historic Photograph Collection (http://
photos.salemhistory.org/) and from several published sour-
ces. Photographs were available for most Types; most were
taken in the western half of the study area in the late 1890s
through 1911.
Trees and shrubs in photographs were identified to the
extent possible based on knowledge of the native vegeta-
tion of eastern Oregon. Vegetation extent, structure, and
interaction with the stream, and physical characteristics of
streams were also described from photos.
Written Accounts
Written accounts were extracted from a range of sources
including journals of explorers and settlers, university and
government exploration reports, natural history surveys,
historical summaries, Web sites, and historical society
documents. One more recent source, partial results of a
1942 stream survey, provided valuable information spe-
cifically about stream and riparian areas and was therefore
used, but usually in conjunction with older sources.
Information Extracted from Data Sources
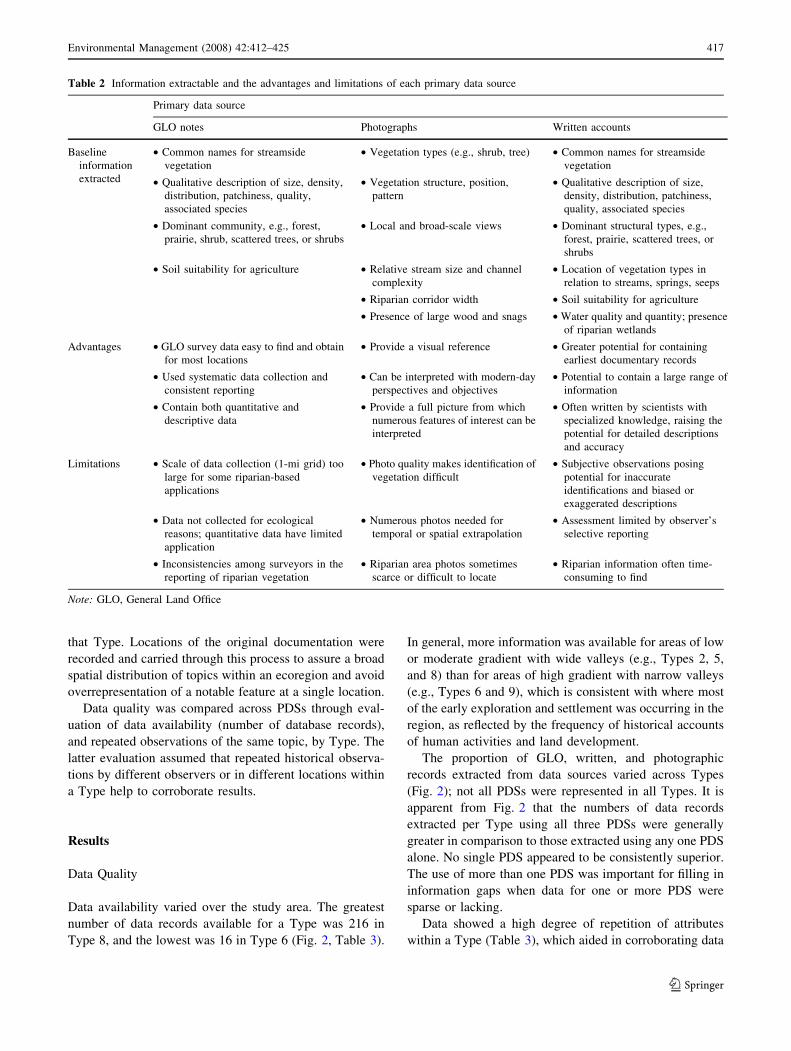
A variety of unique riparian information was extracted
from each of the three PDSs (Table 2). Each PDS had
advantages and limitations (Table 2), which made the
combination of all three more effective for gathering and
corroborating information about riparian conditions, com-
pared to using only one PDS. For example, GLO notes and
written accounts typically list plant species or types,
whereas photographs reveal more detail about vegetation
extent, structure, and pattern. Photographs allow a modern
interpretation, whereas GLO notes and written accounts are
limited to 19th-century perspectives and interests. Written
records, although very subjective and sometimes exagger-
ated, are still among the earliest and most descriptive
documentation that exists.
The amount of extractable information per source was
limited and often incidental to the intended purpose of the
source. Presumably, the limitation was partly because of the
isolation of the region and partly because of a perceived lack
of interest by early inhabitants in streams, riparian habitats,
and fish. During settlement of the West, immigrants,
explorers, and surveyors focused on natural resources for
survival and economic development and viewed rivers as a
source of irrigation and transport, but with indifference in
other respects. Scientific expeditions to the region concen-
trated on landscape features, geology, and collection and
naming of biological specimens, but little attention was
given to characteristics of rivers or riparian areas. Grant
(1993) identified the same disinterest in many aspects of
streams and rivers, based on interviews with long-term
inhabitants in a portion of the John Day Basin.
Information Synthesis and Data Quality Assessment
Only historical accounts that provided a specific location
were used so that each account could be assigned to a Type
(Table 1). Historical accounts interpreted from all docu-
mentary sources were entered into a database, assigned a
Type, and grouped by PDS. Each account represented
historical documentation from a specific source, location,
year, and observer (if pertinent). Accounts could be lengthy
descriptions covering a range of topics. The GLO survey
notes for each segment were considered separate sources,
since surveyors often differed among regions and stream
segments. Similarly, each photograph was considered a
separate source of data.
A topic was treated as specific information about a
resource component, for example, ‘‘scattered cottonwoods
along stream.’’ When accounts reported more than one
topic, they were replicated into two or more database
records such that each record represented unique data from
the historical account. For example, an account reporting
‘‘Willow and alder lining banks with large cottonwoods
interspersed’’ was replicated into three separate database
records, each documenting the presence, and description if
pertinent, of a separate type of tree of shrub. For each Type
and PDS, records were sorted and then tallied by topic.
Using the lists of topics and their reporting frequency in
each Type as a framework, I developed descriptive sum-
maries of historical riparian conditions in each Type,
illustrated with descriptive detail, quotations, and photo-
graphs from the original historical accounts. Characteristics
that distinguished Types were identified through a sys-
tematic comparison process facilitated by developing
attributes, i.e., descriptive phrases, based on similar or
unique topics from the individual lists of topics for each
Type. In this step, some of the original detail was sacrificed
to compartmentalize topics for comparing and contrasting
riparian conditions across Types. For example, details of
the extent, height, and density of willows were sacrificed,
and willow and alder—two common riparian shrubs with
similar structure—were combined into one attribute; sim-
ilarly, bunchgrasses, prairies, and meadows were grouped
under one attribute. Although this synthesis generalized
and condensed the original wording, it facilitated com-
parisons of descriptive data reported in multiple formats
across Types. I tallied the number of records of each
attribute for each Type (all PDS combined) for a semi-
quantitative comparison of presence/absence and frequency
of reporting of attributes, assuming that the proportion of
records from a Type corresponding to each attribute pro-
vided a rough estimate of the prominence of an attribute in
416 Environmental Management (2008) 42:412–425
123
that Type. Locations of the original documentation were
recorded and carried through this process to assure a broad
spatial distribution of topics within an ecoregion and avoid
overrepresentation of a notable feature at a single location.
Data quality was compared across PDSs through eval-
uation of data availability (number of database records),
and repeated observations of the same topic, by Type. The
latter evaluation assumed that repeated historical observa-
tions by different observers or in different locations within
a Type help to corroborate results.
Results
Data Quality
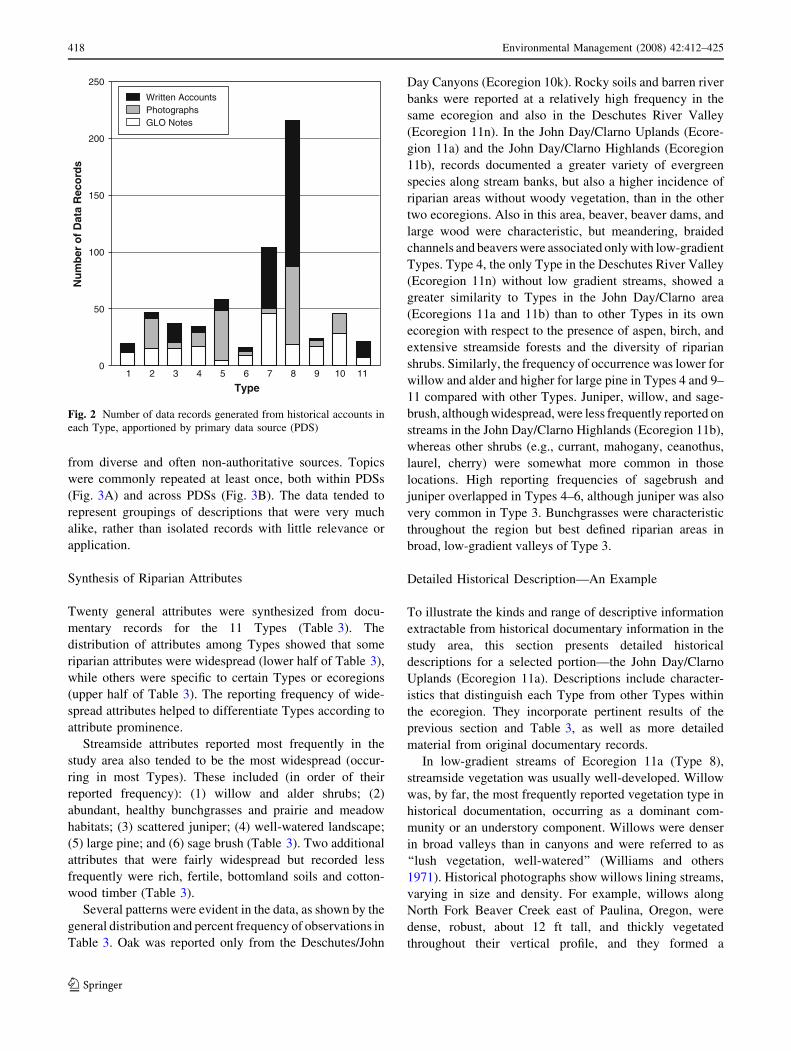
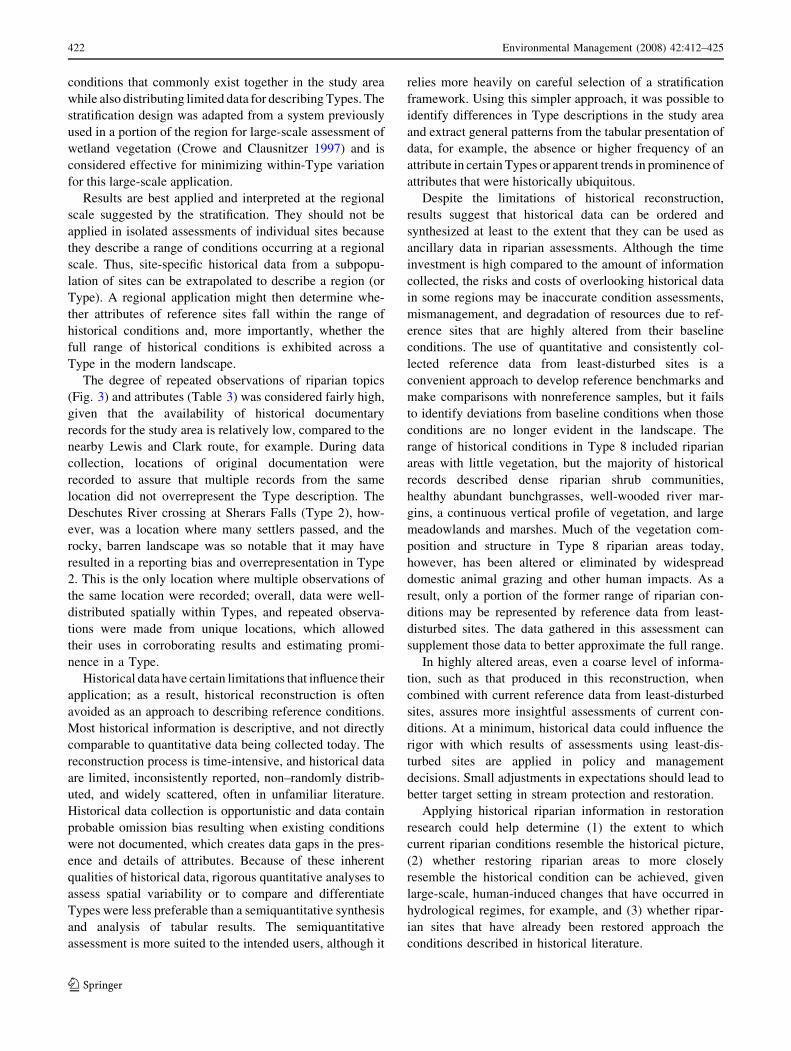
Data availability varied over the study area. The greatest
number of data records available for a Type was 216 in
Type 8, and the lowest was 16 in Type 6 (Fig. 2, Table 3).
In general, more information was available for areas of low
or moderate gradient with wide valleys (e.g., Types 2, 5,
and 8) than for areas of high gradient with narrow valleys
(e.g., Types 6 and 9), which is consistent with where most
of the early exploration and settlement was occurring in the
region, as reflected by the frequency of historical accounts
of human activities and land development.
The proportion of GLO, written, and photographic
records extracted from data sources varied across Types
(Fig. 2); not all PDSs were represented in all Types. It is
apparent from Fig. 2 that the numbers of data records
extracted per Type using all three PDSs were generally
greater in comparison to those extracted using any one PDS
alone. No single PDS appeared to be consistently superior.
The use of more than one PDS was important for filling in
information gaps when data for one or more PDS were
sparse or lacking.
Data showed a high degree of repetition of attributes
within a Type (Table 3), which aided in corroborating data
Table 2 Information extractable and the advantages and limitations of each primary data source
Primary data source
GLO notes Photographs Written accounts
Baseline
information
extracted
• Common names for streamside
vegetation
• Vegetation types (e.g., shrub, tree) • Common names for streamside
vegetation
• Qualitative description of size, density,
distribution, patchiness, quality,
associated species
• Vegetation structure, position,
pattern
• Qualitative description of size,
density, distribution, patchiness,
quality, associated species
• Dominant community, e.g., forest,
prairie, shrub, scattered trees, or shrubs
• Local and broad-scale views • Dominant structural types, e.g.,
forest, prairie, scattered trees, or
shrubs
• Soil suitability for agriculture • Relative stream size and channel
complexity
• Location of vegetation types in
relation to streams, springs, seeps
• Riparian corridor width • Soil suitability for agriculture
• Presence of large wood and snags • Water quality and quantity; presence
of riparian wetlands
Advantages • GLO survey data easy to find and obtain
for most locations
• Provide a visual reference • Greater potential for containing
earliest documentary records
• Used systematic data collection and
consistent reporting
• Can be interpreted with modern-day
perspectives and objectives
• Potential to contain a large range of
information
• Contain both quantitative and
descriptive data
• Provide a full picture from which
numerous features of interest can be
interpreted
• Often written by scientists with
specialized knowledge, raising the
potential for detailed descriptions
and accuracy
Limitations • Scale of data collection (1-mi grid) too
large for some riparian-based
applications
• Photo quality makes identification of
vegetation difficult
• Subjective observations posing
potential for inaccurate
identifications and biased or
exaggerated descriptions
• Data not collected for ecological
reasons; quantitative data have limited
application
• Numerous photos needed for
temporal or spatial extrapolation
• Assessment limited by observer’s
selective reporting
• Inconsistencies among surveyors in the
reporting of riparian vegetation
• Riparian area photos sometimes
scarce or difficult to locate
• Riparian information often time-
consuming to find
Note: GLO, General Land Office
Environmental Management (2008) 42:412–425 417
123
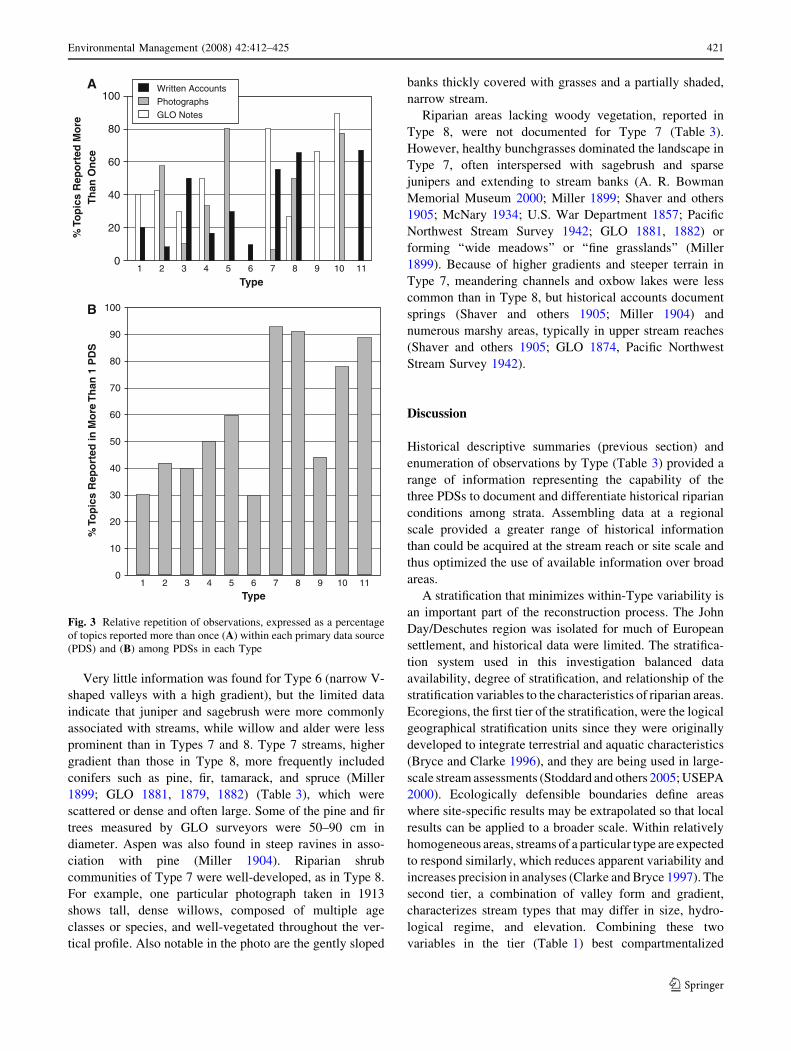
from diverse and often non-authoritative sources. Topics
were commonly repeated at least once, both within PDSs
(Fig. 3A) and across PDSs (Fig. 3B). The data tended to
represent groupings of descriptions that were very much
alike, rather than isolated records with little relevance or
application.
Synthesis of Riparian Attributes
Twenty general attributes were synthesized from docu-
mentary records for the 11 Types (Table 3). The
distribution of attributes among Types showed that some
riparian attributes were widespread (lower half of Table 3),
while others were specific to certain Types or ecoregions
(upper half of Table 3). The reporting frequency of wide-
spread attributes helped to differentiate Types according to
attribute prominence.
Streamside attributes reported most frequently in the
study area also tended to be the most widespread (occur-
ring in most Types). These included (in order of their
reported frequency): (1) willow and alder shrubs; (2)
abundant, healthy bunchgrasses and prairie and meadow
habitats; (3) scattered juniper; (4) well-watered landscape;
(5) large pine; and (6) sage brush (Table 3). Two additional
attributes that were fairly widespread but recorded less
frequently were rich, fertile, bottomland soils and cotton-
wood timber (Table 3).
Several patterns were evident in the data, as shown by the
general distribution and percent frequency of observations in
Table 3. Oak was reported only from the Deschutes/John
Day Canyons (Ecoregion 10k). Rocky soils and barren river
banks were reported at a relatively high frequency in the
same ecoregion and also in the Deschutes River Valley
(Ecoregion 11n). In the John Day/Clarno Uplands (Ecore-
gion 11a) and the John Day/Clarno Highlands (Ecoregion
11b), records documented a greater variety of evergreen
species along stream banks, but also a higher incidence of
riparian areas without woody vegetation, than in the other
two ecoregions. Also in this area, beaver, beaver dams, and
large wood were characteristic, but meandering, braided
channels and beavers were associated only with low-gradient
Types. Type 4, the only Type in the Deschutes River Valley
(Ecoregion 11n) without low gradient streams, showed a
greater similarity to Types in the John Day/Clarno area
(Ecoregions 11a and 11b) than to other Types in its own
ecoregion with respect to the presence of aspen, birch, and
extensive streamside forests and the diversity of riparian
shrubs. Similarly, the frequency of occurrence was lower for
willow and alder and higher for large pine in Types 4 and 9–
11 compared with other Types. Juniper, willow, and sage-
brush, although widespread, were less frequently reported on
streams in the John Day/Clarno Highlands (Ecoregion 11b),
whereas other shrubs (e.g., currant, mahogany, ceanothus,
laurel, cherry) were somewhat more common in those
locations. High reporting frequencies of sagebrush and
juniper overlapped in Types 4–6, although juniper was also
very common in Type 3. Bunchgrasses were characteristic
throughout the region but best defined riparian areas in
broad, low-gradient valleys of Type 3.
Detailed Historical Description—An Example
To illustrate the kinds and range of descriptive information
extractable from historical documentary information in the
study area, this section presents detailed historical
descriptions for a selected portion—the John Day/Clarno
Uplands (Ecoregion 11a). Descriptions include character-
istics that distinguish each Type from other Types within
the ecoregion. They incorporate pertinent results of the
previous section and Table 3, as well as more detailed
material from original documentary records.
In low-gradient streams of Ecoregion 11a (Type 8),
streamside vegetation was usually well-developed. Willow
was, by far, the most frequently reported vegetation type in
historical documentation, occurring as a dominant com-
munity or an understory component. Willows were denser
in broad valleys than in canyons and were referred to as
‘‘lush vegetation, well-watered’’ (Williams and others
1971). Historical photographs show willows lining streams,
varying in size and density. For example, willows along
North Fork Beaver Creek east of Paulina, Oregon, were
dense, robust, about 12 ft tall, and thickly vegetated
throughout their vertical profile, and they formed a
Type
250
200
150
100
50
01 2 3 4 5 6 7 8 9 10 11
Nu
mb
er o
f D
ata
Rec
ord
s
Written AccountsPhotographsGLO Notes
Fig. 2 Number of data records generated from historical accounts in
each Type, apportioned by primary data source (PDS)
418 Environmental Management (2008) 42:412–425
123
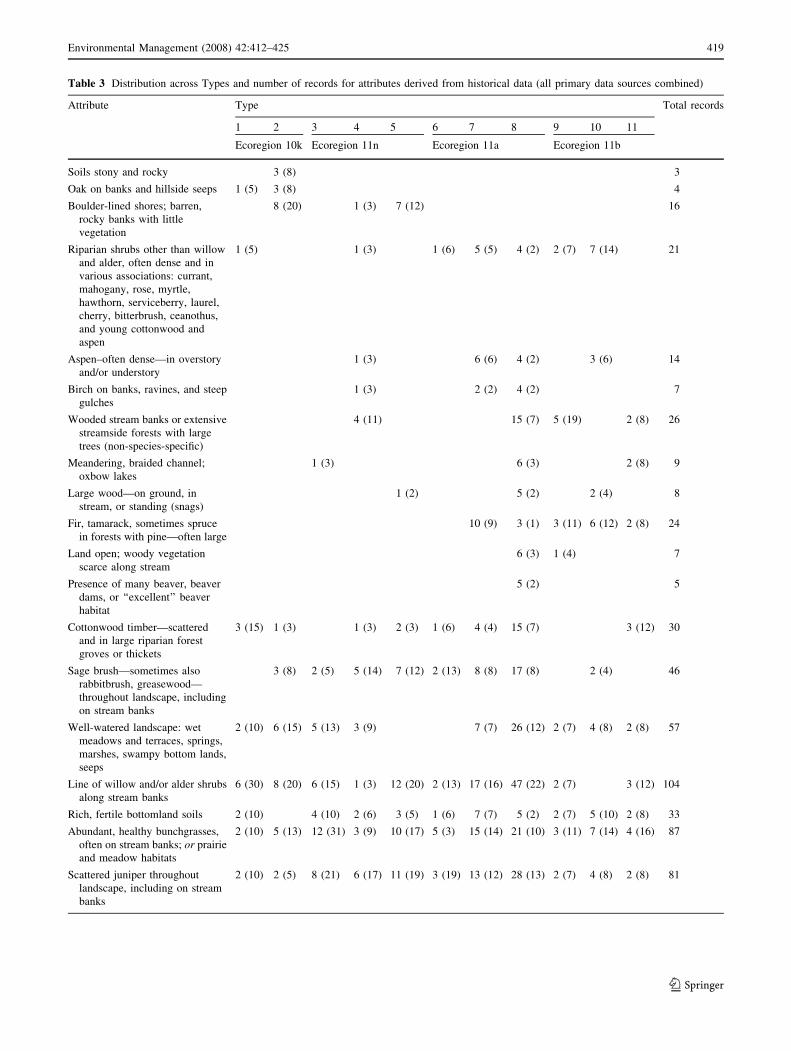
Table 3 Distribution across Types and number of records for attributes derived from historical data (all primary data sources combined)
Attribute Type Total records
1 2 3 4 5 6 7 8 9 10 11
Ecoregion 10k Ecoregion 11n Ecoregion 11a Ecoregion 11b
Soils stony and rocky 3 (8) 3
Oak on banks and hillside seeps 1 (5) 3 (8) 4
Boulder-lined shores; barren,
rocky banks with little
vegetation
8 (20) 1 (3) 7 (12) 16
Riparian shrubs other than willow
and alder, often dense and in
various associations: currant,
mahogany, rose, myrtle,
hawthorn, serviceberry, laurel,
cherry, bitterbrush, ceanothus,
and young cottonwood and
aspen
1 (5) 1 (3) 1 (6) 5 (5) 4 (2) 2 (7) 7 (14) 21
Aspen–often dense—in overstory
and/or understory
1 (3) 6 (6) 4 (2) 3 (6) 14
Birch on banks, ravines, and steep
gulches
1 (3) 2 (2) 4 (2) 7
Wooded stream banks or extensive
streamside forests with large
trees (non-species-specific)
4 (11) 15 (7) 5 (19) 2 (8) 26
Meandering, braided channel;
oxbow lakes
1 (3) 6 (3) 2 (8) 9
Large wood—on ground, in
stream, or standing (snags)
1 (2) 5 (2) 2 (4) 8
Fir, tamarack, sometimes spruce
in forests with pine—often large
10 (9) 3 (1) 3 (11) 6 (12) 2 (8) 24
Land open; woody vegetation
scarce along stream
6 (3) 1 (4) 7
Presence of many beaver, beaver
dams, or ‘‘excellent’’ beaver
habitat
5 (2) 5
Cottonwood timber—scattered
and in large riparian forest
groves or thickets
3 (15) 1 (3) 1 (3) 2 (3) 1 (6) 4 (4) 15 (7) 3 (12) 30
Sage brush—sometimes also
rabbitbrush, greasewood—
throughout landscape, including
on stream banks
3 (8) 2 (5) 5 (14) 7 (12) 2 (13) 8 (8) 17 (8) 2 (4) 46
Well-watered landscape: wet
meadows and terraces, springs,
marshes, swampy bottom lands,
seeps
2 (10) 6 (15) 5 (13) 3 (9) 7 (7) 26 (12) 2 (7) 4 (8) 2 (8) 57
Line of willow and/or alder shrubs
along stream banks
6 (30) 8 (20) 6 (15) 1 (3) 12 (20) 2 (13) 17 (16) 47 (22) 2 (7) 3 (12) 104
Rich, fertile bottomland soils 2 (10) 4 (10) 2 (6) 3 (5) 1 (6) 7 (7) 5 (2) 2 (7) 5 (10) 2 (8) 33
Abundant, healthy bunchgrasses,
often on stream banks; or prairie
and meadow habitats
2 (10) 5 (13) 12 (31) 3 (9) 10 (17) 5 (3) 15 (14) 21 (10) 3 (11) 7 (14) 4 (16) 87
Scattered juniper throughout
landscape, including on stream
banks
2 (10) 2 (5) 8 (21) 6 (17) 11 (19) 3 (19) 13 (12) 28 (13) 2 (7) 4 (8) 2 (8) 81
Environmental Management (2008) 42:412–425 419
123
continuous wide band along the bank. Of this creek, Peter
Skene Ogden wrote, ‘‘Indians set fire to plain; willows on
creek stopped fire.’’ In contrast, Ogden wrote of the
Crooked River southeast of Prineville, ‘‘banks of river
well-lined with willow, none of great size’’ (Rich and
Johnson 1950), and photographs show small, but scattered,
willows along the banks of the Ochoco River. In addition to
willow, several accounts mention the presence of other
understory shrubs, including alder (A. R. Bowman
Memorial Museum 2000; Pacific Northwest Stream Survey
1942; Russell 1905; GLO 1873), currant (Elliott 1913;
Minear 1999; GLO 1879), gooseberries, serviceberries,
choke cherries (Minear 1999), mahogany, rose (GLO
1879), and ‘‘thorn bushes’’ (Miller 1899).
Cottonwood, documented multiple times in all PDSs,
was the dominant riparian overstory species, growing in
dense stands of small trees or more widely spaced (Pacific
Northwest Stream Survey 1942). It typically occurred in
association with aspen, willow, alder, and sometimes birch.
Observations throughout the 1800s reveal that most river
margins were well-wooded with aspen, cottonwood, and
willow, including portions of the Crooked River and other
tributaries of the Deschutes River, the main stem and South
Fork John Day River, and all tributaries of the North Fork
John Day River (Davies 1961; Williams and others 1971;
Rich and Johnson 1950; Elliott 1913; McNary 1934). Birch
was noted in only a few accounts (Miller 1899, 1904; GLO
1879); pine was documented mostly on the hills, but it also
occurred near streams (GLO 1879, A. R. Bowman
Memorial Museum 2000), as did scattered fir and juniper
(GLO 1879, A. R. Bowman Memorial Museum 2000;
McNary 1934; Miller 1904).
Sagebrush, greasewood, and juniper bordered streams in
many locations (A. R. Bowman Memorial Museum 2000;
McNary 1934; Sharp 1985; Pacific Northwest Stream Survey
1942; U.S. War Department 1857; Miller 1899, 1904; Rich
and Johnson 1950; GLO 1873, 1879). Extensive stands of
greasewood (Sarcobatus vermiculatus)-big sagebrush
(Artemisia tridentata), the climax tall shrub community of
flat alluvial bottomland, were cleared for cultivated agri-
culture after the turn of the 20th century and are now
completely absent in some locations (Sharp 1985).
Other historical accounts suggest an open landscape with
little or no woody vegetation along some stream reaches.
Stephen Hall Meek wrote in 1845 of the Crooked River east
of the North Fork confluence, ‘‘a delightful stream running to
the southwest, affording an abundance of fine grass; no
wood,’’ and of the South Fork Crooked River, ‘‘found no
wood except sage which grew in abundance near its margin’’
(McNary 1934). Later reports (Shaver and others 1905;
Pacific Northwest Stream Survey 1942) also note the lack of
trees or shrubs and the presence of only grasses and sage on
the South Fork Crooked River. Similarly, of the John Day
basin (which comprises other Types), Knowlton (1902)
stated, ‘‘The present woody flora of the John Day basin is
inconsiderable, consisting of pines along the higher ridges,
occasional junipers along the lower ridges, and a scant fringe
of cottonwoods and willows along the streams. At best, not
more than three families are represented.’’
Historical documentation provides evidence of large
meadowlands in river valleys and marshes with herbaceous
wetland plants in wider, level stream bottoms (Miller 1899,
1904; Shaver and others 1905; Pacific Northwest Stream
Survey 1942). These areas were described as ‘‘beautiful
meadowlands,’’ ‘‘wide meadows,’’ and ‘‘fine grasslands.’’
Meandering, braided, and shifting channels were docu-
mented in wide valleys (McNary 1934; A. R. Bowman
Memorial Museum 2000; Russell 1905; GLO 1873, 1879),
suggesting the presence of off-channel wetlands. Undoubt-
edly, many beaver were associated with these habitats.
During his 1825 trapping expedition Ogden writes of the
main stem John Day, ‘‘River is a fine-looking stream for
beaver—well-wooded with poplar and aspen’’ and ‘‘Beaver
habitat on [Crooked] river is exceptional’’ (Rich and Johnson
1950). Paralleling Ogden’s observations, an 1881 account
states, ‘‘The Crooked River was as clear as a mountain
stream. There were lots of beaver and beaver dams...’’
(Redmond Spokesman August 22, 1955; Minear 1999).
Table 3 continued
Attribute Type Total records
1 2 3 4 5 6 7 8 9 10 11
Ecoregion 10k Ecoregion 11n Ecoregion 11a Ecoregion 11b
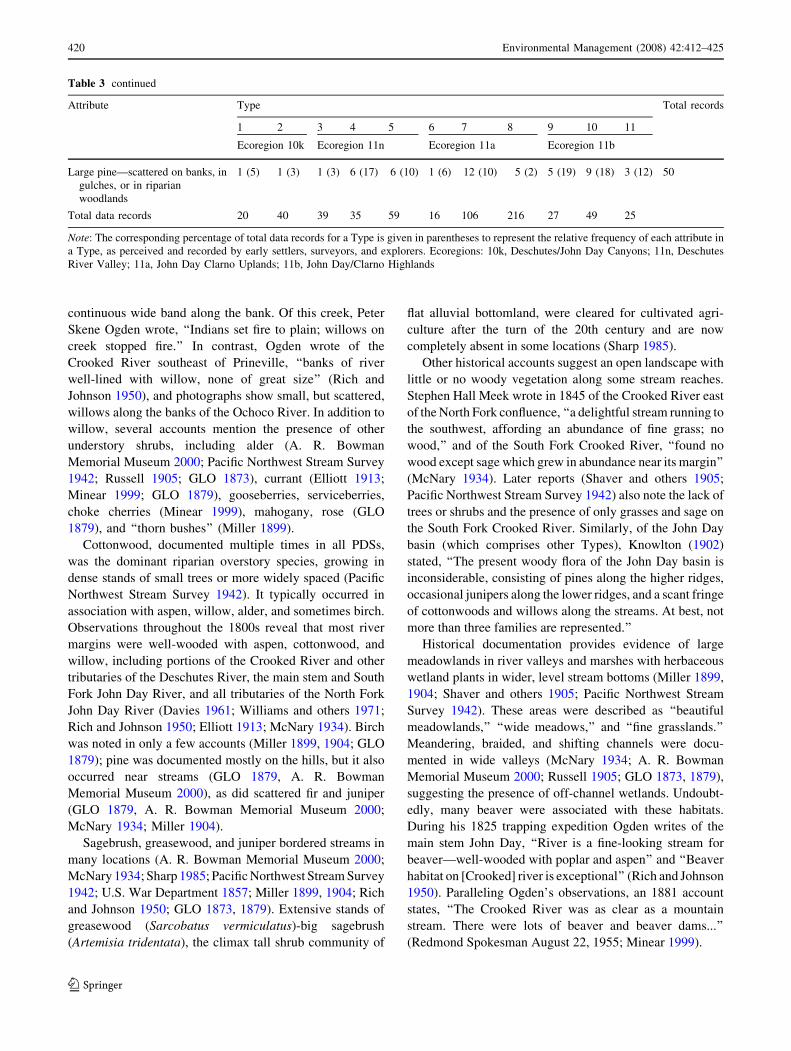
Large pine—scattered on banks, in
gulches, or in riparian
woodlands
1 (5) 1 (3) 1 (3) 6 (17) 6 (10) 1 (6) 12 (10) 5 (2) 5 (19) 9 (18) 3 (12) 50
Total data records 20 40 39 35 59 16 106 216 27 49 25
Note: The corresponding percentage of total data records for a Type is given in parentheses to represent the relative frequency of each attribute in
a Type, as perceived and recorded by early settlers, surveyors, and explorers. Ecoregions: 10k, Deschutes/John Day Canyons; 11n, Deschutes
River Valley; 11a, John Day Clarno Uplands; 11b, John Day/Clarno Highlands
420 Environmental Management (2008) 42:412–425
123
Very little information was found for Type 6 (narrow V-
shaped valleys with a high gradient), but the limited data
indicate that juniper and sagebrush were more commonly
associated with streams, while willow and alder were less
prominent than in Types 7 and 8. Type 7 streams, higher
gradient than those in Type 8, more frequently included
conifers such as pine, fir, tamarack, and spruce (Miller
1899; GLO 1881, 1879, 1882) (Table 3), which were
scattered or dense and often large. Some of the pine and fir
trees measured by GLO surveyors were 50–90 cm in
diameter. Aspen was also found in steep ravines in asso-
ciation with pine (Miller 1904). Riparian shrub
communities of Type 7 were well-developed, as in Type 8.
For example, one particular photograph taken in 1913
shows tall, dense willows, composed of multiple age
classes or species, and well-vegetated throughout the ver-
tical profile. Also notable in the photo are the gently sloped
banks thickly covered with grasses and a partially shaded,
narrow stream.
Riparian areas lacking woody vegetation, reported in
Type 8, were not documented for Type 7 (Table 3).
However, healthy bunchgrasses dominated the landscape in
Type 7, often interspersed with sagebrush and sparse
junipers and extending to stream banks (A. R. Bowman
Memorial Museum 2000; Miller 1899; Shaver and others
1905; McNary 1934; U.S. War Department 1857; Pacific
Northwest Stream Survey 1942; GLO 1881, 1882) or
forming ‘‘wide meadows’’ or ‘‘fine grasslands’’ (Miller
1899). Because of higher gradients and steeper terrain in
Type 7, meandering channels and oxbow lakes were less
common than in Type 8, but historical accounts document
springs (Shaver and others 1905; Miller 1904) and
numerous marshy areas, typically in upper stream reaches
(Shaver and others 1905; GLO 1874, Pacific Northwest
Stream Survey 1942).
Discussion
Historical descriptive summaries (previous section) and
enumeration of observations by Type (Table 3) provided a
range of information representing the capability of the
three PDSs to document and differentiate historical riparian
conditions among strata. Assembling data at a regional
scale provided a greater range of historical information
than could be acquired at the stream reach or site scale and
thus optimized the use of available information over broad
areas.
A stratification that minimizes within-Type variability is
an important part of the reconstruction process. The John
Day/Deschutes region was isolated for much of European
settlement, and historical data were limited. The stratifica-
tion system used in this investigation balanced data
availability, degree of stratification, and relationship of the
stratification variables to the characteristics of riparian areas.
Ecoregions, the first tier of the stratification, were the logical
geographical stratification units since they were originally
developed to integrate terrestrial and aquatic characteristics
(Bryce and Clarke 1996), and they are being used in large-
scale stream assessments (Stoddard and others 2005; USEPA
2000). Ecologically defensible boundaries define areas
where site-specific results may be extrapolated so that local
results can be applied to a broader scale. Within relatively
homogeneous areas, streams of a particular type are expected
to respond similarly, which reduces apparent variability and
increases precision in analyses (Clarke and Bryce 1997). The
second tier, a combination of valley form and gradient,
characterizes stream types that may differ in size, hydro-
logical regime, and elevation. Combining these two
variables in the tier (Table 1) best compartmentalized
100
80
70
60
50
40
30
20
10
01 2 3 4 5 6 7 8 9 10 11
% T
op
ics
Rep
ort
ed in
Mo
re T
han
1 P
DS
90
100
80
60
40
20
01 2 3 4 5 6 7 8 9 10 11
% T
op
ics
Rep
ort
ed M
ore
Th
an O
nce
Written Accounts
Photographs
GLO Notes
A
B
Type
Type
Fig. 3 Relative repetition of observations, expressed as a percentage
of topics reported more than once (A) within each primary data source
(PDS) and (B) among PDSs in each Type
Environmental Management (2008) 42:412–425 421
123
conditions that commonly exist together in the study area
while also distributing limited data for describing Types. The
stratification design was adapted from a system previously
used in a portion of the region for large-scale assessment of
wetland vegetation (Crowe and Clausnitzer 1997) and is
considered effective for minimizing within-Type variation
for this large-scale application.
Results are best applied and interpreted at the regional
scale suggested by the stratification. They should not be
applied in isolated assessments of individual sites because
they describe a range of conditions occurring at a regional
scale. Thus, site-specific historical data from a subpopu-
lation of sites can be extrapolated to describe a region (or
Type). A regional application might then determine whe-
ther attributes of reference sites fall within the range of
historical conditions and, more importantly, whether the
full range of historical conditions is exhibited across a
Type in the modern landscape.
The degree of repeated observations of riparian topics
(Fig. 3) and attributes (Table 3) was considered fairly high,
given that the availability of historical documentary
records for the study area is relatively low, compared to the
nearby Lewis and Clark route, for example. During data
collection, locations of original documentation were
recorded to assure that multiple records from the same
location did not overrepresent the Type description. The
Deschutes River crossing at Sherars Falls (Type 2), how-
ever, was a location where many settlers passed, and the
rocky, barren landscape was so notable that it may have
resulted in a reporting bias and overrepresentation in Type
2. This is the only location where multiple observations of
the same location were recorded; overall, data were well-
distributed spatially within Types, and repeated observa-
tions were made from unique locations, which allowed
their uses in corroborating results and estimating promi-
nence in a Type.
Historical data have certain limitations that influence their
application; as a result, historical reconstruction is often
avoided as an approach to describing reference conditions.
Most historical information is descriptive, and not directly
comparable to quantitative data being collected today. The
reconstruction process is time-intensive, and historical data
are limited, inconsistently reported, non–randomly distrib-
uted, and widely scattered, often in unfamiliar literature.
Historical data collection is opportunistic and data contain
probable omission bias resulting when existing conditions
were not documented, which creates data gaps in the pres-
ence and details of attributes. Because of these inherent
qualities of historical data, rigorous quantitative analyses to
assess spatial variability or to compare and differentiate
Types were less preferable than a semiquantitative synthesis
and analysis of tabular results. The semiquantitative
assessment is more suited to the intended users, although it
relies more heavily on careful selection of a stratification
framework. Using this simpler approach, it was possible to
identify differences in Type descriptions in the study area
and extract general patterns from the tabular presentation of
data, for example, the absence or higher frequency of an
attribute in certain Types or apparent trends in prominence of
attributes that were historically ubiquitous.
Despite the limitations of historical reconstruction,
results suggest that historical data can be ordered and
synthesized at least to the extent that they can be used as
ancillary data in riparian assessments. Although the time
investment is high compared to the amount of information
collected, the risks and costs of overlooking historical data
in some regions may be inaccurate condition assessments,
mismanagement, and degradation of resources due to ref-
erence sites that are highly altered from their baseline
conditions. The use of quantitative and consistently col-
lected reference data from least-disturbed sites is a
convenient approach to develop reference benchmarks and
make comparisons with nonreference samples, but it fails
to identify deviations from baseline conditions when those
conditions are no longer evident in the landscape. The
range of historical conditions in Type 8 included riparian
areas with little vegetation, but the majority of historical
records described dense riparian shrub communities,
healthy abundant bunchgrasses, well-wooded river mar-
gins, a continuous vertical profile of vegetation, and large
meadowlands and marshes. Much of the vegetation com-
position and structure in Type 8 riparian areas today,
however, has been altered or eliminated by widespread
domestic animal grazing and other human impacts. As a
result, only a portion of the former range of riparian con-
ditions may be represented by reference data from least-
disturbed sites. The data gathered in this assessment can
supplement those data to better approximate the full range.
In highly altered areas, even a coarse level of informa-
tion, such as that produced in this reconstruction, when
combined with current reference data from least-disturbed
sites, assures more insightful assessments of current con-
ditions. At a minimum, historical data could influence the
rigor with which results of assessments using least-dis-
turbed sites are applied in policy and management
decisions. Small adjustments in expectations should lead to
better target setting in stream protection and restoration.
Applying historical riparian information in restoration
research could help determine (1) the extent to which
current riparian conditions resemble the historical picture,
(2) whether restoring riparian areas to more closely
resemble the historical condition can be achieved, given
large-scale, human-induced changes that have occurred in
hydrological regimes, for example, and (3) whether ripar-
ian sites that have already been restored approach the
conditions described in historical literature.
422 Environmental Management (2008) 42:412–425
123
This investigation used PDSs that might be limited in
parts of the world with long histories of human presence or
where significant human settlement and impacts predate
photography or land surveys. However, the approach can
be adapted to utilize different kinds of documentary
records or different time frames. Information about human
history, land uses, and impacts in a region might support
the use of a time frame following settlement—for example,
in countries with longer histories than the United States—
but results would have more limited use and must be
interpreted accordingly. Historical reconstruction is prob-
ably not cost-effective in regions with minimal human
presence and impacts, for example, certain mountainous
regions, parks, or protected areas, since least-disturbed
sites typically represent a minimally altered condition in
those circumstances and can supply ample reference data.
In conclusion, the results are representative of the kinds
of historical information that can be extracted from the
three PDSs used. The procedure demonstrated that (1)
historical documentary records can be synthesized by
stratum to develop descriptive summaries of streamside
communities and other riparian characteristics; (2) riparian
attributes can be extracted and evaluated to illustrate
descriptive differences in riparian conditions among eco-
physiographic strata (i.e., Types); (3) observations of
specific attributes are encountered repeatedly in historical
literature; and (4) information for all Types could not have
been provided with any single PDS—the variety of primary
data sources provided a broader picture and better cor-
roboration of results.
Limited historical data in the John Day/Deschutes
region resulted in descriptive attributes that are probably
too coarse for use as a sole data source for developing
reference conditions in most applications. Results are
considered useful as supplemental information for identi-
fying a representative group of least-disturbed sites or for
supplementing regional reference-site data that do not
include the historical condition. Finer detail and better
differentiation of Types might be achieved in regions that
are more data-rich; thus the approach will have varying
degrees of utility depending on location.
Acknowledgments I thank Paul Ringold for his support of this
project and Jerry Barker and Sandra Bryce for their assistance in the
conceptual and data collection stages of the research. Suzanne Pierson
of CSC Corporation produced Fig. 1 and revised and formatted all
other figures for publication. Gary Bishop calculated stream gradients
and produced several working maps for the project. I am grateful to
Steve Lent at the A. R. Bowman Memorial Museum in Prineville,
Oregon, for sharing a large portion of his historical photographic
collection. I also thank peer reviewers Marc Coles-Ritchie, Phil
Larsen, and Robert Hughes for their constructive input on early drafts
and three anonymous reviewers for helpful critique and suggestions
for improving the final draft. The research in this article was funded
by the U.S. Environmental Protection Agency (EPA). This document
was prepared at the EPA National Health and Environmental Effects
Research Laboratory (NHEERL), Western Ecology Division (WED),
in Corvallis, Oregon, through Contracts 68-D-01-005 and EP-D-06-
013 to Dynamac Corporation. It has been subjected to the agency’s
peer and administrative review and approved for publication.
References
A. R. Bowman Memorial Museum (2000) Photographic collection of
Steve Lent. Prineville, OR. Photographs accessed September 27,
2000
Barker JP (1996) Archaeological contributions to ecosystem man-
agement: a policy rationale from the integrated resources
management workshop at the SAA ‘‘Save the Past for the
Future’’ conference. Society of American Archaeologists Bulle-
tin 14(2):15
Black BA, Abrams MD (2001) Influences of Native Americans and
surveyor biases on metes and bounds witness-tree distribution.
Ecology 82(9):2574–2586
Bourdo EA (1956) A review of the general land office survey and of
its use in quantitative studies of former forests. Ecology
37(4):754–768
Boyle CA, Lavkulich L, Schreier H, Kiss E (1997) Changes in land
cover and subsequent effects on lower Fraser basin ecosystems
from 1827 to 1990. Environmental Management 21(2):185–196
Bryce SA, Clarke SE (1996) Landscape-level ecological regions:
linking state-level ecoregion frameworks with stream habitat
classifications. Environmental Management 20(3):297–311
Clarke SE, Bryce SA (eds) (1997) Hierarchical subdivisions of the
Columbia Plateau and Blue Mountains ecoregions, Oregon and
Washington. U.S. Department of Agriculture Forest Service,
General Technical Report PNW-GTR-395. Pacific Northwest
Research Station, Portland, OR
Collins BD, Montgomery DR, Haas AD (2002) Historical changes in
the distribution and functions of large wood in Puget Lowland
rivers. Canadian Journal of Fisheries and Aquatic Science
59:66–76
Cooper CF (1960) Changes in vegetation, structure, and growth of
southwestern pine forests since white settlement. Ecological
Monographs 30:129–164
Crowe EA, RR Clausnitzer (1997) Mid-montane wetland plant
associations of the Malheur, Umatilla and Wallawa-Whitman
National Forests. U.S. Department of Agriculture Forest Service,
Technical Paper R6-NR-ECOL-TP-22-97. Pacific Northwest
Region, Portland, OR
Davies KG (ed) (1961) Peter Skene Ogden’s Snake Country journals,
1826–1827. Hudson’s Bay Record Society, London
Dawdy DR (1989) Feasibility of mapping riparian forests under
natural conditions in California. In: Abell DL (ed) Proceedings
of the California Riparian Systems Conference: protection,
management, and restoration for the 1990s. U.S. Department of
Agriculture Forest Service, General Technical Report PSW-110.
Pacific Southwest Forest and Range Experiment Station, Berke-
ley, CA, pp 63–68
Egan D, Howell EA (eds) (2001a) The historical ecology handbook: a
restorationist’s guide to reference ecosystems. Island Press,
Washington, DC
Egan D, Howell EA (2001b) Introduction. In: Egan D, Howell EA
(eds) The historical ecology handbook: a restorationist’s guide to
reference ecosystems. Island Press, Washington, DC, pp 1–23
Elliot TC (ed) (1913) Journal of John Work’s Snake Country
expedition of 1830–31, second half. Quarterly of the Oregon
Historical Society 14:280–314
Environmental Management (2008) 42:412–425 423
123
Galatowitsch SM (1990) Using original land survey notes to
reconstruct pre-settlement landscapes in the American West.
Great Basin Naturalist 50:181–191
General Land Office (GLO) (1873) Cadastral Survey Records. U.S.
Department of Interior, Bureau of Land Management, Portland,
OR
General Land Office (GLO) (1874) Cadastral Survey Records. U.S.
Department of Interior, Bureau of Land Management, Portland,
OR
General Land Office (GLO) (1879) Cadastral Survey Records. U.S.
Department of Interior, Bureau of Land Management, Portland,
OR
General Land Office (GLO) (1881) Cadastral Survey Records. U.S.
Department of Interior, Bureau of Land Management, Portland,
OR
General Land Office (GLO) (1882) Cadastral Survey Records. U.S.
Department of Interior, Bureau of Land Management, Portland,
OR
Grant K (1993) Historic changes in river channel and riparian woody
vegetation on the Middle Fork John Day Preserve. Unpublished
Report to the Oregon Office of the Nature Conservancy, Portland
Habeck JR (1961) The original vegetation of the mid-Willamette
Valley, Oregon. Northwest Science 35(2):65–77
Hann WJ, Jones JL, Karl MG, Hessburg PF, Keane RE, Long DG,
Menakis JP, McNicoll CH, Leonard SG, Gravenmier RA, Smith
BG (1997) Landscape dynamics of the Basin. In: Quigley TM,
Arbelbide SJ (eds) An assessment of ecosystem components in
the Interior Columbia Basin and portions of the Klamath and
Great Basins, vol II. U.S. Forest Service General Technical
Report PNW-GTR-405. Pacific Northwest Research Station,
Portland, OR, pp 363–1055
Johnson WC (1994) Woodland expansion in the Platte River,
Nebraska: patterns and causes. Ecological Monographs
64(1):45–84
Kaufmann MR, Graham RT, Boyce DA Jr, Moir WH, Perry L,
Reynolds RT, Bassett RL, Mehlhop P, Edminster CB, Block
WM, Corn PS (1994) An ecological basis for ecosystem
management. General Technical Report RM 246. U.S. Depart-
ment of Agriculture Forest Service, Rocky Mountain Forest and
Range Experiment Station, Fort Collins, CO
Kaufmann MR, Huckaby LS, Regan C, Popp J (1998) Forest
reference conditions for ecosystem management in the Sacra-
mento Mountains, New Mexico. General Technical Report
RMRS-GTR-19. U.S. Department of Agriculture Forest Service,
Rocky Mountain Research Station, Fort Collins, CO
Knowlton FH (1902) Fossil flora of the John Day Basin, Oregon.
Bulletin No. 204. U.S. Geological Survey, Department of the
Interior. Government Printing Office, Washington DC
Kovalchik BL (1987) Riparian zone associations of the Deschutes,
Ochoco, Fremont and Winema National Forests. Technical Paper
R6-ECOL-TP-279-87. U.S. Department of Agriculture, Forest
Service, Pacific Northwest Region, Portland, OR
Landres PB, Morgan P, Swanson FJ (1999) Overview of the use of
natural variability concepts in managing ecological systems.
Ecological Applications 9(4):1179–1188
Leopold LB (1951) Vegetation of southwestern watersheds in the
nineteenth century. Geographical Review 41:295–316
Lutz HJ (1930) Original forest composition in northwestern Penn-
sylvania as indicated by early land survey notes. Journal of
Forestry 28:1098–1103
Manies KL, Mladenoff DJ, Nordheim EV (2001) Assessing large-
scale surveyor variability in the historic forest data of the
original U.S. Public Land Survey. Canadian Journal of Forest
Resources 31:1719–1730
Manley PN, Brogan GE, Cook C, Flores ME, Fullmer DG, Husari S,
Jimerson TM, Lux LM, McCain ME, Rose JA, Schmitt G,
Schuyler JC, Skinner MJ (1995) Sustaining ecosystems: a
conceptual framework. U.S. Department of Agriculture Forest
Service, R5-EM-TP-001. Pacific Southwest Region and
Research Station, San Francisco, CA
McDowell PF (2000) Human impacts and river channel adjustment,
northeastern Oregon: implications for restoration. In: Wigington
PJ, Beschta RL (eds) Riparian ecology and management in
multi-land use watersheds. TPS-00-2, American Water
Resources Association, Middleburg, VA, pp 257–261
McNary LA (1934) Route of the Meek Cut-off, 1845. Oregon
Historical Quarterly 35(1)
Meinig DW (1968) The Great Columbia Plain: a historical geography,
1805–1910. University of Washington Press, Seattle
Miller L (1899) Journal of first trip of University of California to John
Day beds of eastern Oregon. Museum of Natural History
Bulletin No. 19. University of Oregon, Eugene
Miller LH (1904) The birds of the John Day Region, Oregon. Condor
6:100–106
Minear PJ (1999) Historical riparian conditions and large in-channel
wood: Deschutes River, Oregon. Federal Energy Regulatory
Commission No. 2030. Portland General Electric, Portland, OR
Mladenoff DJ, Dahir SE, Nordheim EV, Schulte LA, Guntenspergen
GG (2002) Narrowing historical uncertainty: probabilistic clas-
sification of ambiguously identified tree species in historical
forest survey data. Ecosystems 5:539–553
Morgan P, Aplet GH, Haufler JB, Humphries HC, Moore MM,
Wilson WD (1994) Historical range of variability: a useful tool
for evaluating ecosystem change. In: Sampson RN, Adams DL
(eds) Assessing forest ecosystem health in the inland West.
Haworth Press, Bimington, NY, pp 87–111
Nelson JC (1997) Presettlement vegetation patterns along the 5th
principal meridian, Missouri Territory, 1815. American Midland
Naturalist 137(1):79–94
Omernik JM (1995) Ecoregions: a spatial framework for environ-
mental management. In: Davis WS, Simon TP (eds) Biological
assessment and criteria: tools for water resource planning and
decision making. Lewis, Boca Raton, FL pp 49–62
Pacific Northwest Stream Survey (1942) III. Field Notes and Survey
Data, Deschutes River. Oregon State University Archives,
Corvallis
Rich EE, Johnson AM (eds) (1950) Peter Skene Ogden’s Snake
Country Journals, 1824–1826. Hudson’s Bay Record Society,
London
Robbins WG, Wolf DW (1994) Landscape and the intermontane
northwest: an environmental history. General Technical Report
PNW-GTR-319. USDA, Forest Service, Pacific Northwest
Research Station, Portland, OR
Russell IC (1905) Preliminary report on the geology and water
resources of central Oregon. Department of the Interior, U.S.
Geological Survey. Government Printing Office, Washington,
DC
Schoonmaker PK, Foster DR (1991) Some implications of paleo-
ecology for contemporary ecology. Botanical Review 57:
204–245
Schulte LA, Mladenoff DJ (2001) The original U.S. public land
survey records: their use and limitations in reconstructingpresettlement vegetation. Journal of Forestry 99(10):5–10
Sears PB (1925) The natural vegetation of Ohio. I. A map of the
virgin forest. Ohio Journal of Science 25:139–149
Sedell JR, Froggatt JL (1984) Importance of streamside forests to
large rivers: the isolation of the Willamette River, Oregon,
U.S.A., from its floodplain by snagging and streamside forest
removal. Verhandlungen Internationale Vereinigen Limnologie.
22:1828–1834
Sharp B (1985) Avifaunal changes in central Oregon since 1899.
Western Birds 16:63–70
424 Environmental Management (2008) 42:412–425
123
Shaver FA, Rose AP, Steele RF, Adams AE (1905) An illustrated
history of central Oregon embracing Wasco, Sherman, Gilliam,
Wheeler, Crook, Lake, and Klamath counties, state of Oregon.
Western Historical, Spokane, WA
Steedman RJ, Whillans TH, Behm AP, Bray KE, Cullis KI, Holland
MM, Stoddart SJ, White RJ (1996) Use of historical information
for conservation and restoration of Great Lakes aquatic habitat.
Canadian Journal of Fisheries and Aquatic Science 53(Suppl.
1):415–423
Steen-Adams M (2002) Applying environmental history to ecological
restoration: a case study from Zion National Park. Ecological
Restoration 20(4):252–261
Stoddard JL, Peck DV, Paulsen SG, Van Sickle J, Hawkins CP, Herlihy
AT, Hughes RM, Kaufmann PR, Larsen DP, Lomnicky GA, Olsen
AR, Peterson SA, Ringold PL, Whittier TR (2005) An ecological
assessment of western streams and rivers. EPA 620/R-05/005.
U.S. Environmental Protection Agency, Washington, DC. Avail-
able at: http://www.epa.gov/NHEERL/arm/documents/EMAP.W.
Assessment.final.pdf. Accessed October (2007)
Stoddard JL, Larsen P, Hawkins CP, Johnson RK, Norris RH (2006)
Setting expectations for the ecological condition of streams: the
concept of reference condition. Ecological Applications
16(4):1267–1276
Svejcar T (1997) Riparian zones: (2) History and human impacts.
Rangelands 19(4):8–12
Swetnam TW, Allen CD, Betancourt JL (1999) Applied historical
ecology: using the past to manage for the future. Ecological
Applications 9(4):1189–1206
Thoms MC, Ogden RW, Reid MA (1999) Establishing the condition
of lowland floodplain rivers: a palaeo-ecological approach.
Freshwater Biology 41:407–423
Thorson TD, Bryce SA, Lammers DA, Woods AJ, Omernik JM,
Kagan J, Pater DE, Comstock JA (2003) Ecoregions of Oregon
[color poster with map, descriptive text, summary tables, and
photographs; map scale, 1:1,500,000]. U.S. Geological Survey,
Reston, VA
Todd M, Elmore W (1997) Historical changes in Western riparian
ecosystems. Transactions of 62nd North American Wildlife and
Natural Resources Conference, pp 454–468
USEPA (U.S. Environmental Protection Agency) (2000) Mid-Atlantic
highlands streams assessment. EPA/903/R-00/015. USEPA
Region 3. Philadelphia, PA
U.S. War Department (1857) Reports of explorations and surveys to
ascertain the most practicable and economical route for a
railroad from the Mississippi River to the Pacific Ocean, vol VI.
A. O. P. Nicholson, Washington, DC. Avaialble at: http://www.
cprr.org/Museum/Pacific_RR_Surveys/. Accessed June (2006)
Wallin DO, Swanson FJ, Marks B, Cissel JH, Kertis J (1996)
Comparison of managed and pre-settlement landscape dynamics
in forests of the Pacific Northwest, USA. Forest Ecology and
Management 85:291–309
White PS, Walker JL (1997) Approximating nature’s variation:
selecting and using reference information in restoration ecology.
Restoration Ecology 5(4):338–349
Williams G, Miller DE, Miller DH (eds) (1971) Peter Skene Ogden’s
Snake Country journals, 1827–1828 and 1828–1829. Hudson’s
Bay Record Society, London
Wissmar RC, Smith JE, McIntosh BA, Li HW, Reeves GH, Sedell JR
(1994) A history of resource use and disturbance in riverine
basins of eastern Oregon and Washington (early 1800s–1990s).
Northwest Science 68(Special Issue):1–35
Environmental Management (2008) 42:412–425 425
123