Embed Size (px)
Citation preview

NORTH ATLANTIC TREATY ORGANISATION
RESEARCH AND TECHNOLOGY ORGANISATION
AC/323(HFM-022)TP/17 www.rta.nato.int
RTO TECHNICAL REPORT TR-017 HFM-022
Reconsideration of the Effects of Impulse Noise
(Réexamen des effets du bruit impulsionnel)
This Technical Report has been prepared at the request of the
RTO Human Factors and Medicine Panel (HFM).
Published April 2003
Distribution and Availability on Back Cover

This page has been deliberately left blank
Page intentionnellement blanche

NORTH ATLANTIC TREATY ORGANISATION
RESEARCH AND TECHNOLOGY ORGANISATION
AC/323(HFM-022)TP/17 www.rta.nato.int
RTO TECHNICAL REPORT TR-017 HFM-022
Reconsideration of the Effects of Impulse Noise
(Réexamen des effets du bruit impulsionnel)
This Technical Report has been prepared at the request of the
RTO Human Factors and Medicine Panel (HFM).

ii RTO-TR-017
The Research and Technology Organisation (RTO) of NATO
RTO is the single focus in NATO for Defence Research and Technology activities. Its mission is to conduct and promote co-operative research and information exchange. The objective is to support the development and effective use of national defence research and technology and to meet the military needs of the Alliance, to maintain a technological lead, and to provide advice to NATO and national decision makers. The RTO performs its mission with the support of an extensive network of national experts. It also ensures effective co-ordination with other NATO bodies involved in R&T activities.
RTO reports both to the Military Committee of NATO and to the Conference of National Armament Directors. It comprises a Research and Technology Board (RTB) as the highest level of national representation and the Research and Technology Agency (RTA), a dedicated staff with its headquarters in Neuilly, near Paris, France. In order to facilitate contacts with the military users and other NATO activities, a small part of the RTA staff is located in NATO Headquarters in Brussels. The Brussels staff also co-ordinates RTO’s co-operation with nations in Middle and Eastern Europe, to which RTO attaches particular importance especially as working together in the field of research is one of the more promising areas of co-operation.
The total spectrum of R&T activities is covered by the following 7 bodies:
• AVT Applied Vehicle Technology Panel
• HFM Human Factors and Medicine Panel
• IST Information Systems Technology Panel
• NMSG NATO Modelling and Simulation Group
• SAS Studies, Analysis and Simulation Panel
• SCI Systems Concepts and Integration Panel
• SET Sensors and Electronics Technology Panel
These bodies are made up of national representatives as well as generally recognised ‘world class’ scientists. They also provide a communication link to military users and other NATO bodies. RTO’s scientific and technological work is carried out by Technical Teams, created for specific activities and with a specific duration. Such Technical Teams can organise workshops, symposia, field trials, lecture series and training courses. An important function of these Technical Teams is to ensure the continuity of the expert networks.
RTO builds upon earlier co-operation in defence research and technology as set-up under the Advisory Group for Aerospace Research and Development (AGARD) and the Defence Research Group (DRG). AGARD and the DRG share common roots in that they were both established at the initiative of Dr Theodore von Kármán, a leading aerospace scientist, who early on recognised the importance of scientific support for the Allied Armed Forces. RTO is capitalising on these common roots in order to provide the Alliance and the NATO nations with a strong scientific and technological basis that will guarantee a solid base for the future.
The content of this publication has been reproduced directly from material supplied by RTO or the authors.
Published April 2003
Copyright © RTO/NATO 2003 All Rights Reserved
ISBN 92-837-1105-X
Single copies of this publication or of a part of it may be made for individual use only. The approval of the RTA Information Policy Executive is required for more than one copy to be made or an extract included in another publication. Requests to do so should be sent to the address on the front cover.

RTO-TR-017 iii
Reconsideration of the Effects of Impulse Noise (RTO TR-017 / HFM-022)
Executive Summary
The objective of RSG-029 was to assess the risk of hearing loss from exposure to impulse sounds, by identifying occurrences which are hazardous, and to develop measures which will protect hearing under such circumstances. In order to do this, one must be able to identify, from their physical parameters, exposures that are deemed hazardous.
In view of the data sets available, the analysis had to be restricted to unprotected exposures to rifle noise (normal incidence) and to protected exposures to blasts (measured under the hearing protector, near the ear canal). In terms of the impulse properties, this should be interpreted as short shock waves on unprotected ears and slow rise-time pressure waves on protected ears, respectively.
1. At present RSG-029 cannot propose a single measure, or assessment method, that enables adequate prediction of auditory hazard from impulse noise for impulses from light caliber weapons with impulse durations of 0.2 ms to those from large caliber weapons or blasts with durations up to 5 ms.
2. The data available today allows for assessment of auditory hazard only on the basis of a temporary shift in hearing threshold shortly after exposure and its recovery. The present analysis is based on full recovery within 24 hours at 4 and 6 kHz. According to the data available, this criterion can be met at either frequency when the temporary threshold shift, 2 minutes after exposure, (TTS2) does not exceed 25 dB. The limit of 25 dB applies to 95% of the population exposed. Limited statistics do not allow an extension of the protected fraction of the population exposed to more than 95%. This criterion is more stringent than the criterion of 15 dB of TTS, averaged across a 1, 2, and 3 kHz, two minutes after the exposure, not to be exceeded by more than 10% of the population exposed, which was adopted in a previous study (RSG.6).
3. Sound exposure level (SEL – level which, if maintained constant for a period of 1 s, would convey the same sound energy as is actually received from a noise event) can be used as a measure to describe impulses. This avoids the sometimes difficult assessment of impulse duration. Comparison of different frequency weightings, the widespread use and general availability of the A-weighting, and consideration of the equal-energy concept implicit in the use of SEL, suggest that A-weighted energy expressed as dBA,SEL is an appropriate measure. A further advantage is that dBA,SEL can be directly obtained from standard measuring equipment, available in military facilities and companies.
4. For both impulse noise from rifles, and blast from explosions and large-caliber weapons, there is a critical exposure level that should not be exceeded.
• For impulses from rifles (unprotected ear, normal incidence) this critical level is 116 dBA,SEL per impulse, measured in free field at the location of the ear. This critical level applies for a number of impulses, N, up to 50 at a rate of one impulse per 5 to 10 seconds.
• For impulses from blasts (under the hearing protector, near the ear canal), this critical level is 135 dBA,SEL per impulse. The critical level for blasts applies when N ≤ 100 at a rate of about one per minute.
5. The critical level for rifles of 116 dBA,SEL corresponds to about 153 dB peak level (in the free field). This level exceeds the instantaneous sound pressure of 140 dB, up to which ISO 1999 applies, by 13 dB. Due to differences in impulse duration, no unequivocal translation to peak level can be made for the critical level for blasts of 135 dBA,SEL.

iv RTO-TR-017
6. The equal energy principle can be applied to impulse sounds from rifles and blasts if the critical number of impulses (50 and 100, respectively) is exceeded.
• For rifles, if N>50, the exposure limit becomes 124 dBA,SEL or Leq = 80 dBA.
• For blasts, if N>100, the exposure limit becomes 143 dBA,SEL or Leq = 98.4 dBA.
The above limits apply to N impulses together.
7. When one wishes to use the equal energy principle for smaller numbers of impulses one should stay with the critical levels (per impulse) given above for N ≤ 5. For N>5 the present data suggest that application of the exposure limit in terms of equal energy given above implies an overprotection of at most 10 dB, both for rifles and for blasts.
8. The equal energy principle (formally applicable to PTS data, i.e., permanent threshold shifts) implies that the exposure level has to be decreased by 10 dB for every tenfold increase of the number of impulses. The present analysis of TTS data shows that the number should be smaller than 10 dB. Numbers between 2 dB and 7 dB are found; 5 dB was proposed in the CHABA document based upon TTS data (1968). However, the present data suggest the concept of a critical level introduced above, rather than the application of a smaller level-number trade-off function.
9. The analysis shows that a frequency weighting function putting more emphasis on the contribution from high-frequency energy to the exposure measure will improve the accuracy of auditory hazard prediction. The 19-dB difference between exposure limits for rifles and blasts when applying A-weighting decreases to about 13 dB when a weighting function is applied that follows the threshold of human hearing (T-weighting in this report). It decreases to about 10 dB when the weighting function is based on bands of noise producing the same TTS (EqTTS-weighting in this report). Modern sound level meters can be equipped with alternative spectral weighting functions. However, in principle there is no weighting function that can account for the finding that TTS in animals decreases with increasing duration of well controlled impulse wave forms. The 10 dB difference between the exposure limits for rifle noise and blasts, remaining with the most suitable EqTTS-weighting function, must be related to this finding in animals.
10. A single measure of impulse sound exposure enabling adequate prediction of auditory hazard from impulses with durations from 0.2 to 5 ms, or longer in reverberant conditions, should ideally be based on nonlinear elements in exposure assessment that account for the protective action of high-level low-frequency energy in the impulse. The only method based on this principle, which is presently available, is the Auditory Hazard Assessment Algorithm for the Human ear (AHAAH). However, RSG-029 disagrees on the general validity of this method (see Chap. I, Sec. 7 and Chap. II for different views).
11. Hearing protection should be evaluated for impulse sounds from which the ear has to be protected, at the relevant levels, using a representative angle of incidence. The standard specifications of hearing protector attenuation apply to low-level random-incidence noise. Hearing protectors may give lower effective attenuation for high-level impulse noise.
12. Hearing conservation programs must aim at preserving good hearing of today’s soldiers. Apart from the crucial role in readiness and survivability, effective conservation programs result in substantial reduction of training costs and costs for compensation of hearing loss.
13. Recent animal studies on the treatment of acute noise trauma have shown (partial) recovery of threshold shift. Depending on the (combinations of) medication, recovery can be improved. Future experiments should focus on the development and validation of local application of drugs directly into the cochleas of human subjects.

RTO-TR-017 v
Réexamen des effets du bruit impulsionnel (RTO TR-017 / HFM-022)
Synthèse Le groupe RSG-029 a eu pour objectif d'évaluer le risque de la perte d'audition due à l'exposition au bruit impulsionnel, par l'identification de faits dangereux, et d'élaborer des mesures de protection de l'ouie dans de telles circonstances. Pour ce faire, il est nécessaire de pouvoir identifier les cas d'exposition présentant un danger, à partir de leurs paramètres physiques.
Etant donné les ensembles de données disponibles, il a fallu restreindre l'analyse à des expositions non protégées à du bruit de fusil (incidence normale) ainsi qu'à des expositions protégées à des explosions(mesurées en dessous des protecteurs d'oreilles, près du canal auditoire). Exprimé en termes de caractéristiques d'impulsions, ces expositions représentent des ondes de choc courtes sur des oreilles non protégées et des ondes de pression à temps de montée lents sur des oreilles protégées respectivement.
1. Pour le moment, RSG-029 ne peut proposer ni de mesure, ni de méthode d'évaluation qui permet la prévision adéquate des risques auditoires présentés par le bruit impulsionnel allant d'armes légères avec des durées d'impulsion de 0,2ms, à des armes de plus gros calibre, voire des explosions avec des durées jusqu'à 5ms.
2. Les données disponibles aujourd'hui ne permettent l'évaluation des risques auditoires qu'en tenant compte d'un décalage provisoire du seuil d'audibilité juste après l'exposition, et de son rétablissement. La présente analyse est basée sur l'hypothèse d'un rétablissement total dans les 24 heures suivant l'incident à 4hz et à 6hz. Selon les données disponibles, ce critère peut être respecté pour les deux fréquences quand le décalage provisoire du seuil, 2 minutes après l'exposition TTS², ne dépasse pas 25 dB. La limite de 25dB s'applique à 95% de la population exposée. Les statistiques limitées ne permettent pas l'élargissement de la fraction de la population exposée à plus de 95%. Ce critère est plus strict que celui de 15 dB de TTS, moyenné sur 1,2 et 3 kHz, deux minutes après l'exposition, à ne pas être dépassé par plus de 10% de la population exposée, qui a été adopté par une étude précédente (RSG.6).
3. Le niveau d'exposition au bruit (SEL - niveau qui, s'il était maintenu constant pendant une période de 1 s, transmettrait la même énergie acoustique que celle réellement reçue lors d'un incident acoustique) peut être utilisé comme mesure pour décrire des impulsions. Cette technique dispense de procéder à l'évaluation, parfois difficile, de la durée de l'impulsion. La comparaison de différentes pondérations de fréquence, l'utilisation généralisée et la grande disponibilité de la pondération A, et la considération du concept d'énergie égale implicite à la mise en œuvre du SEL, laissent supposer que l'énergie pondérée A exprimée sous la forme de dBA,SEL est une mesure appropriée. Le fait que le dBA,SEL peut être obtenu à l'aide de matériel de mesure standard, détenu par les installations militaires et les société privées, représente un avantage supplémentaire.
4. Il existe un niveau d'exposition critique à ne pas dépasser en ce qui concerne le bruit impulsionnel des fusils, les explosions et le bruit des armes de gros calibre.
• Pour les impulsions des fusils (oreille non protégée, incidence normale), ce niveau critique est de116 dBA,SEL par impulsion, mesuré en champ libre au niveau de l'oreille. Ce niveau critique s'applique pour un nombre d'impulsions, N, jusqu'à 50 au rythme d'une impulsion par 5 à 10 secondes.
• Pour les impulsions des explosions (en dessous du protecteur d'oreille, près du canal), ce niveau critique est de 135 dBA,SEL par impulsion. Le niveau critique pour les explosions s'applique lorsque N = 100 au rythme d'une par minute environ.
5. Le niveau critique pour les fusils, de 116 dBA,SEL correspond à un niveau maximal de 153 dB environ (en champ libre). Ce niveau est supérieur de 13 dB, à la pression acoustique instantanée de 140 dB, spécifié par ISO 1999. En raison des différences de durée d'impulsions, aucune transposition

vi RTO-TR-017
sans équivoque au niveau maximal ne peut être faite pour le niveau critique pour les explosions de 135 dBA,SEL.
6. Le principe d'énergie égale peut être appliqué aux bruits impulsionnels de fusils et d'explosions si le nombre critique d'impulsions (50 et 100 respectivement), est dépassé.
• Pour les fusils, si N > 50, la limite d'exposition devient 124 dBA,SEL ou bie, Leq = 80 dBA.
• Pour les explosions, si N > 100, la limite d'exposition devient 143 dBA,SEL ou bien, Leq = 98,4 dBA.
Ces limites s'appliquent à N impulsions ensemble.
7. S'il est souhaité appliquer le principe d'énergie égale pour des nombres d'impulsions inférieurs, il est conseillé de respecter les niveaux critiques (par impulsion) donnés ici pour N = 5. Pour N = 5 les données actuelles laissent supposer que l'application de la limite d'exposition en termes d'énergie égale donnée ci-dessus implique une surprotection de 10dB maximum, pour fusils et explosions.
8. Le principe d'énergie égale (officiellement applicable aux données de décalage permanent de seuil PTS) implique que le niveau d'exposition a été diminué de 10 dB pour chaque augmentation par 10 du nombre d'impulsions. La présente analyse des données TTS montre que le nombre doit être inférieur à 10 dB. Des nombres entre 2dB et 7 dB sont mentionnés; 5dB a été proposé dans le document CHABA basé sur des données TTS (1968). Cependant, les données actuelles semblent indiquer le concept de niveau critique présenté ci-dessus, plutôt que l'application d'une fonction réduite de compromis niveau/nombre.
9. L'analyse montre qu'une fonction de pondération de fréquence mettant plus d'accent sur la contribution de l'énergie haute fréquence à la mesure de l'exposition permettrait d'améliorer la précision de la prévision des risques auditoires. La différence de 19 dB entre les limites d'exposition pour fusils et explosions qui se produit en appliquant la pondération A tombe à 13 dB lorsqu'une fonction de pondération qui suit le seuil de l'audition humaine est appliquée (pondération - T dans ce rapport). Il décroît à 10 dB lorsque la fonction de pondération est basée sur des bandes de bruit produisant le même TTS (pondération EqTTS dans ce rapport). Les sonomètres modernes peuvent être dotés de fonctions de pondération spectrales en option. Cependant, en principe, il n'existe aucune fonction de pondération permettant d'expliquer le fait que chez les animaux, le TTS décroît au fur et à mesure de l'augmentation de la durée de formes d'ondes impulsionnelles bien contrôlées. La différence de 10 dB entre les limites d'exposition pour le bruit des fusils et des explosions, dans l'hypothèse de la fonction de pondération EsTTS la plus favorable, doit être liée à ce phénomène chez les animaux.
10. Idéalement, pour permettre la prévision adéquate des risques auditoires présentés par des impulsions de durée entre 0,2 et 0,5 s, ou de plus longue durée dans des conditions réverbérantes, une mesure unique d'exposition au bruit impulsionnel doit être basée sur des éléments non linéaires d'évaluation d'exposition qui tiennent compte de l'action protectrice de l'énergie basse fréquence de haut niveau dans l'impulsion. La seule méthode basée sur ce principe, actuellement disponible, est l'algorithme d'évaluation des risques auditoires pour l'oreille humaine (AHAAH). Cependant, RSG-029 est en désaccord avec la validité générale de cette méthode (voir chapitre I Sec.7 et Chap. II pour les différents avis).
11. Les dispositifs de protection de l'ouïe doivent être évalués pour le bruit impulsionnel contre lequel il s'agit de protéger l'oreille, à des niveaux appropriés, à des incidence représentatives. Les normes relatives à l'atténuation réalisée par les protecteurs d'oreilles s'appliquent au bruit de bas niveau d'incidence aléatoire. Il se pourrait que les protecteurs d'oreilles fournissent une atténuation effective moindre pour le bruit impulsionnel fort.
12. Les programmes de conservation de l'ouïe doivent viser la préservation de la qualité de l'ouïe du combattant moderne. Mise à part leur rôle vital dans la garantie de la disponibilité opérationnelle et de la survivabilité, les programmes de conservation de l'ouïe permettent de réaliser des économies de coûts considérables en ce qui concerne l'entraînement et la compensation de la perte de l'ouïe.
13. De récentes études d'animaux sur le traitement des traumatismes auditoires aigus ont montré la récupération (partielle) du décalage de seuil. En fonction des médicaments (combinaisons) la récupération peut-être améliorée. Les futures expériences doivent privilégier le développement et la validation de l'application localisée de médicaments directement dans les cochlées des patients.

RTO-TR-017 vii
Table of Contents
Page
Executive Summary iii
Synthèse v
Preface ix
Human Factors and Medicine Panel x
Chapter 1 - Risk of Hearing Loss from Exposure to Impulse Sounds 1-1 by G.F. Smoorenburg 1.1 Introduction 1-1
1.2 Previous Approach 1-1 1.2.1 Peak Sound Pressure Level 1-2 1.2.2 Impulse Duration 1-2 1.2.3 Total Duration of a Number of Impulses 1-4 1.2.4 Temporary Threshold Shift shortly after Exposure as the Measure of Effect 1-4 1.2.5 Permanent Threshold Shift as a Measure of Effect 1-4 1.2.6 Discussion of the 1982 Damage Risk Criterion 1-5
1.3 Results for Long-Duration Impulses 1-6 1.3.1 Results from Price 1-6 1.3.2 Results from Dancer 1-6 1.3.3 TTS Results for Human Exposures to Large Calibre Weapons 1-7
1.4 Alternative Approaches to Risk Assessment 1-8 1.4.1 The Spectral Factor 1-8 1.4.2 The Trade-Off between Exposure Level and Number of Impulses 1-12 1.4.3 The Hearing Loss Criterion 1-12
1.5 New Analyses for Short Impulses 1-13 1.5.1 Trade-Off between Allowable Exposure Level and Number of Impulses for 1-13 Short Sparks 1.5.2 The Allowable Exposure Level for Short Sparks 1-13 1.5.3 Trade-Off between Allowable Exposure Level and Number of Impulses for 1-14 Rifle Shots 1.5.4 The Allowable Exposure Level for Rifle Shots 1-16
1.6 Evaluation of the Blast Overpressure Project 1-18 1.6.1 Experimental Design 1-18 1.6.2 The Dose-Effect Relation for Blasts 1-22
1.7 Impulse Sound Assessment with Respect to Hearing Hazard 1-27 1.7.1 Introduction 1-27 1.7.2 The Non-Linear Method Proposed by Price and Kalb 1-28 1.7.3 Response of the Price and Kalb Model to the BOP Data 1-29 1.7.4 Final Evaluation 1-30

viii RTO-TR-017
Chapter 2 - Auditory Hazard Assessment Algorithm for the Human Ear (AHAAH) 2-1 as of 2001 by G.R. Price 2.1 Introduction 2-1
2.2 Premises in the Development of the Model 2-1
2.3 Research Strategy 2-1
2.4 A Model Required! 2-2
2.5 Creation of the Human Model 2-2
2.6 Validation of the Human Model 2-3 2.6.1 Human Data – Protected Hearing 2-3 2.6.2 Human Data – Unprotected Hearing 2-3
2.7 Acceptance and Potential Use of the Model 2-4
Chapter 3 - Performance of Hearing Protectors in Impulse Noise 3-1 3.1 Analysis of the BOP Data 3-1
3.2 Recommendation for Assessing Hearing Protection 3-4
Chapter 4 - Cost-Effectiveness of Hearing Conservation Programs 4-1 by A.L. Dancer 4.1 Readiness Benefits of Hearing Conservation Programs 4-1
4.2 Monetary Benefits of Hearing Conservation Programs 4-1
4.3 Conclusions 4-2
Chapter 5 - New Perspectives in Treatment of Acute Noise Trauma 5-1 by A.L. Dancer 5.1 Introduction 5-1
5.2 Animal Study 5-1
5.3 Results 5-2
Appendix I – Bibliography AI-1
Appendix II - Programs and Summaries of RSG Meetings AII-1 A. Programme of the 1997 RSG 29 Meeting AII-1
B. Pertinent Published Materials AII-35
C. Programme of the 1998 RSG 29 Meeting AII-37

RTO-TR-017 ix
Preface
This report contains the main outcome of the work constituted by NATO Research Study Group RSG-029 “Reconsideration of the effects of impulse noise”. RSG-029 followed RSG.6 on the effects of impulse noise. The first RSG started its activities in 1980. Its final report appeared in 1987; NATO document AC/243(PANEL 8/RSG.6) D/9. The activities of RSG.6 resulted in specific recommendations for additional research. This RSG was disbanded awaiting new data.
In 1994 the NATO Defence Research Section concluded that the evaluation of the effects of impulse noise on man should be reconsidered in view of the new data that had become available. Consequently, RSG-029 was established. RSG-029 has accommodated very effective cooperation.
Two RSG-meetings were organized in 1997 and 1998 (UK and The Netherlands), and a lecture series on damage risk from impulse noise (LS 219) was held in two locations in 2000 (USA and Germany) and in two locations in 2002 (Russia and Kyrgystan). RSG-029 was formally disbanded by the end of 1998.
In producing this final report, it turned out that RSG-029 could not reach agreement on all issues. Hence, the present report cannot be considered as a consensus report. Different chapters were contributed by different members, and the text sometimes tends to reflect the view of the author, and not necessarily that of the entire RSG. Given this situation, the name of the author is explicitly mentioned in the respective chapters.
One particularly difficult topic concerns a model to predict the risk of hearing damage from impulse sound based on physiological data (AHAAH model by Price and Kalb). The model provides a good analysis of the ear’s behavior when exposed to large impulses, but seems to give unsatisfactory results in several exposure conditions. Two different views with respect to the general applicability of the model are given in this report (Chapters 1 and 2).
This report focuses on the risk of auditory damage from impulse noise and gives recommendations for good and safe criteria for the exposure to impulse noise generated by weapons. It contains a chapter on hearing protection, primarily based on data from large caliber impulses. Furthermore, some attention is given to hearing conservation programs and to the treatment of acute noise trauma.
More elaborate contributions on a number of subjects (hearing protection performance, medical treatment, cost effectiveness, non-auditory damage risk) can be found in the proceedings of RTO Lecture Series 219 “Damage risk from Impulse Noise” (RTO-ENP-011, June 2000).
R. Drullman Editor

x RTO-TR-017
Human Factors and Medicine Panel
CHAIRMAN VICE-CHAIRMAN
Col. Willem TIELEMANS, MD Dr Robert ANGUSRNLAF/SGO Director GeneralP.O. Box 20703 Defence R&D Canada - SuffieldBinckhorstlaan, 135 PO Box 4000 – Station Main2500 ES The Hague Medicine Hat, Alberta T1A 8K6THE NETHERLANDS CANADA
Composition of HFM-022/RSG-029
Chairman
Prof.Dr. G.F. Smoorenburg The NetherlandsTNO Human FactorsP.O. Box 23, 3769 ZG [email protected]
Members
Dipl.-Ing. H. Brinkmann GermanyWehrtechnische Dienststelle für Waffen und MunitionFachgebiet AkustikP.O. Box 1764, 49707 [email protected]
Mr. R.B. Crabtree CanadaDefence and Civil Institute of Environmental MedicineHuman Engineering SectorP.O. Box 2000, North York, Ontario M3M [email protected]
Dr. A. Dancer FranceInstitut Franco-Allemand de Recherches de Saint-LouisP.O. Box 34, 68301 Saint-Louis [email protected]
Mr. M.R. Forrest United KingdomCentre for Human SciencesQinetiQ Ltd.Ively Road, Farnborough, Hampshire GU14 [email protected]
RTO-TR-017 xi
Col. M.A. Mayorga USAWalter Reed Army Institute of ResearchDept. of Respiratory ResearchWahington DC 20307-5100
Cap. F. Mérat FranceGroupement de Défense Nucléaire Biologique et ChimiqueSection Technique de l’Armée de TerreFacteurs Humains14 Rue Saint-Dominique, 00450 Armees
Dr. P.K. Plinkert GermanyUniversitätskliniken des SaarlandesHals-Nasen-OhrenklinikKirrberger Str., 66421 Homburg/[email protected]
Dr. G.R. Price USAU.S. Army Research LaboratoryHuman Research and Engineering DirectorateAberdeen Proving Ground, Maryland [email protected]
Col. G. Stevins BelgiumJSM/R&TDirector of Research and TechnologyRue d 'Evere 1, B-1140 [email protected]
Dr. O.J. Woxen NorwayHQ Defence Command NorwayJoint Medical ServiceDepartment of Environmental MedicineFSAN, Oslo Mil/Huseby, 0016 Oslo 1

xii RTO-TR-017
This page has been deliberately left blank
Page intentionnellement blanche

Chapter 1 - RISK OF HEARING LOSS FROM EXPOSURE TO IMPULSE SOUNDS
G.F. Smoorenburg
1.1 INTRODUCTION
In 1980, during a symposium on “New Perspectives on Noise-Induced Hearing Loss”, a paper was presented on “Damage Risk Criteria for Impulse Noise” in which an attempt was made to integrate all data available on effects of impulse noise on the human ear (Smoorenburg, 1982). The data covered very short impulse sounds (0.03 ms) from sparks to long impulses (70 ms) in reverberating environments. The criterion was based primarily on temporary threshold shifts (TTS) measured shortly after the exposure. The result was tested against permanent threshold shifts (PTS) found in shooting instructors. At that time it was clear that the data did not allow for adequate risk assessment although defence and police institutions were very much in need of reliable exposure criteria. Unacceptable hearing loss had occurred in shooting instructors (Plomp, 1967). Simply reducing the exposure levels considerably to stay on the safe side conflicted with operational demands. These considerations suggested to the director of the TNO Institute for Perception at that time to propose the formation of a NATO Research Study Group (RSG) on the Effects of Impulse Noise.
The RSG was established in 1979 as RSG.6 “On the Effects of Impulse Noise” within the NATO Defence Research Group, Panel 8 “On the Defence Applications of Human and Bio-Medical Sciences”. It first met in 1980. During its activities over the period 1980-1986 it became evident that the criteria in use at the time were particularly inadequate for large calibre weapons. Animal studies by Price (1983) and Dancer (1985) had shown that the effects of impulses from large calibre weapons with durations of several milliseconds (as compared to those from small calibre weapons with durations of fractions of a millisecond) were less damaging than expected. Surprisingly, the effect of long-duration impulses could be smaller than those from small calibre weapons at the same peak level although the energy contained in the impulse increased with duration. With respect to human exposures the evaluation of risk levels for large calibre weapons was difficult to evaluate because personal hearing protection was almost always involved in those exposures while the attenuation of these protectors during the exposition was not well known. Yet, a survey of TTS after protected human exposures to large calibre weapons suggested strongly that the criteria at that time were most probably overprotective (Smoorenburg, 1992). The members of RSG.6 decided that new data had to be collected. The USA delegation presented plans for an extensive investigation; the Blast Overpressure Project (BOP). The protocol for this project was designed with the support from RSG.6. Awaiting the new data RSG.6 was disbanded in 1986 after finishing its final report (RSG.6, 1987).
After collection of new data, in particular in the USA, France and Germany, a new RSG, RSG.29 on “Reconsideration of the Effects of Impulse Noise”, was established in 1994. RSG.29 met in the period 1995-1998. It accommodated very effective co-operation. This report is an attempt to provide insight in the present “state of the art” of assessing risk of hearing loss from impulse sounds.
1.2 PREVIOUS APPROACH
The important aspects of former evaluations with respect to the exposure measure and hearing loss criterion used were:
1. peak sound pressure level
2. impulse duration
RTO-TR-017 1 - 1

RISK OF HEARING LOSS FROM EXPOSURE TO IMPULSE SOUNDS
3. total exposure duration in terms of number of impulses times the duration of a single impulse
4. temporary threshold shift shortly after exposure
5. permanent threshold shifts
These aspects will be discussed below.
1.2.1 Peak Sound Pressure Level The choice of peak sound pressure level (and impulse duration) as the measure of impulse sound exposure did not originate with a systematic evaluation of a number of possible measures of impulse sound exposure against their effect on the ear, but simply with the basic need to integrate all data available. Since the raw sound pressure level recordings were usually not available, the measures applied had to be used in the respective studies.
Obviously, using the peak level has the advantage that it is a clear descriptor of the impulse and, intuitively, related to risk of hearing damage. However, a disadvantage of the peak level is found in a critical dependence of that level on the bandwidth of the measurement system. The impulses may possess very short rise times with spectral energy well above the audible range. The peak level measured will depend on whether the bandwidth includes this supra-audible frequency range (when striving for a perfect measurement system) or not (when using a bandwidth matched to the audible range). Often, the bandwidth is not specified in publications. Moreover, there are no data that specifically address the question of whether or not supra-audible spectral energy contributes to hearing loss. In addition, when data were collected using, for example, A-weighting (choosing to work with a bandwidth matched to the audible range) the peak level may have depended on the specific implementation of the A-weighting. Before ANSI S1.1-1986, Version 1993 and IEC 61260 (1995-08) came out, the phase characteristic of A-weighting, and thus the temporal response of the filter, was not specified. This illustrates the disadvantages of using peak level.
1.2.2 Impulse Duration The first parametric descriptions of sound impulses were based upon peak level and some measure of duration. The germinal CHABA damage-risk criterion for impulse noise (1968) introduced the A-duration and B-duration. Pfander (1975) introduced the C-duration. As for the peak level Smoorenburg (1982) used a measure of duration based upon the need to integrate as much data as possible. Thus, it has not been introduced as a scientifically more sound measure but as a common denominator of the measures already in use. The measure was coined the D-duration. Fig. 1 shows the four measures. They will be discussed below.
1 - 2 RTO-TR-017

RISK OF HEARING LOSS FROM EXPOSURE TO IMPULSE SOUNDS
Figure 1: Four definitions of impulse duration.
(a) A-duration This duration is based upon the ideal Friedlander wave occurring with explosions in free field. The A-duration corresponds to the time interval between impulse onset and the first (and only) crossing with the base line. In practice the wave form will often be (much) more complicated because of weapon resonance, reflections and reverberations. Therefore, A-duration can often not be determined in accordance with its definition.
(b) B-duration This measure has been introduced in the CHABA (1968) document for those conditions where the A-duration cannot be used. Basically, the measure equals the time interval in which the envelope of the impulse exceeds a level of 20 dB below the peak level. Often the envelope is difficult to determine because the fine structure of the wave form is less dense than indicated in the example of Fig. 1. MIL-STD-1474D (1997) presents a flow diagram enabling an unequivocal assessment of B-duration. The MIL-STD implementation is rather complicated, distinguishing between the primary portion of the event and the presence of significant subsequent fluctuations in sound pressure. Although the MIL-STD allows for an unequivocal assessment of B-duration it should be clear that this more precise definition has not been based on evaluation of dose-effect relations. It is limited to the demand that a standard should yield unequivocal results.
(c) C-duration This measure was introduced in Germany (Pfander, 1975) also aiming at an unambiguous measure of duration. With C-duration, all time intervals in which the segments of the wave form are above a level of 10 dB below the peak level, are added. Both, positive and negative deflections are included. Again, this measure has not been evaluated against other measures with respect to finding the best predictor of hearing loss.
RTO-TR-017 1 - 3

RISK OF HEARING LOSS FROM EXPOSURE TO IMPULSE SOUNDS
(d) D-duration As stated before, this measure was introduced (Smoorenburg, 1982) as a kind of common denominator to the other measures in use, in order to be able to integrate all data available. It is essentially similar to the B-duration, but with the reference level at –10 dB instead of –20 dB (thus noted as τ−10 ). The –10 dB level was not simply copied from C-duration. The choice was based on results from McRobert and Ward (1973) showing that reflections at –20 dB below the peak level did not contribute to TTS. A more precise definition for those cases where the envelope is not immediately apparent from the wave form has not been introduced for D-duration, like the MIL-STD did for the B-duration.
For all measures of impulse duration it has been assumed that the combination of peak level and duration provides an adequate description of the impulse in terms of predicting its hazard to hearing. In assessing the risk of hearing loss for continuous and intermittent noise it has been shown that the total energy contained in the noise provides an acceptable predictor of hearing hazard (ISO 1999). As long as, for A-duration, the wave form complies with the Friedlander wave and, for the other definitions of duration, the wave form complies with an exponentially decaying reverberating impulse, there is a close relation between the energy contained in the impulse and the combination of peak level and duration. However, in practice significant differences may occur. In addition, it should be clear that in this comparison the energy measure does not include any kind of frequency-dependent weighting of the spectral energy distribution of the impulse.
1.2.3 Total Duration of a Number of Impulses Accepting the concept that total sound energy is a proper predictor of hearing loss it is evident that in case of exposure to a number of impulses one should simply add the energy of all impulses. When all impulses have the same peak level duration this implies that the number factor can be transformed into a level factor according to 10*log(N), where N is the number of impulses and log the logarithm with base 10. This approach was applied in the studies of Pfander (1975) and Smoorenburg (1982). However, the CHABA (1968) document included another trade-off. It was based on N=100 and allowed for an increase of the criterion level by 5 rather than 10 dB for each 10-fold decrease in number of impulses.
1.2.4 Temporary Threshold Shift shortly after Exposure as the Measure of Effect Obviously, the measure of effect should be permanent hearing loss induced by the impulse sounds, in terms of an increase of the hearing threshold or other measures of hearing acuity. However, such data are hardly available and, if available, previous exposure to the impulse sounds is very difficult to assess with an adequate margin of accuracy. Therefore, nearly all studies referred to in this report are based on TTS. In 1982 Smoorenburg showed that the result of the evaluation of TTS data was in line with PTS found in shooting instructors, be it within the limited accuracy given.
The criterion used in that evaluation was 15 dB of TTS, averaged across the shifts at 1, 2, and 3 kHz, two minutes after the exposure (TTS2), not to be exceeded by more than 10% of the population exposed. Again, this measure was not based on a scientific evaluation of the dose-effect relation, preferably in terms of PTS, but on finding a common denominator for the TTS data available in the literature. With respect to the choice of frequencies Smoorenburg (1982) showed for PTS that the criterion of 15 dB loss across 1, 2, and 3 kHz would imply PTS of 45 dB at 4 kHz and even 60 dB at 6 kHz. From an ethical point of view one may well question if such a loss could be allowed. Pfander used the concept of full recovery from TTS at any frequency; a much better proposition.
1.2.5 Permanent Threshold Shift as a Measure of Effect As stated before, this measure has to be preferred above the TTS measure but it cannot be used by lack of data. In addition, one may question whether or not a permanent threshold shift reveals all damage possibly
1 - 4 RTO-TR-017

RISK OF HEARING LOSS FROM EXPOSURE TO IMPULSE SOUNDS
afflicted to the ear. The physiological literature suggests that animals may have moderate hair cell loss that does not show up in electro-physiological or behavioural threshold shifts. Moreover, the audiological literature suggests that one may experience hearing problems, for example speech perception in noise, without corresponding increase in hearing threshold. Finally, one should certainly take into account the risk of acquiring tinnitus (ringing of the ear) without accompanying threshold shifts. Although all these factors have been recognized, they cannot yet be incorporated into an evaluation of the risk of hearing loss from impulse sounds by lack of data. At present, the best approach is an evaluation based upon full recovery of TTS.
1.2.6 Discussion of the 1982 Damage Risk Criterion In order to get some more insight into the damage risk criteria proposed the 1982 result will be summarized below.
Figure 2: Left-panel: Combination of peak levels and total durations (number of impulses N times the duration τ−10 of a single impulse) which satisfy the criterion of 15 dB temporary
threshold shift two minutes after exposure, averaged across the shifts at 1, 2, and 3 kHz (thick solid line for impulses, broken line for steady and intermittent noises). The result suggested the application of a simple energy criterion of Leq8 = 85 dB (thin line). Right panel: Criteria proposed in the CHABA (1968) document, by Pfander (1975) in comparison with the Leq8 = 85 dB criterion
proposed by Smoorenburg. (Figures from Smoorenburg, 1982)
Fig. 2, left-hand panel, shows the result of the evaluation of the TTS data. The best linear fit to the data did not follow the concept of energy being an adequate predictor of TTS. The slope of the line is smaller than the slope of the equal-energy line added to the figure. This is not surprising, as the equal-energy principle does actually not apply to TTS, but to PTS. The equal energy line, Leq8 = 85 dB, corresponds to the energy contained in continuous noise at 85 dB for 8 hours. The slope of the linear fit corresponds to 7.8 dB decrease in peak level per tenfold increase of total impulse duration (in order to expect the same TTS). This is close to the set of CHABA lines presented in the right-hand panel, lines with a slope of –6.7 dB per tenfold increase. Since Smoorenburg’s study included most of the data incorporated in the CHABA study this could be expected. The CHABA 5 dB trade-off against a tenfold decrease in number of impulses has also been incorporated in the right-hand panel of Fig. 2. The panel shows that the three lines are close to one another because the duration trade-off is –6.7 dB per factor of ten in duration while the number trade-off equals – 5 dB per factor of ten.
For intermittent noise, and noise that is present for less than 8 hours per day, the ISO 1999 equal-energy rule dictates that the exposure level can be raised by 10 dB for every tenfold decrease in total duration.
RTO-TR-017 1 - 5

RISK OF HEARING LOSS FROM EXPOSURE TO IMPULSE SOUNDS
This relationship is demonstrated by the Leq8 = 85 dB line in the left-hand panel of Fig. 2. The ISO 1999 rule is based on PTS data. However, the TTS data have suggested another trade-off: +5 dB per factor of two reduction in duration, or about 16.6 dB per factor of ten. In view of these results some offices in the USA use this trade-off rather than the equal-energy relation. The larger trade-off value is reflected in the left-hand panel of Fig. 2 where the broken line indicates what short-duration exposures to steady noise satisfy the TTS criterion of 15 dB. All together, quite a continuous solution was found across the full range of total duration, from the shortest impulses to 8 hours of continuous noise. One should note that, in this continuous solution, the level-duration trade-off for impulses is exactly the opposite of the trade-off for short-duration steady noise. For impulses it is less steep than equal energy suggests, for short-duration steady noise it is steeper. The 1982 study summarized the results by proposing an equal-energy criterion at Leq8 = 85 dB. This proposal originated with the simplicity of using the energy measure across the full range of total duration for all types of noises. However, it included possible overprotection, particularly in the mid-range of total duration, when one accepts the TTS criterion.
Finally, the right-hand panel shows that Pfander (1975) arrived at a result very close to the Smoorenburg result although he used a completely independent data set and a criterion of full recovery from TTS. This result suggested that it would be safe to use either the Pfander or Smoorenburg criterion.
1.3 RESULTS FOR LONG-DURATION IMPULSES
1.3.1 Results from Price In 1983 Price showed that rifle noise with A-durations of 0.3 to 0.4 ms at a peak level of 139 dB was equally damaging as howitzer noise at 150 dB and with A-durations of 2 to 3 ms. Thus, although the duration, and hence the energy, of the howitzer impulse was greater than that of the rifle impulse higher peak levels could be allowed. These results were collected in cats two months after the exposure. The thresholds were determined electrophysiologically. This result was completely counter-intuitive. However, the results did not allow for a firm conclusion as to the smaller risk of hearing damage with long duration impulses because the variability in the data was large. The correlation in the dose-effect relations for the rifle and howitzer were limited to coefficients of 0.3 and 0.2, respectively.
1.3.2 Results from Dancer In 1985 Dancer et al. showed, in a well controlled study in guinea pigs, that increasing the duration of Friedlander type of impulses, keeping the peak level constant at about 1.5 kPa (about 157.5 dB), produced systematically decreasing hearing loss, measured electrophysiologically one week after the exposure. The results for 25 impulses presented at one-minute intervals to anaesthetized animals are presented in Fig. 3. The figure shows how hearing loss decreases in the order M, B, O, N, which corresponded to A-durations of 0.05, 0.25, 0.39, and 1.0 ms, respectively. In addition, the data show, that the loss at higher frequencies decreases with increasing duration. This is a very interesting observation because the energy at the higher frequencies does not decrease with impulse duration when the peak level is kept constant (cf. Fig. 8). The data suggested that the increase of low-frequency energy with increasing duration (Fig. 8) suppressed the hearing loss to be expected from the high-frequency energy in the impulse. This is an essential aspect of a physiological model of auditory hazard proposed by Price and to be discussed later.
1 - 6 RTO-TR-017

RISK OF HEARING LOSS FROM EXPOSURE TO IMPULSE SOUNDS
F
1.3.3 In ordeintegratresult isprotectoweaponattenuatpredomalso increlationand A-wwith A-
Taking prevailiwith exdamageexposurthe uppspectralloss for
RTO-TR-
igure 3: Threshold shift in guinea pigs one week after exposure to Friedlander type of impulse sounds at a constant peak level of about 157.5 dB as a function of A-duration.
A-durations were: M: 0.025ms; B: 0.25 ms; O: 0.39 ms, and N: 1.02 ms. Abscissa: tone burst frequency. Data from Dancer et al. (1985).
TTS Results for Human Exposures to Large Calibre Weapons r to gain some insight into the effects of long-duration impulses on the human ear we tried to e all data available on large calibre weapons available within RSG.6 (Smoorenburg, 1992). The presented in Fig. 4. It should be noted that now, in all cases, the people exposed used hearing rs. The effective attenuation that could be expected for the combination of hearing protector and was estimated from the spectral energy distribution of the impulses and the frequency-dependent ion of the specific hearing protector used. Since preliminary data had suggested that the inant low-frequency energy in these impulses did not add to risk of hearing loss, A-weighting was luded in the calculations in order to check whether or not A-weighting would yield a closer between the prevailing damage risk criteria and the TTS reported. Hearing protector attenuation eighting were transformed into a corresponding reduction of the peak level. In Fig. 4 the results
weighting have been added to those found without A-weighting (cf. RSG.6, 1987).
into account the limited accuracy of this approach the data nevertheless suggested that the ng damage risk criteria overestimated the risk of TTS. Fig. 4 shows that often no TTS was found posures above the damage risk criteria whereas already some TTS was expected in the range of the risk levels. The upper data point of each set of two per weapon represents the unweighted e. A-weighting (the lower data point of each set of two data points connected by a broken line to er point) improved the fit considerably. This result strongly suggested that A-weighting of the energy distribution of the impulse sounds might well improve the prediction of risk of hearing impulse sounds from large calibre weapons based upon the prevailing damage risk criteria.
017 1 - 7

RISK OF HEARING LOSS FROM EXPOSURE TO IMPULSE SOUNDS
Figure 4: Temporary threshold shift produced by large-calibre weapons as a function of peak level and total duration of the impulses. Encircled numbers represent the peak levels of the
weapons without attenuation of the impulse sound by the hearing protector. Upper TTS symbols represent the amount of TTS at an equivalent peak level estimated from the frequency-
dependent attenuation characteristic of the hearing protector used and the spectral energy distribution of the sound impulse. The lower data point of each pair per weapon, connected to
the upper one by a broken line, represents the corresponding A-weighted peak level. The Z-curve represents the highest single exposure permitted in the USA when using a hearing
protector. The damage risk criteria from the CHABA (1968) document and those from Pfander (1975) and Smoorenburg (1982) are included in the figure. (Figure from Smoorenburg, 1992)
1.4 ALTERNATIVE APPROACHES TO RISK ASSESSMENT
1.4.1 The Spectral Factor Above we have shown that the application of A-weighting might well improve risk assessment for large calibre weapons based upon damage risk criteria which were shown to suffice for light calibre weapons. However, A-weighting implies frequency-dependent weighting of the spectral energy distribution. Thus, it is linked with the use of energy as a measure of the exposure to impulse sounds. Accepting the energy measure one may consider several frequency-dependent weighting characteristics. The A-weighting corresponds to the equal-loudness contour at 40 dB above threshold. It is not self-evident that this characteristic is the proper one for intense impulse sounds. At higher levels the equal loudness contour becomes flatter. However, there are strong physiological arguments to defend that the threshold of hearing
1 - 8 RTO-TR-017

RISK OF HEARING LOSS FROM EXPOSURE TO IMPULSE SOUNDS
curve, with a more pronounced frequency dependency, should be a better indicator of frequency selective damage risk than higher-level equal loudness contours. The threshold of hearing curve matches closely the mechanical stimulus acting upon the receptor organ, the location where damage occurs. Therefore, we include in our analysis to follow, in addition to A-weighting, the classical threshold of hearing curve measured by Sivian and White (1933) in free field for random horizontal incidence of the sound. This weighting is denoted T-weighting.
Figure 5: Solid curves: damage risk contours for steady-state and intermittent noise bands at
different exposure durations according to Kryter et al. (1966). The contours are based on TTS studies. The broken line represents a result for 3 min. exposures and a lower TTS
criterion from Plomp et al. (1963). The latter curve is used in the present analysis as one of the frequency-dependent weightings indicated by EqTTS-weighting. A contour from
Kryter et al. close to A-weighting is indicated by ≈A.
A number of TTS experiments applying bands of noise have shown that even the T-weighting might be insufficiently frequency selective. Results from Kryter et al. (1966) and Plomp et al. (1963) are presented in Fig. 5. The data suggest that frequency dependence in the noise levels per band producing equal TTS increases with a decrease in exposure duration. In view of the results of Fig. 5 one more frequency weighting curve has been included into the analysis to follow. The curve from Plomp (found for 3 minute exposures and 5 dB TTS) was chosen because this one is the most pronounced. Applying the most pronounced curve will facilitate a comparison across possible weighting characteristics in finding the best predictor of hearing loss. The latter choice is denoted by EqTTS-weighting. The three weighting curves, A-, T-, and EqTTS weighting, are compared in Fig. 6. The absolute level of the weighting curves is arbitrary. Following the standard for A-, B- and C-weightings we have fixed the attenuation at 1 kHz to 0 dB attenuation.
RTO-TR-017 1 - 9
RISK OF HEARING LOSS FROM EXPOSURE TO IMPULSE SOUNDS
-100
-80
-60
-40
-20
0
20
40
12.5 16 20 25
31.5 40 50 63 80 100
125
160
200
250
315
400
500
630
800
1000
1250
1600
2000
2500
031
5040
0050
0063
0080
0010
000
1250
016
000
2000
0
1/3-oct frequency band in Hz
wei
ghtin
g i n
dB
A
T
EqTTS
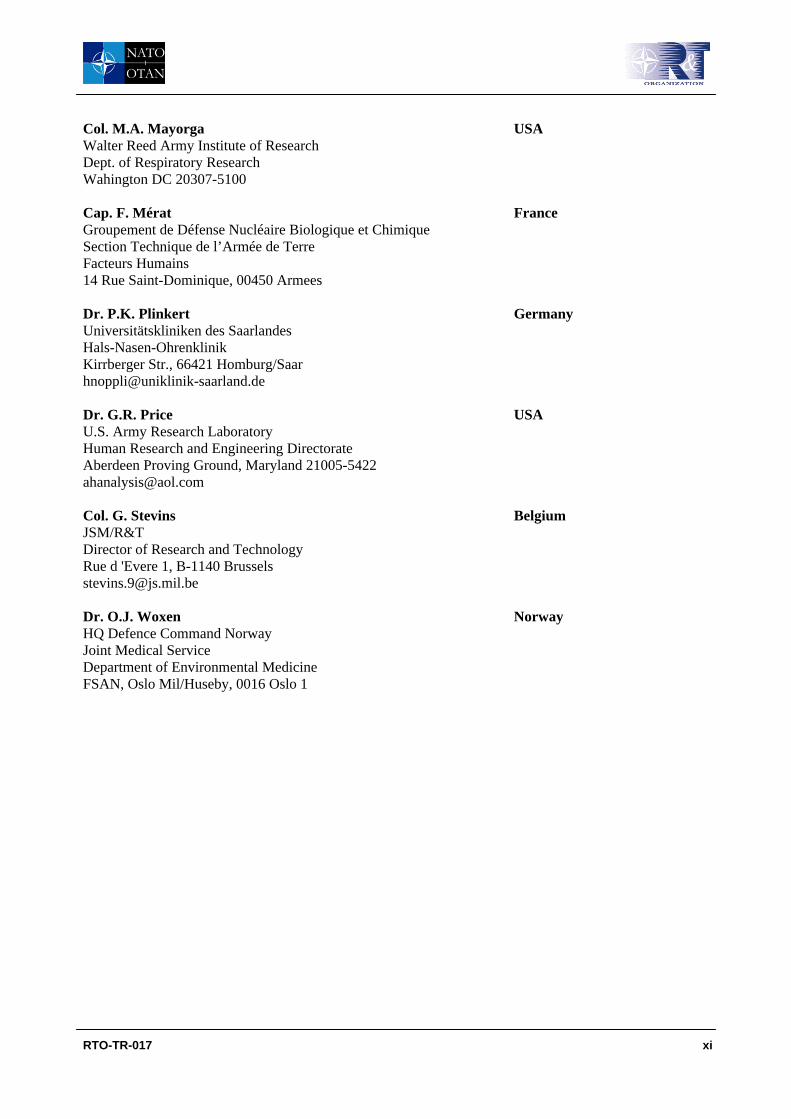
Figure 6: Comparison of the three weighting contours used in the present analysis. A: A-weighting, T: weighting corresponding to the threshold contour for random incidence
sound in free field from Sivian and White (1933) and EqTTS: weighting corresponding to the level of noise bands producing about 5 dB TTS from Plomp et al. (1963).
The CHABA (1968) document, or more accurately, its generic report (Coles et al., 1967) showed a damage risk level decreasing with A-duration. Actually, this curve was already based on spectral energy distribution considerations although the criterion was presented in terms of allowable peak level as a function of A-duration. Beyond an A-duration of about 1 ms the allowable level reached a plateau rather than showing the decrease that might be expected from sound energy increasing with increasing duration. The curve was based on spectral weighting following loudness isophones collected by Rice and Zepler for impulsive sounds (1967). Fig. 7 shows a comparison of the increase in weighted energy for the three weightings introduced above, for a condition without weighting and for the (inverted) level limit proposed in the generic report (Coles et al., 1967) of the CHABA document when using A-duration. The curves were calculated for ideal Friedlander waves obeying the equation
S(t) = (1-t/A)*exp(-t/A)
where A represents the A-duration and t represents time. Fig. 7 suggests that the allowable limit given by Coles et al. (inv. A-duration) corresponds to a weighting contour less frequency selective than A-weighting. (The curves indicated by SELT and SELEqTTS represent sound exposure levels based on T- and EqTTS weighting, weightings more frequency selective than A-weighting, see Fig. 6.) Smaller frequency selectivity could be expected since the A-duration curve was based on a higher-level equal loudness contour.
1 - 10 RTO-TR-017

RISK OF HEARING LOSS FROM EXPOSURE TO IMPULSE SOUNDS
-5
0
5
10
15
20
25
0.01 0.1 1 10
A-duration in ms
effe
ctiv
e le
vel i
n dB
SELtime
SELlin
SELA
SELT
SELEqTTS
inv A-duration
Figure 7: Effective level of Friedlander waves as a function of A-duration after applying
frequency-dependent weighting. SELtime: sound exposure level (=energy) without weighting calculated directly from the wave form (the effective level increases proportionately with
A-duration, as it should), SELlin: sound exposure level without weighting calculated from the spectral energy distribution (the deviation from the SELtime curve at high A-duration follows
from loss of energy below 12Hz, the low-frequency cut-off frequency analysis), SELA: the effect of A-weighting, SELT: effect of weighting corresponding to the threshold of hearing,
SELEqTTS: effect of weighting corresponding to bands of noise producing equal TTS, inv A-duration: the inverted allowable exposure level according to Coles et al. (1967). All effective
levels are presented relative to the exposure level at A-duration=0.1 ms.
70
80
90
100
110
120
12 16 20 25 31 40 50 63 80 100
125
160
200
250
315
400
500
630
800
1000
1250
1600
2000
2500
3150
4000
5000
6300
8000
1000
0
1250
0
1600
0
2000
0
1/3-octave band in Hz
SE
L in
dB
SP
L
0.05
0.1
0.2
0.5
1
2
5
10
Figure 8: Spectral energy distribution of ideal Friedlander waves with a peak level of 154 dB SPL and A-durations from 0.05 to 10 ms.
RTO-TR-017 1 - 11

RISK OF HEARING LOSS FROM EXPOSURE TO IMPULSE SOUNDS
In order to gain insight into the effect of frequency-dependent weighting Fig. 8 shows the spectral energy distribution for ideal Friedlander waves at a peak level of 154 dB (1 kPa). This figure shows how the low-frequency energy increases with increasing A-duration while the high-frequency energy remains constant. The high-frequency energy is proportional to the peak level only. Fig. 8 also gives an indication of the noise level of the analysis. The analysis was based on a MATLAB V6.0 program adapted from Couvreur ([email protected]) in accordance with ANSI S1.1-1986 (ASA 65-1986): Specifications for Octave-Band and Fractional-Octave-Band Analog and Digital Filters, 1993.
1.4.2 The Trade-Off between Exposure Level and Number of Impulses The trade-off between exposure level and number of impulses has been discussed already in Sec. 2.3. The energy measure suggests that the allowable exposure level should be decreased by 10 dB with every tenfold increase of the number of impulses. The TTS data available suggest, however, that this relation does not hold. The CHABA (1968) document proposed a +5 dB trade-off against a tenfold reduction of the number of impulses, down from the reference value of 100 impulses (Fig. 2). Yet, this proposal was (quote) “merely an interpolation and extension of a considered opinion expressed by Coles”.
More important data came from the Blast OverPressure (BOP) project (Patterson et al., 1997 and Chan et al., 2001). The analysis of Patterson et al. (1997) showed that the best fit to the data was obtained for a trade-off of only 2 to 3 dB per tenfold change in the number of impulses. This analysis was based upon a comparison of TTS with the sound pressures measured under the hearing protectors as they were used by the subjects. The result appeared to be quite insensitive to the type of quantification of the impulse exposure; either impulse energy subjected to some kind of frequency weighting or the peak-level total-duration approach. Chan et al. (2001) analysed the results of the same experiments but they related the TTS to free-field sound pressure measurements assuming a fixed attenuation for the hearing protectors. Their result also showed a small trade-off, 3.4 dB versus a tenfold change in the number of impulses. This result was based on a quantification of impulse sounds using the combination of peak-level and total-duration (B-duration) rather than the (weighted) energy contained in the impulses. Hence, there is no simple trade-off relation between exposure level and number of impulses. Therefore, the relation will be examined in the analysis to follow.
1.4.3 The Hearing Loss Criterion As mentioned before it is impossible to derive human dose-effect relationships based upon PTS. PTS experiments using animals may suggest possible qualitative relationships but they cannot be used to derive exposure limits. Noise susceptibility in animals may differ from human susceptibility in terms of exposure level and, moreover, in terms of frequency sensitivity. Therefore we have to rely on TTS data. In contrast to the previous evaluation (Smoorenburg, 1982) we shall here adopt the criterion of full recovery within 24 hours proposed by Pfander (1975). This view was adopted also by the members of RSG.6 when working on the protocol for the BOP project.
However, in the BOP project it was logistically important to have a measure of the effect immediately after the exposure. Moreover, the possibility of comparing the results with previously collected TTS2 data was important. Therefore, the recovery data from Pfander were carefully analysed with respect to TTS shortly after exposure. This analysis yielded the conclusion that at any frequency full recovery can be expected when TTS2 does not exceed 25 dB, including the few instances where a paradoxical increase of TTS during the first hours after exposure was found (Dancer et al., 1991). This criterion will be used in the analysis to follow. It is a more stringent criterion than the former one of 15 dB, averaged across 1, 2, and 3 kHz. Fig. 2 of Smoorenburg (1982) shows that the former criterion implies a loss of about 30 dB at 4 and 6 kHz.
1 - 12 RTO-TR-017

RISK OF HEARING LOSS FROM EXPOSURE TO IMPULSE SOUNDS
In addition to the reduction in TTS, the criterion was lowered by allowing not more than 5% of the population in excess of 25 dB TTS2 at any frequency rather than the 10% used before. This reduction implies quite some demands on population size. Therefore, Patterson et al. (1997) introduced the confidence principle in extrapolating the data collected within a limited size population to a general prediction. He adopted a confidence percentage of 95%. Also Chan et al. (2001) used this approach. Below, the TTS2 criterion of 25 dB, at any frequency not to be exceeded by more than 5% of the population exposed, will be used.
1.5 NEW ANALYSES FOR SHORT IMPULSES
1.5.1 Trade-Off between Allowable Exposure Level and Number of Impulses for Short Sparks
The trade-off between allowable exposure level and number of impulses cannot be determined from a compilation of all data, as was done previously (Fig. 2). The number effect is small with respect to the inaccuracy introduced by comparing results across experiments with non-uniform designs. Therefore, we restricted ourselves to within-experiment comparisons. The experiments suited for this purpose are those from Fletcher and Loeb (1968) for very short electrical sparks, from Coles et al. (1967), complemented by data from Pfander et al. (1980) and Dancer et al. (1991), for rifles and the recent data from the BOP study (1997) for blasts. The spark and rifle studies will be evaluated here, the BOP study will be analysed separately.
Loeb and Fletcher (1968) showed that the number of sound impulses from electrical sparks at 166 dB peak SPL level had to be reduced from 80 to 4 when the total duration of the N-shaped impulses was increased from 0.034 ms to 0.096 ms in order to evoke the same amount of TTS2. TTS2 for these short impulses was found primarily in the frequency range beyond 4 kHz. This finding suggests a trade-off relation of about 3 in duration with a factor of 20 in number of impulses. Taking duration as a direct measure of energy this result implies a 3.5 dB change in exposure level with a tenfold change in number of impulses. However, the impulses are very short which implies that the energy distribution peaks at high frequencies. For example, the 0.034 ms impulse will have its spectral peak at about 30 kHz given that the wave form was N-shaped. Therefore analysis was continued on a spectral basis. The wave forms were scanned from the publication and subsequently sound exposure levels were calculated with the frequency-dependent weightings described before. The result showed trade-offs of 8.3, 10.8, 14.7, and 17.2 dB with a tenfold change in number of impulses for, respectively, linear, A-, T- and EqTTS-weighting in the pass band from 12.5 to 20000 Hz. Thus, for A-weighting the result is close to what one expects assuming energy to be the adequate measure.
1.5.2 The Allowable Exposure Level for Short Sparks Since the level-number trade-off obeyed the equal energy concept closely for A-weighting this weighting shall be used. The TTS2 criterion in the Loeb and Fletcher (1968) study for 4 impulses at 0.096 ms A-duration to 86 impulses at 0.034 ms was reached at 116 dBA,SEL with normal sound incidence (sound source in front of the ear). Their TTS2 criterion was 30 dB median hearing loss at any frequency. This criterion was hit at frequencies beyond 10 kHz. 116 dBA,SEL corresponds to an 8-hour equivalent of Leq8 = 71.4 dBA. Thus, the spark exposure with Leq8 = 71.4 dBA produced TTS2 far beyond our criterion of 25 dB TTS2 not to be exceeded by only 5% of the population exposed.
Applying the EqTTS weighting the result becomes 130 dBEqTTS,SEL for the A-duration of 0.096 ms and 120 dBEqTTS,SEL for the A-duration of 0.034 ms. This result is given for later comparison (Sec. 7.1). Keep in mind that the absolute level depends on the normalization of the weighting functions; in this
RTO-TR-017 1 - 13

RISK OF HEARING LOSS FROM EXPOSURE TO IMPULSE SOUNDS
evaluation always 0 dB at 1000 Hz (Fig. 6). The difference in levels found for two types of weightings depends on the normalization.
1.5.3 Trade-Off between Allowable Exposure Level and Number of Impulses for Rifle Shots
The most extensive TTS data set for impulses from rifles is included in the generic report (Coles et al., 1967) of the CHABA (1968) document. A-duration of the impulses range from 0.25 to 0.35 ms; B-duration is specified at about 4 ms although related reports show that occasionally it might have been 2 ms. The number of impulses, N, ranges from 25 to 100. The inter-impulse interval was about 5 s. This interval was believed to be most damaging to the ear. The peak levels covered the range from 140 to 170 dB SPL. All data in Coles et al., (1967) were transformed by the authors to TTS2, TTS measured two minutes after exposure to the last impulse. Of course, this is impossible to accomplish in practice, in particular not at all audiometric frequencies. Therefore, data collected at post-exposure intervals close to two minutes were transformed to TTS2 in accordance with the method of Kryter (1963). All data were specified in terms of TTS2 exceeded by 50, 25 or 10% of the population exposed. Thus, the 5% criterion introduced above will require extrapolation of these data. The number of subjects participating in the experiments included in Coles et al. (1967) ranged from 7 to 178. Finally, the data concerned sound incidence grazing to the ear (sound source in front of the subject’s face, like for the rifle man when shooting his weapon) and normal to the ear (sound source in front of the ear, which may be true for the instructor). Normal incidence is considered to be the most damaging angle of incidence.
The TTS2 data exceeded by 10% of the population exposed are collected in Fig. 9. Most TTS2 occurs at 4 or 6 kHz. In order to reduce variability in the TTS2 data the average value of TTS2 found at these two frequencies have been used. By interpolation and slight extrapolation 25 dB TTS2 for grazing incidence is found at:
N = 25 Lp = 159.0 dB SPL
N = 50 Lp = 158.9 dB SPL
N =100 Lp = 150.6 dB SPL
For normal incidence TTS2 cannot well be extrapolated to the 25 dB TTS2 line. For N=25 comparison at 32 dB TTS2 yields a difference between grazing and normal incidence of Lp= 2.3 dB, for N=50 comparison at 40 dB TTS2 yields Lp= 5.5 dB. The data are too limited to conclude that the difference would increase with increasing TTS2. Therefore, the conclusion is that in case of normal incidence Lp should be 4 dB lower in order to produce the same amount of TTS. The CHABA document advised the round number of 5 dB.
1 - 14 RTO-TR-017

RISK OF HEARING LOSS FROM EXPOSURE TO IMPULSE SOUNDS
05
101520253035404550556065707580
140 145 150 155 160 165 170
Lp in dB
TTS4
,6 in
dB
exce
eded
by
10%
25G
50G
100G
25N
50N
10G
5G
Figure 9: TTS2 , averaged across 4 and 6 kHz, exceeded by 10% of the population exposed
as a function of the peak level Lp in dB SPL. Parameter is the number of impulses (5 to 100) and the angle of sound incidence (G, grazing; N, normal). Data from Coles et al. (1967)
except 10G from Dancer et al. (1991) and 5G from Pfander et al. (1980). The latter two data points are derived by extrapolation (see text).
The Coles et al. (1967) data also allow to estimate the standard deviation in TTS2 across the population exposed. At 4 and 6 kHz near the criterion of 25 dB TTS2 it is16 dB. Thus extrapolation from 10% to 5% of the population exposed implies an increase of TTS2 by 5.8 dB. In addition Fig. 9 shows that the increase of TTS2 with Lp is about 30 dB TTS2 per 10 dB increase in Lp. Above 25 dB this may increase to about 40 dB with 10 dB increase in Lp. These relations will be used below for some small extrapolations.
Before considering the level-number trade-off two more TTS experiments have to be included. The first one comes from Pfander et al. (1980). They specified their results in terms of percentage of the population with prolonged recovery:
Rifle N Lp number of subjects percentage with prolonged recovery FNC 6 158.3 103 < 5% G3 5 160.8 78 13%
This result suggests that the level near 160 dB SPL can be very critical. Using the relation between growth of TTS and peak level and the standard deviation in TTS from the previous paragraph, the result for the G3 rifle suggests that 10% prolonged recovery would have been found at about Lp=160 dB. Above, the criterion of 25 dB TTS2 was based on the conclusion (from Pfander’s very data set) that this TTS2 corresponds to no recovery prolonged above 24 hours. Thus, the result from Pfander et al., adjusted for
RTO-TR-017 1 - 15

RISK OF HEARING LOSS FROM EXPOSURE TO IMPULSE SOUNDS
10%, has been added to Fig. 9 as Lp=160 dB at 25 dB TTS2 (the 5G data point). The results concerned the rifle men, hence sound incidence was grazing. Inter-impulse interval was 10s (Pfander, 1972).
The last experiment to include stems from Dancer et al. (1991). This experiment addressed particularly the effect of the inter-impulse interval. It showed that the effects of 10 rifle impulses (A-duration 0.25 ms) with impulse-intervals of 60 ms are somewhat smaller than with 10 s intervals. This illustrates the point forwarded earlier that impulse spacing in the order of seconds (pertinent to the present data) is relatively damaging to the ear. According to Dancer et al. (1991) 25% of the subjects showed about 25 dB TTS5 after exposure to 10 impulses at Lp=159 dB SPL (12 subjects). The difference between the 25% and 10% data from Coles et al. (1967) near 25 dB TTS2 at10% is about13 dB. Thus, the exposure in this experiment might have produced 38 dB exceeded by 10% of the population exposed. In agreement, one out of the 12 subjects in the Dancer et al. study showed this TTS. Growth of TTS with peak level at this TTS is about 40 dB of TTS with 10 dB increase of peak level. Hence, the criterion of 25 dB TTS not to be exceeded by 10% might have been found at Lp = 159 -13/4 = 155.8 dB SPL. This result (for 10 impulses and grazing incidence) has been added to Fig. 9 (point 10G).
Fig. 9 shows that there is no clear level-number trade-off for 50 impulses and below. Rather, the data suggest, even stronger than the Coles et al. data set, that there is a critical peak level of about 159 dB SPL with grazing incidence (155 dB normal incidence) for any number of impulses at or below 50.
1.5.4 The Allowable Exposure Level for Rifle Shots A slightly more consistent result is obtained when considering the energy contained in the impulses rather than the peak levels. This follows from the Dancer et al. (1991) data. They reported that their sound waves included ground reflections. The difference in their data between the peak level and the A-weighted sound exposure level for a single impulse was specified as Lp – A,SEL = 33.9 dB. This difference is somewhat smaller than found in other data (Table I). The largest difference is found for the ideal Friedlander wave, which illustrates that resonance in the rifle and/or sound reflections may somewhat increase the energy contained in the impulse in relation to its peak value. From these data we conclude that the difference for a rifle (without reflections) is on average 37 dB.
Table I: Difference between the peak level and the A-weighted SEL for rifle noise Source Lp – A,SEL Publication Friedlander wave, 0.5 ms A-duration 40.7 present analysis (Sec. 4.1) Explosions (near Friedlander wave) 39.5 Parmentier et al. (1995) Rifle (energy originally specified in J/m2) 40.0 Price et al. (1989) Rifle, instructor 37.3 Dancer and Franke (1994) Rifle, shooter 34.6 Dancer and Franke (1994) FNC rifle 36.8 Brinkmann (2000) Rifle with reflections 33.9 Dancer et al., see above
This difference is applied to the data from Coles et al. (1967) and from Pfander et al. (1980), the latter publication related to the sound pressure level measurements reported by Brinkmann (2001). The data from Dancer et al. (1991) were transformed to A,SEL values by using their own difference of 33.9 dB. The result, as a function of number of impulses, is presented in Fig.10. Fig. 10 shows the A-weighted sound exposure level for a single grazing-incidence impulse at which, for the number of impulses given on the abscissa, the criterion of 25 dB TTS2, averaged over 4 and 6 kHz, not to be exceeded by 10% of the population exposed, will be reached. Again, this result suggests that there is a critical level for 50 impulses
1 - 16 RTO-TR-017

RISK OF HEARING LOSS FROM EXPOSURE TO IMPULSE SOUNDS
or less. The critical level is about 122 dBA,SEL with grazing incidence. This reduces to 118 dBA,SEL with normal incidence.
When using the more stringent 5%-criterion (i.e., 25 dB TTS2, averaged over 4 and 6 kHz, not to be exceeded by 5% of the population exposed), the critical level must be reduced by 2 dB (see below). Hence, the critical level for rifles, given the above conditions, is 116 dBA,SEL.
110111112113114115116117118119120121122123124125
1 10 100
number of impulses, N
sing
le im
puls
e le
vel i
n dB
A,S
EL
Figure 10: A-weighted sound exposure level of a single impulse with grazing incidence as a function of the number of impulses, N, meeting the criterion of 25 dB TTS2 , not to be
exceeded by more than 10% of the population exposed. Data adapted from Coles et al. (1967) except for N=10, from Dancer et al. (1991), and for N=5, from Pfander et al. (1980). Solid line: best fitting trade-off between exposure level and number of impulses of –7.2 dB per tenfold increase
in number; broken line: −10 dB per tenfold increase in number conform the equal energy concept, both trade-off lines not allowing any overexposure.
When one wishes to derive a level-number trade-off function, including the results for 100 impulses, the solid line in Fig. 10 indicates that the trade-off will be −7.2 dB per tenfold increase of the number of impulses. This approach would be at maximum 7 dB A,SEL on the safe side for number of impulses between 5 and 100. When one wishes to approximate the data based on the equal energy principle (−10 dB per tenfold increase in number) the line in Fig. 10 should pivot at the Pfander result (N=5). Maximum overprotection then increases to 9 dB (at 50 impulses).
Finally, expressing the allowable exposure in A-weighted sound exposure level, the result of 110 dB A,SEL for 100 impulses of Fig. 10 gives:
+20 dB to include the number of impulses in the SEL measure
− 2 dB to account for the reduction of 10% to 5% exceeded; with a standard deviation of 16.2 dB, 25 dB TTS2 exceeded by 10% implies 30.8 dB exceeded by 5%, this requires a reduction of Lp by 2 dB in order to get 5% at 25 dB TTS2.
− 4 dB to account for normal incidence.
RTO-TR-017 1 - 17

RISK OF HEARING LOSS FROM EXPOSURE TO IMPULSE SOUNDS
Thus, the maximum allowable exposure level becomes 124 dB A,SEL. This corresponds to an equivalent 8-hour level of Leq8 = 79.4 dBA.
Smoorenburg (1982) arrived at 85 dBA for 10% exceeding 15 dB TTS2 averaged over 1, 2, and 3 kHz. 15 dB TTS2 averaged over 1, 2, and 3 kHz corresponds to about 30 dB at 4 and/or 6 kHz (Sec. 4.3). The data in Coles et al. (1967) suggest that 30 dB exceeded by 10% would correspond to 38.5 dB exceeded by 5%. A 13.5 dB reduction in TTS2 to arrive at 25 dB implies a reduction in exposure level of about 4.5 dB (30 dB decrease in TTS with 10 dB decrease in peak level). Thus, with the new criterion of 25 dB TTS2 not to be exceeded by 5% of the population exposed the former evaluation, which included more data because the higher TTS criterion allowed for the inclusion of more data, yields Leq8 = 80.5 dBA, a result very close to the present one of Leq8 = 79.4 dBA. In terms of the 8-hour equivalent, the conclusion that Leq8 should not exceed (the familiar value of) 80 dBA is justified. With Leq8 = 80dBA all data satisfy the criterion of 25 dB TTS2, not to be exceeded by 5% of the population exposed, with incidental overprotection up to about 10 dB. The 25 dB TTS2 criterion implies full recovery from TTS after 24 hours.
Since the waveforms were not available it is impossible to calculate the corresponding sound exposure levels applying the alternative weightings of Fig. 6. However, a rough estimate can be given on the basis of the theoretical calculations using ideal Friedlander waves (Sec. 4.1). For an A-duration of 0.5 ms T-weighting produces 2.3 dB higher and EqTTS 13.3 dB higher levels than A-weighting. Thus, the allowable sound exposure level would become 124 + 2.3 =126.3 dB,T weighted and 124 + 13.3 = 137.3 dB,EqTTS weighted. Leq8 would become 80 + 2.3 = 82.3 dB,T weighted and 80 + 13.3 = 93.3 dB,EqTTS weighted.
1.6 EVALUATION OF THE BLAST OVERPRESSURE PROJECT
1.6.1 Experimental Design Sec. 3 showed that the criteria in CHABA (1968), Pfander (1975), and Smoorenburg (1982) most probably overestimated risk of hearing damage from large calibre weapons when using hearing protection, even when the low-frequency energy in the impulse sound was assumed to contribute less to hearing damage by applying A-weighting. Consensus on this point within RSG.6 supported new experimental research in this field.
The largest study was the Blast OverPressure project (BOP) conducted at Kirtland Airforce Base, Albuquerque, New Mexico, USA under contract DAMD-17-88-C-8141 with EG&G, Management systems, Albuquerque. The first preparatory report appeared in 1986 (Phillips et al.), followed by a number of publications, the last one, so far, in 2001 (Patterson et al., 1997; Johnson, 1998; Johnson, 1994; Johnson et al., 1990I, II, III; Chan et al., 1999; Chan et al., 2001). The BOP project included auditory and non-auditory effects from blasts. This section is limited to the auditory effects. It presents a new analysis. Earlier, Patterson et al. (1997) presented an analysis in which it is not clear how the data collected at 5 meter distance between the explosives and the subjects were included (conditions will be discussed below). Page1 of their report mentions that the muff was unmodified in the 5 meter condition. Page 9 mentions that the 5 meter data showed no significant TTS with the unmodified muffs and that therefore the data were not included in the analysis of the level-number trade-off function. The only under-the-muff sound pressure measurements collected in the subjects (not the experimenters) for the 5 meter condition are those for the unmodified muff (BOP, 1997). In the present analysis the 5 meter, unmodified-muff data have been fully included. The finding that there was no TTS in this condition is an important result that has to be taken into account. Chan et al. (1999, 2001) analysed the data based upon the free-field sound pressure measurements while assuming a certain (constant) attenuation for the muff. The present analysis is based only on the under-the-muff measurements.
1 - 18 RTO-TR-017

RISK OF HEARING LOSS FROM EXPOSURE TO IMPULSE SOUNDS
All experiments were conducted with human volunteers using hearing protection. They were primarily based on TTS measurements, performed between 125 and 8000 Hz in steps of one octave and supplemented by 3000 and 6000 Hz, secondarily on tinnitus complaints and discomfort reported spontaneously. At any time volunteers were allowed to withdraw from the experiments. The TTS criterion was based on the target that there should be complete recovery within 24 hours. Sec. 4.3 of this report discussed that this was translated into TTS2 ≤ 25 dB (RSG.6, 1987). Both previous reports have focussed on the percentage confidence that 95% of any population (extrapolated from the population exposed) would be protected. The extrapolation depends on the number of subjects involved. The target of 95% confidence implied at least 59 volunteers per condition; the actual number was 59 to 68. Since a number of data sets are included in this analysis, confidence will grow with the number of independent data sets. Therefore, we preferred to conduct the analysis in terms of the percentage of subjects exposed with TTS2 > 25 dB. Moreover, this allows direct comparison with the data for the short impulses (Sec. 5).
The blasts produced impulse sounds with peak levels depending on charge level and distance:
at 1m from 178.1 to about 196 dB SPL for charge levels from 1 to 7,
at 3m from 177.9 to 193.2 dB SPL for charge levels from 2 to 7,
at 5m from 172.9 to 189.4 dB for charge levels from 1 to 7.
The difference in peak level between two successive charge levels and two successive distance was about 3 dB. The number of impulses per exposure were 6,12,25,50,100; in terms of energy also a 3 dB difference. The impulses were presented at a rate of about one per minute. Subjects were exposed to conditions with increasing level and number until the target TTS2 of 25 dB was reached. More specifically, since TTS2 in excess of 25 dB had to be avoided, TTS2 > 15 dB was considered to be a conditional failure in the sense that one step increase in exposure level or number was expected to produce TTS2 > 25 dB. Thus, whenever TTS2 > 15 dB the next step was considered to be a failure and it was not measured. (Figs. 15 and 16 support this approach showing that the increase of TTS with exposure level is very progressive.)
The right ear was always directed toward the sound source. It was covered by a standard US Army RACAL ear muff, which was placed under a standard infantry helmet. The left ear was also protected by the RACAL muff, but additionally by a foam ear plug. The first series of experiments were conducted at the distance of 5 m. After this first series there was no TTS at any frequency. Therefore, the muff of the right ear was modified by inserting eight plastic tubes (2.3 mm inside diameter) through the ear seal to produce a leak simulating a badly fitting muff. All subsequent series, at distances of 5, 3, and 1 meter were conducted with this modified muff. Wave forms were measured for at most three subjects per condition, at both the right and left ears, under the muffs near the ear canal, using miniature pressure transducers (low-pass cut-off frequency at 40 kHz). In addition, the free-field wave forms were measured at two locations representative of the locations of the right ears. The wave forms were sampled at a rate of 125 kHz. Each wave form consisted of 215 samples (BOP,1997).
Representative examples of the free-field wave forms for charge level 5 are shown in Fig. 11 (left-hand panels). A-durations were about 0.9, 1.6, and 3.0 ms at 1, 3, and 5 m, respectively. At 5 m there was a clear reflection. The wave forms measured under the muff are shown in the right-hand panels. For 1 and 3 meter the muff was modified, for 5 meter it was unmodified. The right-hand panels clearly show a predominating low- frequency wave. This wave originates with the low-pass frequency characteristic of the ear muff.
The spectral energy distribution of the impulse sounds is presented in Fig. 12. Fig. 12 shows that the overall level of the distribution follows the peak level, be it that the low-frequency energy increases slightly more than proportionately from charge level 2 to 5. However, note that the distribution changes markedly with distance. There is relatively more low-frequency energy at 5 meter than at 1 meter. In the
RTO-TR-017 1 - 19

RISK OF HEARING LOSS FROM EXPOSURE TO IMPULSE SOUNDS
lowest frequency bands the energy even increases with increasing distance. The peaks and troughs in the energy distribution below 500 Hz are related to the reflections.
Figure 11: Blast wave forms measured at distances of 1, 3 and 5 meter with charges al level 5.
Left panels: free-field measurements, right panels: measurements under the muff. At distancesof 1 and 3 meter the muff was modified, at 5 meter it was unmodified. Abscissa: number of samples at rate of 125 kHz (1000 samples=8ms), ordinate: peak level in kPa.
1 - 20 RTO-TR-017

RISK OF HEARING LOSS FROM EXPOSURE TO IMPULSE SOUNDS
100
105
110
115
120
125
130
135
140
145
15012 20 31 50 80 12
5
200
315
500
800
1250
2000
3150
5000
8000
1250
0
2000
0
1/3-octave band in Hz
soun
d ex
posu
re le
vel i
n dB
SP
L
1, 2, 180.8
1, 5, 190.4
3, 2, 177.9
3, 5, 187.0
3, 7, 193.2
5, 2, 176.0
5, 5, 184.0
5, 7, 189.4
Figure 12: Free-field 1/3-octave energy spectra of the blast waves in dB,SEL. Legend items successively: distance between location of charge and ear,
charge level in arbitrary units, peak sound pressure level.
-5
0
5
10
15
20
25
30
35
40
12 20 31 50 80 125
200
315
500
800
1250
2000
3150
5000
8000
1250
0
2000
0
1/3-octave band in Hz
atte
nuat
ion
in d
B
subj unmodifiedexper unmodifiedPEAT unmodifiedsubj modifiedexper modifiedPEAT modified
Figure 13: Attenuation of modified and unmodified muff measured in the subjects and in the experimenters. PEAT data are for measurements in an
enclosure, in low-level random-incidence noise.
RTO-TR-017 1 - 21

RISK OF HEARING LOSS FROM EXPOSURE TO IMPULSE SOUNDS
The attenuation of the ear muff is presented in Fig. 13. The attenuation has been calculated from the differences between the free-field and the under-the-muff measurements for (at most) three subjects per condition. In addition, the same measurements were conducted for three experimenters. These results are also included in Fig. 13. Results for the unmodified muff are limited to the 5 meter condition, those for the modified muff pertain to the 3 and 1 meter conditions. Finally, two curves have been added to Fig. 13 representing the results of sound pressure measurements in an enclosure using low-level noise at random incidence (the Physical Ear Attenuation Test, PEAT). For each subject the PEAT measurement preceded the blast exposures in order to make sure that the hearing protector was well placed. The PEAT results differ markedly from the measurements based on the blasts. Differences between the PEAT and blast measurements were: (1) the exposure level (much higher for the blasts), (2) the angle of sound incidence (random for PEAT and normal for the blasts), and (3) the microphone position without protection (at the ear for PEAT and free-field for the blasts). In spite of these three differences the marked difference in attenuation is not well understood. Ear muff attenuation will be discussed further in Sec. 8. The difference does not affect the present evaluation, which is completely based on the under-the-muff pressure measurements.
1.6.2 The Dose-Effect Relation for Blasts The results of the BOP experiments were analysed in terms of the percentage of the population exposed with TTS2 > 25 dB versus the sound exposure level of the impulses subjected to the frequency-dependent weighting functions introduced in Sec. 4.1 and Fig. 6. All combinations of linear, A-, T-, and EqTTS-weighting and level-number trade-offs of 0 to -14 dB per tenfold increase of number of impulses have been tried. The percentage excess TTS was assumed to grow exponentially with sound exposure level. The fit was based on a least squares approximation of the percentage excess TTS. (Many statistical programs first transform exponential curves logarithmically after which linear regression is applied to the result. This implies least squares with respect to the logarithm of the data rather than the data itself. This is not the case in the present analysis.)
The variance explained by the fit is shown in Fig. 14. The solid symbols refer to three data sets: 5m distance, unmodified muff and 1 and 3 m distance, modified muffs. The open symbols are based on these three data sets plus one additional set: 5m distance and modified muff. For this condition there were no under-the-muff sound pressure measurements from the subjects. However, data were available from the experimenters. Fig. 14 shows that inclusion of this fourth data set reduces the variance explained markedly. The exposure levels from the experimenters were rather high as compared to those from the subjects. In particular one of the experimenters showed very high exposure levels; a difference with the results from the two other experimenters much larger than the variability found amongst the subjects. These results suggested that this latter data set should not be included in the analysis although TTS measurements were available. Inclusion of this data set, if exclusion were not allowed, would give higher exposure levels. Thus, exclusion would imply a bias on the safe side.
1 - 22 RTO-TR-017

RISK OF HEARING LOSS FROM EXPOSURE TO IMPULSE SOUNDS
0
10
20
30
40
50
60
70
80
90
100
0 2 4 6 8 10 12 14 16
coefficient of 10log(N)
% v
aria
nce
expl
aine
d
linATEqTTslinATEqTTs
Figure 14: Variance in % excess TTS explained by predicting the TTS from sound exposure
levels weighted as indicated in the legend and taking the number of impulses, N, into account by increasing the sound exposure level with the coefficient indicated on the abscissa multiplied by 10log(N). A coefficient of 10 corresponds to the equal energy principle. Solid data points for the
restricted data set without the 5m, modified muff data; open data points for the total data set using the exposure levels from the experimenters rather than the subjects.
Fig. 14 shows that the best fit is found for T-weighted sound exposure levels at a level-number trade-off of –5 dB per tenfold increase in number of impulses. Next best is EqTTS-weighting. A-weighting does markedly less well. However, in addition to T-weighting we shall also continue with the results for A-weighting in view of its general application. The optimal level-number trade-off for A-weighting appears to be –3 dB per tenfold increase in number of impulses. Thus, both trade-offs are smaller than the –10 dB per tenfold increase following from the equal energy concept. The deviation from equal-energy was found before for rifle shots (Fig. 10). Patterson (1997), using alternative weightings based on animal experiments, and Chan (1999,2001) using the free-field data and combinations of peak level and duration measures in addition to energy measures came to the same conclusion. Fig. 14 shows that linear weighting yields a much worse fit.
This suggests that the previously proposed measures based on combinations of peak level and some duration measure, measures which do not include spectral weighting, are due to provide a worse prediction of TTS. The exponential fits to the T- and A-weighted data are presented in Figs. 15 and 16, respectively. The excluded data set is indicated by the red colour.
RTO-TR-017 1 - 23
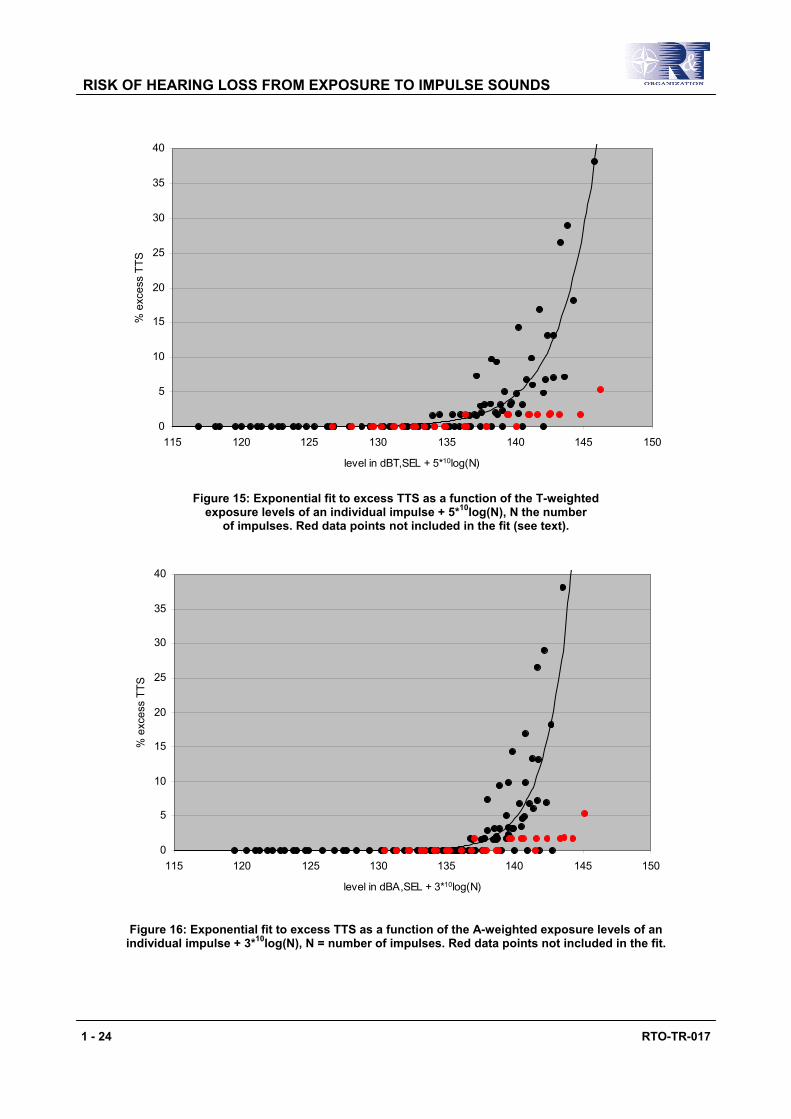
RISK OF HEARING LOSS FROM EXPOSURE TO IMPULSE SOUNDS
0
5
10
15
20
25
30
35
40
115 120 125 130 135 140 145 150
level in dBT,SEL + 5*10log(N)
% e
xces
s TT
S
Figure 15: Exponential fit to excess TTS as a function of the T-weighted
exposure levels of an individual impulse + 5*10log(N), N the number of impulses. Red data points not included in the fit (see text).
0
5
10
15
20
25
30
35
40
115 120 125 130 135 140 145 150
level in dBA,SEL + 3*10log(N)
% e
xces
s TT
S
Figure 16: Exponential fit to excess TTS as a function of the A-weighted exposure levels of an
individual impulse + 3*10log(N), N = number of impulses. Red data points not included in the fit.
1 - 24 RTO-TR-017

RISK OF HEARING LOSS FROM EXPOSURE TO IMPULSE SOUNDS
Rather than taking the results from the data fitting above, the next step in the analysis will focus on the criterion of 5% excess TTS. Figs. 17 and 18 show the results per distance and per number of impulses as a function of the T- and A-weighted sound exposure levels, respectively. The excluded data set is the 5m data set for all number of impulses except for the green data points, which represent the data for the unmodified muff. Figs. 17 and 18 show that the 5m data points for the unmodified muff, although without excess TTS, reach sound levels such that their position does contribute to the goodness of fit. The sound level at which 5% TTS is found has been determined by interpolation. The results are presented in Figs. 19 and 20 for the T- and A-weighted exposure levels, respectively. Fig. 19 shows that the T-weighted data can be summarized with a trade-off relation of only -3 dB per tenfold increase in number of impulses. For 100 impulses the single impulse value is 130 dBT,SEL and thus the total sound exposure level becomes 150 dBT,SEL. At 6 impulses the single impulse value is 133.7 dBT,SEL and the total sound exposure level becomes 141.4 dBT,SEL. When one wishes to stay with an equal-energy approach the total sound exposure level becomes 141 dBT,SEL (the dotted curve in Fig. 19).
-5
0
5
10
15
20
25
30
35
40
120 122 124 126 128 130 132 134 136 138 140
level of one impulse in dBT,SEL
% e
xces
s TT
S
1, 6
1, 12
1, 25
1, 50
1, 100
3, 6
3, 12
3, 25
3, 50
3, 100
5, 6
5, 12
5, 25
5, 50
5, 100
5, 100
Figure 17: % excess TTS as a function of the T-weighted exposure level of a single impulse.
Legend: distance, number of impulses. At 5 m distance only the green data are used (see text).
RTO-TR-017 1 - 25
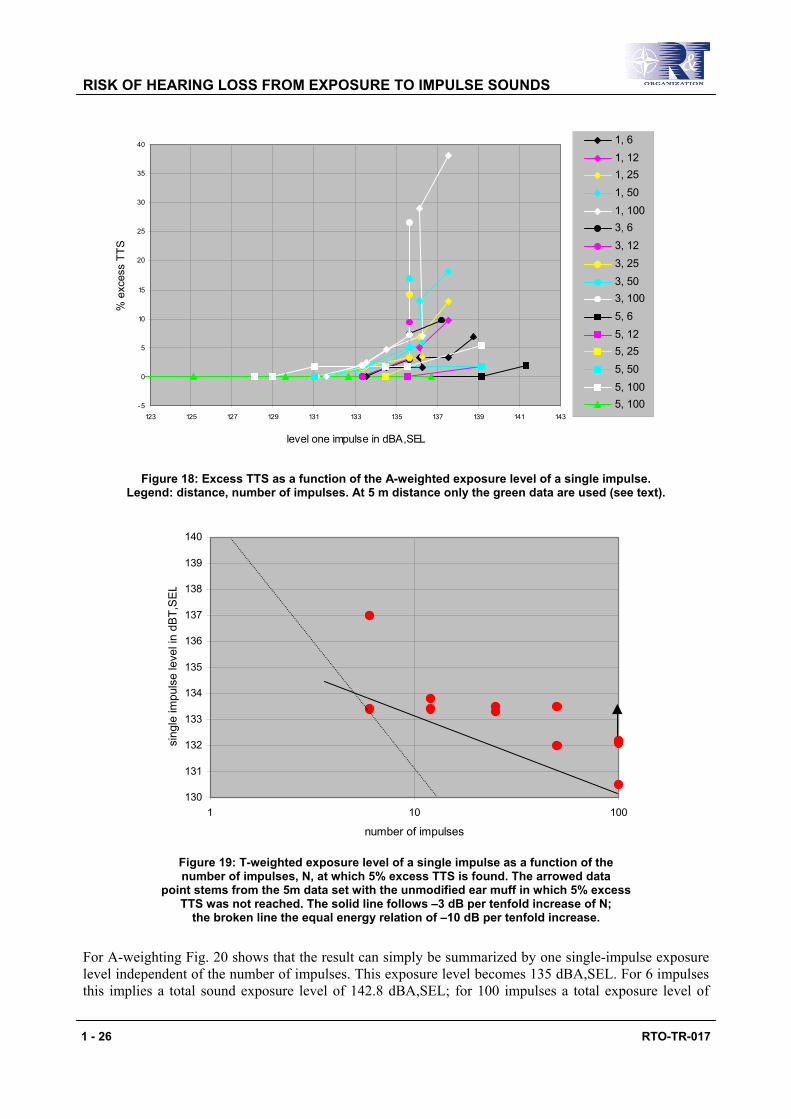
RISK OF HEARING LOSS FROM EXPOSURE TO IMPULSE SOUNDS
-5
0
5
10
15
20
25
30
35
40
123 125 127 129 131 133 135 137 139 141 143
level one impulse in dBA,SEL
% e
xces
s TT
S
1, 61, 121, 251, 501, 1003, 63, 123, 253, 503, 1005, 65, 125, 255, 505, 1005, 100
Figure 18: Excess TTS as a function of the A-weighted exposure level of a single impulse. Legend: distance, number of impulses. At 5 m distance only the green data are used (see text).
130
131
132
133
134
135
136
137
138
139
140
1 10 100
number of impulses
sing
le im
puls
e le
vel i
n dB
T,S
EL
Figure 19: T-weighted exposure level of a single impulse as a function of the number of impulses, N, at which 5% excess TTS is found. The arrowed data
point stems from the 5m data set with the unmodified ear muff in which 5% excess TTS was not reached. The solid line follows –3 dB per tenfold increase of N;
the broken line the equal energy relation of –10 dB per tenfold increase.
For A-weighting Fig. 20 shows that the result can simply be summarized by one single-impulse exposure level independent of the number of impulses. This exposure level becomes 135 dBA,SEL. For 6 impulses this implies a total sound exposure level of 142.8 dBA,SEL; for 100 impulses a total exposure level of
1 - 26 RTO-TR-017
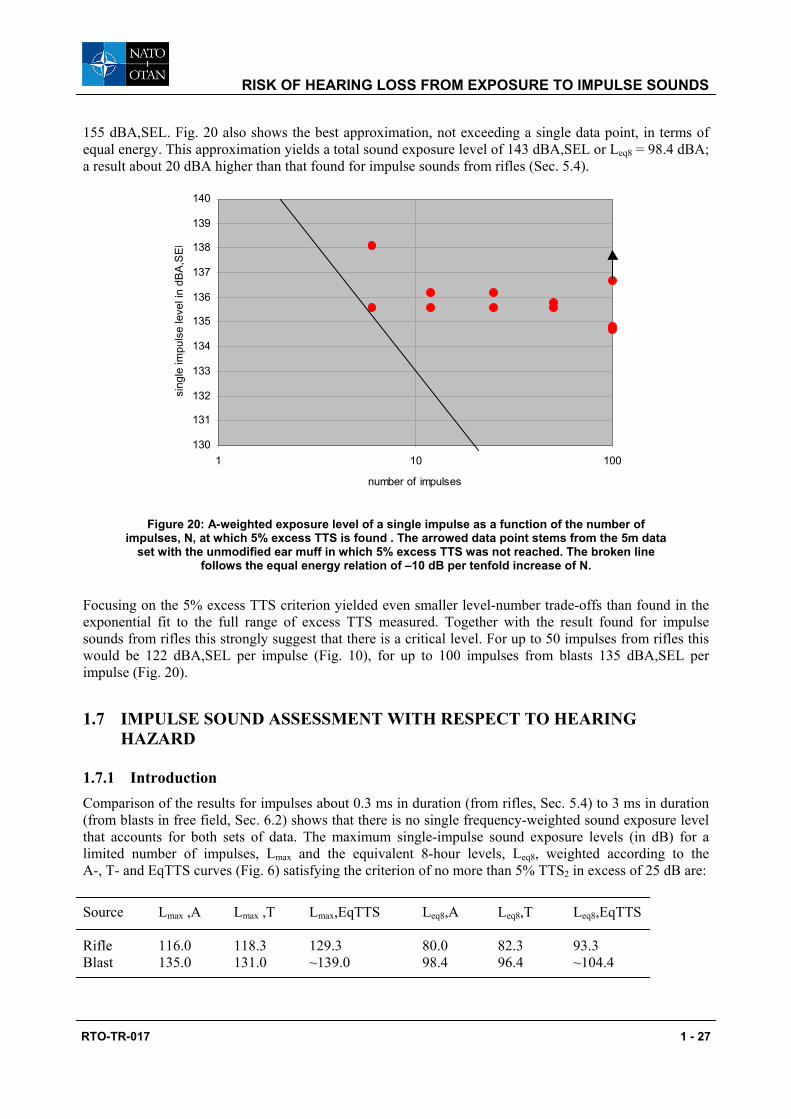
RISK OF HEARING LOSS FROM EXPOSURE TO IMPULSE SOUNDS
155 dBA,SEL. Fig. 20 also shows the best approximation, not exceeding a single data point, in terms of equal energy. This approximation yields a total sound exposure level of 143 dBA,SEL or Leq8 = 98.4 dBA; a result about 20 dBA higher than that found for impulse sounds from rifles (Sec. 5.4).
130
131
132
133
134
135
136
137
138
139
140
1 10 100
number of impulses
sing
le im
puls
e le
vel i
n dB
A,S
EL
Figure 20: A-weighted exposure level of a single impulse as a function of the number of
impulses, N, at which 5% excess TTS is found . The arrowed data point stems from the 5m data set with the unmodified ear muff in which 5% excess TTS was not reached. The broken line
follows the equal energy relation of –10 dB per tenfold increase of N.
Focusing on the 5% excess TTS criterion yielded even smaller level-number trade-offs than found in the exponential fit to the full range of excess TTS measured. Together with the result found for impulse sounds from rifles this strongly suggest that there is a critical level. For up to 50 impulses from rifles this would be 122 dBA,SEL per impulse (Fig. 10), for up to 100 impulses from blasts 135 dBA,SEL per impulse (Fig. 20).
1.7 IMPULSE SOUND ASSESSMENT WITH RESPECT TO HEARING HAZARD
1.7.1 Introduction Comparison of the results for impulses about 0.3 ms in duration (from rifles, Sec. 5.4) to 3 ms in duration (from blasts in free field, Sec. 6.2) shows that there is no single frequency-weighted sound exposure level that accounts for both sets of data. The maximum single-impulse sound exposure levels (in dB) for a limited number of impulses, Lmax and the equivalent 8-hour levels, Leq8, weighted according to the A-, T- and EqTTS curves (Fig. 6) satisfying the criterion of no more than 5% TTS2 in excess of 25 dB are:
Source Lmax ,A Lmax ,T Lmax,EqTTS Leq8,A Leq8,T Leq8,EqTTS Rifle 116.0 118.3 129.3 80.0 82.3 93.3 Blast 135.0 131.0 ~139.0 98.4 96.4 ~104.4
RTO-TR-017 1 - 27

RISK OF HEARING LOSS FROM EXPOSURE TO IMPULSE SOUNDS
(The EqTTS results for the blasts were estimated; they are not the result of a separate analysis like those in Figs. 17 and 18. The accuracy of the estimate is about 2 dB.)
There is a clear difference between the results for the rifle and the blast. The difference decreases from A-weighting (almost 20 dB) to EqTTS weighting (about 10 dB). Thus, the best correspondence is found for the spectral weighting function putting most emphasis on the high-frequency components of the spectral energy distribution. However, even with EqTTS weighting there still remains a difference of about 10 dB. Moreover, Sec. 5.2 reported quite some high-frequency TTS for sparks at 130 dBEqTTS,SEL in total or Leq8 = 85.4 dBEqTTS. In conclusion: there is no single frequency-weighted energy measure that accounts for TTS from both rifles and blasts.
Sec. 3 already presented data showing that hearing damage may decrease with increasing impulse duration although the energy in the impulse increases. The data concerned PTS in animal experiments and TTS from human exposures. All results strongly suggest that an adequate method of assessment of impulse sounds with respect to hearing damage should include a non-linear mechanism that can account for a reduction in damage when the low-frequency energy increases.
1.7.2 The Non-Linear Method Proposed by Price and Kalb Price and Kalb (1991) proposed a method to evaluate the risk of hearing damage from impulse sound based upon a physiological model. The model originated with animal experiments. Later it was adapted to human physiology of the ear. The model includes a saturating type of non-linear transfer function describing middle ear sound transmission. The saturating type of non-linearity produces compression of the damaging high-frequency components in the presence of stronger, less damaging, low-frequency components. This property may account for the apparent protective effects of the strong low-frequency components in the blast waves, as found above. Hearing protectors add to this effect because they provide less low- than high-frequency attenuation. In this section we shall discuss some general properties of the model of Price and Kalb. The discussion concerns the most recent version of the model supplied by Dan Johnson (11-10-2000) to the members of the S3-72 ANSI impulse noise working group.
In order to gain some insight into the characteristics of the Price and Kalb model we calculated its response to Friedlander waves. Price and Kalb make a distinction between warned and unwarned subjects. When warned, it is assumed that the middle-ear muscles are constricted before the impulse arrives. This affects the transfer. The present calculation is based on the unwarned condition. Moreover, the present calculation is based on free-field wave forms. Fig. 21 shows the result. The output of the model is specified in Auditory Damage Units (ADUs). Fig. 21 shows ADU as a function of A-duration at eight peak levels expressed in Pa (1000 Pa corresponds to 154 dB SPL.) The fine structure in the curves reflects true properties of the model, no calculation errors. The result shows enhanced response at an A-duration of about 1 ms. This corresponds to enhanced sensitivity of the model to impulses with a peak in the spectral energy distribution at about 300 Hz (see Fig. 8). Very importantly, the result shows the required compression. At the same peak level ADU found at 0.3 ms A-duration is larger than at 3 ms. At 1000 Pa the output decreases from 64 to 14 ADUs with this increase in duration, at 100,000 Pa from 1770 to 184 ADUs. Better insight is obtained when comparing the results for different durations in terms of equal response. Impulses with A-duration of 5 ms at 20,000 Pa (180 dB SPL) and with A-duration of 0.3 ms at 1000 Pa (154 dB SPL) both produce about 65 ADUs. This amounts to a compression of 26 dB, more than the 10 to 20 dB required in the previous section. The model might be over-compressive.
1 - 28 RTO-TR-017

RISK OF HEARING LOSS FROM EXPOSURE TO IMPULSE SOUNDS
1
10
100
1000
10000
0.1 1.0 10.0
A-duration in ms
Aud
itory
Dam
age
Uni
ts
100100020005000100002000050000100000
Figure 21: Response of the model of Price and Kalb to Friedlander waves. The legend indicates the peak levels in Pa (1000 Pa = 154 dB SPL).
A more serious shortcoming of the model is found in the level-number trade-off. ADUs add linearly with the number of impulses. For example, 1 impulse at 20,000 Pa and 1 ms duration produces as much ADUs (397) as 10.6 impulses at 1000 Pa and the same duration. Thus, the level-number trade-off becomes (154-180)/log(10.6) = -25 dB per tenfold increase in number. This result contrasts sharply with the very low number found in Secs. 5 and 6. Those sections showed that up to 50 impulses the results could even be described with a constant level (trade-off = 0). This suggests that the model has to be reconsidered with respect to the effect of the number of impulses. The notion of a critical level should be considered. However, this conclusion does not imply that the approach of Price and Kalb (1991) cannot be used. After finding a solution for the number problem it is probably the only way of developing a method for impulse sound assessment that will cover the full range of impulses, from very light to large calibre weapons.
1.7.3 Response of the Price and Kalb Model to the BOP Data In a fashion similar to Sec. 6.2 (Figs. 17 and 18) Fig. 22 presents the percentage excess TTS as a function of exposure level, this time measured in ADUs. The ADUs were calculated for all individual exposures. In consultation with Price the calculation was performed assuming that the subjects in the BOP experiments behaved as warned subjects. In addition, the calculation is based on wave forms measured near the entrance to the ear canal (under the muff). Fig. 22 shows a disappointing result. Whereas the percentage of the population with excess TTS increased monotonically with the charge level in each distance, number-condition (indicated in the legend of Fig. 22) this is not the case for the auditory damage units. Therefore, there is no monotonically increasing relation between % excess TTS and ADU while this was found for the T- and A-weighted sound exposure levels in Figs. 17 and 18. In addition, it should be mentioned that the within-condition variability in ADU was quite large. Whether or not this relates to differences in potential hazard of individual impulses cannot be assessed.
In conclusion: the model of Price and Kalb is promising in that it accounts for a decrease in risk of hearing damage with increasing low-frequency energy in the impulse sounds. However, with respect to its compressive properties and the level-number trade-off function it has to be further developed.
RTO-TR-017 1 - 29

RISK OF HEARING LOSS FROM EXPOSURE TO IMPULSE SOUNDS
1 - 30 RTO-TR-017
-5
0
5
10
15
20
25
30
35
40
20 30 40 50 60 70 80
auditory damage units
% e
xces
s TT
S
1, 6
1, 12
1, 25
1, 50
1, 100
3, 6
3, 12
3, 25
3, 50
3, 100
5, 6
5, 12
5, 25
5, 50
5, 100
Figure 22: Excess TTS as a function of the number of auditory damage units of a single impulse. Damage units calculated according to the model of Price and Kalb (1991). Legend: distance
(1, 3, 5 meter), number of impulses (6, 12, 25, 50, 100). The reversal in auditory damage units with increasing % excess TTS illustrates that the model is overcompressive in the
sense that the number of auditory damage units decreases with increasing exposure level whereas excess TTS increased.
1.7.4 Final Evaluation At present, the best prediction of risk of hearing loss, based upon the TTS criterion of more than 25 dB TTS, 2 minutes after exposure, in no more than 5% of the population exposed, has to be based on sound exposure levels including some frequency weighting.
The limit for rifle noise with A-durations from 0.2 to 0.3 ms is 116 dBA, SEL per impulse for up to 50 impulses. Above 50, one could apply the equal energy principle: Leq8 should not exceed 80 dBA. When one wishes to apply the equal energy principle for 5 and more impulses, the exposure limit will be underestimated by up to 10 dB. For less than 5 impulses one should stay with the maximum level of 116 dBA, SEL per impulse. The results show that weightings of the spectral energy distribution putting more emphasis on the higher frequencies will increase the accuracy of predicting risk of hearing loss. The limits given are valid for the unprotected ear and sound pressure measurements in the free-field condition.
The limit for blasts with A-durations from 0.9 to 3.0 ms is 135 dBA,SEL per impulse for up to 100 impulses. The limits given for blasts are valid for the protected ear and sound pressure measurements under the muff, near the ear canal. There are no data for more than 100 impulses but this will hardly occur in everyday practice. When one wishes to apply the equal energy principle for 6 and more impulses the exposure limit becomes Leq8 = 98 dBA. In that case the exposure limit will be underestimated by at most 12 dB. For less than 6 impulses one should stay with the maximum level of 135 dBA,SEL per impulse. Also for blasts, frequency-dependent weighting putting more emphasis on the energy at the higher frequencies will improve the prediction accuracy. Moreover, it will reduce the difference between the exposure limits for rifles and blasts.
Chapter 2 - AUDITORY HAZARD ASSESSMENT ALGORITHM FOR THE HUMAN EAR (AHAAH) AS OF 2001
G.R. Price
2.1 INTRODUCTION
During the 1960’s the Army’s Human Engineering Laboratory (Maryland, USA) had developed MIL STD-1474 as a design standard for the noise of Army materiel. In the early 1970’s the Army’s Surgeon General adopted it as health hazard criterion (in the absence of an alternative). It was empirically based, and by the early 1980’s it was apparent that it did not assess the hazard from large caliber weapons properly.
Basic research on the mechanisms operative in intense noise exposures had also begun in the 1960s at the Human Engineering Laboratory. By the 1980’s enough work had been done to establish the requirement for and to support the development of a mathematical model of the human ear’s response to intense sound.
2.2 PREMISES IN THE DEVELOPMENT OF THE MODEL
1. The primary site of loss is the Organ of Corti, the first site of injury probably being the tip links in the hair bundles on the outer hair cells.
2. At very high sound pressures (above 130 dB or so, depending on frequency) the loss process becomes fundamentally mechanical in nature and produces damage very rapidly (damage becomes linear in time).
3. The conductive path is itself resistant to changes; however by shaping the flow of energy into the cochlea, it plays a major role in hearing loss. It exerts three types of influence:
A. First, it conducts best in the mid-range of frequencies, attenuating high and low frequencies.
B. Second, the middle ear muscles can contract and attenuate transmission.
C. Third, the annular ligament of the stapes limits middle ear displacements and at very high intensities imposes a peak-clipping non-linearity on the transmission path.
4. Mammalian cochleas are highly similar; hence the loss processes that operate in one species are likely to operate in another.
2.3 RESEARCH STRATEGY
We first sought to establish the loss processes operating at the level of the cochlea. This required noise exposures in experiments with biological ears that produced real losses in hearing. The cat was the animal model for this experimental work, chosen because of its similarity to the human ear as well as the amount that was already known about it.
Because middle ear muscle contractions affect the conductive path; their effects change the energy arriving at the cochlea and confound any effects seen. Anesthetized preparations were used in order to eliminate the confounding influence of middle ear muscle activity.
The conductive path, linear at reasonable intensities (below 130 dB or so), becomes highly non-linear at the intensities found in impulse noise fields around weapons. The basis for this non-linearity is the annular ligament of the stapes, which imposes a limit on displacement of about 20 microns (in cat). By not
RTO-TR-017 2 - 1

AUDITORY HAZARD ASSESSMENT ALGORITHM FOR THE HUMAN EAR (AHAAH) AS OF 2001
allowing displacements of 1000 to 2000 microns (were the middle ear linear at all intensities), the middle ear becomes a peak-clipping device. To focus research on events in the cochlea, exposures need to be chosen to either avoid or to account for this phenomenon.
2.4 A MODEL REQUIRED!
In order to predict the complex interactions of the outer, middle and inner ears just outlined and to provide insight in designing experiments, an electroacoustic model of the ear was developed (Kalb and Price, 1987; Price and Kalb, 1991). The model was developed to be conformal with the structure of the ear. It could have been simpler; but the goal of modeling is insight. A solid theoretical base, coupled with the restraint imposed by the known anatomical structure of the ear, served to keep the model properly formed and focused.
Many elements of the model had already been developed by others and had appeared in the literature. However, no one had put all the elements together or focused on predicting the effect of intense sounds on the ear. When connected, the conductive path matched closely the measured transfer functions for the external and middle ears. Additional elements had to be created to allow the analysis of the effect of intense sounds on the ear. These included modeling changes in the flow of energy in the conductive path at high intensities as well as the algorithm for calculating loss within the cochlea. The loss calculation was carried out at 23 locations evenly spaced along the basilar membrane (roughly 1/3 octave apart). At each location, the upward flexes of the basilar membrane were tracked (upward flex puts the sensitive elements in tension – a common mode for tissue failure), their amplitude in microns was squared and the sum maintained for each location. The units are called Auditory Damage Units (ADUs).
Development of the model proceeded in parallel with the noise exposure experiments. This allowed the experimental data to guide model development as well as allowing the model to suggest critical experiments needed for validation of elements and values in the model.
In this process a dozen different experiments were run. Animals (10 per condition, both ears tested) were anesthetized at the time of the exposure to limit any movement; to eliminate middle ear muscle activity and to permit brain-stem evoked response audiometry just before and just after the exposures. The noise sources were primers, the M-16 rifle in a variety of configurations and airbag deployments. The impulses ranged in pressure from 135 dB to 171 dB peak and from 1 to 50 impulses. In the end, the correlation between the model’s output and hearing loss measured immediately (about ½ hour post-exposure) had a correlation coefficient of 0.94. This high correlation between the model’s prediction and hearing loss led us to conclude that most of the variance was explained and the model was ready for transmogrification into human form. The equation for loss is:
CTS = (26.6 * LN ADUs) –140.1,
where CTS = Threshold shift ½ hour post-exposure in dB, and ADUs = Auditory damage units.
2.5 CREATION OF THE HUMAN MODEL
Because of the similarity of mammalian ears, the same calculational structure that had worked for the cat was changed into human “form” by selection of appropriate values for the structures of the ear. These values were coefficients in the equations and by selecting one set or the other, the model could be cat or human.
The values for the conductive paths of both the cat and human are reasonably well understood; however for obvious reasons there are essentially no data on the patterns of activity on the human basilar membrane in a live cochlea. Therefore, as a reasonable first estimate, the stapes displacement to basilar membrane
2 - 2 RTO-TR-017

AUDITORY HAZARD ASSESSMENT ALGORITHM FOR THE HUMAN EAR (AHAAH) AS OF 2001
displacement ratio was set the same for the mid-range human cochlea as it was for the mid-range cat cochlea. The design was “fixed” in 1997 with the understanding that as human data were tested, the model could be updated to correct any anomalies. Thus far, correspondence between the hearing loss data and the model’s predictions has been quite good; therefore the model has stayed in its original form.
2.6 VALIDATION OF THE HUMAN MODEL
The model’s values had been adjusted to create a proper conductive path, with the correct impedance for the human ear. And as noted earlier, the stapes displacement-to-basilar membrane displacement ratio had been set to the same value as for the cat in the mid-range of their respective audiograms. The same equation of loss (relating ADUs to threshold shift) was used for the human cochlea as for the cat cochlea. Up to this point, no human hearing loss data had been used in setting any values in the model.
2.6.1 Human Data – Protected Hearing As part of meeting the need for an improved DRC for noise, the Army Medical R&D Command had conducted an extensive series of studies with human volunteers, under a contract with EG&G, known as “The Albuquerque Studies”. In this work, groups of 60 subjects were exposed to impulses intended to simulate weapons impulses in the open and in one case, in a reverberant environment. On the test ear they wore an earmuff (in one series of exposures) or an earmuff that had eight holes in its seal. Peak pressures in the free field went from the upper 170 dBs to about 195 dB. In all, some 53 conditions were tested. This data set is the largest and most completely documented in existence for such exposures, especially since it included waveforms measured in the free field and under the muff(s).
The goal of the US Army’s program is to establish a DRC that will avoid threshold shifts 25 dB or greater (measured just after the exposure) in response to intense impulses in 95% of the exposed population. The presumption is that threshold shifts of 25 dB or less should result in minimal permanent threshold shift. Therefore the model was set to predict threshold shift for the 95%ile subject and the Albuquerque waveforms were run through the model.
A statistical argument had been developed (Johnson et al., 1990; Patterson and Johnson, 1994) that in a sample size of 60, one can be roughly 95% confident that the true 95%ile subject lies between the exposures in which one and six subjects show a significant threshold shift. Alternatively put, when the largest threshold shift does not exceed 25 dB, we can be 95% confident that the 95%ile subject will also not show a threshold shift greater than 25 dB. Likewise, when more than six ears show a threshold shift of 25 or more dB, we can be 95% confident that the 95%ile threshold shift also exceeds 25 dB. This rule was applied in determining when a particular exposure was officially “just hazardous”. Namely, at least one but not more than six subjects had experienced a significant threshold shift at that exposure.
When all the Albuquerque data had been run through the model, in all but two cases its output and the data agreed on the 95%ile outcome. In the two cases in which there was a disagreement, the model over-predicted the hazard (was conservative)(loss for 50 and 100 impulses in the fully protected 5M condition). In contrast, MIL STD-1474, the current DRC, predicted correctly in 20 instances and over-predicted hazard in the remaining 33 instances. A prediction based on A-weighted energy predicted correctly in 13 instances and over-predicted hazard in the remaining 40 instances.
2.6.2 Human Data – Unprotected Hearing There are several reasons that there is little usable data from recent studies using human exposures with unprotected hearing. Given the fact that weapon impulses can and do produce permanent losses in hearing, there has been essentially no experimental work with unprotected human ears since the 1960’s.
RTO-TR-017 2 - 3

AUDITORY HAZARD ASSESSMENT ALGORITHM FOR THE HUMAN EAR (AHAAH) AS OF 2001
2 - 4 RTO-TR-017
In addition, the model needs a digitized waveform to process and there are few recorded pressure histories from that era. Furthermore, older studies generally ran too few subjects to permit characterization of the 95%ile response.
However, a few analytical possibilities do exist. Work with impulse noise exposures at the Human Engineering Laboratory using rifle and rocket impulses and three different exposures conducted by the German Army with rifle impulses provided enough data to allow at least a tentative comparison with the model. One study by the US Army Medical Research Laboratory using spark-gap discharges also provided data that are indicative.
In the experiments with unprotected hearing, AHAAH was correct in its predictions (more than a dozen additional tests). An A-weighted energy measure under-predicted the hazard for two of the rifle impulses.
2.7 ACCEPTANCE AND POTENTIAL USE OF THE MODEL
The analyses just cited show that AHAAH has been correct in 96% of the tests with protected hearing and 97% of the instances for all tests. MIL STD-1474 has been correct 38% of the time (protected hearing only) and A-weighted energy has been correct 24% of the time for protected hearing and 30% of the time for all tests analyzed.
A significant part of the development of the model has been the investment in making it user-friendly. In its present form it runs on a PC in essentially real-time and operates in WINDOWS. Algorithms have been included for importing, editing and analyzing waveforms. The only requirement is that the waveforms be written in ASCII, a common format used around the world.
AHAAH is gaining acceptance as a noise analysis method outside the Army. The model has been presented to the automotive industry in this country and Europe (Germany) and the Society of Automotive Engineers Committee on Inflatable Restraints is using it in the evaluation of airbag design and safety. Two research programs within the National Institute of Occupation Safety and Health (NIOSH) are using the AHAAH model as a basis for research in impulse noise in mines and in industrial settings. And a draft ANSI standard for evaluating impulse noise hazard includes the model for use.
In January, 2001, a panel of experts assembled by the American Institute of Biological Sciences on behalf of the US Army Medical Research and Materiel Command (USAMRMC) reviewed the model as a potential basis for replacing the Army’s current DRC for impulse noise. They were specifically tasked to ascertain whether or not AHAAH was presently suitable for use as a DRC for impulse noise within the Army. They concluded that it was. As a result, the US Army Center for Hearing Protection and Preventive Medicine (USACHPPM) is currently preparing AHAAH for presentation to the Surgeon General for use as a DRC as well as a weapons design criterion for the US Army.

Chapter 3 - PERFORMANCE OF HEARING PROTECTORS IN IMPULSE NOISE
3.1 ANALYSIS OF THE BOP DATA
Three experimenters in the BOP project served as test subjects measuring hearing protector attenuation. This was done at the three distances, most charge levels, the two ears (the modified muff on the right ear and the unmodified muff on the left one) and as a function of the angle of incidence.
For the unmodified muff, analysis of variance of the attenuation data averaged across all frequencies showed no significant interaction between distance and charge level and no overall charge level effect. With high level impulse noise one should take into account that the attenuation might change with impulse level. In this case the analysis of variance showed little effect. Some effect is found when attenuation is considered as a function of frequency. Fig. 23 shows that at frequencies above about 500 Hz attenuation decreases somewhat at charge level 6. In view of the incomplete data set Fig.23 presents data averaged over the distances 1 and 3m only. Moreover, in view of the limited data set, the curves in Fig. 23 have to be limited to normal incidence, the sound source in front of the ear.
For the modified muff there also is no statistically significant interaction between distance and charge level and no overall charge level effect. Fig. 24 shows the attenuation as a function of frequency at four charge levels averaged over the three distances. Fig. 24 illustrates that there is no effect of charge level. Thus, the attenuation may be considered to be constant over all exposure conditions. Again the data are limited to normal incidence.
Fig. 13 showed quite a difference between the attenuation calculated from the impulse exposures and the attenuation measured in low-level random-incidence noise. Since there is hardly any level effect in the impulse data we cannot conclude from those data that the difference between the two methods of measurement is due to a level effect. However, it cannot be excluded either that the type of noise and the difference in sound pressure levels account for this difference.
While there is only a small level effect of charge level there is a significant effect of angle of incidence. Figs. 25 and 26 show the attenuation as a function of frequency at several angles of incidence for the unmodified and modified muff, respectively. The curves represent the results at charge levels of 3 for the distances of 1 and 3m and at charge level 4 for 5m. 90 degrees corresponds for both types of muffs to normal incidence. The difference between, for example, 90 and 270 degrees illustrates the effect of head shadow. Figs. 25 and 26 show a much larger effect of angle of incidence for the modified than for the unmodified muff.
RTO-TR-017 3 - 1

PERFORMANCE OF HEARING PROTECTORS IN IMPULSE NOISE
unmodified muff
0
5
10
15
20
25
30
35
40
45
12 20 31 50 80 125
200
315
500
800
1250
2000
3150
5000
8000
1250
0
2000
0
1/3-octave band in Hz
atte
nuat
ion
in d
B
2456
Figure 23: Attenuation of the unmodified muff per 1/3-octave band at four charge levels given in the legend. Sound source in front of the ear. Measurements at 1 and 3m in the BOP project.
modified muff
-5
0
5
10
15
20
25
30
35
40
12 20 31 50 80 125
200
315
500
800
1250
2000
3150
5000
8000
1250
0
2000
0
1/3-octave band in Hz
atte
nuat
ion
in d
B
2456
Figure 24: Attenuation of the modified muff per 1/3-octave band at four charge levels given in the legend. Sound source in front of the ear. Measurements at 1, 3, and 5m in the BOP project.
3 - 2 RTO-TR-017

PERFORMANCE OF HEARING PROTECTORS IN IMPULSE NOISE
unmodif ied muff
0
5
10
15
20
25
30
35
40
45
12 20 31 50 80 125
200
315
500
800
1250
2000
3150
5000
8000
1250
0
2000
0
1/3-0ctave band in Hz
atte
nuat
ion
in d
B0
4590
135
180225
270315
Figure 25: Attenuation of the unmodified muff per 1/3-octave band at angles of incidence given in the legend. 90 degrees corresponds to the sound source in front of the ear measured. Measurements at 1 and 3m for charge level 3, at 5m for charge level 4 in the BOP project.
modified muff
-5
0
5
10
15
20
25
30
35
40
12 20 31 50 80 125
200
315
500
800
1250
2000
3150
5000
8000
1250
0
2000
0
1/3-octave band in Hz
atte
nuat
ion
in d
B
045
90135
180225270
315
Figure 26: Attenuation of the modified muff per 1/3-octave band at angles of incidence given in the legend. 90 degrees corresponds to the sound source in front of the ear measured.
Measurements at 1 and 3m for charge level 3, at 5m for charge level 4 in the BOP project.
RTO-TR-017 3 - 3

PERFORMANCE OF HEARING PROTECTORS IN IMPULSE NOISE
3 - 4 RTO-TR-017
The results suggest that the attenuation should be measured at about 45 degrees. This gives the lowest attenuation. Moreover, it is likely to be the angle of incidence in everyday practice when one is inclined to turn away from the weapon but at the same time watch what happens near the weapon. However, angles between 0 and 90 degrees will yield results close to those for 45 degrees. There is no need to change current protocols based on 0 or 90 degrees.
Inspection of the Fig. 13 shows that the differences between the attenuation found for the impulse measurements and the random noise (the PEAT data, Sec. 6.1) cannot be explained by the angle of incidence. Below 1000 Hz there is little effect of the angle of incidence whereas there are large differences in Fig. 13. Moreover, the impulse data are presented for normal incidence. Since this angle of incidence yields the smallest attenuation figures the random-incidence attenuation data should be close to the impulse data. Also, the small attenuation found for random-incidence noise above 5000 Hz cannot be explained by the angle of incidence. In addition to effects of the type of sound and angle of incidence there was a difference in the placement of the pressure transducer in the unprotected condition: for impulse noise in free field, for the random noise at the ear. Pressure build-up at the ear may increase the sound level at the high frequencies by at most about 5 dB. This will yield attenuation values at the high frequencies 5 dB higher for the random noise condition than for the impulse measurements. The differences in the 3000 Hz region in Fig 13. may be due to this difference in placement of the pressure transducer.
3.2 RECOMMENDATION FOR ASSESSING HEARING PROTECTION
In view of the possible level-dependent behaviour of hearing protectors and safety considerations one should measure the attenuation of hearing protectors using acoustic head simulators. However, care must be taken when using head simulators, as they can give results that are not representative of a real head. The measurements should be performed at the location of the simulated tympanic membrane in order to be able to include ear plugs. The preferred angle of incidence is 45 degrees.
More information on hearing protection performance can be found in Chapter 3 “Performance of hearing protectors in impulse noise”, by K. Buck, in report RTO-ENP-011 (RTO Lecture Series 219, 2000).

Chapter 4 - COST-EFFECTIVENESS OF HEARING CONSERVATION PROGRAMS
A.L. Dancer
4.1 READINESS BENEFITS OF HEARING CONSERVATION PROGRAMS
Because the increasing demand for weapon systems with greater speed, range and firepower, a soldier’s ability to hear can be assaulted and damaged even before the completion of basic training.
On today’s high-technology battlefield, good hearing is an essential attribute of an effective soldier. Preserving a soldier’s ability to hear low-intensity sounds or speech is critical to readiness and soldier survivability. Veterans of conflict value hearing as a 360 degree warning sense. Laboratory data are now available to buttress the value of good hearing (Price et al., 1989; Garinther and Peters, 1990).
Military audiologists who serve as hearing conservation officers in the US forces are trained to market hearing conservation measures as combat multipliers and as integral to the mission. For example, the proper use of hearing protection on firing ranges will not only protect hearing, it will also enhance firing accuracy by reducing flinching when weapons are fired. In combat, hearing protection can and should also be worn by artillery, armor and aviation personnel. The reduced hearing sensitivity can be immediately restored by removing the protector. In contrast, recovery from temporary hearing loss which results from the action of hazardous noise on the unprotected car, requires many hours before recovery of normal hearing sensitivity, providing that permanent damage has not been incurred.
4.2 MONETARY BENEFITS OF HEARING CONSERVATION PROGRAMS
In addition to a crucial role in soldier readiness and soldier survivability, there are also monetary benefits to be derived from effective conservation programs. Substantial reductions in hearing loss among US Army combat arms personnel can be translated into reduced training costs and reduced hearing loss disability.
In 1974, Walden et al. conducted a landmark study designed to determine the prevalence of hearing loss within US Army infantry, armor and artillery enlisted branches that are at high risk for noise exposure (Walden et al., 1975). On two occasions since, the Walden study was revisited (Ohlin et al., 1994; Ohlin, 1995). In 1989 and 1994, soldiers were evaluated through an Army-wide automated surveillance system (HEARS). The most significant findings were a 19 and 24 percent increase respectively in H-1 profiles (indicators of acceptable hearing).1 Accordingly, there were corresponding reductions in H-2 and H-3 or worse hearing profiles. A hearing loss profile of H-3 or worse could be sufficient cause to remove a soldier from a Military Occupational Specialism or an Area of Concentration involving routine exposure to hazardous noise. They could even be vulnerable to an early discharge from the service. Depending on their experience and rank, a significant investment in their training could be lost. On the other hand, hearing loss prevented could translate into training costs saved because of the possibility that a soldier could be retained in the Army in a Military Occupational Specialism without hazardous noise exposure, basic training costs were not included in these cost savings estimates).
1 H-1 Army Hearing Profile. Audiometric average level in each ear not more than 25 dB at 500, 1000, and 2000 Hz, with not
individual frequency greater than 30 dB. Not over 45 dB at 4000 Hz. Military hearing profiles are determined from audiometric test results of pure tone hearing thresholds.
RTO-TR-017 4 - 1

COST-EFFECTIVENESS OF HEARING CONSERVATION PROGRAMS
4 - 2 RTO-TR-017
The projected training costs saved (1974 - 1994) from reduced hearing loss in enlisted combat arms personnel are: cases of hearing loss prevented: 10, 821; savings: $ 504, 000, 000. The reduced prevalence of H-3 hearing profile reported above is consistent with a 13.6 percent decrease in primary hearing loss disability cases for Army veterans since 1996. Monetary expenditures are reported by primary disability, which is defined as the sole disability or the highest percentage disability in instance of multiple disabilities. In 1997 the total expenditures for all veterans having hearing loss as a primary disability only was $ 271,601,856 in the US forces (in 1997, the Army accounted for 61 percent: 35,237 of the total primary cases: 57,993).
In France, the annual cost of the compensations for Noise-Induced-Hearing-Loss is evaluated to $ 60,000,000. In Belgium, about two thirds of the $ 6,000,000 paid yearly to the veterans for all kinds of disabilities correspond to Noise-Induced-Hearing-Loss. It must be noted that, besides the USA for which the compensation costs are precisely known, the figures from the other NATO countries are presently either roughly estimated or totally unknown. This lack of data is very regrettable as it has been shown in different countries that the acoustic trauma represents the first cause of morbidity in the military during peace time.
If the US Army’s percentage of change in the number of primary cases had increased the same as before the implementation of the Hearing Conservation Program, the “additional” costs for the veterans would have been $ 220,000,000 from 1987 to 1997! Moreover, in some countries (France, Germany ...) all soldiers suffering acute acoustic trauma receive a medical treatment at the hospital instead of being only withdrawn from hazardous noise exposure). In France, for the three years 1993, 1994 and 1995, 1,796 soldiers have been treated in the ENT departments of the military hospitals (total number of days of hospitalization: 7,974). In 1996, 966 cases of acoustic trauma have been reported and treated at a medical cost of $ 4,000,000. In Germany, the cost of those treatments is $ 2,500,000 a year.
4.3 CONCLUSIONS
Although elimination or reduction of the hazard is the most desirable option, it is often not technically or economically feasible to engineer weapon noise down to safe levels. Therefore, more pragmatic strategies have to be used to prevent hearing loss. In the US Army and Air Force, the use of hearing protection is enforced regardless of duration of exposure when noise hazardous thresholds are reached. Sufficient numbers of military audiologists have also facilitated an increased capability for monitoring audiometry and health education. In addition, the US Army and Air Force has had a mainframe database of audiometric records for the last 15 years. Through these corporate databases, the US Army and Air Force have been able to report measures of program participation, quality insurance and program effectiveness. The bottom line for value added, though, may not reside in cost benefit analyses of over $ 800,000,000. No matter how substantial, such monetary projections do not reflect the more important factors of soldier readiness, decreased job performance and the loss in the quality of life associated with Noise-Induced-Hearing-Loss.
Given the operational, monetary and human benefits which are afforded by Hearing Conservation Programs, the experts of the NATO Research Study Group 29 strongly recommend the enforcement of such programs in the various NATO countries.
More information on cost effectiveness can be found in Chapter 6 “Cost effectiveness of hearing conservation programs”, by D. Ohlin, in report RTO-ENP-011 (RTO Lecture Series 219, 2000).

Chapter 5 - NEW PERSPECTIVES IN TREATMENT OF ACUTE NOISE TRAUMA
A.L. Dancer
5.1 INTRODUCTION
In some countries (France, Germany...) all soldiers suffering from acute acoustic trauma receive a medical treatment at the hospital. In France, for the three years 1993, 1994 and 1995, 1,796 soldiers have been treated in the ENT departments of the military hospitals (total number of days of hospitalization: 7,974). In 1996, 966 cases of acoustic trauma have been reported and treated at a medical cost of 4 million dollar.
In Germany, the cost of those treatments is 2.5 million dollar a year. In other countries (United Kingdom, USA...), the soldiers in the same situation are not treated (they are only withdrawn from hazardous noise exposure).
However, the acoustic trauma is responsible for many expenses:
•
•
•
•
•
•
•
In all countries, the soldiers are temporarily retired from active service after they suffer an acoustic trauma. Then, if they retain large permanent hearing losses they can be definitively withdrawn from front line service. For specialized personnel large formation and training expenses may be definitively wasted,
In the past 50 years or so, many acoustic traumas went untreated (moreover, the actual efficiency of the treatments, when directed, is a matter of controversy: delays of implementation, effectiveness of the treatments themselves...). Therefore, in all countries huge compensations are paid each year to the veterans for hearing loss as a primary disability. In the USA, 271.6 million dollars have been distributed in 1997 to 57,993 veterans. In France, the annual cost of the compensations for Noise-Induced-Hearing-Loss (NIHL) is evaluated to 60 million dollar. In Belgium, about two thirds of the 6 million dollar paid yearly to the veterans for all kinds of disabilities correspond to NIHL! It must be noted that, besides the USA for which the NIHL compensation costs are precisely known, the figures from the other NATO countries are presently either rough estimates or totally unknown. This lack of data is very regrettable as it has been shown in different countries that acoustic trauma represents the first cause of morbidity in the military during peace time!
Considering:
the important consequences of NIHL for the health of the soldiers,
the cost of the medical treatments of the acoustic trauma (in some countries),
the huge operational and compensation costs induced by NIHL (in all countries),
it is necessary to study thoroughly the actual efficiency of the present medical treatments of the acoustic trauma and to evaluate the interest of new treatments.
5.2 ANIMAL STUDY
The aims of the study are the following:
to know whether the present medical treatments of the acoustic trauma are relevant and must continue to be prescribed (for example in France and in Germany),
to advice, or to not advice, to use similar treatments in the other NATO countries,
RTO-TR-017 5 - 1

NEW PERSPECTIVES IN TREATMENT OF ACUTE NOISE TRAUMA
•
•
•
•
•
•
•
to determine the most efficient treatment (if any),
to look for new treatments.
The study was initiated at the French-German Research Institute of Saint-Louis. It is performed in close co-operation with the ENT departments of the French and German military hospitals and with some public research establishments (INSERM in France, universities in Germany and in the USA).
Given the difficulties to assess the actual efficiency of the medical treatments of the acoustic trauma in man (ignorance of the pre-exposure hearing condition, ignorance of the noise exposure parameters, use of different treatments, various implementation delays of those treatments, difficulties to differentiate between the normal physiological recovery and the medical assisted recovery, impossibility to perform morphological observations of the sensory organ, ethical problems prohibiting the use of control groups...), it was decided to use animal experimentation. It is worthwhile to stress that animal experimentation allows to study, on a statistical basis, the functional and the morphological aspects of hearing recovery (and hence the efficiency of such or such treatment) on treated and on untreated groups of animals (controls).
Guinea pigs are exposed to well-controlled noise exposures (impulse noises are of special interest because they are representative of the largest exposure hazards in the military environment). Threshold Shifts (TS) are measured by electrocochleographic (ECoG) and distortion products (DPOAE) measurements and recovery is followed up to 14 days. Then, morphological observations of the inner ear are made by scanning electron microscopy (SEM).
5.3 RESULTS
The first results indicate that:
In some animals the TS recovery (ECoG measurements) can be complete despite the fact that significant areas of haircells are damaged (SEM observations). Therefore it is possible that, in man, some subjects may have undetected lesions of the sensory cells (in spite of an apparent complete functional recovery as assessed by behavioural audiometry). These lesions could make them more sensitive in case of further noise exposures and more susceptible to presbyacusis,
Some treatments (i.e., corticoid therapy applied 1 hour after the end of the exposure to noise) speed up the recovery and correspond to lower threshold shifts and smaller morphologic damages at 14 days,
Combined treatments: corticoid therapy and hyperbaric oxygen therapy also improve the recovery. However, hyperbaric oxygen therapy alone worsens the recovery.
A lot remains to be done to investigate the interest of other drugs (magnesium, vasodilatators...), the influence of the delay of implementation of the treatments, etc.
Moreover, experiments are in progress:
to assess the interest of local treatments (i.e., the medicaments are applied directly to the inner ear), compared to systemic treatments (i.e., the medicaments are given by perfusion to the whole body),
to evaluate the interest of new treatments which take advantage of the last advances in molecular biology (anti-oxidants, neurotransmitters agonists or antagonists, growth factors...).
5 - 2 RTO-TR-017

NEW PERSPECTIVES IN TREATMENT OF ACUTE NOISE TRAUMA
The experts of the NATO Research Study Group #29 are unanimous to stress the importance of this study which should benefit to many NATO soldiers and help to cut training costs and compensation expenses. They recommend that that(those) study(ies) profit by a strong scientific and financial support from each NATO country.
More information on medical treatment can be found in Chapter 5 “Individual susceptibility to NIHL and new perspective in treatment of acute noise trauma”, by A.L. Dancer, in report RTO-ENP-011 (RTO Lecture Series 219, 2000).
RTO-TR-017 5 - 3

NEW PERSPECTIVES IN TREATMENT OF ACUTE NOISE TRAUMA
5 - 4 RTO-TR-017
This page has been deliberately left blank
Page intentionnellement blanche

Appendix I - BIBLIOGRAPHY
BOP (1997). Blast overpressure measured under earmuffs, Pressure-time signatures and ACCESS data base, Review copy 4 of 6, 10 March 1997, United States Army Aeromedical Research Laboratory, Fort Rucker. Alabama, CDROM.
Brinkmann H (2000). Supplementary investigation of the German Damage Risk Criterion with the Belgian NATO small arms rifle FNC, in: Report from NATO Research Study Group 29, Panel 8, AC/243, Ch. 4.
CHABA (1968). Proposed damage-risk criterion for impulse noise (gunfire), W. Dixon Ward Ed., Report of the National Academy of Sciences – National Research Council, Committee on Hearing, Bioacoustics, and Biomechanics, Working Group 57.
Chan PhC, Ho KH, Kan KK, Stuhmiller JH (1999). Evaluation of impulse noise criteria using human volunteer data, Jaycor Technical Report J299729-99-104, Jaycor, San Diego, USA.
Chan PhC, Ho KH, Kan KK, Stuhmiller JH, Mayorga, MA (2001). Evaluation of impulse noise criteria using human volunteer data, J Acoust. Soc. Am. 110, 1967-1975.
Coles RRA, Garinther GR, Hodge, DC, Rice CG. (1967). Criteria for assessing hearing damage risk from impulse-noise exposure, Technical Memorandum 13-67, Human Engineering Laboratories, Aberdeen Proving Ground, Maryland, USA.
Dancer A, Vassout, P, Lenoir M (1985). Influence du niveau de crête et de la durée d’ondes de choc (bruits d’armes) sur l’audition du cobaye, Acustica 59, 21-29.
Dancer A, Grateau P, Cabanis A, Lejau J, Lafont D (1991). Influence of the spacing of impulse noises (weapon noise) on the amplitude of the TTSs in man, J. Acoustique 4, 421-434.
Dancer A, Grateau P, Cabanis A, Vaillant, T. Lafont D (1991). Delayed temporary threshold shift induced by impulse noises (weapon noises) in men, Audiology 30, 345-356.
Dancer A, Franke R (1994). Hearing hazard from impulse noise: a comparative study of two classical criteria for weapon noises (the Pfander criterion and the Smoorenburg criterion) and the LAeq8 method, Report 507/94, Institut Franco-Allemand de Recherches de Saint-Louis, Saint Louis, France.
Garinther GR, Peters LJ (1990) Impact of communications on armor crew performance, Army Research, Development & Acquisition Bulletin, Jan-Feb, 1-5.
ISO 1999 (1990). Acoustics – Determination of occupational noise exposure and estimation of noise-induced hearing impairment.
Johnson DL (1990). Direct determination of occupational exposure limits for free-field impulse noise, EG&G Report, Volumes I, II, and III.
Johnson DL (1994). Blast overpressure studies with animals and men: a walk-up study, USAARL Report No. 94-2, US Army Aeromedical Research laboratory, Fort Rucker, Alabama, USA.
Johnson DL (1998). Blast overpressure studies, USAARL Contract Report No. CR-98-03, US Army Aeromedical Research laboratory, Fort Rucker, Alabama, USA.
RTO-TR-017 AI - 1

APPENDIX I - BIBLIOGRAPHY
Johnson DL, Patterson JD, Nelson WR, Ripple G, Mundie TG, Christensen WI, Bova CM (1990). Direct determination of occupational exposure limits for freefield impulse noise, Vol. III of III Appendices, Protocol for Study, US Army Med R&D Command.
Kalb JT, Price GR (1987). Mathematical model of the ear’s response to weapons impulses. In: Proceedings of the Third Conference on Weapon Launch Noise Blast Overpressure, U.S. Army Ballistics Research Lab, Aberdeen Proving Ground, MD 21005-5001.
Kryter KD (1963). Exposure to steady-state noise and impairment of hearing, J. Acoust. Soc. Am. 35, 1515-1525.
Kryter KD, Ward DW, Miller JD, Eldredge, DH (1966). Hazardous exposure to intermittent and steady-state noise, J Acoust Soc Am 39, 451-464.
Loeb M and Fletcher, JL (1968). Impulse duration and temporary threshold shift, J Acoust Soc Am 44, 1524-1528.
MIL-STD-1474D (1997). US Department of Defense Design Criteria Standard, Noise Limits, AMSC A7245.
Ohlin D (1995). US Army Hearing conservation program yields cost avoidance from reduced veterans hearing loss disability, USACHPPM Today, Vol. 2, no. 2.
Ohlin D, Aspinall KB, Monk WH (1994). Healing conservation in the US Army, The Journal of the US Army Medical Department, Fall 1994, 38-42.
Parmentier G, Dancer A, Kronenberger G, Evrard G (1995). Evaluation of hearing protectors ‘EAR’ by high-level impulse noise, Report 503/95, Institut Franco-Allemand de Recherches de Saint-Louis, Saint Louis, France.
Patterson JH, Mozo BT, Gordon E, Canales, JR, Johnson, DL (1997). Pressure measured under earmuffs worn by human volunteers during exposure to freefield blast overpressures, US Army Aeromedical Research Laboratory, Fort Rucker, Alabama, Report No. 98-01.
Pfander F. (1972). Ist da vorläufige Grenzpegeldiagramm zur Hörschädenvermeidung bei Knall- und Lärmbelastungen mit den Ergebnissen der bisherigen Reihenuntersuchungen in Einklang zu bringen?, HNO 20, 61-63.
Pfander F, in collaboration with Bongartz H, Brinkmann H, (1975). Das Knalltrauma, Springer Verlag, Berlin.
Pfander F, Bongartz H, Brinkmann H, Kietz H (1980). Danger of auditory impairment from impulse noise: A comparative study of the CHABA damage-risk criteria and those of the Federal Republic of Germany, J. Acoust. Soc. Am. 67, 628-633.
Phillips YY, Patterson J, Holland M, Steger J (1986). Direct determination of exposure limits for intense freefield impulse noise, US Army medical research and Development Command.
Plomp R, Gravendeel, DW, Mimpen AM (1963). Relation of hearing loss to noise spectrum, J Acoust Soc Am 35, 1234-1240.
Plomp R (1967). Hearing loss induced by small arms, Int. Audiology 6, 31-36.
AI - 2 RTO-TR-017

APPENDIX I - BIBLIOGRAPHY
Price GR (1983). Relative hazard of weapons impulses, J Acoust Soc Am 73, 556-566.
Price GR, Kim HN, Lim DJ, Dunn D (1989). Hazard from weapons impulses: Histological and electrophysiological evidence, J Acoust Soc Am 85, 1245-1254.
Price CR, Kalb J, Garinther GR (1989). Toward a measure of auditory handicap in the army, Annals of Otology, Rhinology and Laryngology 98, 42-52.
Price R, Kalb JT (1991). Insights into hazard from intense impulses from a mathematical model of the ear, J Acoust Soc Am 90, 219-227.
RSG.6 (1987). Effects of impulse noise, Report of NATO AC/243(Panel 8/ RSG.6) D/9.
RTO Lecture Series 219 (2000). Damage Risk from Impulse Noise, RTO-ENP-011, AC/323(HFM)TP/31, Neuilly-sur-Seine Cedex, France.
Sivian LJ and White SD (1933). On minimum audible sound fields, J Acoust Soc Am 4, 288-321.
Smoorenburg GF (1982). Damage risk criteria for impulse noise, in: New Perspectives on Noise-Induced Hearing Loss, RP Hamernik, DH Henderson, R Salvi Eds., Raven Press, New York, 471-490.
Smoorenburg GF (1992). Damage risk for low-frequency impulse noise: the spectral factor in noise-induced hearing loss, in: Noise-Induced Hearing Loss, AL Dancer, D Henderson, RJ Salvi, RP Hamernik Eds., Mosby Year Book, St Louis, 313-324.
Smoorenburg GF (2000). Report from NATO Research Study Group RSG.29 (Panel 8 – AC/243), TNO-Report TM-00-I008, TNO Human Factors, Soesterberg, The Netherlands.
Walden BE, Prosek RA, Worthington DW (1975). The prevalence of hearing loss within selected US Army branches, US Army Medical Research and Development Command (Interagency IOA 4745).
RTO-TR-017 AI - 3

APPENDIX I - BIBLIOGRAPHY
AI - 4 RTO-TR-017
This page has been deliberately left blank
Page intentionnellement blanche

Appendix II - PROGRAMS AND SUMMARIES OF RSG MEETINGS
A. PROGRAMME OF THE 1997 RSG 29 MEETING
Location: Centre for Human Sciences, DERA, Farnborough, UK
Date: June 24 - 26, 1997
Welcome by Dr. Ian Gibson Technical director of the Centre for Human Sciences, DERA, Farnborough
Visit to Facilities of the Centre for Human Sciences
CONTRIBUTIONS: ( * denotes abstract attached )
I. Auditory Dose-Effect Relations 1*. Monitoring noise susceptibility in subjects with a vulnerable cochlea – sensitivity of evoked
otoacoustic emissions and subjective audiometric tests W. Hemmert, P.K. Plinkert, K. Just and H.P. Zenner
2*. Epidemiology of airbag noise hazard G.R. Price
3*. The effects of impulse noise on gunners; a model for a prospective study H. Axelsson, T. Kjellström and A. Sunesson
4*. Supplementary investigation of the German Damage Risk Criterion with the Belgian NATO small arms rifle FNC H. Brinkmann
5*. Noise exposure of soldiers in a battle field environment H. Brinkmann
6*. Development of a model allowing flexible adjustment of Pfander’s borderline diagram when required A.M. Clark and H. Brinkmann
II. Clinical Aspects of Acute Trauma 7*. ‘Thoracic rig’ simulating the response of the pig lung to blast
G. Cooper and A. Sedman
8*. Efficiency of the present medical treatments of acoustic trauma A. Dancer
9*. Treatment of acute acoustic trauma in the German Armed Forces M. Kersebaum
10*. Acute acoustic trauma; a view at the costs over the period 1979 - 1994 M. Kersebaum
RTO-TR-017 AII - 1

APPENDIX II - PROGRAMS AND SUMMARIES OF RSG MEETINGS
III. Models of Auditory Trauma 11*. Intracochlear pressure measurements with impulse noise
A. Dancer
12*. Progress in the development and validation of the human hazard model G.R. Price and J.T. Kalb
13. Adjusting the human hazard model for angle of incidence J.T. Kalb and G.R. Price
14*. Evaluation of impulse noise criteria using human volunteer data P.C. Chan, K.H. Ho, J.H. Stuhmiller and M.A. Mayorga
15*. Application of the ARL ear model to M109 exposure with ANR: Artillery headsets and impulse noise B.W. Anderson
16*. T-weighting or A-weighting, what to use for the evaluation of exposure limits K. Buck, A. Dancer and G. Parmentier
IV. Hearing Protection 17*. Pressures measured under earmuffs worn by human volunteers during exposure to freefield blast
overpressure J.H. Patterson, B.T. Mozo, E. Gordon, J.R. Canales and D.L. Johnson
18*. Active noise reduction and high-frequency attenuation R.B. Crabtree
19*. Last developments in the nonlinear perforated ear plugs A. Dancer
20. Report from CEN TC159 on the standardisation of assessment of level dependent hearing protectors
P.D. Wheeler
21*. Effects of head protection and hearing protection on military performance M.R. Forrest
22*. Double hearing protection and speech intelligibility in armoured vehicles K. Buck, G. Parmentier, A. Dancer, E. K’Vella and L. Pellieux
23*. Adapting the STI for the use in very noisy environments K. Buck, A. Dancer and T. Wessling
V. Discussion 24* General discussion of the topics presented and first lay-out of RSG 29 report
G.F. Smoorenburg
AII - 2 RTO-TR-017

APPENDIX II - PROGRAMS AND SUMMARIES OF RSG MEETINGS
ABSTRACTS
1. Monitoring noise susceptibility in subjects with a vulnerable cochlea - sensitivity of evoked otoacoustic emissions and subjective audiometric tests W. Hemmert, P.K. Plinkert, K. Just and H.P. Zenner Department of Otolaryngology, University of Tübingen, Germany
Aim In our study, we focused on the question, which audiological method is most sensitive to identify increased noise susceptibility (a vulnerable cochlea). Temporary impairment of cochlear function after sub-risky acoustic stimulation was monitored with several audiometric methods.
Methods We tested 20 normally hearing subjects (control group) and 26 TTS-positive soldiers. The latter were selected out of 422 soldiers, showing a TTS higher or equal than 15 dB after regular training with fire arms (machine gun, 30 or 50 rounds, peak-pressure level: 158.5 dB SPLP, effective duration: 1.2 ms, E¨A¨R foam hearing protectors) and after exposure to an electric spark simulator (155 dB SPLP, 0.19 ms, 10 impulses, without hearing protectors). Stimulation with the electric spark ensured reproducible and equal noise exposure. Importantly, these results were not obscured by bad fitting hearing protectors.
In the laboratory experiments, we stimulated with greatly reduced sound intensities but similar frequency spectra instead of using gun-noise. The subjects were exposed to impact noise (sampled rifle G3, peak-pressure level: 106 dB SPLP, effective duration: 1 ms, 10 impulses/s, A-weighted sound pressure level: 75 dB(A) ) and for comparison purposes also with white noise (90 dB SPL, 88 dB(A)) for 5 minutes with earphones (DT 48 with free field equaliser). Before and after acoustic stimulation distortion products, click-evoked otoacoustic emissions, upper limit of hearing, pure tone- and high-frequency audiometry were recorded to re-evaluate the increased vulnerability of the cochlea of the selected TTS-positive soldiers.
Results About 6% (26) of the 422 soldiers showed a pronounced TTS, which was interpreted as an increased susceptibility to noise. With the spark simulator we could show that this susceptibility was not due to badly fitting hearing protectors. Instead, it must be attributed to individual differences in the hearing system. These subjects with a presumed vulnerable cochlea, already showed damages of the hearing organ which were manifested in an elevated hearing threshold at 3 and 4 kHz (+ 4 dB) and in reduced amplitudes of the TEOAE (-5 dB) and the DPOAE (-4 dB).
In the laboratory experiments these subjects were re-exposed to non-dangerous stimuli with greatly reduced sound levels. After impact noise exposure, no TTS was found in the control group, whereas 12% of the TTS-positive soldiers exhibited a temporary elevation of their hearing threshold at 3-6 kHz and another 12% in the high-frequency range of 10-16 kHz. However, with the upper limit of hearing in 40% of the control and 31% of the TTS-positive soldiers significant temporary alterations of the hearing organ were detected.
Otoacoustic emissions proved to be more sensitive to monitor early alterations of the hearing organ than pure tone audiometry. 30% of the TTS-positive subjects showed significant alterations of their TEOAE amplitudes (one wide-band > 4 dB), in the control group only 10% (stimulation with impulse noise). White-noise stimulation caused no significant alterations of the TEOAE amplitudes in the control group, but in 23% of the TTS-positive soldiers.
RTO-TR-017 AII - 3

APPENDIX II - PROGRAMS AND SUMMARIES OF RSG MEETINGS
The DPOAE amplitudes were stable in the control group (alterations <6 dB, white noise and impulse noise exposure), whereas in 20% (4%) of the TTS-positive soldiers alterations were observed after impact noise (white noise) exposure.
A further result of our measurements was that impulse noise caused more pronounced alterations of the hearing function compared to white noise, although its A-weighted sound pressure level was 13 dB lower. This finding opposes the equal energy concept, which is the basis for official noise limitation and damage risk criteria.
Conclusion Present damage risk criteria are valid only for 95% of an average population. In our study we found a pronounced TTS in about 6% of the examined soldiers for noise exposure far below the official limits. It was shown that otoacoustic emissions are a more sensitive tool to monitor cochlear function after noise exposure compared to pure tone audiometry. Further studies have to demonstrate whether the accuracy of the detection of a vulnerable inner ear can be improved by the combination of different subjective and objective audiological tests. Moreover, long term investigations must clarify whether the temporary alteration of audiological parameters will finally pass into a permanent hearing loss.
2. Epidemiology of airbag noise hazard G.R. Price U.S. Army Research Laboratory, Human Research and Engineering Directorate, Aberdeen Proving Ground, Maryland, USA
The noise of airbag deployment(s) is a problem that is both a great concern to society at large and a problem for hazard criteria because human ears are receiving unprotected exposures to impulses with peak pressures above 170 dB and energies greater than 4000 J/m2 (unweighted) or 95.5 dB LAEq8. Such exposures exceed by a large margin what is considered acceptable by all noise standards. Work at ARL has shown that such exposures result in a 37 dB PTS (in cat) and hair cell losses that match the audiometric losses. The question of hazard to the human ear needs to be established. As an approximation, the cat ear can be taken as representing a susceptible human ear; but we are moving toward a definitive study. The US Department of Defense maintains a hearing conservation database of over 500,000 individuals (giving us continuous audiograms over several years) and we are trying to compare an insurance database (which records accidents) with the hearing database. Thus we could have both pro-, and post- exposure data for ears that have been in automobile accidents. When funding becomes available to conduct the necessary interviews, we expect to have a database of several thousands of accident events. These data can also be compared with the cat data and the human ear model being developed.
3. The effects of impulse noise on gunners; a model for a prospective study Hâkan Axelsson, Thomas Kjellström and Anders Suneson Defence Research Establishment (FOA), Sweden
When firing military weapons in training, some gunners have reported uncomfortable feelings, dizziness and even blood taste in the mouth which will question the validity of some damage risk criteria. A model for a prospective study is presented in which conscripts will be subjected to medical examinations like audiometry, EEG, eye sight and changes in the retina like haemorrhage, before, during and after their military training.
AII - 4 RTO-TR-017

APPENDIX II - PROGRAMS AND SUMMARIES OF RSG MEETINGS
4. Supplementary investigation of the German Damage Risk Criterion with the Belgian NATO small arms rifle FNC Heinz Brinkmann Wehrtechnische Dienststelle für Waffen und Munition, Meppen, Germany
Introduction About 20 years ago, a comparative testing of several NATO rifles was conducted at Meppen within the scope of standardisation efforts (NSMA - NATO Small Arms Test). An international expert group evaluated the hearing damage risk due to the measured impulse noise and made a ranking for the tested weapons in accordance with the two accepted criteria - the German Pfander criterion and the Anglo-American CHABA damage risk criterion. Although the absolute numbers of permissible rounds for the individual weapons varied according to the two criteria, there was a good coincidence regarding the order of precedence (reference measuring point: ear of the shooter) except for the Belgian rifle FNC. On the basis of the weapon report data determined in the NSMA test, the expert group established that for the Belgian FNC-rifle 15 shots were permissible according to the German criterion, whereas only 0.55 shots were permissible when applying the CHABA criterion.
Former investigations on the German damage risk criterion (1978) As a result of this finding, we planned to conduct a firing test at Meppen using the Belgian rifle with approx. 100 soldiers as test persons. One test cycle consisted of 6 shots fired in standing position without support from a distance of 50 m to a target. 51 volunteers participated in the test without hearing protection. All test persons were monitored audiometrically by Professor Pfander before and after firing. During the firing, sound pressure measurements were taken near to the left ear of every shooter. These measurements were slightly deviating due to the difference between the realistic measuring point in this test and the more “theoretical” measuring point in the NATO reference test. It was determined that the shooter was subjected to a peak pressure level of 158.3 dB at a C-duration of 0.66 ms. According to the German DRC, applicable at that time, this corresponded to a permissible number of shots of 6.5 shots per 8-h day (as against 15 shots permitted according to the data from the NATO reference test). The audiometric monitoring on the 1st day revealed that for 5 persons the temporary threshold shift (TTS) lasted longer than 4 hours. Recovery was established not earlier than on the next day, i.e. 18 hours after exposure.
On the 2nd day the number of shots was therefore reduced to 5 shots. On this day, 53 volunteers participated in the respective test without hearing protection. All of them recovered within a period of 4 hours maximum, i.e. the duration of the temporary threshold shift was less than 4 h in all cases. For the entire firing test with 104 test persons altogether, Professor Pfander subsequently stated: “No permanent hearing damage was determined in any case.” Moreover, he explained that “firing without hearing protection is tolerable without damage up to the limit” (the limiting level without hearing protection).
Supplementary investigations on the German damage risk criterion The above investigation was the key event regarding the adoption of the German damage risk criterion (without hearing protection) since 5-6 shots from the Belgian FNC rifle are considered permissible.
Human Research and Engineering Directorate, Aberdeen Proving Ground requested for the measured impulse noise - data to be included in the US – “computer ear model”. For this purpose, however, the data must be available in digitised form (e.g. in an ASCII data file). Since the test data of 1978 had been stored in analogous form only, they had to be recorded once again.
RTO-TR-017 AII - 5

APPENDIX II - PROGRAMS AND SUMMARIES OF RSG MEETINGS
The German Pfander criterion, according to which at least 95 % of all involved persons must have recovered within a period of 24 hours, was met even for 6 shots fired.
The evaluation of the audiogram obtained on the 2nd day reveals, however, that there was a still better recovery after the series of 5 shots fired on that day. All 53 persons recovered within a time of < 4h.
New evaluation of the available audiograms The audiograms obtained in 1978 were analysed again in 1996 in detail. The overall evaluation of TTS recovery was re-assessed with respect to the different stress levels on the two days of testing in 1978. If a TTS existed, the highest TTS2 was analysed as well. The respective data are given in the following figures. Both the recovery times and the respective TTS levels are thus documented for the two test-versions with 6 and 5 shots. They may also be used for risk criteria other than those of Pfander.
New measurements of the impulse noise data from the FNC-rifle The tests for sound measurement only, were conducted 1996 in the same manner as those with the test persons in 1978. The weapon that had been used at that time still existed and ammunition from the same production lot was also still available.
The evaluation of the impulses were made using a DEC-workstation for which the German-French research institute ISL had developed the evaluation software. The Figure to the left shows the diagrams of a representative impulse evaluated in this way. Besides peak pressure, effective time (tc) and duration t0, the unweighted, A- and T-weighted area-related energies as well as the unweighted, A- and T-weighted equivalent sound pressure levels are calculated and displayed. The data are also available in digitised form, thus making it possible to examine the respective impulse according to other evaluation criteria as well.
AII - 6 RTO-TR-017

APPENDIX II - PROGRAMS AND SUMMARIES OF RSG MEETINGS
5. Noise exposure of soldiers in a battle field environment Heinz Brinkmann Wehrtechnische Dienststelle für Waffen und Munition, Meppen, Germany
Introduction In 1997 the German Army started a special training program to improve the education of soldiers with respect to combat situations. The whole training program, divided in different stages, contained physically stress as well as acoustic stress. During this one-day training set soldiers were exposed to continuous-noise and to impulse-noise caused by weapon firing and explosives. From the multiple exercises seven stages were considered to be acoustical stress. It was expected that the overall noise exposure would be near to the limit of the GERMAN-Damage-Risc-Criteria (with ear plugs). Therefore the training was accompanied with acoustic measurements by us and with audiometric tests on the participating soldiers by a team of the University of Giessen.
Course of acoustical stress-events during a training day:
- Stage 1: The soldiers were located in a flat hole on an overroll-track for tanks with some overrolls and some exercises (e.g. simulation of tank-firing and impacts).
- Stage 2: Soldiers were located on the edge of a forest. A battle-tank was passing the soldiers three times with different velocities. In addition to the tank passing there were some simulations of tank firing and impacts at varying distances.
- Stage 3: Soldiers were located at 1000 m distance from the explosion of two artillery-shells (155 mm) simulating an impact in two tracks.
RTO-TR-017 AII - 7

APPENDIX II - PROGRAMS AND SUMMARIES OF RSG MEETINGS
- Stage 4: Training of the soldiers for an artillery observer. The soldiers were located in a battle position observing 30 impacts of 155 mm HE-shells from a distance of approximately 420 m.
- Stage 5: The soldiers were inside an APC driving across a “mine field” with some mine-simulations exploding (explosion of 5000 g TNT at different distances).
- Stage 6: For this event the soldiers were separated in three groups: Group 1 took the “active” position - located in a combat pit about 25 m in front of two tanks (“Leopard2” and “APC Marder”). The firing set started with firing two rounds with the 120 mm cannon from “Leopard2” and 100 rounds with the 7.62 mm machine gun. The APC was firing 20 rounds with the 20 mm gun. Meanwhile the two other groups took the “passive” position. They were located in a combat pit at a distance of about 40 - 50 m lateral to the firing tanks. After the first firing set was completed group 2 changed to the “active” position in front of the tanks and group 1 to the “passive” position. Subsequently group 3 and 2 changed their position and completed the training set.
- Stage 7: Training set-up for the soldiers in a foxhole to give them the experience of near impacts. The impacts were simulated with different charges: 20 x 100g explosive TNT with cord fuse detonation at a distance of 5 - 54 m from an acoustic relevant measuring point; 16 x 250g explosive PETN with cord fuse detonation at a distance of 7.5 - 50 m from the referring Mp.; 7 x single 1000g TNT charges detonated at a distance of approximately 10 m from the foxhole (i.e. 10.7 m - 47 m from the referring Mp); 7000g TNT simulating an anti-tank-mine detonated in the centre of the 20 foxholes (i.e. at 27 m distance). At about 250 m distance a mine-sweeping-ladder was detonated.
Noise measurements and evaluation by the GERMAN Damage-Risc-Criteria (DRC) Acoustical measurements were made for all seven stages to determine the soldiers sound exposure and to calculate the allowable number of events (according to the German-DRC). Impulse noise measurements were performed as usual evaluating peak pressure level (PPL) and Pfander-duration (tc). To make the calculation of the allowable number of rounds easier we have developed the so-called “sound-value” (see PFANDER: Das Schalltrauma, Chapter 10).
This sound-value allows adding the exposures of every single event to an overall value representing the entire exposure of a day. This value should stay below a maximum of 100 000 = 100% (100 000 stands for Leq = 85 dB).
In addition to these calculations we evaluated the impulses by means of the INAS impulse-evaluating software (developed by ISL, Dr. Karl BUCK) with a DEC-workstation. With this software pressure-time-history, amplitude-density-spectra and third-octave-spectra are displayed and the PPL, the German-duration tc, the A-duration tA or t0, the unweighted, A- and T-weighted Energy E* as well as the unweighted, A- and T-weighted equivalent SPLs are calculated. These data are also available in digitised form, offering the option to examine the respective impulses according to other evaluation criteria as well.
Leopard2 firing 2 rounds in overhead-position and 6 rounds in lateral position with the 120mm cannon (stage 6) turned out to be the most important acoustical event during the training set for the soldiers. (See Fig. 1 and 2 for examples of an overhead firing and of a lateral firing with the 120 mm cannon). These eight impulse events summed up to be about 68% of the overall acoustical exposure for the entire day. The total exposure of stage 6 summed up to 70%. The simulated impacts close to the positions of the soldiers in the foxholes (stage 7) summed up to about 26% of the acoustical exposure of the entire training-day. Regarding the overall exposure the stages 1 up to 5 turned out to be less important.
AII - 8 RTO-TR-017

APPENDIX II - PROGRAMS AND SUMMARIES OF RSG MEETINGS
Figure 1: Overhead firing (incl. sonic boom) Figure 2: Lateral firing in about 50 m distance
At stage 1 - 5 soldiers were fitted with ear-plugs E.A.R. (impulse noise attenuation 30,8 dB). At stage 6 and 7 the soldiers had to wear MaxLite-plugs (with an impulse noise attenuation of 37.6 dB). Considering the attenuation mentioned above a sound value of about 28,000 for the whole course during the day was calculated. This means Leq = 79.4 dB. Therefore the overall sound exposure is lower than the allowable limit.
Audiometric testing All 76 soldiers participating were monitored audiometrically by a team of the hearing-research group coming from the University of Giessen. Most of the soldiers showed better hearing after being exposed to the noise-events than before. 97% of the soldiers participating showed a deviation of the temporary-threshold-shift (TTS) being less than ± 10 dB. A TTS of more than 10 dB at two neighbouring-frequencies between 1 kHz and 8 kHz (2 - 4 h after exposure) could be found only at 2 soldiers. More evaluation on audiometric research and testing has to be done.
6. Development of a model allowing flexible adjustment of Pfander’s borderline diagram when required* Ariane M. Clark Institute of Occupational Medicine, Heinrich-Heine-Universität Düsseldorf, Germany
Heinz Brinkmann Wehrtechnische Dienststelle für Waffen und Munition, Meppen, Germany
* Supported by a grant of the German Ministry of Defence.
RTO-TR-017 AII - 9
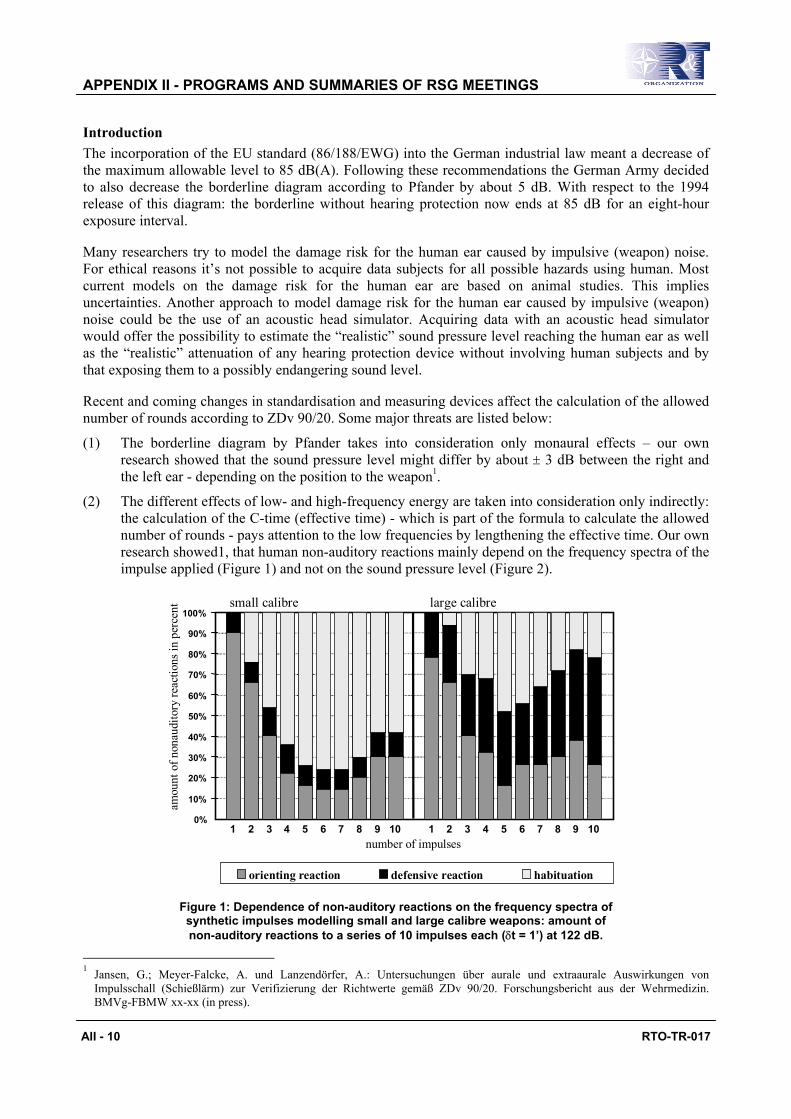
APPENDIX II - PROGRAMS AND SUMMARIES OF RSG MEETINGS
Introduction The incorporation of the EU standard (86/188/EWG) into the German industrial law meant a decrease of the maximum allowable level to 85 dB(A). Following these recommendations the German Army decided to also decrease the borderline diagram according to Pfander by about 5 dB. With respect to the 1994 release of this diagram: the borderline without hearing protection now ends at 85 dB for an eight-hour exposure interval.
Many researchers try to model the damage risk for the human ear caused by impulsive (weapon) noise. For ethical reasons it’s not possible to acquire data subjects for all possible hazards using human. Most current models on the damage risk for the human ear are based on animal studies. This implies uncertainties. Another approach to model damage risk for the human ear caused by impulsive (weapon) noise could be the use of an acoustic head simulator. Acquiring data with an acoustic head simulator would offer the possibility to estimate the “realistic” sound pressure level reaching the human ear as well as the “realistic” attenuation of any hearing protection device without involving human subjects and by that exposing them to a possibly endangering sound level.
Recent and coming changes in standardisation and measuring devices affect the calculation of the allowed number of rounds according to ZDv 90/20. Some major threats are listed below:
(1) The borderline diagram by Pfander takes into consideration only monaural effects – our own research showed that the sound pressure level might differ by about ± 3 dB between the right and the left ear - depending on the position to the weapon1.
(2) The different effects of low- and high-frequency energy are taken into consideration only indirectly: the calculation of the C-time (effective time) - which is part of the formula to calculate the allowed number of rounds - pays attention to the low frequencies by lengthening the effective time. Our own research showed1, that human non-auditory reactions mainly depend on the frequency spectra of the impulse applied (Figure 1) and not on the sound pressure level (Figure 2).
0%
10%
20%
30%
40%
50%
60%
70%
80%
90%
100%
1 2 3 4 5 6 7 8 9 10 1 2 3 4 5 6 7 8 9 10number of impulses
amou
nt o
f non
audi
tory
reac
tions
in p
erce
nt
orienting reaction defensive reaction habituation
small calibre large calibre
Figure 1: Dependence of non-auditory reactions on the frequency spectra of synthetic impulses modelling small and large calibre weapons: amount of non-auditory reactions to a series of 10 impulses each (δt = 1’) at 122 dB.
1 Jansen, G.; Meyer-Falcke, A. und Lanzendörfer, A.: Untersuchungen über aurale und extraaurale Auswirkungen von
Impulsschall (Schießlärm) zur Verifizierung der Richtwerte gemäß ZDv 90/20. Forschungsbericht aus der Wehrmedizin. BMVg-FBMW xx-xx (in press).
AII - 10 RTO-TR-017

APPENDIX II - PROGRAMS AND SUMMARIES OF RSG MEETINGS
0 %10 %20 %30 %40 %50 %60 %70 %80 %90 %
100 %
Leo2 - 2ndLeo2 - 1rstI_4 - 2ndI_4 - 1rst
impulse / round
amou
nt o
f non
audi
tory
reac
tions
in
perc
ent
orienting reaction defensive reaction habituation
Figure 2: Non-auditory reactions to a series of two (δt = 2’) synthetic impulses modelling tank Leopard at 122 dB 2 (I_4), and two (δt = 2’) rounds of tank Leopard 2 at 153 dB (Leo2).
(3) It is necessary to adjust the assumed attenuation value of all hearing protection devices in use at the German army according to the spectral distribution of the weapon blast applied. The process used since 1994 for calculating the mean value of the attenuation measured at 500 Hz and 1 and 2 kHz is a first - but not sufficient - approach. Many weapons have at least one of their frequency maxima below 500 Hz or above 2 kHz. Previous research showed1 that the attenuation of hearing protection devices depends on the frequency spectra of the impulse (Figure 3).
0 dB
5 dB
10 dB
15 dB
20 dB
25 dB
30 dB
35 dB
MAXLite Panzerhaube Telemit Willson SB258
hearing protection devices
atte
nuat
ion
I_1 Fpeak = 0,8 & 3,0 kHz I_2 Fpeak = 0,9 & 12,0 kHz
I_3 Fpeak = 0,2 kHz I_4 Fpeak = 0,15-0,21 kHz
Figure 3: Attenuation of four different hearing protection devices to four different synthetic impulses (I_1 to I_4) acquired with an acoustic head simulator
(Head acoustics) at 122 dB sound pressure level.
RTO-TR-017 AII - 11

APPENDIX II - PROGRAMS AND SUMMARIES OF RSG MEETINGS
(4) For a comparison of the spectral distribution of weapon shots with the spectral distribution of the attenuation of hearing protection devices it is necessary to calculate octave spectra for each weapon system at all measuring points mentioned in the regulations applied. Octave spectra are required, because all measuring and validation procedures for hearing protection devices are based on octave spectra.
(5) Further on it might be necessary for the German army to drop the method of the subjective attenuation level measurement at the hearing threshold. At the moment acoustic head simulator applications are tried out2, that as an interim solution could be used to determine the attenuation of hearing protection devices. In the long run there might be an “attenuation energy” calculation as a function of the weapon used.
(6) Medium term there might be the need to substitute the time- and cost-intensive studies based on subjects and/or soldiers shooting by “cheap” and “objective” data acquisition and calculation using the acoustic head simulator. The calculations of the energy content by Brinkmann3 and the calculations to assess the corresponding risk by Schweichel4 are the first steps into that direction.
(7) Finally the combination of impulsive and continuous noise (e.g. driving a tank and shooting) should be added to the borderline diagram by Pfander to give it a wider range of application.
Design The model is based on four pillars:
(1) data acquisition and analysis of various weapon impulses with a binaural artificial head (ISL) and a free-field microphone,
(2) data acquisition and analysis of combined impulsive and continuous noise,
(3) correlation between the amount of TTS and the amount of non-auditory reactions of human subjects to continuous noise at different sound pressure levels,
(4) correlation between the amount of TTS and the amount of non-auditory reactions of human subjects to the weapon impulses at four defined measuring points.
From the results of (1) the four equidistant measuring points are inferred. According to the German ZDv 90/20 the point “danger” is defined as that distance to the weapon used, where a subject is allowed two rounds with hearing protection. The point “safety” is defined as that distance, where a subject can be exposed to two rounds without hearing protection. The two other points are chosen at equal distances from the two basic points: “danger minus one” lies between “danger” and “safety” and “safety plus one” lies passed the “safety” point - see Figure 4 and 5.
The correlation of the non-auditory reactions with the amount of (temporary) threshold shift is calculated as follows: subjects are exposed to different levels of continuous noise on the one hand and to impulsive noise at the four reference points (see Figure 5) on the other hand while peripheral and central blood pressure and skin resistance are measured. The amount of changes in these psycho-physiological parameters is correlated with the amount of changes in the audiograms taken before and after noise exposure. As non-auditory parameters need lower sound pressure levels to cause a reaction than auditory
2 Parmentier, G. und Franke, R.: Ein Kunstkopf für die Bewertung der Wirksamkeit von Gehörschützern im Einsatz bei hohen
Schallpegeln. 208-227, in K. Nixdorff (Hrsg.): Anwendungen der Akustik in der Wehrtechnik, Hamburg, 1994. 3 Meyer-Falcke et al.: Bewertung tieffrequenter Anteile der Knalle großkalibriger Waffen hinsichtlich der Entstehung von
Gesundheitsschäden. Gutachten erstellt im Auftrag des BMVg InSan I4, Bonn, 1994. 4 Das Schalltrauma, 1-201, Hrsg.: Pfander, F.: Merkschrift erstellt im Auftrag des Bundesministeriums für Verteidigung. Bonn,
1994.
AII - 12 RTO-TR-017

APPENDIX II - PROGRAMS AND SUMMARIES OF RSG MEETINGS
parameters, it is possible to conclude from the relation between the amount of non-auditory changes to the amount of auditory changes at what places an exposure to noise would damage the subject’s hearing.
300 ms1 10 1000,3 3 300,1120dB
130dB
140dB
150dB
160dB
170dB
180dB
190dB
200dB
D -1 = graph for gaugingpoint G-1
D =borderlinefor hearingprotection with anattenuation of 30dB
S = borderline withouthearing protection
S+1 = graph for gaugingpoint S+1
Figure 4: Example for the translation of the four reference (gauging) points into the borderline diagram by Pfander for a hearing protection device with an attenuation of 30 dB.
artificial headat all gauging points
with and without hearingprotection
mandepending on the gauging point
with or without hearingprotection
D: gauging point "danger" (g.e. 160 dB) D-1: gauging point "danger minus one" (g.e. 145 dB)
S: gauging point "safety" (g.e. 130 dB) S+1: gauging point "safety plus one" (g.e. 115 dB)
D
D-1
S+1
S
Figure 5: Scheme of the reference (gauging) points of the subjects and the acoustic head simulator: example for tank Leopard 2.
In the long run these data will offer the possibility to predict the number of allowed rounds at any distance for any weapon and ammunition by exposing the acoustic head simulator to the various weapon shots and adding the deafening-index calculated from (3) and (4) to the physical data.
7. ‘Thoracic rig’ simulating the response of the pig lung to blast G. Cooper and A. Sedman Chemical and Biological Defence, Defence Evaluation and Research Agency, Porton, UK
RTO-TR-017 AII - 13

APPENDIX II - PROGRAMS AND SUMMARIES OF RSG MEETINGS
Designers, manufacturers and users of personal protective equipment (PPE), “hardened” structures and vehicles have a continuing need for reliable, validated experimental techniques for assessing the vulnerability of personnel to impact and blast (pressure) loadings. To address this need, CBD Porton Down has developed an instrumented thoracic rig.
The thoracic-rig is a dummy thorax designed to replicate the dynamic response of the pig thoracic wall to blast loading. It is a tube constructed from a rubber composition, covered with a lead-filled PVC outer coat and textile Kevlar. Metal end-plates provide a method of restraint. Accelerometers are mounted on the internal wall of the rig; the acceleration of the wall is the sole output. The rig mimics the dynamic response of the chest. It can be used to predict the risk of chest injury under impact or pressure loading. The effectiveness of PPE can be assessed by mounting it on the rig.
The design of the thoracic rig is based on more than 20 years experience of assessing the physical and clinical consequences of impulsive loading and the device has been extensively validated using biological models. In its earliest manifestations the rig contained only one accelerometer and was intended for examining the effects of simple blast loading. In later models eight accelerometers are mounted around the rig to obtain more complete information for complex loading scenarios.
For simple blast loading (a loading principally comprising a single overpressure excursion with no multiple peaks of high magnitude arising from reflections etc., and no protracted quasi-static component), the peak acceleration is an index of the severity of primary blast injury. This type of waveform will generate a single acceleration peak, the value of which provides a quantitative index of the severity of lung injury.
For complex blast loading, the rig response will also be complex, exhibiting a number of acceleration peaks arising from the Multiple blast loading. To account for the different effects of simple and complex loading a Cumulative Sum Criterion (CSC) has been developed. This permits the results measured on the thoracic blast test rig in a complex environment to be interpreted in terms of injury. In order to assess the likely effects of blast loading on the thorax, a finite element model of the thoracic rig with the addition of lungs and mediastinum was developed. This allowed the examination of pressures developed in the lungs for a given loading. Previous work has indicated that rate of change of pressure (dP/dt) within the lung is the factor which causes injury. The results of the models were examined for areas of the lung in which dP/dt exceeded a given threshold. This provides a Damage Fraction (DF) which is an estimate of the volume of lung injured for a given complex blast loading.
It was believed that an important factor inducing damage in the lung was the velocity of the chest wall. Accordingly, the accelerations predicted by the model were integrated to give the velocity histories at points corresponding to the transducer positions in the physical rig. The velocity histories were observed to comprise two components. First, a short term forced response. Second, a longer term natural vibration and free body motion. The longer term motion was shown by further modelling to be non-injurious. Therefore, a processing technique was developed to account for this. The processed velocity data are examined for maxima and individual peaks (exceeding 1 m/s) are summed for each sampling point. These summed values are then totalled for the eight points around the rig and the result is the CSC. The CSC has been correlated with the DF and shown to be a superior predictor of injury from complex blast loadings to other criteria that had been examined. The relationship of the CSC value to actual injury level was obtained by reference to results of animal experiments reported in the scientific literature. The CSC method is undergoing further assessment and development.
In use, the rig is portable, reliable, repeatable and extremely robust. Attachments can be used in conjunction with the thoracic rig to assess the risk of other types of injury such as car damage and skin burns.
AII - 14 RTO-TR-017
APPENDIX II - PROGRAMS AND SUMMARIES OF RSG MEETINGS
The thoracic rig is available as part of CBD Porton’s comprehensive vulnerability assessment service, supported by highly experienced scientists, medical specialists and engineers. It has already been used to support a wide range of projects. These have included the design of PPE to protect from impacts and blast, the safety assessment for vehicle occupants, the evaluation of energy attenuating materials for use behind body armour and the design of improved battlefield defaces.
8. Efficiency of the present medical treatments of acoustic trauma A. Dancer Institut Franco-Allemand de Recherches de Saint-Louis, Saint-Louis, France (in co-operation with INSERM in Montpellier, France, and Hadassah hospital, Israel)
In some countries (e.g. France, Germany) all soldiers suffering acute acoustic trauma receive a medical treatment at the hospital. In France, for the three years 1993-1995, 1,796 soldiers have been treated in the ENT departments of the military hospitals (total number of days of hospitalisation: 7,974; total direct medical cost 12 million French Francs). In Germany 966 cases of acoustic trauma have been reported in 1996. In other countries (e.g. United Kingdom, USA) soldiers in the same situation are not treated (they are just withdrawn from hazardous noise exposure). In all countries huge compensations are paid each year to the veterans for hearing loss as a primary disability. In the USA 252 million USD have been paid in 1995 to 59,088 veterans, in France the annual cost of the compensations for Noise-Induced-Hearing-Loss (NIHL) is estimated at 50 million FF. In Belgium about two thirds of the 200 million BF paid yearly to the veterans for all kinds of disabilities are related to NIHL! It must be noted that, besides the USA for which the NIHL compensation costs are precisely known, the figures from the other NATO countries are presently either rough estimates or totally unknown.
Given the difficulties to assess the actual efficiency of the acoustic trauma treatments in man (such as ignorance of the pre-exposure hearing condition, ignorance of the precise noise exposure parameters, various treatments, difficulties to differentiate between the physiological recovery and the medical assisted recovery, no control groups), given the cost of these treatments in the military and the importance of this problem for public health, we decided to conduct systematic animal experiments. Guinea pigs were exposed to a third octave band noise centred on 8 kHz (129 dB, for 20 minutes). Threshold shifts were measured by electro-cochleography and recovery was observed up to 14 days post-exposure. Some distortion products measurements were also performed. Then histological observations of the Corti’s organ were made by scanning electron microscopy (SEM).
It is worthwhile to note that in some animals the recovery (measured by electrocochleography) can be complete (no permanent threshold shift) despite the fact that significant areas of damaged cells are observable by SEM. This observation casts doubt upon the actual effectiveness of the medical treatments which induce a complete recovery (as measured by the behavioural audiogram). Therefore, in spite of an apparent complete functional recovery, some subjects could present concealed lesions of the sensory cells. These lesions could make them more sensitive in case of further noise exposures and more susceptible to presbyacousis.
A first group of animals (n=8) was treated by inhalation of pure oxygen at ambient pressure, beginning one hour after the end of the exposure (for 30 minutes, every two hours, for 4 - 5 days). Compared to an untreated (control) group, no significant modification was noticeable 14 days post exposure.
Up to now, a single animal was treated by hyperbaric oxygen therapy (2.5 bars, during one hour, two times a day, for 4 - 5 days). The recovery was less rapid and less complete than in the control group. However, more animals are necessary before getting to a conclusion as far as hyperbaric oxygen therapies are concerned.
RTO-TR-017 AII - 15

APPENDIX II - PROGRAMS AND SUMMARIES OF RSG MEETINGS
Another group (n=9) was treated by inhalation of carbogen (O2: 93%, CO2: 7%) beginning one hour after the end of the exposure (for 30 minutes, every 2 hours, for 4 - 5 days). The carbogen treated group shows a paradoxical short term increase of the threshold shifts at low frequencies but a somewhat better recovery (at 14 days). However, more animals are required to know whether this conclusion is statistically significant and is correlated with smaller morphologic damages (SEM observations). Another group (n=9) was treated by IM injection of corticoids (methyl prednisolone, 10 mg) one a day for 5 days. The recovery looks more rapid than in the control group and is slightly better at 14 days. Here too, more animals are required to know whether this conclusion is statistically significant and is correlated with smaller morphologic damages (SEM observations).
Up to now a single animal was treated by combining hyperbaric oxygen and corticoid treatments. The results look promising. Final conclusions concerning the actual effectiveness of the present medical treatments of the acoustic trauma will need more measurements (electrocochleography, distortion products) and more observations (scanning and transmission electron microscopy) on larger groups of control and treated animals.
Combined treatments (e.g. hemodilution, oxygenotherapy, corticotherapy) defined in close co-operation with the ENT departments of the French and German military hospitals will also have to be tested thoroughly.
9. Treatment of acute acoustic trauma in the German Armed Forces Michael Kersebaum MD Bundeswehrzentralkrankenhaus Koblenz, Germany
Although world wide there is much agreement and uniformity over medical questions, this is not the case with acute acoustic trauma. The following gives a summary of the current management of this problem in the Bundeswehr.
Basis of Treatment The basis of treatment is that oxygenation of the delicate hair cells of the organ of Corti which are damaged during AAT must be maintained. The cochlea is particularly sensitive owing to its arterial supply: the labyrinthine artery splits into the vestibular artery and cochlear artery - which are both end-arteries. Consequently, rheological factors must be optimised to ensure adequate oxygenation; these factors consist of:
•
•
•
•
•
ensuring the haematocrit is less than 40%,
ensuring a low plasma viscosity,
avoiding aggregation of blood cells,
ensuring adequate oxygenation of blood,
ensuring adequate blood flow.
Current Treatment In addition to the above actions, 3 x 2 tablets of Dusodril retard (Naftidrofuryl), 3 x 1 tablets of Neurotrat S forte (Thymine and Pyridoxine) and one capsule of Antra 20 (Omeprazol) are given daily during ten days, together with a decreasing dose of prednisolone beginning with 40mg.
AII - 16 RTO-TR-017

APPENDIX II - PROGRAMS AND SUMMARIES OF RSG MEETINGS
Infusion regimen using Rheohes (hydroxy ethyl starch):
Days 1 and 2 250mg Solu-Decortin H
Days 3 and 4 200mg
Days 5 and 6 50mg
Days 7 and 8 l00mg
Days 9 and 10 50mg
Alternative Treatments Hyperbaric oxygenation has been used, but requires a multidisciplinary team and specialised equipment available only in a few centres. It is now hardly used. Dextranes (plasma expanders) are now no longer used by the Bundeswehr in peace time owing to the risk of anaphylactic reactions. Hydroxy ethyl starch has been useful, but has, in a few cases, caused intractable pruritus which can last for up to a year. Nevertheless, it is still successfully employed.
10. Acute acoustic trauma; a view at the costs over the period 1979 - 1994 Michael Kersebaum MD Bundeswehrzentralkrankenhaus Koblenz, Germany
A study was made of the financial costs involved in treating the effects of acute acoustic trauma. This study concerned simply the financial aspects; it did not take into account the social and psychological implications of such injuries.
Statistics were collected from the causes of accidents in the Annual Military Health Report, concentrating specifically on section XI, Environmental Influences. The number of cases per year for the German Armed Forces varied from under 500 to over 2000 between the years 1979 and 1994 (Fig. 1).
RTO-TR-017 AII - 17

APPENDIX II - PROGRAMS AND SUMMARIES OF RSG MEETINGS
There were three main centres for handling such cases: military medical centres, military hospitals and civilian hospitals. The data specified per centre are given in Fig. 2. The treatment, usually lasting up to ten days per case, resulted in a large number of working days lost to the Armed Forces (Fig. 3). Fig. 4 shows that there was little difference between the sites of treatment as to how many days were lost. Figs. 5 and 6, respectively, show that the number of cases seen and the loss of days were remarkably independent of the size of the Armed Forces over this period. Fig. 7 compares the number of cases and loss of days.
AII - 18 RTO-TR-017

APPENDIX II - PROGRAMS AND SUMMARIES OF RSG MEETINGS
RTO-TR-017 AII - 19

APPENDIX II - PROGRAMS AND SUMMARIES OF RSG MEETINGS
AII - 20 RTO-TR-017

APPENDIX II - PROGRAMS AND SUMMARIES OF RSG MEETINGS
The costs per day at a military hospital, including accommodation, food and ENT-treatment, are estimated at DM 440.53. By taking this estimate we calculated the total cost of acute acoustic trauma. The result is presented in Fig. 8. This calculation does not take into account the cost of the lost working days.
11. Intracochlear pressure measurements with impulse noise A. Dancer Institut Franco-Allemand de Recherches de Saint-Louis, Saint-Louis, France (in co-operation with the FOA and the Karolinska Institute, Sweden)
With the help of miniature transducers, the acoustic pressure has been measured at the base of the guinea pig cochlea (scala vestibuli and scala tympani) undergoing the action of impulses produced by a loudspeaker and by small pellets of explosives (primers). The peak pressure at the entrance to the earcanal
RTO-TR-017 AII - 21

APPENDIX II - PROGRAMS AND SUMMARIES OF RSG MEETINGS
ranged from 100 Pa (134 dB) to 2700 Pa (163 dB). The signals measured in scala vestibuli allow to determine the behaviour of the middle-ear transfer function (METF).
At moderate excitation levels (up to 2000 Pa), the METF was found to be linear; in the frequency domain the METF is identical to that measured with pure tone stimuli of low level. In the time domain the amplification of the positive peak pressure in scala vestibuli is about 22 dB (x 12.6), whereas the amplification of the peak-to-peak pressure in the same scala is about 28 dB (x 25) indicating a strong negative component in the intracochlear pressure at the entrance to the cochlea. For larger peak pressures (beyond 2000 Pa), the amplification factor decreases indicating a limitation of the displacements of the tympano-ossicular chain (as anticipated by the Price and Kalb’s model). In the frequency domain, the amplitude of the METF decreases progressively below 1 kHz when the peak pressure at the entrance to the earcanal increases (by as much as 20 dB at 200 Hz). Because of the smaller amplitude of the pressure in scala tympani, the differential pressure acting on the cochlear partition is almost the same as the pressure recorded in scala vestibuli.
These measurements aim to better understand the mechanisms of damage due to impulses (weapon noises) by determining the METF for high peak pressures and the mechanical stress to the sensory structures. They will be used to develop and to validate new weapon noise exposure criteria which take primarily into account the pressure-time history of the impulses.
12. Progress in the development and validation of the human hazard model G.R. Price and J.T. Kalb U.S. Army Research Laboratory, Human Research and Engineering Directorate, Aberdeen Proving Ground, Maryland, USA
The ARL model of auditory hazard and added features were reviewed for RSG 29. In response to comments at the previous meeting, a separate IMPORT program was created to allow the importation and calibration of waveforms for use by the model. In addition to a variety of editing features, two major technical advances were included in the IMPORT program. The first deals with the problem of predicting hearing hazard when a protector is worn. The program creates and applies a minimum phase digital filter from hearing protector attenuation values and processes the free field waveform to reproduce the pressure history at the ear canal entrance. This allows for the first time a calculational interpretation of the effect of waveforms measured in the free field (the common practice) on hearing in an exposure in which a hearing protector is used (the typical case). The second feature deals with the problem of the evaluation of hearing hazard from an impulse that approaches the ear from a particular azimuth. A new algorithm calculates and applies a head-related transfer function to the pressure history which then becomes the waveform evaluated by the model.
The latest human version of the model was challenged with the available waveforms for which human exposure had been tested and for which the results on human hearing were known. These included rifles from Belgium, Germany, and the US; the 3 types of impulse used in the US Army’s tests with human exposure to large caliber weapons (at several levels each), a light anti-tank weapon, and additional impulses from new and traditional weapons, e.g. 81 mm mortar, MAAWS (a rocket launcher), and a 105 mm armored gun system and from airbags in sealed, closed and open vehicles. The model produced hazard evaluations, which in each case were consistent with the documented or expected hazard. In contrast, existing criteria were at wide variance with the actual hazard. For example, the A-weighted energy (a popular candidate for general use in evaluating hazard) in one exposure demonstrated to be safe for the human ear when it was over 3000 J/m2 while another exposure was demonstrably dangerous when it contained only 9.5 J/m2.
AII - 22 RTO-TR-017

APPENDIX II - PROGRAMS AND SUMMARIES OF RSG MEETINGS
14. Evaluation of impulse noise criteria using human volunteer data Philemon C. Chan, Kevin H. Ho and James H. Stuhmiller JAYCOR, San Diego, California
Maria A. Mayorga Walter Reed Army Institute of Research, U.S. Army Research and Material Command
From 1989-1995 the U.S. Army Medical Research and Materiel Command along with a private contractor, EG&G conducted auditory studies on humans exposed to free-field and complex wave blast overpressure. This presentation describes the evaluation of existing impulse criteria and the MAN0297 iteration of the HRED (Price and Kalb) model against the human data collected at the BOP Test Site. This work is part of a greater effort to evaluate existing and proposed criteria that may serve as a replacement for the existing U S. Military Standard 1474C.
The modified ear muff test results were used for the present study. Three groups of military volunteers entered a study matrix where they were exposed to 7 increasing levels of BOP (determined by C-4 charge weight and number of rounds) emitted from a mortar simulator at 1, 3 and 5 meters (Figure 1). Each test group had about 60 subjects of which 40-50 completed the study. The 7 levels represented a 3 dB increase in acoustic energy but were not necessarily equal for all distances. Subjects could drop out from the study at any time or were dropped because of auditory failure. An auditory failure was defined as a Temporary Threshold Shift (TTS) >25 dB at 2 min based on the first post-exposure audiometric test given to the subjects. To thoroughly determine pass or fail for each subject after exposure, a conservative, statistically-based algorithm was adopted to screen anomalous or borderline conditions, such as growth of TTS to exceed 25 dB at a later time.
The modified ear muff was a RACAL muff with eight tubes inserted through 2.3 mm holes at the right ear cup seal to simulate poor muff fitting. Subjects underwent auditory testing immediately pre-exposure and at 2, 20 and 60 min after the last shot. Those demonstrating an auditory failure underwent continued auditory testing until any significant TTS resolved. The pressure measured under the muff was used in this analysis. For all 7 levels at 1 and 3-meter distances, 4 random sets of under-the-muff pressures taken from volunteer subjects were selected as a reference data set. In the case of the 5-meter data, under-the-muff measurements were taken from volunteer scientists. Because of their highest observed auditory failure rates, the 100-shot tests were chosen for the injury correlation analysis.
The measured pressure data under the muff showed the expected monotonic increase in peak pressure as a function of level (Figure 2). Similarly, A-weighted energy and P-weighted energy increased with intensity. The correlation was high confirming that the original testing goal of well defined acoustic energy increases was achieved. It should be pointed out that in Figure 2, the x-axis titled “Level’ is not the same for each distance. However, the conclusion that peak pressure, A-weighted energy and P-weighted energy increases with exposure to increasing level does not change.
The observed auditory injury, as measured by “percent failures”, also demonstrated increasing injury with higher level and with decreasing distances at a 50% confidence level (Figure 3). The 5-meter exposure distance produced less than 5% injury. Linear regression showed a high degree of correlation for all distances.
The reference under-the-muff pressure data set was used to evaluate the most recently released (MAN0297, February) HRED model of the human ear. The model was run without modification with the under-the-muff pressure entered as free-field pressure to calculate the Hazard Index. The ‘free-field pressure’ input option was selected because at the time of this evaluation, the authors of the HRED model had not provided a revised model that includes the effects of the ear muff when under-the-muff pressures
RTO-TR-017 AII - 23
APPENDIX II - PROGRAMS AND SUMMARIES OF RSG MEETINGS
are used as input data. Furthermore, the other option for imputing data, “auditory canal” was non-functional in the HRED model MAN0297. Hazard Index is calculated as,
N Σ Si
2.3 i=1
where N is the number of times the basilar membrane (BM) at a given location on the cochlea reaches maximal displacement Si. The factor to which S is raised has changed from older iterations of the HRED model. The BM displacement is decreasingly weighted from base to apex to account for the effect of area increase on the strain. The model allows for the modification of entries ‘MemDelay’, which delays the time for response of the middle ear muscles and ‘MemTimeConst’, which is the time required for completion of activation of these muscles. These entries were left in the ‘default’ mode, which would be the appropriate entry in the instance of unwarned subjects, that is, subjects who did not anticipate the timing of a noise exposure.
The overall correlation of the Hazard Index with injury was poor. At the 1 meter distance, there was no statistically significant correlation with the Hazard Index (Figure 4). It is noted that the 1-meter exposure resulted in the highest observed auditory failure rates. At the 3-meter and 5-meter distance, the correlation coefficients between injury and the Hazard Index are higher than at 1-meter. However, all Hazard Index correlation coefficients are much, lower than those for acoustic intensity and energy measures (Figure 5).
In summary, injury correlated fairly well with peak pressure, A-weighted energy and P-weighted energy. The correlation could be improved by selecting nonlinear regression models. The HRED model did not correlate well with injury at the 1-meter distance, though correlation was better for the 3- and 5-meter distances. The HRED Hazard Index-Injury correlation coefficients are significantly poorer than those using peak pressure and acoustic energies. The HRED appears not to capture the injury-inducing mechanism from the pressure-time history. Criticism of this preliminary evaluation includes the input of the under-the-muff pressures into a model which did not take into account ear muff effects and ‘MemDelay’ and ‘MemTimeConst’ were not modified to indicate a pre-warned subject. Future plans include evaluation of auditory injury by using other acoustic energy-based criteria and a re-evaluation another iteration of the BRED model that includes codes for an ear muff and an auditory canal.
15. Application of the ARL ear model to M109 exposure with ANR: Artillery headsets and impulse noise B.W. Anderson U.S. Army Research Laboratory, Human Research and Engineering Directorate, CECOM Element, Fort Monmouth, New Jersey, USA
The U.S. Army developed the Artillery Communications Aural Protective System (ACAPS) headsets with active noise reduction (ANR) to protect the hearing of artillery personnel from exposure to steady-state armor vehicle noise and impulse noise from the firing of the vehicle guns. To evaluate the impulse protective properties of the headsets, the Army Research Laboratory (ARL) tested the headsets during the firing of the M109 self-propelled howitzer, the Paladin. Data were collected using an electret microphone mounted under the ACAPS muff at the ‘ear canal’ of a manikin seated at the commander’s position inside the crew compartment during the firing of high propellant, Zone 7, charges. Impulse waveforms were recorded for ANR-off and ANR-on conditions, with hatches closed and open. For comparison, recordings were made for conditions without the headsets with the hatches closed and open. These data were analyzed using the ARL ear model.
AII - 24 RTO-TR-017

APPENDIX II - PROGRAMS AND SUMMARIES OF RSG MEETINGS
The sound pressure level of the impulses at the manikin’s ‘ear’ ranged between 150 and 160 dB. Using the proposed damage threshold (400 Auditory Damage Units for this version of the model), the model predicts that a soldier with the ACAPS in the worst case condition, i.e., with the hatches open, could sustain 144 impulses before hearing damage would begin to occur. As might be expected, the unprotected ear would sustain damage after only 3 rounds. In all conditions the predicted hearing damage of the impulses was greater with the hatches open than with the hatches closed. The findings also showed that ANR-on does not seem to afford additional protection against impulses at the tested sound pressure levels. For the impulses evaluated, the ear model predicted that the ACAPS would protect the hearing of a soldier inside the Paladin during firings of the gun for a minimum of 144 rounds with hatches open and up to 320 rounds with hatches closed.
Note on the use of the ARL ear model: The ear model requires a digitized waveform as input data for processing. While using the model, it became apparent that different methods of digitization yielded different Auditory Damage Unit scores. Experimenting with variables of the high frequency components of the waveforms seemed to indicate that these components were important to the ear model, but results on types of digitizations of the waveforms are not entirely consistent. Preparation of the waveform for the model is not trivial. For the present, digitization directly from the original analogue or digital recording appears to be the best method for analysis with the ear model.
16. T-weighting or A-weighting, what to use for the evaluation of exposure limits K. Buck, A. Dancer and G. Parmentier Institut Franco-Allemand de Recherches de Saint-Louis, Saint-Louis, France
Some of the Damage Risk Criteria (DRC) for weapon noises presently used in the armed forces (e.g. those of Pfander and Smoorenburg), are based on the equal energy principle. This means, that for a given peak pressure, a doubling of the duration (A, C or D) will reduce the number of exposures by two. However, different studies have shown, that this simple application of this principle overprotects the soldier when using large caliber weapons (long impulse durations) and so limits the use of certain types of weapons even if known as not dangerous for hearing. To reduce this limitation a weighting may be applied to the energy. A first approach to this has been to calculate the A-weighted energy of the Friedlander wave. The A-weighting function (fig. 1) corresponds to the iso-loudness curve at 40 Phone with a 0 dB attenuation at 1 kHz. As this function corresponds roughly to the transfer function from the free field to the cochlea, the A-weighting yields an application of the iso-energy principle at the entrance of the inner ear. However, if the energy penetrating into the cochlea is the governing factor for weapon noise induced hearing loss, the Threshold-weighting (T-weighting) function (fig. 1) should be more appropriate as it corresponds better to the external and middle ear transfer functions (ROSOWSKI, 1994). The differences between the A- and the T-weighting function are:
•
•
•
a steeper attenuation slope for frequencies lower than 300 Hz,
an amplification of 8.5 dB at 3.2 kHz T-weighting compared to 1.3 dB for A-weighting (unity gain for both at 1 kHz),
more attenuation for the T-weighting at frequencies higher than 6 kHz.
RTO-TR-017 AII - 25

APPENDIX II - PROGRAMS AND SUMMARIES OF RSG MEETINGS
AII - 26 RTO-TR-017

APPENDIX II - PROGRAMS AND SUMMARIES OF RSG MEETINGS
RTO-TR-017 AII - 27

APPENDIX II - PROGRAMS AND SUMMARIES OF RSG MEETINGS
For ideal Friedlander type impulses, the measured energy depends on the frequency at which the unity gain of the T-weighting is defined. If this frequency is defined at 1 kHz (the same as A-weighting), the T-weighted energy would predict, over the full range of A-durations, a slightly higher (3dB for t0=0.1ms; 1dB for 10ms) risk than the A-weighted energy (fig. 2). As the present DRCs are supposed to agree with A-weighted energy for small weapons (A-duration about 0.3ms) the gain of the T-weighting function may be adapted to show the same energy for A- and T-weighting. This would lead to unity gain at 1.8 kHz (additional linear gain of -3dB) for the T-weighting function. If we consider real-world signals and unity gain at 1.8kHz for T-weighting, the T-weighting may show for most of the signals 0 to 2dB less energy (fig. 3). For signals measured under active hearing protectors (fig. 4), T-weighting may show 0 to 3dB more energy than A-weighting, depending on the frequency of the amplification of the ANC-system. Under passive hearing protectors at very high levels (fig. 5), due to the strong low frequency component the T-weighted energy may be up to 10 dB lower than the A-weighted energy. Using the T-weighting function instead of A-weighting, the underestimation of the hearing protection for large caliber weapons (JOHNSON, “walkup Study”) would be reduced. However, statistical evidence between the results using one or the other weighting function is not strong enough to replace the A-weighting that is widely implemented in measurement setups.
17. Pressures measured under earmuffs worn by human volunteers during exposure to freefield blast overpressure James H. Patterson, Ben T. Mozo, Elmaree Gordon, Jesus R. Canales and Daniel L. Johnson EG&G MSI Inc, Albuquerque Operations, New Mexico, USA
A series of studies to determine the maximum safe exposures to blast overpressure (high intensity impulse noise) were conducted at the Blast Overpressure Test Site on Kirtland Air Force Base, NM by EG&G Management Systems Inc., Albuquerque, NM. The studies focused on temporary changes in the threshold of hearing in volunteers wearing earmuffs and hearing protection. From these studies, maximum safe exposure levels have been derived in terms of the parameters of the free-field blast signatures. In collaboration with the contractor researchers at the test site, a field measurement team from the U.S. Army Aeromedical Research Laboratory (USAARL) recorded the pressure signatures under the earmuffs of a subset of the volunteers participating in the studies. These pressure signatures are representative of the effective exposure stimuli arriving at the ears of the volunteers. This report presents the results of these under-the-muff measurements. An analysis of indicators of auditory hazard derived from the pressure-time signatures under the muffs indicated that weighted sound exposure level (SEL) measures and peak levels corrected for B-duration are good indicators of auditory hazard when a correction factor of 1 to 5 dB per 10 fold change in number of impulses is used as the number-intensity trading rule.
19. Last developments in the nonlinear perforated ear plugs A. Dancer Institut Franco-Allemand de Recherches de Saint-Louis, Saint-Louis, France
New nonlinear perforated earplugs have been developed by the French-German Research Institute of Saint-Louis. They allow the nonlinearity to be manifest for impulses (and for continuous noises) beyond 110 dB (instead of 140-150 dB for the former nonlinear plugs such as the Gunfender) and to increase rapidly with the level of the impulses. These plugs, which allow better speech intelligibility, communication, acoustic detection and identification than the classical foam plugs, have been demonstrated last year to fully protect the ear against impulses up to 187 dB (100 rounds) by the US Army (Dr. D. Johnson, Albuquerque), when they are well-fitted.
AII - 28 RTO-TR-017

APPENDIX II - PROGRAMS AND SUMMARIES OF RSG MEETINGS
Since the last year, the dimensions of the nonlinear acoustic filter have been reduced without a decrease in the performances. The last design allows the plugs (EAR Ultrafit) equipped with the nonlinear filters to fit almost all types of ear canals. Experiments performed on soldiers in the French Army during rifle shooting have confirmed the efficiency of this new design.
Before release for military use, these plugs will be tested on soldiers during mortar shootings (120mm, top charge) in the next months, and their final design will allow to get a full attenuation (if necessary) even at moderate levels in case of exposure to large continuous noises such as in APCs, MBTs, and planes.
21. Effects of head protection and hearing protection on military performance M.R. Forrest Centre for Human Sciences, DERA Farnborough, GU 14 OLX, UK
Conventional hearing protection will reduce the soldier’s ability to hear external sounds, as will any form of head protection that covers the ears. It has been difficult to estimate the effect of this on military performance, since there has been little information on the intensity of speech and other sounds at the soldier’s ears. To supply more information, miniature microphones (Knowles type BL 1785), with foam plastic windshields, were placed in the helmet near the ears, and the signals recorded on Sony Digital Micro NT-1 (Scoopman) digital tape recorders. These were used during two military exercises for Infantry soldiers, both in daylight: one on fighting in built-up areas and one in open country. The most critical auditory factor appeared to be the ability to hear speech at a distance. Speech addressed to the wearer was clearly audible when the tape recording was replayed; measured levels (in 1/3 octave bands) were above normal hearing threshold. A calculation using attenuation values for a conventional ear muff showed that spoken information and commands would be impaired by use of hearing protection, especially for a soldier with some degree of hearing loss; the problem was greater for the exercise in open country, where speech levels were lower.
It was concluded that conventional hearing protection could impair the effectiveness and safety of Infantry training. A similar problem may arise with head protection that covers the area round the ears, as this will give a high-frequency attenuation rather similar to that of earmuffs. The ideal solution is a form of head protection that will protect against noise as well as against other hazards, while preserving the ability to hear external sounds.
22. Double Hearing Protection and Speech Intelligibility in Armoured Vehicles K. Buck, G. Parmentier and A. Dancer Institut Franco-Allemand de Recherches de Saint-Louis, Saint-Louis, France
LTC E. K’Vella STAT
L. Pellieux IMASSA / CERMA
The noise levels in armoured vehicles, are such (fig. 1), that the standards for hearing conservation wouldn’t allow training periods that are close to real situations. The A-weighted noise levels under the hearing protector of crew members are, depending on the driving conditions, up to about 105 dBA, and this means, that the allowable time per day would be ~5 minutes (Leq8 = 85 dBA) or about 15 minutes (Leq8 = 90 dBA). These high noise levels are also degrading the communication between the
RTO-TR-017 AII - 29

APPENDIX II - PROGRAMS AND SUMMARIES OF RSG MEETINGS
crewmembers, and lead to levels of the communication signal that may be higher than 105 dBA. To overcome this problem, the soldiers need a more effective hearing protector. As such hearing protectors are not always available, a second hearing protector (earplug) underneath the communication ear cup also has been proposed as a solution. This second protector adds about 15 to 20dB of attenuation (fig. 2) at frequencies below 500 Hz and about 10 dB for the high frequency range. The overall attenuation given by this double protection is 15 to 25 dB in the low frequency range and peaks with about 40 dB at 3 kHz. Now, as far as the protection is concerned, the A-weighted level of the noise would allow a full day of driving.
Concerning the communication, we might think that, as the speech level also is reduced by the double protection, the intelligibility of speech should also be reduced. KRYTER (1945) however reported, that when listening to speech in intense noise, the ears that have been protected with ear-plugs showed a better speech intelligibility than unprotected ears (fig. 3). This effect could be especially helpful for the type of noise found inside armoured vehicles. This type of noise has very high levels at low frequencies (fig. 1). In the case of single protection, the predominant factor for the masking of the speech signals (fig. 4) is due to the 80 Hz component of the noise. The speech level that has been chosen by the soldier was about 100 dB SPL. At this level, the unmasked area of speech is big enough to allow good speech intelligibility. In the case of double protection, the noise and the speech levels are attenuated the same amount. As the upward spread of masking is level dependent, the influence of the masking in the spectral area of speech (~2 - 4 kHz) will be less important. Decreasing the noise level at 80 Hz by 17 dB reduces the masking at 2 kHz by 25dB and at 4 kHz by 30 dB. Thus, even if the noise and the speech will be attenuated by the same amount, the unmasked area of speech will be larger, and the intelligibility of the speech will be increased. Recent measurements by PELLIEUX support this idea. He showed that, using double protection, the level decreased by 15 dB, but the speech intelligibility increased by 25%. Therefore, the use of double protection may be a good and cheap possibility to increase the intelligibility of communication devices in very noisy environments. However, it will not work, if the noise levels are such that the volume of the communication system has to be turned to a level, where the limitation of intelligibility is due to physical distortions and not to the external noise or masking.
AII - 30 RTO-TR-017

APPENDIX II - PROGRAMS AND SUMMARIES OF RSG MEETINGS
RTO-TR-017 AII - 31

APPENDIX II - PROGRAMS AND SUMMARIES OF RSG MEETINGS
23. Adapting the STI for the use in very noisy environments K. Buck and A. Dancer Institut Franco-Allemand de Recherches de Saint-Louis, Saint-Louis, France
T. Wessling Ruhr Universität Bochum
Some of our recent measurements in air planes (CANADAIR) (fig. 1) and tanks (fig. 2) have shown very high communication levels under protection headsets. Under the helmet of the driver of a tank running at high speed (50 km/h), the level of the communication signal has been measured to be close to 110 dB. It is obvious that soldiers exposed to such levels undergo the risk of threshold shift. This is the reason why it is important to know, why the soldiers need such high communication levels to obtain acceptable speech intelligibility. As it is not possible to expose subjects regularly to such high levels during an experiment, a physical method to evaluate the intelligibility of speech is needed. A widely used method is the STIDAS proposed by Steeneken at the TNO. Using this method as published, it measures the physical signal-to-noise ratio for 7 octave bands, starting at 128 Hz. The upward spread of masking that is taken into account has a slope of 35 dB/octave for all levels. Using this method, a 90 dB speech level should lead to a STI of 0.71 under the conditions described before. This means a “good” intelligibility of the communication. However, the levels used (>100 dB) by the pilot of the tank do not support this. A reason for that may be the shape of the noise spectrum under the hearing protector. This noise has a very strong low frequency components (120 dB @ 80 Hz), that may still induce considerable masking at frequencies as high as 4 kHz. As STIDAS doesn’t take into account the nonlinearity of the upward spread of masking due to such stimulation levels, we decided to modify it. The modification we made consisted mainly in using Zwicker’s masking curves (fig. 3) and calculating the signal-to-noise ratio using octave band excitation levels instead of noise levels (fig. 4). Using this calculation method for the given noise (tank at high speed), we realise, that the speech level for “good” rated communication has to be at least 100 dB (110 dB for “excellent”) (fig. 5). The speech level found for the tank driver shows a level that is situated just between this two theoretical speech spectra (fig. 6). These first results show that, for noises with very strong low frequency components, the upward spread of masking as used by STIDAS is not suitable and the masking as described by ZWICKER should been taken into account.
References Zwicker E. und Feldtkeller R., “Das Ohr als Nachrichtenempfänger”, Hirzel Verlag Stuttgart.
IEC 268-16 (1988) “The objective rating of speech intelligibility in auditoria by the ‘RASTI’ method”.
Steeneken H.J.M. (1992) “On measuring and predicting speech intelligibility”, PhD. Thesis, Amsterdam.
Steeneken H.J.M., Verhave J.A. und Houtgast T. (1994) “Description of the STI-measuring method”, TNO-Report TNO-TM 1994 I-2.
AII - 32 RTO-TR-017

APPENDIX II - PROGRAMS AND SUMMARIES OF RSG MEETINGS
RTO-TR-017 AII - 33

APPENDIX II - PROGRAMS AND SUMMARIES OF RSG MEETINGS
AII - 34 RTO-TR-017

APPENDIX II - PROGRAMS AND SUMMARIES OF RSG MEETINGS
B. PERTINENT PUBLISHED MATERIALS
1. Cost-effectiveness of hearing conservation programs /costs of treatment and compensation
Dancer 97 Costs in France Kersenbaum 97 Costs in Germany Ohlin 96 Costs in USA Stevins 97 Costs in Belgium
2-3. New DRC Brinkmann 95 Use of earplugs with LAW Brinkmann 96 ‘Mosaic’-parts for the DRC Brinkmann 97 Relation Belgian FNC to Pfander DRC Brinkmann 97 Relation battle field results to Pfander DRC Brinkmann 97 Modification of Pfander DRC Dancer 95 Comparison of DRCs Dancer 97 Intracochlear peak level measurements Dancer 97 A- vs T-weighting Johnson, Patterson 95 Nonlinear Earplugs Johnson 96 ANSI S3-62 Johnson 96 Three types of nonlinear ear plugs Johnson 97 SPL measurements under earmuff Mayorga 96 Evaluation damage risk models Mayorga 97 Re-evaluation damage risk models Smoorenburg 91 Damage risk for low-frequency impulse noise; the spectral factor
4. Evaluation of Price’s model Mayorga 96 Evaluation of damage risk models Mayorga 97 Re-evaluation of damage risk models Price 96 ARL model Price Air bag study Price 97 New version of ARL model
5. Performance of hearing protectors in impulse noise Buck 95 Why active hearing protectors? Buck 97 Double protection and speech reception Buck 97 Speech reception using the STI Crabtree 97 Performance with ANR Dancer 95-97 Perforated earplug Forrest 95 Acceptability hearing protectors Forrest 97 Performance with hearing protectors Garinther 95 Yugoslavia experience Smoorenburg 95-97 IMPRO studies
RTO-TR-017 AII - 35

APPENDIX II - PROGRAMS AND SUMMARIES OF RSG MEETINGS
6. Assessment of individual susceptibility and early detection of hearing loss Hamernik 95 Shock tube experiments and emissions Hemmert 97 Vulnerable cochlea’s and emissions
7. New perspectives in treatment of acute noise trauma Cudennec 95 Medical treatment Dancer 96 First results Dancer 97 Animal experiments Kersenbaum 97 German protocols
8. Non-auditory effects of blast noise Axelsson 95 Chest wall velocity Axelsson 96 Yugoslavia experiences Axelsson 97 Prospective study Cooper 97 Thoracic rig Lanzendorfer 96-97 Subjective evaluation Mayorga 95 Patho-physiological effects Bio-mechanical effect on lung Mayorga 96 Gastro-intestinal effects Cardio-vascular effects
New developments in measurement techniques Brinkmann? Crabtree? Forrest? Price?
AII - 36 RTO-TR-017

APPENDIX II - PROGRAMS AND SUMMARIES OF RSG MEETINGS
C. PROGRAMME OF THE 1998 RSG 29 MEETING
Location: TNO Human Factors Research Institute, Soesterberg, The Netherlands
Date: October 28-29, 1998
CONTRIBUTIONS: (* denotes summary attached)
1. Medical legal aspects of noise-induced hearing loss in NATO forces M. Kersebaum
2. New perspectives in the treatment of acute noise trauma A. Dancer and Ch. d’Aldin See Ch. 5 of this report
3*. Evaluation of impulse noise criteria using human volunteer data Ph. C. Chan, K.H. Ho, K.K. Kan, J.H. Stuhmiller and M.A. Mayorga
4*. The effects of exposure to intense free-field impulse noise on humans wearing hearing protection: implications for new criteria J.H. Patterson and D.L. Johnson
5. Development of a new ANSI damage risk criterion, report from Working Group S3-62 D.L. Johnson
6*. Development and validation of an Auditory Hazard Assessment Algorithm for the Human ear (AHAAH) as a predictor of hearing hazard and as an engineering tool G.R. Price and J.T. Kalb
7*. Evaluation of hazard indices using chinchilla data base J.H. Patterson, R.P. Hamernik and W.A. Ahroon
8*. Proposal for new damage risk criterion A. Dancer
9. Endocrinal effects from noise S. Siegmann
10. Development of nonlinear ear plugs for impulse noise A. Dancer and K. Buck
11. Cost-effectiveness of hearing conservation programs A. Dancer See Ch. 4 of this report
12* Non-auditory effects of impulse noise M.A. Mayorga
RTO-TR-017 AII - 37

APPENDIX II - PROGRAMS AND SUMMARIES OF RSG MEETINGS
SUMMARIES RSG 29 MEETING OF OCTOBER 1998
3. Evaluation of impulse noise criteria using human volunteer data Ph. C. Chan, K.H. Ho, J.H. Stuhmiller and M.A. Mayorga Jaycor, San Diego, Cal. 92121-1996, USA
Evaluation of impulse noise criteria is becoming more critical as new weapons tend to exceed exposure levels for single hearing protection, such as that set forth by the MIL-STD-1474D’ in the USA. Standards for field application must still use freefield pressure data. There is general belief that the current standards are overly conservative. Four impulse noise auditory injury criteria adopted by NATO countries, namely, the MIL-STD-1474D1 (USA), Pfander2 (Germany), Smoorenburg3 (Netherlands), and LAeq 84 (France), are evaluated against human volunteer data. Data from subjects wearing single hearing protection exposed to increasing blast overpressure effects were obtained from tests sponsored by the US Army Medical Research and Materiel Command5. The hearing protectors used were the US Army RACAL muffs modified with leaks through the seals to simulate poor fitting. The tests were conducted at 3 distances each with 7 intensity levels, and the number of rounds at 6, 12, 25, 50 and 100. Injury threshold was taken as a temporary threshold shift (TTS) of 25 dB at any frequency.
Using logistic regression6, the four criteria were each correlated with the test data. Since the subjects were exposed to blast waveforms covered by the criteria as set forth, the data were analyzed as one data set for the very purpose of evaluation of the criteria for blast protection. The effects of distance was included and tested for statistical significance in the logistic regression procedure without the need of separating the test data according to distance. Not only that no details of the data are lost, but also more statistical effects from other parameters such as subject variability can be analyzed in a coherent manner. Data comparison with the regression result for each criterion is measured by the calculated confidence interval and goodness-of-fit.
The analysis shows that all four criteria are overly conservative by 6-10 dB. Using the worst case condition, the MIL-STD-1474D for single hearing protection can be raised by 9.5 dB for 95% protection at 95% confidence for this group of subjects as tested. Similar conclusions can be drawn for the other three criteria. These results will guide the recommendation of an interim criterion for protection against blast auditory injury for field use for the US Army Medical Research and Materiel Command.
References 1. Military Standard, Noise Limits for Military Material (Metric). March 1991.
2. Pfander, F., et. al. (1980) J Acoust. Soc. Am. 67 (2), Feb. 1980, pp. 628-633.
3. Smoorenburg, G. F. (1992) Noise-Induced Hearing Loss, 1992, pp. 313-324.
4. Dancer, A. L. (1995) Acta Acustica 3, 1995, pp. 539-547.
5. Johnson, D., (1994) USAARL Report 94-2.
6. Hosmer, D. and Lemeshow, S., (1989) Applied Logistic Regression, Wiley, 1989. See also Jaycor Technical Report J299729-99-104.
AII - 38 RTO-TR-017

APPENDIX II - PROGRAMS AND SUMMARIES OF RSG MEETINGS
4. The effects of exposure to intense freefield impulse noise on humans wearing hearing protection: implications for new criteria J.H. Patterson* and D.L. Johnson** * U.S Army Aeromedical Research Laboratory, PO Box 620577, Fort Rucker, AL 36362-0577, USA ** 4719 Mile High Drive, Provo, UT 84604, USA
In a series of studies, human volunteers wearing earmuffs were exposed to high-intensity free-field impulse noise, using explosives. The exposure level was varied from one at which no effects were expected to a maximum level just below the threshold of injury to the lung and upper airway by increasing the amount of explosive. The number of blasts was varied from 6 to 100. Temporary threshold shifts (TTSs) were used as the measure of effects on hearing. The highest level for each number of blasts at which 95 percent of the exposed population would not show a significant TTS was used to establish the maximum safe exposure levels as measured in the open and under the earmuffs. These maximum safe exposure levels exceed the exposure limits used in the United States (U.S.) and other countries.
Reference Proceedings 16th Int. Congress on Acoustics combined with the 135th meeting of the Acoustical Society of America, Seattle, USA, June 20-26, 1998.
6. Development and validation of an Auditory Hazard Assessment Algorithm for the Human ear (AHAAH) as a predictor of hearing hazard and as an engineering tool G.R. Price and J.T. Kalb US Army Research Laboratory, APG, MD 21005 USA
An auditory hazard assessment algorithm (AHAAH) has been developed for use in damage-risk assessment of intense sounds. It was first formulated for the cat ear and validated as a predictor of hazard from a wide range of intense impulsive sounds and was distributed to the RSG. A parallel version was developed for the human ear and was also distributed for use and validation. AHAAH has now been challenged with the available human data from the US Army’s Albuquerque studies and from earlier studies with small arms impulses, an anti-tank rocket etc. AHAAH has accurately predicted the hazard for all impulses tested with human ears (over 60 types and levels). Given that existing standards are all grossly in error for many waveforms important to the military (errors of over 20 dB) and the demonstrated accuracy of the algorithm, AHAAH is proposed as the basis for a new impulse noise standard. In addition to being theoretically based, which maximizes the likelihood that it will be predictive for any impulses that may be interest in the future, the algorithm also provides a display that shows the temporal evolution of hazard from an impulse. This display provides engineering insight into the parts of the waveform that are responsible for damage to the ear. For the first time, it permits the evaluation of any hearing protective device as well as directional or random incidence noise fields. This algorithm is presently being evaluated by the world automobile industry for use in the analysis of the noise of airbag deployment.
Model development As reported over the years in previous RSG meetings, at scientific meetings and in the literature (see bibliography), a mathematical model of the ear intended to assess the hazard from intense impulses had been created first for the cat ear. The cat ear is a mammalian ear similar to the human ear and one which could be tested with intense noise exposures. That model was validated for a wide range of impulse noise exposures, from simple impulses such as a primer in a free field to airbag deployments in a passenger compartment of a vehicle. Peak pressures ranged from 135 to over 170 dB and the number of
RTO-TR-017 AII - 39

APPENDIX II - PROGRAMS AND SUMMARIES OF RSG MEETINGS
impulses in an exposure ranged from 1 to 50. The auditory hazard assessment algorithm (AHAA) modeled loss as mechanical stress within the cochlea and produced a numeric output in the form of auditory damage units (ADUs). The correlation between the auditory damage units (ADUs) and actual hearing losses was 0.94, indicating that the model is highly predictive of hearing loss for exposures at very high intensities. Furthermore, the predicted losses matched both the losses measured audiometrically as well as cellular losses seen histologically.
Given the high degree of correspondence between mammalian ears, a parallel model was created for the human ear (AHAAH). Its variables were chosen to reproduce the conductive properties of the human ear so that it matched the transfer functions measured for the human ear that have been reported in the literature. We are therefore confident that the model’s conductive properties are equivalent to those of the human ear. Almost no data on intracochlear properties exist for man; therefore as an expedient approach, the stapes to basilar membrane displacement ratio in the human version was adjusted so that in its mid-range of frequencies it matched the model for the cat ear. As agreed at the previous RSG meeting, AHAAH was distributed to the RSG in March 1998 for their use and evaluation as a noise standard, predictive for the human ear. In order to facilitate the importation of data into the model and to permit accurate calculation of hazard, a suite of accessory programs was also written and included with the model.
The model as created is intended to produce a response typical of an average ear. However, for use as a noise standard, or to calculate the kind of data reported in studies with human ears e.g. loss for various percentiles of the population, a procedure for modeling the population susceptibility was developed. In essence, based on analysis of existing data, we assume that there is a population “susceptibility” that is normally distributed and has an approximate 6dB standard deviation. In such a case, the response of the 95%ile ear (most susceptible) is modeled by elevating the sound pressure of the impulse by 1.64 standard deviations (10 dB) and processing it with the model. With this approach the response of other percentiles can be easily calculated.
The final links in the predictive process are related to taking the model’s numeric output in Auditory Damage Units (ADUs) and relating them to changes in auditory threshold shift (TS). The formula for the regression line that fitting the cat data was
TS = (26.6 x LN ADUs) –140.1
The threshold shift predicted is the one measured about ½ hour after the exposure. The formula states that 200 ADUs will result in no TS and this should probably be considered a safe “dose”. Other data reported in the literature and from more recent studies suggest, however that a TS of about 15 to 20 dB is likely to recover to normal; in which case 500 ADUs might be considered a dose that is tolerable on occasion. Above 500 ADUs permanent losses are likely to occur with about 0.6 to 0.8 of the TS at ½ hour becoming permanent. The ADUs for all impulses constituting an exposure are simply added and the sum is entered in to the formula to determine the hazard.
Human model validation As it was distributed to the RSG, the model was capable of predicting threshold shift from any waveform and with any hearing protector. However, the basic question that still needed to be addressed was whether or not the prediction matched the actual threshold shifts experienced by human subjects.
The test of the model undertaken was in the classic form, i.e. a model developed with one data set (the cat ear transmogrified into a human form) was then tested with data sets not used in its creation. An extensive data set has been developed by the US Army during tests at Albuquerque (Johnson and Patterson, also reported in this document). In these tests 4 different waveforms were produced by explosive sources and
AII - 40 RTO-TR-017

APPENDIX II - PROGRAMS AND SUMMARIES OF RSG MEETINGS
presented at 7 levels to subjects wearing ear muffs with defeated seals producing almost no low-frequency attenuation. The defeated seal was intended to simulate a poorly fitted protector, such as one might occasionally find in the field.
The Albuquerque studies were designed with an exposure matrix for any given type of impulse which mapped rising peak pressures on the vertical axis (7 levels, 3 dB between levels) and increasing numbers of impulses on the horizontal axis (6, 12, 25, 50 and 100 impulses). In principle, an individual could have moved anywhere within the matrix; however most subjects were tested on 6 impulses at each of the 7 levels and on increasing numbers of impulses at level 6. For the 7 tests with 6 impulses, the number of ears tested was near 60. And for the tests with increasing numbers of impulses at level 6 the number of ears dropped as failures occurred and Ss were not tested further. The absolute values of the peak pressures at the various levels in the experimental design varied slightly as a function of the duration of the impulse; but the pressure range was in the 178 to 194 dB region.
In addition to these data, other data for human ears were also available from the literature and from data provided by RSG members. Calculation with AHAAH requires a waveform that could can be entered into a computer, which meant that much of the older data could not be used. Nevertheless, data from the FNC, M14, M16, and G3 rifles were available as were impulses from LAW, French 120mm mortar and spark-gap discharges.
The results from AHAAH were presented for each waveform (over 60 tests of the model), and in each case the model’s predictions were consistent with the data i.e. no effects predicted where none were seen, the correct size of effect in the correct proportion of the population where effects were seen and no case in which effects were seen when the model said there should be none.
Additional features of the modeling approach were also demonstrated, which includes the inclusion of middle ear muscle effects in evaluations, rational rating of all types of hearing protectors and their inclusion in analysis (to include non-linear protectors), rating of hazard where no protection is worn, and rating of hazard in sound fields that are either directional or random incidence.
The ability of AHAAH to accurately rate hazard stands in contrast to all the current Damage Risk Criteria (DRC) for impulse noise. In general, if they fit the Albuquerque data, then they are in error by 20 dB or more for small arms and vice versa. Without a theoretical basis, they can be made to fit new data sets only by arbitrary manipulation. Then when a new impulse shape is encountered, how is one to decide into which “class” of impulse it fits?
AHAAH has met the challenge of predicting hazard for the full range of both protected and unprotected ears exposed a wide range of impulse types. In addition it has great flexibility in handling many additional issues associated with impulse noise exposure. We propose it to the RSG as a new standard method for noise analysis.
AHAAH has also been given to the automotive industry for use in evaluating airbag noise hazard. The airbag noise subcommittee of the Society of Automotive Engineers (SAE) has adopted AHAAH for trial use and we have presented it to both the US and German automobile industry engineers who are now using it to evaluate design changes in airbags.
Finally AHAAH will be presented to an American National Standards Institute committee for consideration as a noise standard early in 1999.
RTO-TR-017 AII - 41

APPENDIX II - PROGRAMS AND SUMMARIES OF RSG MEETINGS
References Price, G. R. and Kalb, J. T. (1998). “A New Approach: The Auditory Hazard Assessment Algorithm (AHAA)” Talk to International Conference on Biological Effects of Noise – Australia, Conference Programme and Abstract Book, p. 127 also Conference Proceedings, 2, 725-728.
Price, G. R. (1998) “Airbag noise hazard: from theory toward validation”, J. Acoust Soc. Am., 104, 1769. Invited presentation, Fall Meeting Acoustical Society of America, Norfolk, VA.
Price, G. R. and Kalb, J. T. (1998). “Hearing protectors and hazard from impulse noise: melding method and models”, J. Acoust. Soc. Am.103, 2878. Invited paper ICA/ASA meeting Seattle, WA Also paper in Proceedings ICA/ASA, pp. 1145-1146.
Kalb, J. T. and Price, G. R. (1998). “Modeling the effect of a hearing protector on the waveform of intense impulses”, J. Acoust. Soc. Am. 103, 2878 paper at joint ICA/ASA meeting Seattle, WA Also paper in Proceedings ICA/ASA pp. 1149-1150.
Price, G. R. (1998). “Standard for Damage Risk for Impact/Impulse Noise” in proceedings of 23rd Annual NHCA Hearing Conservation Conference, Albuquerque, NM. 10pp.
Price, G. R. (1997). Airbag noise hazard examined with mathematical model of the human ear”, J. Acoust. Soc. Am., 102, 3201.
Price, G. R. and Kalb, J. T. (1997). “Progress in the development and validation of the human hazard model”, presented to meeting of the 1997 meeting of NATO RSG 29, Centre for Human Sciences, DERA, Farnborough, UK.
Mattox, D.E., Lou, W., Kalb, J. T. and Price, G. R. (1997). “Histologic changes of the cochlea after airbag deployment” In Abstracts of the twentieth midwinter meeting of the Association for Research in Otolaryngology, St. Petersburg, FL, 3797, p. 200.
Kalb, J. T and Price, G. R. (1996). “Modeling biophysical systems with electroacoustic elements” Presented to meeting of NATO RSG 29, on Reconsideration of the Effects of Impulse Noise (AC/243, Panel 8), APG, MD.
Kalb, J. T and Price, G. R. (1996). “Mathematical models of the ear: transfer functions from free field to the cochlea”, Presented to meeting of NATO RSG 29, on Reconsideration of the Effects of Impulse Noise (AC/243, Panel 8), APG, MD.
Price, G. R. and Kalb, J. T (1996). “Modeling the hazard from intense sounds: the nonlinear middle ear, energy dissipation within the middle ear, middle ear muscle activity, and intracochlear mechanisms” Presented to meeting of NATO RSG 29, on Reconsideration of the Effects of Impulse Noise (AC/243, Panel 8), APG, MD.
Price, G. R. and Kalb, J. T. (1996). “Validation of the model with hearing loss data”, Presented to meeting of NATO RSG 29 on Reconsideration of the Effects of Impulse Noise (AC/243, Panel 8), APG, MD.
Price, G. R. and Kalb, J. T. (1996). “Issues in using a model as a DRC: hearing protectors, source azimuth, and random incidence corrections”, Presented to meeting of NATO RSG 29 on Reconsideration of the Effects of Impulse Noise (AC/243, Panel 8), APG, MD.
Price, G. R. and Kalb, J. T. (1996). “Extension of the model as an engineering design tool”, Presented to meeting of NATO RSG 29 on Reconsideration of the Effects of Impulse Noise (AC/243, Panel 8), APG, MD.
AII - 42 RTO-TR-017

APPENDIX II - PROGRAMS AND SUMMARIES OF RSG MEETINGS
Price, G. R. and Kalb, J. T. (1996). “Practical application of the model to current RSG problems”, Presented to meeting of NATO RSG 29 on Reconsideration of the Effects of Impulse Noise (AC/243, Panel 8), APG, MD.
Price, G. R. and Kalb, J. T. (1996) “Evaluation of hazard from intense sound with a mathematical model of the human ear”, J. Acoust. Soc. Am, 100, 2674.
Price, G. R., Rouhana, S. W., and Kalb, J. T. (1996). “Hearing hazard from the noise of air bag deployment”, J. Acoust. Soc. Am., 99, 2464.
Price, G. R. and Kalb, J. T. (1996). “Modeling auditory hazard from impulses with large low-frequency components”, J. Acoust. Soc. Am., 99, 2464.
Price, G. R., Pierson, L. L., Kalb, J. T and Mundis, P. (1995). “Validating a mathematical model of noise hazard with varying numbers of rounds and peak pressures produced by a rifle”, J. Acoust. Soc. Am. 97, 3343.
Pierson, L. L., Price, G. R., Kalb, J. T. and Mundis, P. A. (1995). “Comparison of impulse noise effects generated by two rifle muzzles”, J. Acoust. Soc. Am., 97, 3344.
Price, G. R. (1994). “Hazard from impulse noise: Problems and prospects,” J. Acoust. Soc. Am. 95, 2861-2862 (invited paper).
Price, G. R. (1993). “Integrated mathematical model of the ear. II. Application and insights,” J. Acoust. Soc Am. 93, 2313.
Price, G. R. (1992) “Sources of variability in the ear’s response to impulse noise”, J. Acoust. Soc. Am. 92, 2408.
Price, G. R. “Importance of Spectrum: Theoretical Basis” in Noise-Induced Hearing Loss edited by Dancer, Henderson, Salvi & Hamernik, (St. Louis: Mosby Year Book, 1992) pp 349-360.
Price, G. R. and Kalb, J. T. (1991). “Insights into hazard from intense impulses from a mathematical model of the ear”, J. Acoust. Soc. Am. 90, 219-227.
Price, G. R. and Kalb, J. T. (1990). “Rating Hazard from Intense Sounds Through Theoretically Based Non-Linear Mathematical Modeling,” AAAS Annual Meeting Abstracts, p. 178.
Price, G. R. and Kalb, J. T. (1990). “A New Approach to a Damage Risk Criterion for Weapons Impulses”, Scand. Audiol. Suppl 34, 21-37.(invited paper) Also HEL TM 19-91.
Price, G. R., Kim, H. N., Lim, D. J. and Dunn, D. (1989). “Hazard from weapons impulses: Histological and electrophysiological evidence,” J. Acoust. Soc. Am. 85, 1245-1254. Also HEL TM 1-89.
Price, G. R. and Wansack, S. (1989). “Hazard from an intense mid-range impulse,” J. Acoust. Soc. Am. 86, 2185-2191.
7. Evaluation of hazard indices using chinchilla data base J.H. Patterson*, R.P Hamernik** and W.A. Ahroon** * 4719 Mile High Drive, Provo, UT 84604, USA ** Auditory Research Laboratories, Plattsburgh State University, Plattsburgh, NY 12901, USA
RTO-TR-017 AII - 43

APPENDIX II - PROGRAMS AND SUMMARIES OF RSG MEETINGS
Hearing loss and sensory cell loss data, obtained from 909 chinchillas exposed to one of 137 different impulse noise or blast wave exposure paradigms, were statistically analyzed. The objective was to extract relations between the effects of the exposure on the auditory system (effects metrics) and metrics used to characterize the blast wave exposure. Specifically the following two questions were asked:
(a) What is the best indicator of the amount of hazard associated with an impulse noise exposure?
(b) How does the hazard of an impulse noise exposure accumulate with increasing numbers of impulses?
Two analytical approaches were used. Both approaches indicated that the P-weighting functions or one of its derivatives (Pl-, P2- or R-weighting) best organized the metrics of the effects. Depending on the analytical approach, either an energy trading rule of 10log10(N) or 6log10(N); where N is the number of impulses, best organized the data for N between 10 and 100. For exposures of between 1 and 10 impulses, a region of the parametric space that is of considerable practical significance, there is insufficient data to form any conclusions. For this region the limited data suggest that an energy trading rule i.e., 10 log (N) does not work.
8. Proposal for new damage risk criterion A. Dancer Institut Franco-Allemand de Recherches de Saint-Louis, PO Box 34, 68301 Saint Louis, Cedex France
To evaluate the hearing hazard due to weapon noises, a number of criteria have been proposed. These criteria can be divided in three main categories:
•
•
•
the first ones (CHABA, 1968; Pfander criterion, 1980, 1994; MIL STD 1474B (M2), 1984; Smoorenburg criterion, 1982...) use the peak pressure, the duration(s) (measured in the free field) and the number of the impulses, to evaluate the hazard. Among those, the criteria of Pfander and Smoorenburg (which are characterized by a line with a slope of -3dB/doubling of either the duration and/or the number of impulses), are roughly in agreement with the iso-energy principle,
the second ones (Atherley and Martin, 1971; Martin, 1976; Dancer, 1982; DTAT, 1983) are based on the (A-weighted) iso-energy principle. The A-weighting is the standardized curve closest to the threshold-of-hearing curve and approximates the acoustic energy at the input to the inner ear. The amount of acoustic energy is generally expressed as the A-weighted level (in decibels) presented during 8 hours which corresponds to the same energy: LAeq8. This method is very close to that used for occupational exposure in the industry (ISO R-1999) where it applies as well to impulse noises (with some limitations) as to continuous noises,
the third ones (Price and Kalb, 1991, 1992) are based on a physical-mathematical model of the auditory periphery. They aim to take into account the actual mechanics of the middle and of the inner ears (including the nonlinearities), up to the highest stimulation levels, and to calculate an index of hazard.
These different criteria give different evaluations of the hearing hazard for unprotected ears (this is especially true for the noises of the large weapons). They also disagree on the predicted efficiency of the hearing protectors.
Up to now, the hearing hazard of the weapon noises and the efficiency of the hearing protectors are evaluated according to different criteria in the different NATO countries (MIL-STD 1474B in the USA, Pfander criterion in Germany, Smoorenburg criterion in The Netherlands, DTAT 1983 in France...). Since the different countries disagree on the hazardous levels and on the actual efficacy of the hearing
AII - 44 RTO-TR-017

APPENDIX II - PROGRAMS AND SUMMARIES OF RSG MEETINGS
protectors, they cannot standardize their training and combat exposure guidelines for a given weapon, they cannot standardize their armament (the same weapon can be considered as “safe” in one country and as “unsafe” in another one) and they cannot standardize the head equipment of their soldiers (a same hearing protector can be considered as efficient in one country and inefficient in another one).
Therefore, it is highly desirable to get to an agreement for a common auditory Damage Risk Criterion (DRC) in the NATO countries. Up to now, in each country many historical, regular, experimental, and scientific reasons have been put forward to postpone the implementation of a (new) common DRC. It is the task of the Research Study Group n°29 to clarify the present situation and to make a proposition.
First, it should be underlined that no perfect DRC presently exists (i.e., a DRC able to evaluate accurately the hazard in all exposure conditions: for impulse and continuous noises, for small and large weapons, for free field and reverberant exposures, for protected and unprotected ears...). However, as it is impossible to wait longer for a perfect DRC to be found, tested and recognized by all countries, the RSG 29 members looked for the simplest, the most practical and the most acceptable solution available today.
This should not be considered as a final solution but as a step towards, improving significantly the present situation, and as a reasonable solution for the short and the middle term.
Thanks to the many physical measurements, animal experiments and human observations performed by the members and the experts of the RSG 29 during the past 17 years (NATO, 1987), it can be shown (Dancer, 1992; Smoorenburg, 1992; Dancer et al., 1995, 1996) that:
•
•
•
•
•
•
the LAeq8 method with a limit at 85dB allows a limitation of the hearing hazard comparable to that aimed at by the other criteria,
the LAeq8 method allows the assessment of the hazard for all kinds of weapon noises according to the well-recognized procedure used for occupational exposure (ISO R-1999). It can be applied as well to impulses in free field and/or in reverberant conditions (either for small or for large caliber weapons), as to combined exposures: impulse and continuous noise,
the LAeq8 method reconciles the occupational and the military criteria: the auditory hazard is evaluated along the same rules in military and in occupational exposures,
the LAeq8 method does not lead to a too large overprotection and hence to an unjustified restriction of the use of the weapons as it is the case for most of the other criteria (especially with respect to the large weapon noises),
the LAeq8 method allows to evaluate the hearing protection afforded by earplugs or earmuffs from classical Insertion-Loss data obtained by Real-Ear-At-Threshold or Acoustical-Test-Fixtures methods in a more accurate and less conservative way than most of the other criteria,
the LAeq8 method can be used with the help of the measuring equipment and the measuring procedures which are presently available in many military facilities and in many companies.
Therefore, the RSG 29 recommends the use of the A-weighted* iso-energy method with a limit of 85 dB as a Damage Risk Criterion for weapon noises.
For the unprotected ear, the measurements should be made with the microphone located at the position normally occupied by the head of the subject, the subject being absent. For the protected ear, the Insertion Loss (Berger, 1986) corresponding to the hearing protection will be subtracted from the measurement performed at the head location (see beyond). The Insertion Loss of the hearing protection will be measured, as a function of frequency, preferably in comparable exposure conditions (i.e., by means of an
RTO-TR-017 AII - 45

APPENDIX II - PROGRAMS AND SUMMARIES OF RSG MEETINGS
ATF). Therefore, it will take into account the possible nonlinear behavior of the hearing protection, or its Active Noise Reduction properties.
However, some precautions must be taken and some remarks must be formulated:
•
•
•
because of the existence of a “critical level” (Kryter and Garinther, 1966) unprotected ears should not be exposed to a peak pressure larger than 160 dB SPL whatever the A-weighted energy of the impulse(s) is,
for protected ears exposed to large weapon noises of very high peak levels, the LAeq8 method based on Insertion Loss measurements of the hearing protectors may underestimate (by 5 to 20 dB) the actual protection efficiency of the hearing protector (especially when earmuffs are used): Johnson and Patterson, 1992, Patterson et al., 1993a, Patterson and Johnson, 1996.
This is probably due to the nonlinear behavior of the middle and inner ears (Price and Kalb, 1991; Price, 1992).
If, in exposure conditions which are of importance for the military (howitzers, mortars, anti-tank weapons...), the security of the soldier’s hearing is not warranted when using a Damage Risk Criterion based on the A-weighted iso-energy method with a limit of 85 dB, then the actual hearing hazard can be more precisely evaluated with the help of the well-documented experimental results which have been obtained in human subjects (Dancer et al., 1992; Johnson and Patterson, 1992; Patterson et al., 1993a; Patterson and Johnson, 1996). Therefore, it is possible to avoid an overprotection and an unjustified restriction of the use of the weapons.
The RSG 29 recommends to actively continue the studies in order to develop and evaluate new DRCs (i.e., based on the Price and Kalb model) which could be more representative of the auditory hazard in various exposure conditions and constitute a powerful tool for research and development purposes.
* Other weighting functions: “Threshold” weighting, “P” weighting (Patterson et al., 1993b) have not demonstrated decisive advantages which could justify the change for another weighting function and establish a DRC which would then be completely distinct of the occupational DRC (ISO 1999).
References Atherley G.R.C. and Martin A.M. (1971) “Equivalent continuous noise level as a measure of injury from impact and impulse noise”, Ann. Occup. Hyg., 14, 11-28.
Berger E.H. (1986) “Methods of measuring the attenuation of hearing protection devices”, J. Acoust. Soc. Am., 1655-1687.
CHABA (National Academy of Sciences, National Research Council, Committee on Hearing, Bioacoustics and Biomechanics) (1968) “Proposed damage-risk criterion for impulse noise (gunfire)”, Ward W.D. Ed., Report of Working Group 57.
Dancer A. (1982) “Iso-energy principle and A-weighting in the rating of the hazard of noise exposure in the military environment”, in: “Hearing and Hearing Prophylaxis”, Borchgrevink H. Ed., Scandinavian Audiology, Suppl. 16, 49-52.
Dancer A. (1992) “Status and shortcomings of military noise standards”, in: “Noise-Induced Hearing Loss”, Dancer A.L., Henderson D., Salvi R. and Hamernik R.P. (eds), Saint-Louis, Mosby Year Book, 513-520.
Dancer A., Grateau P., Cabanis A., Barnabe G., Cagnin G., Vaillant T. and Lafont D. (1992) “Effectiveness of earplugs in high-intensity impulse noise”, J. Acoust. Soc. Am., 91, 1677-1689.
AII - 46 RTO-TR-017

APPENDIX II - PROGRAMS AND SUMMARIES OF RSG MEETINGS
Dancer A. and Franke R. (1995) “Hearing Hazard from Impulse Noise: a Comparative Study of Two Classical Criteria for Weapon Noises (Pfander Criterion and Smoorenburg Criterion) and the LAeq8 Method”, Acta Acustica, 3, 539-547.
Dancer A., Franke R., Parmentier G. and Buck K. (1996) “Hearing Protector Performance and NIHL in Extreme Environments: Actual performance of hearing protectors in impulse noise/nonlinear behaviour” in: Scientific Basis of Noise-Induced Hearing Loss, A. Axelsson, H. Borchgrevink, RP Hamernik, PA.
Hellstrom, D. Henderson and RJ Salvi eds., Thieme, New York, 321-338 DTAT (Direction Terrestre des Armements Terrestres) (1983) “Recommendation on evaluating the possible harmful effects of noise on hearing” (AT-83/27/28), May 1983.
Johnson D. and Patterson J. (1992) “Rating of hearing protector performance for impulse noise”, in: University of Kentucky (ed), Proceedings of Hearing Conservation Conference, 103-106.
Kryter K.D. and Garinther G.R. (1966) “Auditory effects of acoustic impulses from firearms”, Acta Oto-Laryngol., suppl. 211.
Martin A.M. (1976) “The equal energy concept applied to impulse noise” in: “Effects of Noise on Hearing”, Henderson D, Hamernik R.P., Dosanjh D.S. and Mills J.H. (eds), Raven Press, New York, 421-453.
MIL-STD 1474B (M2) (1984) “Military Standard: Noise limits for Army materiel”, Department of Defense, USA.
NATO (1987) “Research Study Group on the Effects of Impulse Noise”, AC/243 (Panel 8/RSG 6) D/9, February 1987.
Patterson J., Mozo B.T. and Johnson D.(1993) “Actual effectiveness of hearing protection in high level impulse noise”, in: “Noise as a Public Health Problem”, vol. 3, M. Vallet (ed), Bron, France, INRETS, 122-127.
Patterson J.H., Hamernik R.P., Hargett C.E. and Ahroon W.A. (1993) “An isohazard function for impulse noise”, J. Acoust. Soc. Am., 93, 2860-2869.
Patterson J.H. and Johnson D.L. (1996) “Protection of hearing against high-intensity impulse noise”, J. Acoust. Soc. Am., 99, 23.
Pfander F., Bongartz H., Brinkmann H. and Kietz H.(1980) “Danger of auditory impairment from impulse noise: a comparative study of the CHABA damage-risk criteria and those of the FRG”, J. Acoust. Soc. Am., 67, 628-633.
Pfander F. (1994) “Das Schalltrauma”, Bundesministerium der Verteidigung, Referat Hygiene, Arbeits-Umweltmedizin, Bonn, June 1994.
Price G.R., Kalb J.T. (1991) “Insights into hazard from intense impulses from a mathematical model of the ear”, J. Acoust. Soc. Am., 90, 219-227.
Price G.R. (1992) “Modeling the ear’s response to intense impulses and the development of improved damage risk criteria”, in University of Kentucky (ed): Proceedings Hearing Conservation Conference, 93-96.
Smoorenburg G.F. (1982) “Damage risk criteria for impulse noise”, in: “Noise Induced Hearing Loss”, Hamernik R.P., Henderson D. and Salvi R. Eds, Raven Press, New York, 471-490.
RTO-TR-017 AII - 47

APPENDIX II - PROGRAMS AND SUMMARIES OF RSG MEETINGS
AII - 48 RTO-TR-017
Smoorenburg G.F. (1992) “Damage risk for low-frequency impulse noise: the spectral factor in noise-induced hearing loss”, in: “Noise-Induced Hearing Loss”, Dancer AL, Henderson D, Salvi R. and Hamernik R.P. (eds), Saint-Louis, Mosby Year Book, 313-324.
Price, G. R. (1989) “Growth of threshold shift from intense impulses: Implications for basic loss mechanisms”, J. Acoust. Soc. Am. 85, S47.
Kalb, J. T. and Price, G. R. Mathematical model of the ear’s response to weapons impulses. In: Proceedings of the Third Conference on Weapon Launch Noise Blast Overpressure, U.S. Army Ballistics Research Lab, Aberdeen Proving Ground, MD 21005-5001, 1987.
Price, G.R., & Kalb, J.T. (1986). Mathematical model of the effect of limited stapes displacement on hazard from intense sounds. Journal of the Acoustical Society of America, 80, S123.
12. Non-auditory effects of impulse noise M.A. Mayorga
Department of Respiratory Research, Division of Medicine, Walter-Reed Army, Institute of Research, Washington, DC 20307-5100, USA
Primary blast injury occurs in civilian and military detonations and from the firing of weapon systems. The pathology of primary blast injury has been reported for the last 70 years and has primarily been limited to descriptions of gross pathology and histology. Commonly accepted tenets have not been confirmed as blast overpressure experiments in enclosures and with multiple detonations have been conducted. Organ systems other than the ear and the lung are playing a greater role in injury definition and research importance. This paper* is an overview and update of the current understanding of the pathology of primary blast injury.
*This abstract is taken from: The pathology of primary blast overpressure injury, M. A. Mayorga, Toxicology 121, 17-28 (1997). The reader is referred to Vol 121 of Toxicology which is a special issue on the molecular mechanisms of blast overpressure-induced injury.

RTO-TR-017
REPORT DOCUMENTATION PAGE
1. Recipient’s Reference 2. Originator’s References 3. Further Reference 4. Security Classification of Document
RTO-TR-017 AC/323(HFM-022)TP/17
ISBN 92-837-1105-X UNCLASSIFIED/ UNLIMITED
5. Originator Research and Technology Organization North Atlantic Treaty Organization BP 25, F-92201 Neuilly-sur-Seine Cedex, France
6. Title Reconsideration of the Effects of Impulse Noise
7. Presented at/Sponsored by
the RTO Human Factors and Medicine Panel (HFM).
8. Author(s)/Editor(s) 9. Date
Multiple April 2003
10. Author’s/Editor’s Address 11. Pages
Multiple 114
12. Distribution Statement
There are no restrictions on the distribution of this document. Information about the availability of this and other RTO unclassified publications is given on the back cover.
13. Keywords/Descriptors
Acoustic measurement Aging aircraft Auditory defects Blast injuries Damage assessment Dynamic pressure Ear protectors Guns (ordnance) Hearing protection Human factors engineering Impulse energy reduction
Impulse noise Impulse noise protection NIHL (Noise-induced Hearing Loss) Noise (sound) Noise reduction Occupational health and safety Overpressure Safe Distance Safety engineering Sound pressure
14. Abstract
This report contains the main outcome of the work constituted by NATO Research Study Group RSG.29 “Reconsideration of the effects of impulse noise”. The main objective of the work of RSG.29 was to assess the risk of hearing loss from exposure to impulse sounds, by identifying occurrences which are hazardous and by developing measures which will protect hearing. This final report is not a consensus report of the entire RSG. It focuses on the risk of auditory damage from impulse noise (rifles and blasts) and gives recommendations for good and safe criteria for the exposure to impulse noise generated by weapons. It contains a chapter on a model to predict the risk of hearing damage (AHAAH model) and a chapter on hearing protection, primarily based on data from large caliber impulses. Furthermore, attention is given to hearing conservation programs and to the treatment of acute noise trauma.

RTO-TR-017
This page has been deliberately left blank
Page intentionnellement blanche

NORTH ATLANTIC TREATY ORGANISATION RESEARCH AND TECHNOLOGY ORGANISATION
BP 25
F-92201 NEUILLY-SUR-SEINE CEDEX • FRANCE Télécopie 0(1)55.61.22.99 • E-mail [email protected]
DIFFUSION DES PUBLICATIONS
RTO NON CLASSIFIEES
Les publications de l’AGARD et de la RTO peuvent parfois être obtenues auprès des centres nationaux de distribution indiqués ci-dessous. Si vous souhaitez recevoir toutes les publications de la RTO, ou simplement celles qui concernent certains Panels, vous pouvez demander d’être inclus soit à titre personnel, soit au nom de votre organisation, sur la liste d’envoi. Les publications de la RTO et de l’AGARD sont également en vente auprès des agences de vente indiquées ci-dessous. Les demandes de documents RTO ou AGARD doivent comporter la dénomination « RTO » ou « AGARD » selon le cas, suivi du numéro de série. Des informations analogues, telles que le titre est la date de publication sont souhaitables.
Si vous souhaitez recevoir une notification électronique de la disponibilité des rapports de la RTO au fur et à mesure de leur publication, vous pouvez consulter notre site Web (www.rta.nato.int) et vous abonner à ce service.
CENTRES DE DIFFUSION NATIONAUX
ALLEMAGNE FRANCE PAYS-BAS Streitkräfteamt / Abteilung III O.N.E.R.A. (ISP) Royal Netherlands Military Fachinformationszentrum der 29, Avenue de la Division Leclerc Academy Library
Bundeswehr (FIZBw) BP 72, 92322 Châtillon Cedex P.O. Box 90.002 Friedrich-Ebert-Allee 34, D-53113 Bonn 4800 PA Breda GRECE (Correspondant)
BELGIQUE Defence Industry & Research POLOGNE Etat-Major de la Défense General Directorate, Research Directorate Armament Policy Department Département d’Etat-Major Stratégie Fakinos Base Camp, S.T.G. 1020 218 Niepodleglosci Av. ACOS-STRAT-STE – Coord. RTO Holargos, Athens 00-911 Warsaw Quartier Reine Elisabeth Rue d’Evère, B-1140 Bruxelles HONGRIE PORTUGAL Department for Scientific Analysis Estado Maior da Força Aérea
CANADA Institute of Military Technology SDFA - Centro de Documentação DSIGRD2 Ministry of Defence Alfragide Bibliothécaire des ressources du savoir H-1525 Budapest P O Box 26 P-2720 Amadora R et D pour la défense Canada Ministère de la Défense nationale ISLANDE REPUBLIQUE TCHEQUE 305, rue Rideau, 9e étage Director of Aviation DIC Czech Republic-NATO RTO Ottawa, Ontario K1A 0K2 c/o Flugrad VTÚL a PVO Praha
Reykjavik Mladoboleslavská ul. DANEMARK Praha 9, 197 06
Danish Defence Research Establishment ITALIE Česká republika Ryvangs Allé 1, P.O. Box 2715 Centro di Documentazione DK-2100 Copenhagen Ø Tecnico-Scientifica della Difesa ROYAUME-UNI
Via XX Settembre 123 Dstl Knowledge Services ESPAGNE 00187 Roma Kentigern House
INTA (RTO/AGARD Publications) Room 2246 Carretera de Torrejón a Ajalvir, Pk.4 LUXEMBOURG 65 Brown Street 28850 Torrejón de Ardoz - Madrid Voir Belgique Glasgow G2 8EX
ETATS-UNIS NORVEGE TURQUIE
NASA Center for AeroSpace Norwegian Defence Research Establishment Millî Savunma Başkanliği (MSB) Information (CASI) Attn: Biblioteket ARGE Dairesi Başkanliği (MSB)
Parkway Center, 7121 Standard Drive P.O. Box 25, NO-2007 Kjeller 06650 Bakanliklar - Ankara Hanover, MD 21076-1320
AGENCES DE VENTE
NASA Center for AeroSpace The British Library Document Canada Institute for Scientific and Information (CASI) Supply Centre Technical Information (CISTI)
Parkway Center, 7121 Standard Drive Boston Spa, Wetherby National Research Council Hanover, MD 21076-1320 West Yorkshire LS23 7BQ Acquisitions, Montreal Road, Building M-55 ETATS-UNIS ROYAUME-UNI Ottawa K1A 0S2, CANADA
Les demandes de documents RTO ou AGARD doivent comporter la dénomination « RTO » ou « AGARD » selon le cas, suivie du numéro de série (par exemple AGARD-AG-315). Des informations analogues, telles que le titre et la date de publication sont souhaitables. Des références bibliographiques complètes ainsi que des résumés des publications RTO et AGARD figurent dans les journaux suivants :
Scientific and Technical Aerospace Reports (STAR) Government Reports Announcements & Index (GRA&I) STAR peut être consulté en ligne au localisateur de publié par le National Technical Information Service ressources uniformes (URL) suivant: Springfield
http://www.sti.nasa.gov/Pubs/star/Star.html Virginia 2216 STAR est édité par CASI dans le cadre du programme ETATS-UNIS NASA d’information scientifique et technique (STI) (accessible également en mode interactif dans la base de STI Program Office, MS 157A données bibliographiques en ligne du NTIS, et sur CD-ROM) NASA Langley Research Center Hampton, Virginia 23681-0001 ETATS-UNIS

NORTH ATLANTIC TREATY ORGANISATION RESEARCH AND TECHNOLOGY ORGANISATION
BP 25
F-92201 NEUILLY-SUR-SEINE CEDEX • FRANCE Télécopie 0(1)55.61.22.99 • E-mail [email protected]
DISTRIBUTION OF UNCLASSIFIED
RTO PUBLICATIONS
AGARD & RTO publications are sometimes available from the National Distribution Centres listed below. If you wish to receive all RTO reports, or just those relating to one or more specific RTO Panels, they may be willing to include you (or your Organisation) in their distribution. RTO and AGARD reports may also be purchased from the Sales Agencies listed below. Requests for RTO or AGARD documents should include the word ‘RTO’ or ‘AGARD’, as appropriate, followed by the serial number. Collateral information such as title and publication date is desirable.
If you wish to receive electronic notification of RTO reports as they are published, please visit our website (www.rta.nato.int) from where you can register for this service.
NATIONAL DISTRIBUTION CENTRES
BELGIUM GERMANY NORWAY Etat-Major de la Défense Streitkräfteamt / Abteilung III Norwegian Defence Research Département d’Etat-Major Stratégie Fachinformationszentrum der Establishment ACOS-STRAT-STE – Coord. RTO Bundeswehr (FIZBw) Attn: Biblioteket Quartier Reine Elisabeth Friedrich-Ebert-Allee 34 P.O. Box 25, NO-2007 Kjeller Rue d’Evère D-53113 Bonn B-1140 Bruxelles POLAND
GREECE (Point of Contact) Armament Policy Department CANADA Defence Industry & Research 218 Niepodleglosci Av.
DRDKIM2 General Directorate, Research Directorate 00-911 Warsaw Knowledge Resources Librarian Fakinos Base Camp, S.T.G. 1020 Defence R&D Canada Holargos, Athens PORTUGAL Department of National Defence Estado Maior da Força Aérea 305 Rideau Street HUNGARY SDFA - Centro de Documentação 9th Floor Department for Scientific Analysis Alfragide, P-2720 Amadora Ottawa, Ontario K1A 0K2 Institute of Military Technology
Ministry of Defence SPAIN CZECH REPUBLIC H-1525 Budapest P O Box 26 INTA (RTO/AGARD Publications)
DIC Czech Republic-NATO RTO Carretera de Torrejón a Ajalvir, Pk.4 VTÚL a PVO Praha ICELAND 28850 Torrejón de Ardoz - Madrid Mladoboleslavská ul. Director of Aviation Praha 9, 197 06 c/o Flugrad, Reykjavik TURKEY Česká republika Millî Savunma Başkanliği (MSB)
ITALY ARGE Dairesi Başkanliği (MSB) DENMARK Centro di Documentazione 06650 Bakanliklar - Ankara
Danish Defence Research Tecnico-Scientifica della Difesa Establishment Via XX Settembre 123 UNITED KINGDOM
Ryvangs Allé 1 00187 Roma Dstl Knowledge Services P.O. Box 2715 Kentigern House, Room 2246 DK-2100 Copenhagen Ø LUXEMBOURG 65 Brown Street
See Belgium Glasgow G2 8EX FRANCE
O.N.E.R.A. (ISP) NETHERLANDS UNITED STATES 29, Avenue de la Division Leclerc Royal Netherlands Military NASA Center for AeroSpace BP 72 Academy Library Information (CASI) 92322 Châtillon Cedex P.O. Box 90.002 Parkway Center, 7121 Standard Drive 4800 PA Breda Hanover, MD 21076-1320
SALES AGENCIES
NASA Center for AeroSpace The British Library Document Canada Institute for Scientific and Information (CASI) Supply Centre Technical Information (CISTI)
Parkway Center Boston Spa, Wetherby National Research Council 7121 Standard Drive West Yorkshire LS23 7BQ Acquisitions Hanover, MD 21076-1320 UNITED KINGDOM Montreal Road, Building M-55 UNITED STATES Ottawa K1A 0S2, CANADA
Requests for RTO or AGARD documents should include the word ‘RTO’ or ‘AGARD’, as appropriate, followed by the serial number (for example AGARD-AG-315). Collateral information such as title and publication date is desirable. Full bibliographical references and abstracts of RTO and AGARD publications are given in the following journals:
Scientific and Technical Aerospace Reports (STAR) Government Reports Announcements & Index (GRA&I) STAR is available on-line at the following uniform published by the National Technical Information Service resource locator: Springfield
http://www.sti.nasa.gov/Pubs/star/Star.html Virginia 2216 STAR is published by CASI for the NASA Scientific UNITED STATES and Technical Information (STI) Program (also available online in the NTIS Bibliographic STI Program Office, MS 157A Database or on CD-ROM) NASA Langley Research Center Hampton, Virginia 23681-0001 UNITED STATES
ISBN 92-837-1105-X