Embed Size (px)
Citation preview

“Business Pulse” Measuring business friendly regulatory environment in Greece
“A customer satisfaction survey”
October 2018
A survey by:
Introduction
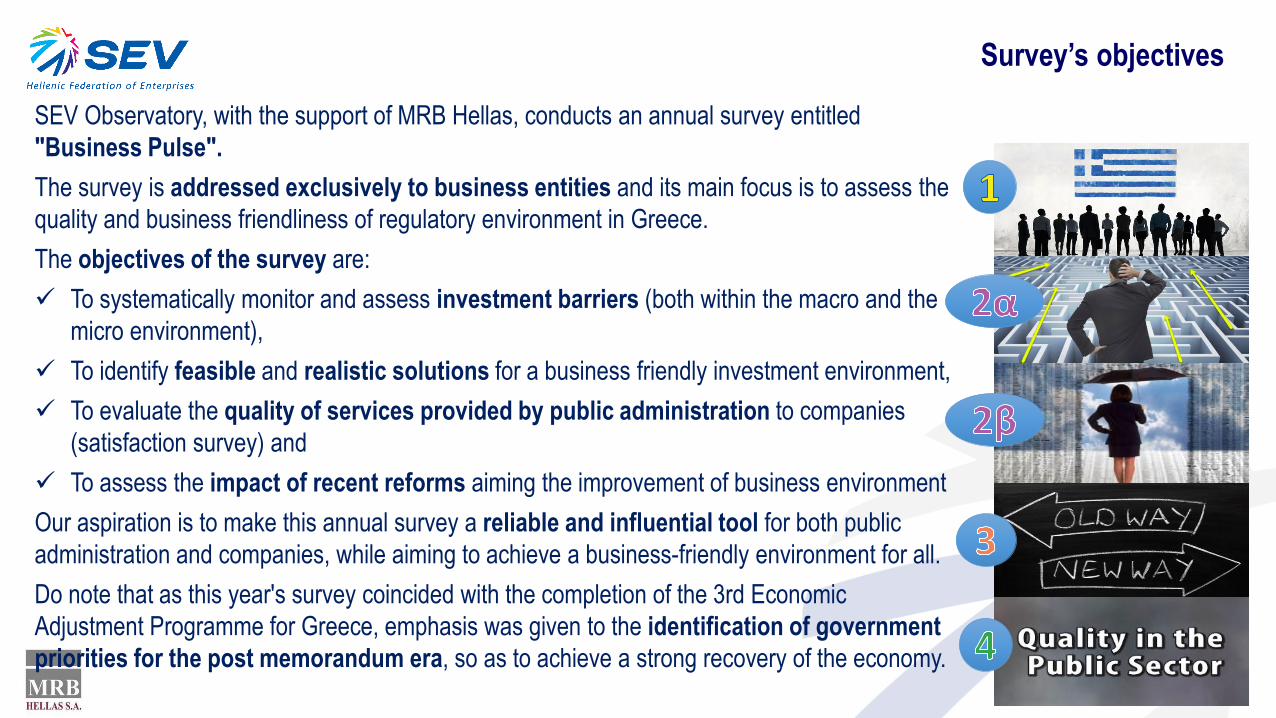
SEV Observatory, with the support of MRB Hellas, conducts an annual survey entitled
"Business Pulse".
The survey is addressed exclusively to business entities and its main focus is to assess the
quality and business friendliness of regulatory environment in Greece.
The objectives of the survey are:
To systematically monitor and assess investment barriers (both within the macro and the
micro environment),
To identify feasible and realistic solutions for a business friendly investment environment,
To evaluate the quality of services provided by public administration to companies
(satisfaction survey) and
To assess the impact of recent reforms aiming the improvement of business environment
Our aspiration is to make this annual survey a reliable and influential tool for both public
administration and companies, while aiming to achieve a business-friendly environment for all.
Do note that as this year's survey coincided with the completion of the 3rd Economic
Adjustment Programme for Greece, emphasis was given to the identification of government
priorities for the post memorandum era, so as to achieve a strong recovery of the economy.
Survey’s objectives
Main findings
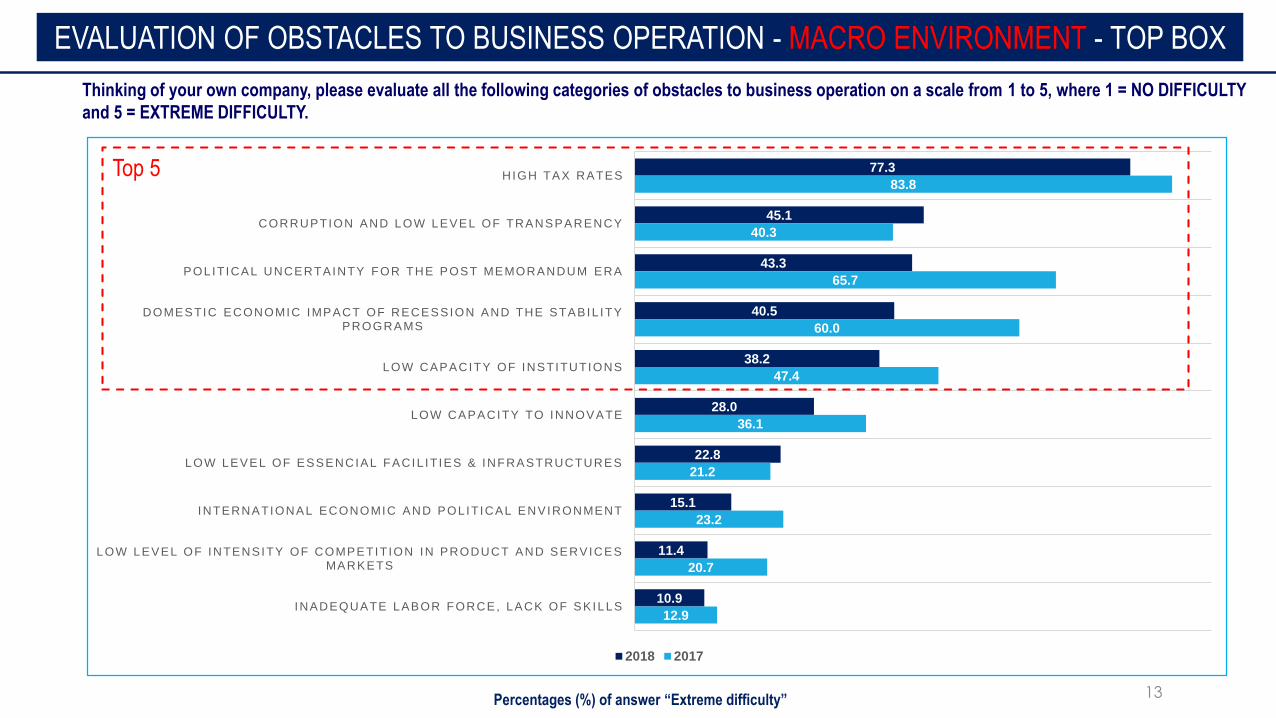
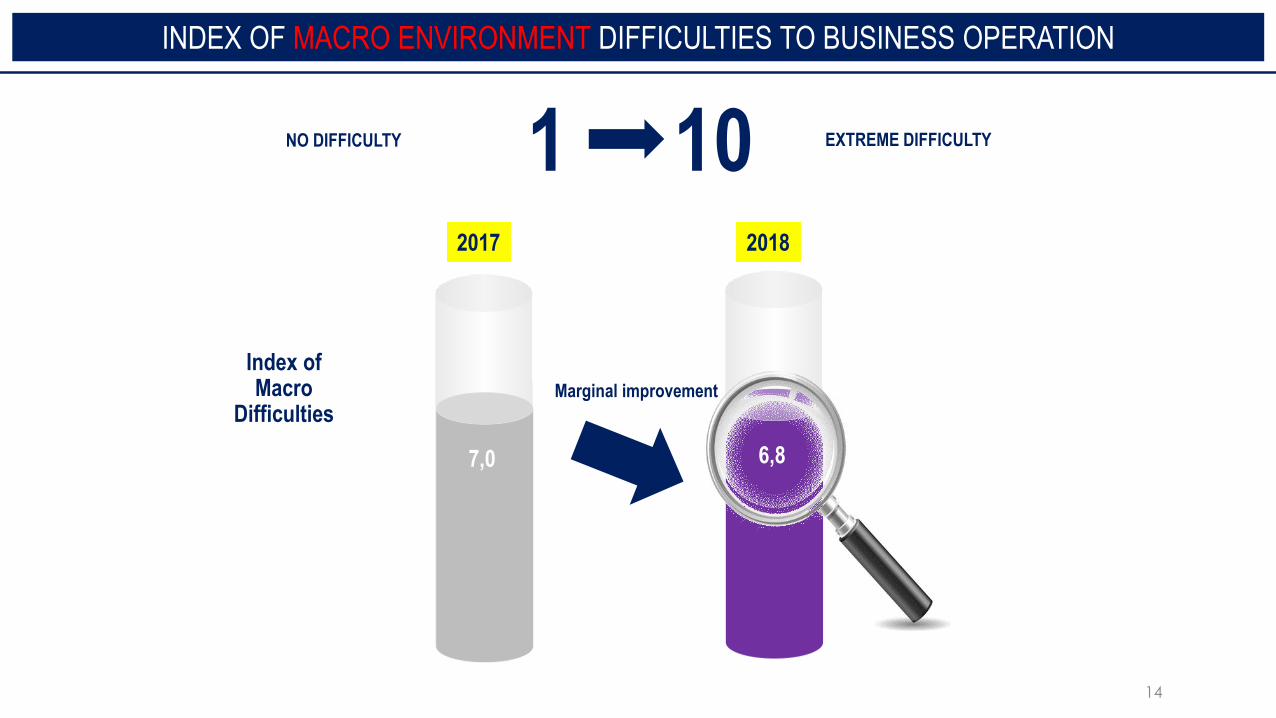
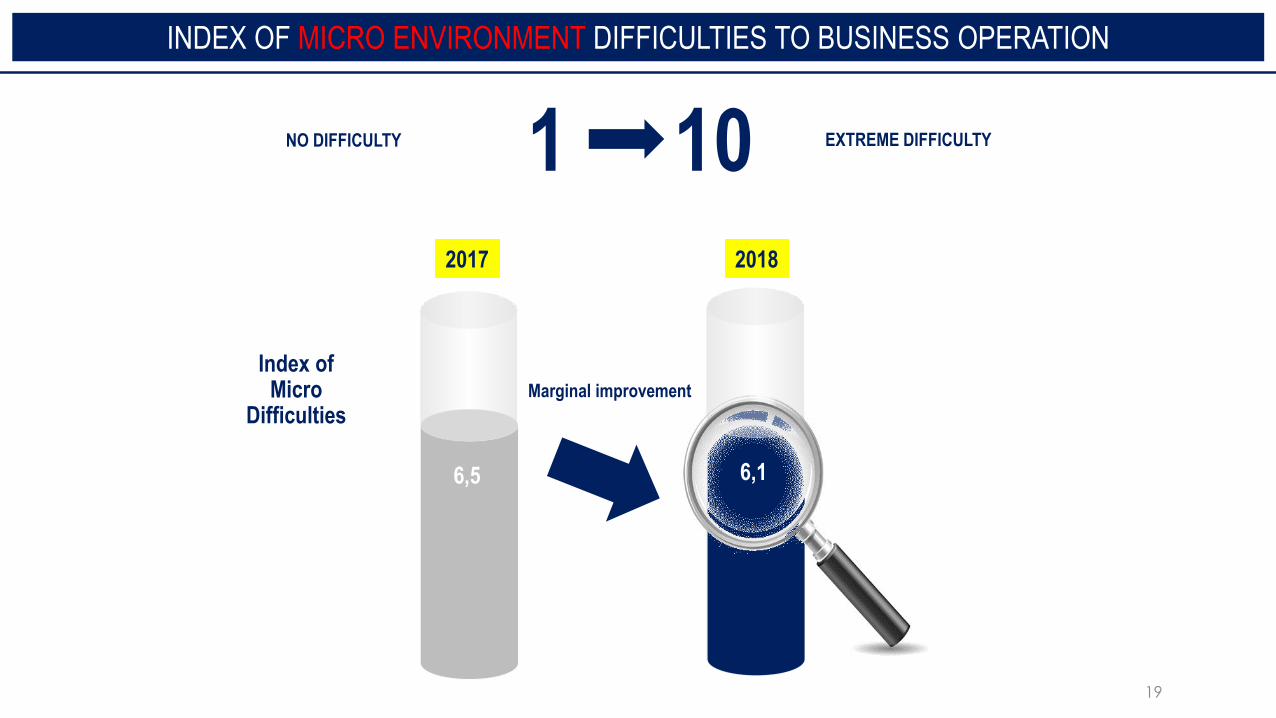
The Indexes of both Macro and Micro Difficulties, still, remain below the threshold.
High tax rates (77.3%), the rise of corruption (5 percentage points compared to 2017 to
45.1%) and political uncertainty for the post memorandum era (43.3%) are identified as
the main obstacles that hinder the macro business environment.
Already well-known “pain points” of the micro business environment remain unsolved.
Unstable tax system (64.9%), overregulation and unclear legal framework (46.8%),
ineffective justice system (45.7%), difficulty accessing finance (44.7%), lack of financial
tools and investment incentives (41.2%) and high energy costs (34.5%) constitute a
rather “burdensome” environment for doing business.
Different obstacles affect day-to-day operation of companies, based on size and
location. The burden is greater for small and medium size companies.
Main findings (2/5)
Obstacles to
business
operation
-
Macro
environment
and
Micro environment
One in two companies does not see any positive impact in their day-to-day operation
from the reforms made.
The reforms plan was not coherent. Many reforms were designed under time
pressure and/or lacking direct involvement of those effected. Many other reforms
were not implemented in practice as planned; others were only partially
implemented, i.e. without additional legislative interventions and public
administration support, which would enable the positive effects on the market to be
fully demonstrated.
Business friendly reforms should prevail; though a better planning is needed and
real and effective consultation with the business community are essential
prerequisites.
Main findings (3/5)
Reform
assessment
The Business Customers Satisfaction Index rose from 4.8 in 2017 to 6.1/10 and the
Transparency Index from 4.5 to 5.9/10.
However, to a large extent, it is a common belief that public administration prevents,
rather than facilitates entrepreneurial activity. The evaluation of crucial - for business
operation - public entities, such as Ministries, Courts, Regulatory Authorities, Urban
Planning and Cadastral Survey Offices, causes great concern, as it remains in
single-digit numbers.
E-governance has an immediate positive impact on customer satisfaction. Pubic
bodies/services with digital immaturity receive low scores in both satisfaction and
transparency.
Digitalization is a key success factor for upgrading public sector services offered to
companies, via minimizing direct contact of civil servants and businesses, saving
time, reducing errors and enhancing transparency.
Main findings (4/5)
Quality of
services
provided by
public
administration
to companies
(customer
satisfaction
survey)
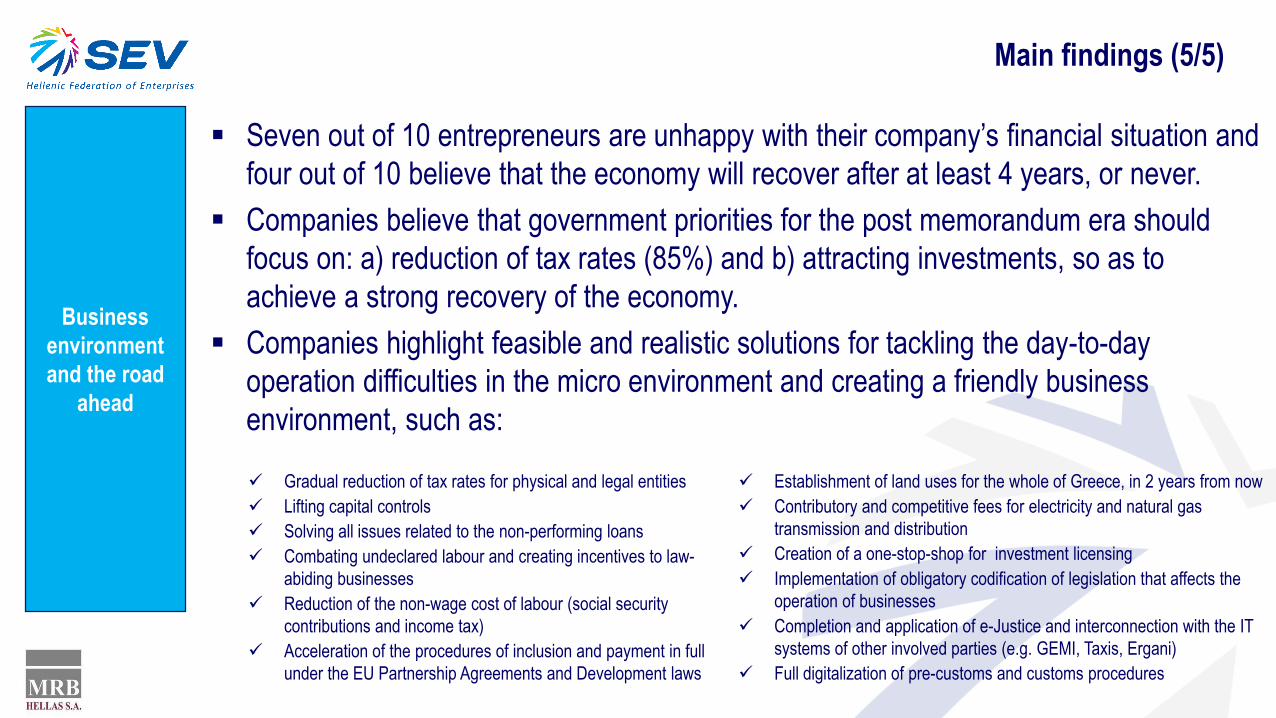
Seven out of 10 entrepreneurs are unhappy with their company’s financial situation and
four out of 10 believe that the economy will recover after at least 4 years, or never.
Companies believe that government priorities for the post memorandum era should
focus on: a) reduction of tax rates (85%) and b) attracting investments, so as to
achieve a strong recovery of the economy.
Companies highlight feasible and realistic solutions for tackling the day-to-day
operation difficulties in the micro environment and creating a friendly business
environment, such as:
Main findings (5/5)
Business
environment
and the road
ahead
Gradual reduction of tax rates for physical and legal entities
Lifting capital controls
Solving all issues related to the non-performing loans
Combating undeclared labour and creating incentives to law-
abiding businesses
Reduction of the non-wage cost of labour (social security
contributions and income tax)
Acceleration of the procedures of inclusion and payment in full
under the EU Partnership Agreements and Development laws
Establishment of land uses for the whole of Greece, in 2 years from now
Contributory and competitive fees for electricity and natural gas
transmission and distribution
Creation of a one-stop-shop for investment licensing
Implementation of obligatory codification of legislation that affects the
operation of businesses
Completion and application of e-Justice and interconnection with the IT
systems of other involved parties (e.g. GEMI, Taxis, Ergani)
Full digitalization of pre-customs and customs procedures
The survey
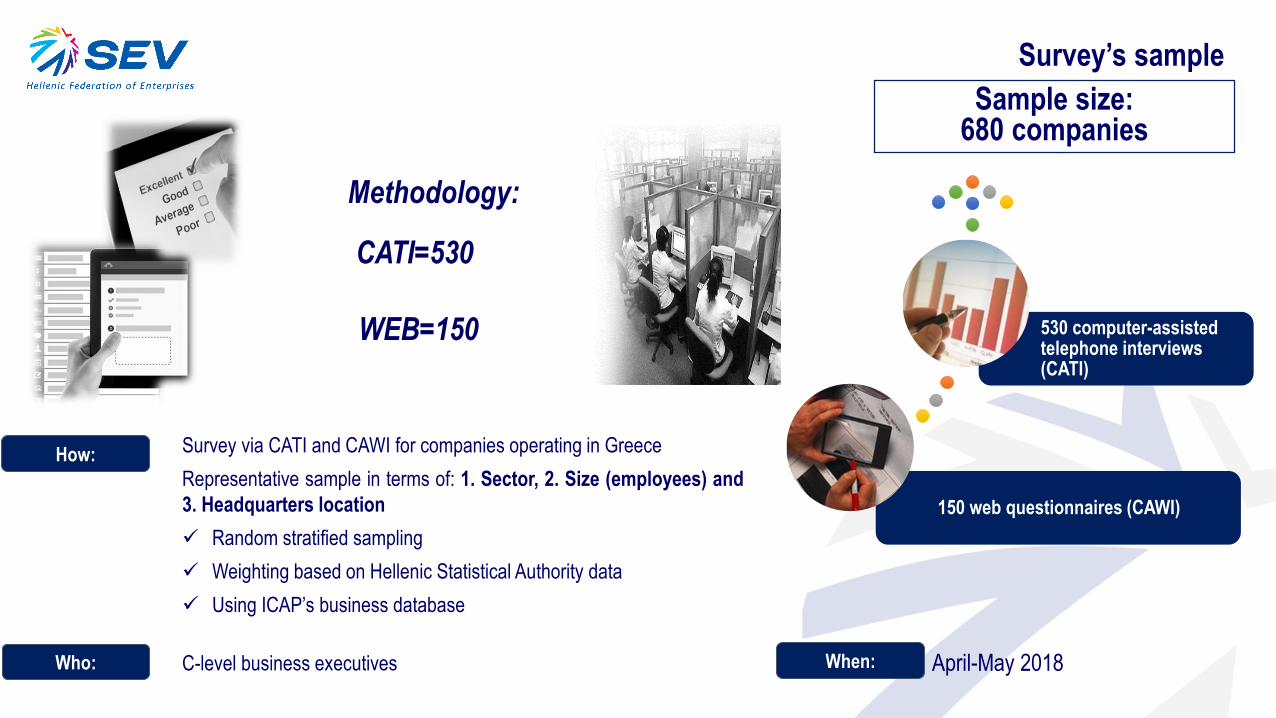
150 web questionnaires (CAWI)
530 computer-assisted telephone interviews (CATI)
Sample size:680 companies
CATI=530
WEB=150
Survey via CATI and CAWI for companies operating in Greece
Representative sample in terms of: 1. Sector, 2. Size (employees) and
3. Headquarters location
Random stratified sampling
Weighting based on Hellenic Statistical Authority data
Using ICAP’s business database
How:
C-level business executivesWho:
Methodology:
April-May 2018 When:
Survey’s sample
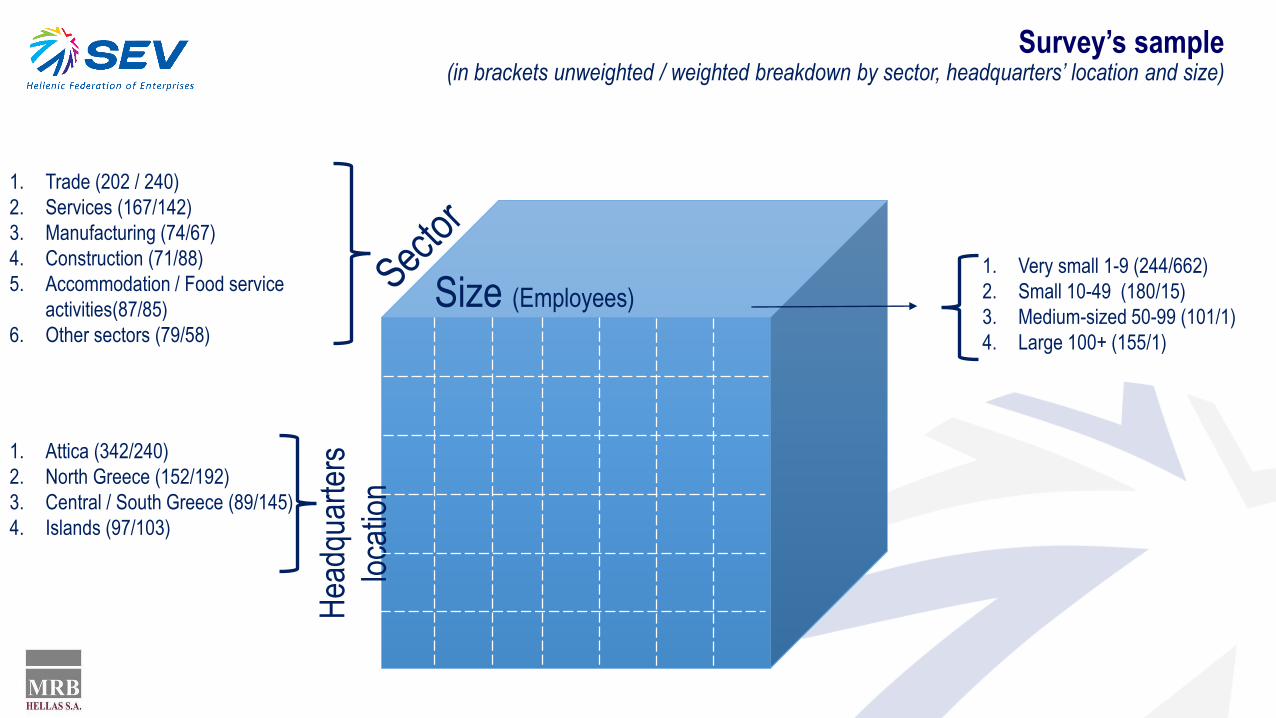
Size (Employees)
Hea
dqua
rter
s
loca
tion
1. Trade (202 / 240)
2. Services (167/142)
3. Manufacturing (74/67)
4. Construction (71/88)
5. Accommodation / Food service
activities(87/85)
6. Other sectors (79/58)
1. Attica (342/240)
2. North Greece (152/192)
3. Central / South Greece (89/145)
4. Islands (97/103)
1. Very small 1-9 (244/662)
2. Small 10-49 (180/15)
3. Medium-sized 50-99 (101/1)
4. Large 100+ (155/1)
Survey’s sample(in brackets unweighted / weighted breakdown by sector, headquarters’ location and size)
Macro environment business obstacles
13
77.3
45.1
43.3
40.5
38.2
28.0
22.8
15.1
11.4
10.9
83.8
40.3
65.7
60.0
47.4
36.1
21.2
23.2
20.7
12.9
HIGH TAX RATES
CORRUPTION AND LOW LEVEL OF TRANSPARENCY
POLITICAL UNCERTAINTY FOR THE POST MEMORANDUM ERA
DOMESTIC ECONOMIC IMPACT OF RECESSION AND THE STABIL ITY PROGRAMS
LOW CAPACITY OF INSTITUTIONS
LOW CAPACITY TO INNOVATE
LOW LEVEL OF ESSENCIAL FACIL IT IES & INFRASTRUCTURES
INTERNATIONAL ECONOMIC AND POL ITICAL ENVIRONMENT
LOW LEVEL OF INTENSITY OF COMPETITION IN PRODUCT AND SERVICES MARKETS
INADEQUATE LABOR FORCE, LACK OF SKILLS
2018 2017
EVALUATION OF OBSTACLES TO BUSINESS OPERATION - ΜΑCRO ENVIRONMENT - ΤΟP BOX
Thinking of your own company, please evaluate all the following categories of obstacles to business operation on a scale from 1 to 5, where 1 = NO DIFFICULTY
and 5 = EXTREME DIFFICULTY.
Top 5
Percentages (%) of answer “Extreme difficulty”
14
INDEX OF MACRO ENVIRONMENT DIFFICULTIES TO BUSINESS OPERATION
Index of Macro
Difficulties
2017 2018
NO DIFFICULTY EXTREME DIFFICULTY1 10
6,87,0
Marginal improvement
15
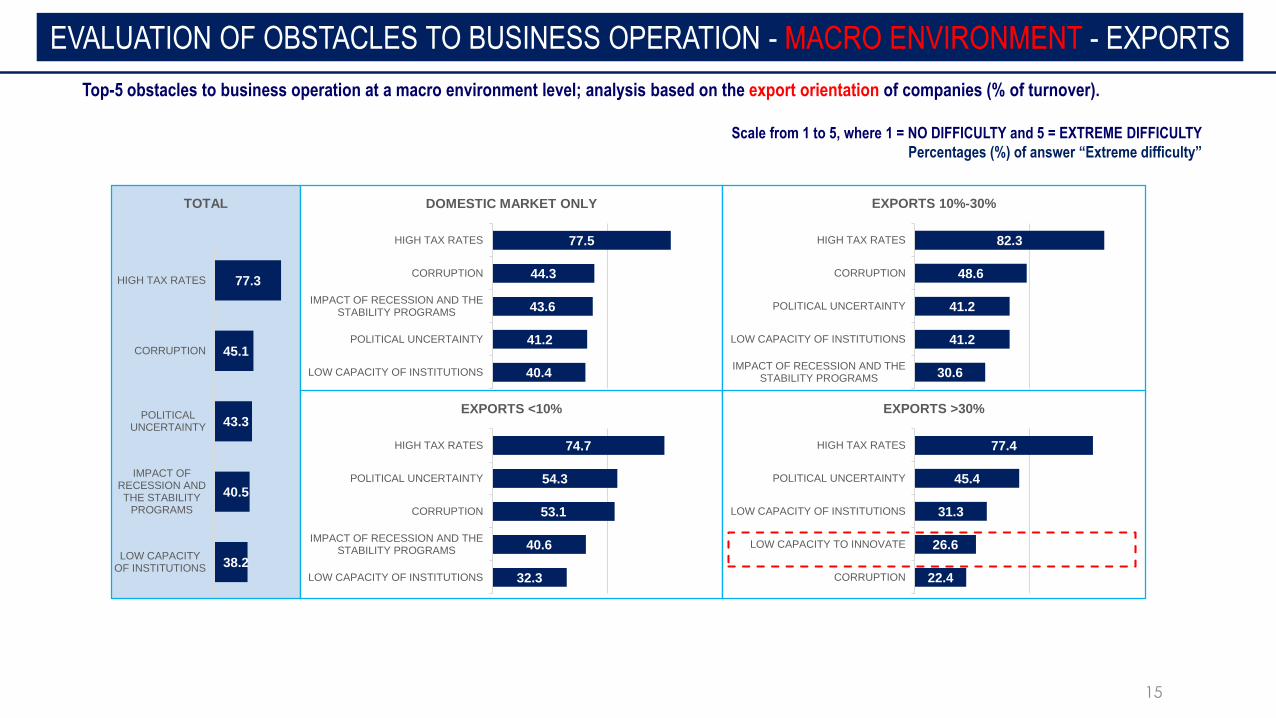
Top-5 obstacles to business operation at a macro environment level; analysis based on the export orientation of companies (% of turnover).
Scale from 1 to 5, where 1 = NO DIFFICULTY and 5 = EXTREME DIFFICULTY
Percentages (%) of answer “Extreme difficulty”
EVALUATION OF OBSTACLES TO BUSINESS OPERATION - ΜΑCRO ENVIRONMENT - EXPORTS
38.2
40.5
43.3
45.1
77.3
LOW CAPACITYOF INSTITUTIONS
IMPACT OFRECESSION ANDTHE STABILITY
PROGRAMS
POLITICALUNCERTAINTY
CORRUPTION
HIGH TAX RATES
TOTAL
40.4
41.2
43.6
44.3
77.5
LOW CAPACITY OF INSTITUTIONS
POLITICAL UNCERTAINTY
IMPACT OF RECESSION AND THESTABILITY PROGRAMS
CORRUPTION
HIGH TAX RATES
DOMESTIC MARKET ONLY
32.3
40.6
53.1
54.3
74.7
LOW CAPACITY OF INSTITUTIONS
IMPACT OF RECESSION AND THESTABILITY PROGRAMS
CORRUPTION
POLITICAL UNCERTAINTY
HIGH TAX RATES
EXPORTS <10%
30.6
41.2
41.2
48.6
82.3
IMPACT OF RECESSION AND THESTABILITY PROGRAMS
LOW CAPACITY OF INSTITUTIONS
POLITICAL UNCERTAINTY
CORRUPTION
HIGH TAX RATES
EXPORTS 10%-30%
22.4
26.6
31.3
45.4
77.4
CORRUPTION
LOW CAPACITY TO INNOVATE
LOW CAPACITY OF INSTITUTIONS
POLITICAL UNCERTAINTY
HIGH TAX RATES
EXPORTS >30%
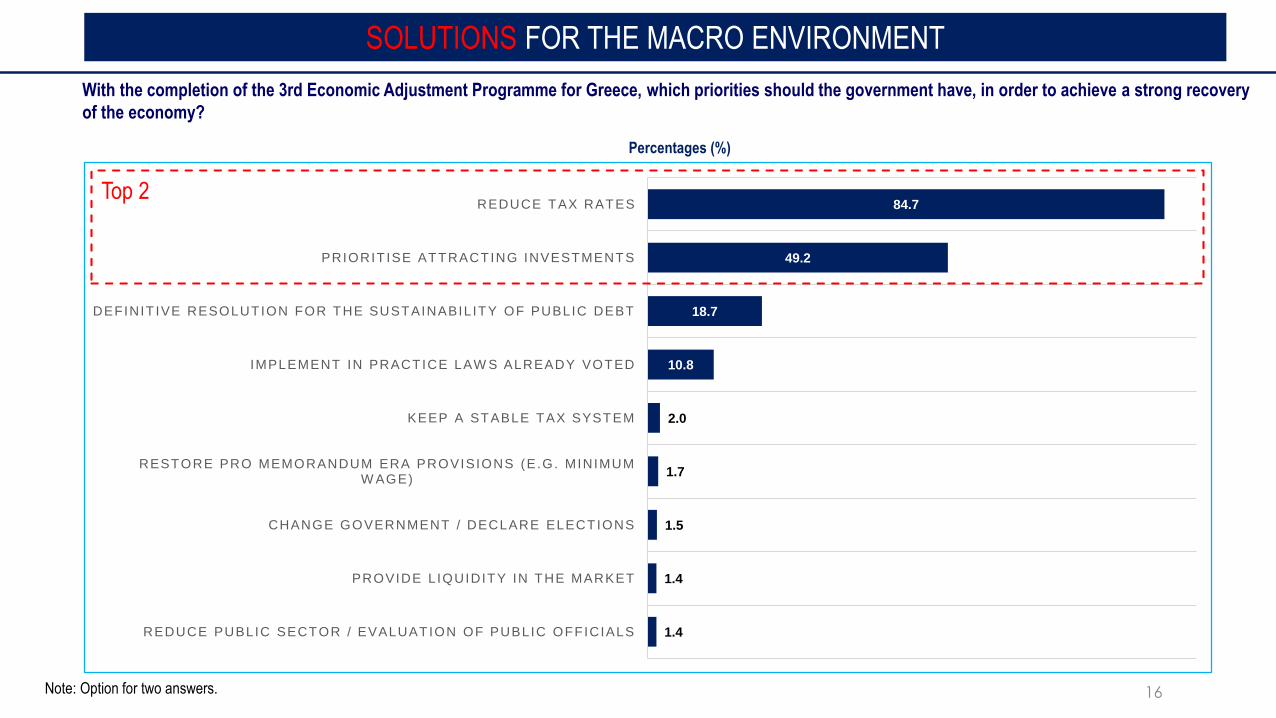
16
84.7
49.2
18.7
10.8
2.0
1.7
1.5
1.4
1.4
REDUCE TAX RATES
PRIORIT ISE ATTRACTING INVESTMENTS
DEFINIT IVE RESOLUTION FOR THE SUSTAINABILITY OF PUBLIC DEBT
IMPLEMENT IN PRACTICE LAW S ALREADY VOTED
KEEP A STABLE TAX SYSTEM
RESTORE PRO MEMORANDUM ERA PROVISIONS (E.G. MINIMUM W AGE)
CHANGE GOVERNMENT / DECLARE ELECTIONS
PROVIDE L IQUIDITY IN THE MARKET
REDUCE PUBLIC SECTOR / EVALUATION OF PUBLIC OFFICIALS
Percentages (%)
With the completion of the 3rd Economic Adjustment Programme for Greece, which priorities should the government have, in order to achieve a strong recovery
of the economy?
Note: Option for two answers.
Top 2
SOLUTIONS FOR THE ΜΑCRO ENVIRONMENT
“Micro environment”
business obstacles/barriers
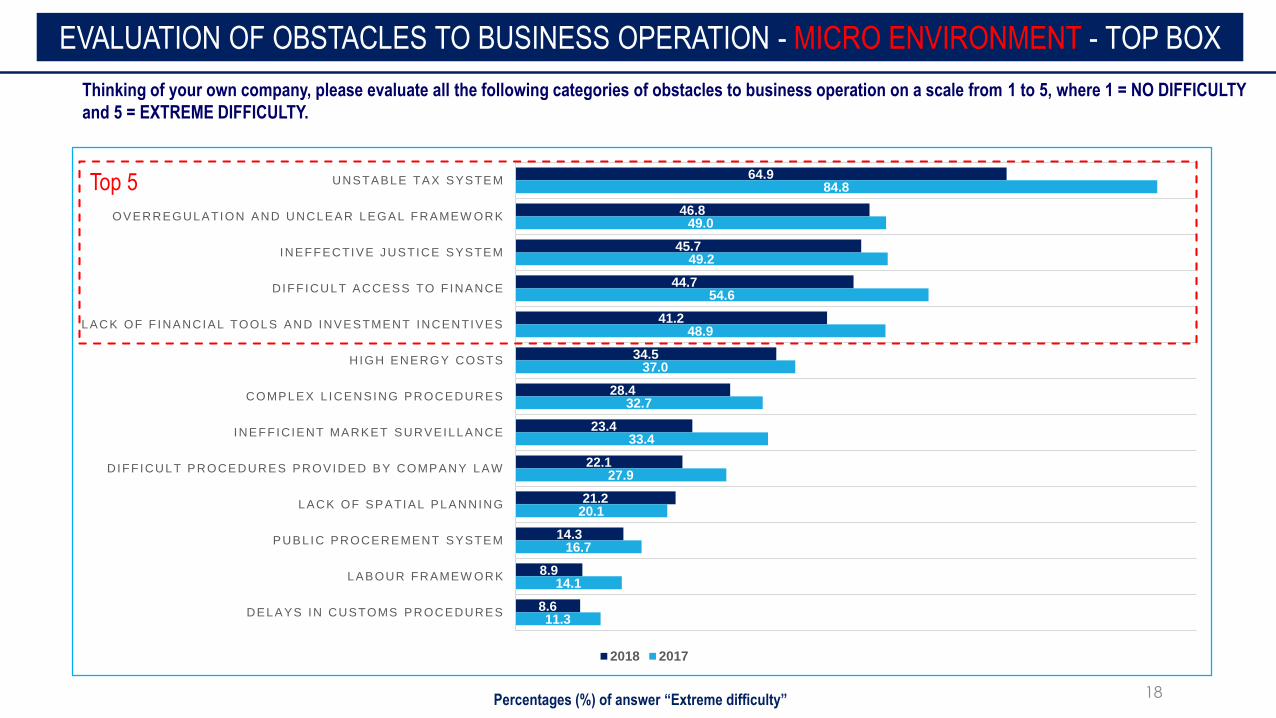
18
64.9
46.8
45.7
44.7
41.2
34.5
28.4
23.4
22.1
21.2
14.3
8.9
8.6
84.8
49.0
49.2
54.6
48.9
37.0
32.7
33.4
27.9
20.1
16.7
14.1
11.3
UNSTABLE TAX SYSTEM
OVERREGULATION AND UNCLEAR LEGAL FRAMEW ORK
INEFFECTIVE JUSTICE SYSTEM
DIFF ICULT ACCESS TO F INANCE
LACK OF F INANCIAL TOOLS AND INVESTMENT INCENTIVES
HIGH ENERGY COSTS
COMPLEX L ICENSING PROCEDURES
INEFF IC IENT MARKET SURVEILLANCE
DIFF ICULT PROCEDURES PROVIDED BY COMPANY LAW
LACK OF SPATIAL PLANNING
PUBL IC PROCEREMENT SYSTEM
LABOUR FRAMEW ORK
DELAYS IN CUSTOMS PROCEDURES
2018 2017
Top 5
Thinking of your own company, please evaluate all the following categories of obstacles to business operation on a scale from 1 to 5, where 1 = NO DIFFICULTY
and 5 = EXTREME DIFFICULTY.
Percentages (%) of answer “Extreme difficulty”
EVALUATION OF OBSTACLES TO BUSINESS OPERATION - ΜICRO ENVIRONMENT - ΤΟP BOX
19
2017 2018
6,16,5
INDEX OF MICRO ENVIRONMENT DIFFICULTIES TO BUSINESS OPERATION
NO DIFFICULTY EXTREME DIFFICULTY1 10
Index of Micro
DifficultiesMarginal improvement
20
24.8
29.9
34.0
39.8
53.4
LACK OF FINANCIAL TOOLS
COMPLEX LICENSINGPROCEDURES
INEFFECTIVE JUSTICE SYSTEM
OVERREGULATION
UNSTABLE TAX SYSTEM
LARGE
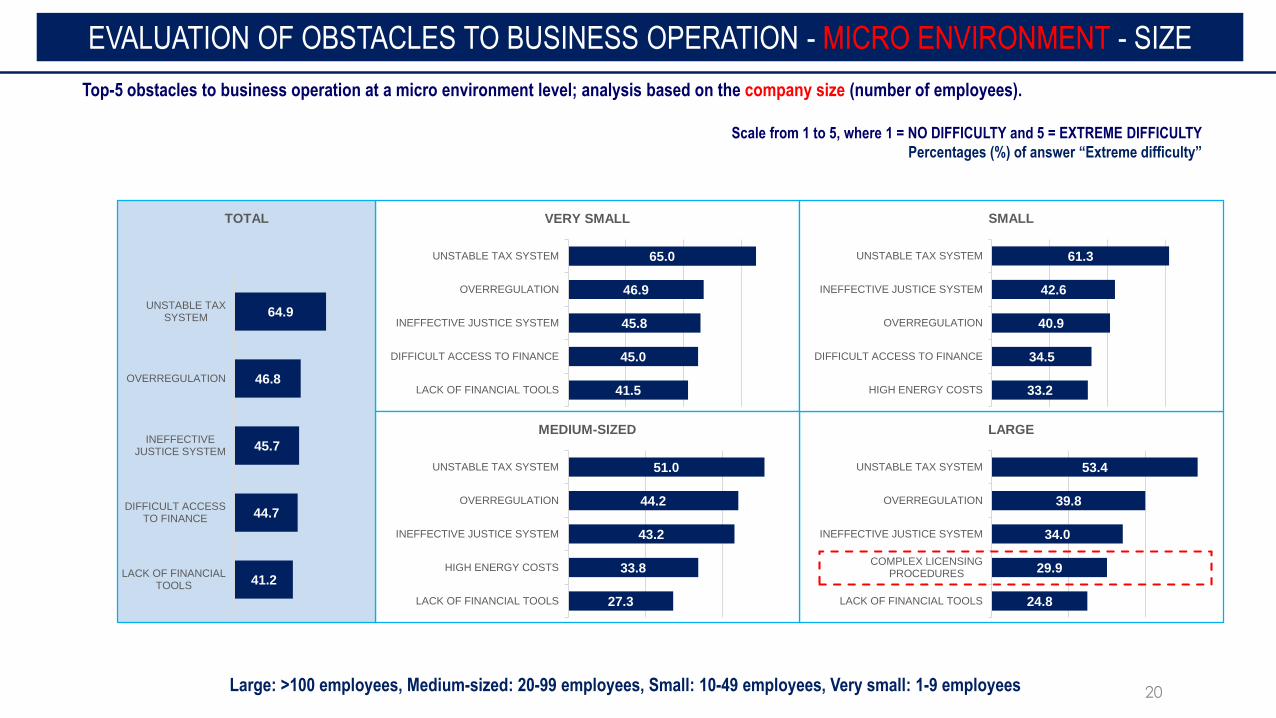
Large: >100 employees, Medium-sized: 20-99 employees, Small: 10-49 employees, Very small: 1-9 employees
EVALUATION OF OBSTACLES TO BUSINESS OPERATION - ΜICRO ENVIRONMENT - SIZE
Top-5 obstacles to business operation at a micro environment level; analysis based on the company size (number of employees).
Scale from 1 to 5, where 1 = NO DIFFICULTY and 5 = EXTREME DIFFICULTY
Percentages (%) of answer “Extreme difficulty”
41.5
45.0
45.8
46.9
65.0
LACK OF FINANCIAL TOOLS
DIFFICULT ACCESS TO FINANCE
INEFFECTIVE JUSTICE SYSTEM
OVERREGULATION
UNSTABLE TAX SYSTEM
VERY SMALL
33.2
34.5
40.9
42.6
61.3
HIGH ENERGY COSTS
DIFFICULT ACCESS TO FINANCE
OVERREGULATION
INEFFECTIVE JUSTICE SYSTEM
UNSTABLE TAX SYSTEM
SMALL
27.3
33.8
43.2
44.2
51.0
LACK OF FINANCIAL TOOLS
HIGH ENERGY COSTS
INEFFECTIVE JUSTICE SYSTEM
OVERREGULATION
UNSTABLE TAX SYSTEM
MEDIUM-SIZED
41.2
44.7
45.7
46.8
64.9
LACK OF FINANCIALTOOLS
DIFFICULT ACCESSTO FINANCE
INEFFECTIVEJUSTICE SYSTEM
OVERREGULATION
UNSTABLE TAXSYSTEM
TOTAL
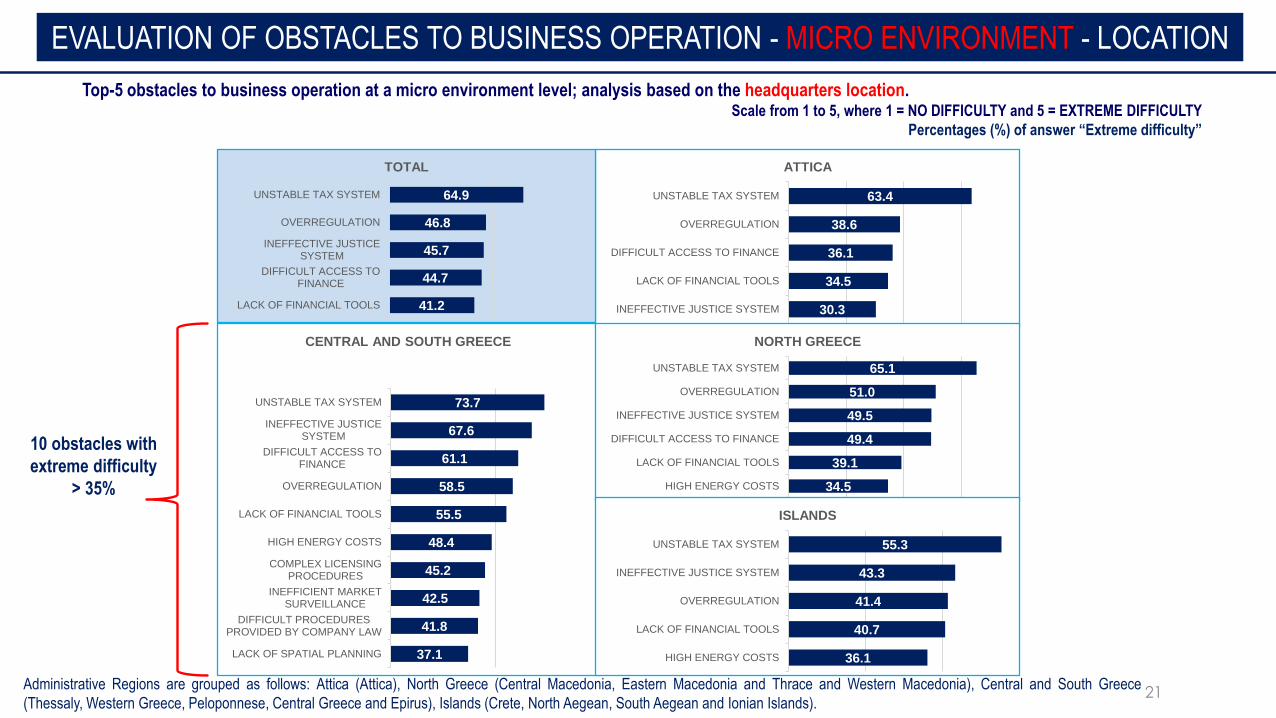
21Administrative Regions are grouped as follows: Attica (Attica), North Greece (Central Macedonia, Eastern Macedonia and Thrace and Western Macedonia), Central and South Greece
(Thessaly, Western Greece, Peloponnese, Central Greece and Epirus), Islands (Crete, North Aegean, South Aegean and Ionian Islands).
10 obstacles with
extreme difficulty
> 35%
EVALUATION OF OBSTACLES TO BUSINESS OPERATION - ΜICRO ENVIRONMENT - LOCATION
Top-5 obstacles to business operation at a micro environment level; analysis based on the headquarters location.Scale from 1 to 5, where 1 = NO DIFFICULTY and 5 = EXTREME DIFFICULTY
Percentages (%) of answer “Extreme difficulty”
37.1
41.8
42.5
45.2
48.4
55.5
58.5
61.1
67.6
73.7
LACK OF SPATIAL PLANNING
DIFFICULT PROCEDURESPROVIDED BY COMPANY LAW
INEFFICIENT MARKETSURVEILLANCE
COMPLEX LICENSINGPROCEDURES
HIGH ENERGY COSTS
LACK OF FINANCIAL TOOLS
OVERREGULATION
DIFFICULT ACCESS TOFINANCE
INEFFECTIVE JUSTICESYSTEM
UNSTABLE TAX SYSTEM
CENTRAL AND SOUTH GREECE
30.3
34.5
36.1
38.6
63.4
INEFFECTIVE JUSTICE SYSTEM
LACK OF FINANCIAL TOOLS
DIFFICULT ACCESS TO FINANCE
OVERREGULATION
UNSTABLE TAX SYSTEM
ATTICA
34.5
39.1
49.4
49.5
51.0
65.1
HIGH ENERGY COSTS
LACK OF FINANCIAL TOOLS
DIFFICULT ACCESS TO FINANCE
INEFFECTIVE JUSTICE SYSTEM
OVERREGULATION
UNSTABLE TAX SYSTEM
NORTH GREECE
36.1
40.7
41.4
43.3
55.3
HIGH ENERGY COSTS
LACK OF FINANCIAL TOOLS
OVERREGULATION
INEFFECTIVE JUSTICE SYSTEM
UNSTABLE TAX SYSTEM
ISLANDS
41.2
44.7
45.7
46.8
64.9
LACK OF FINANCIAL TOOLS
DIFFICULT ACCESS TOFINANCE
INEFFECTIVE JUSTICESYSTEM
OVERREGULATION
UNSTABLE TAX SYSTEM
TOTAL
Proposed solutions
for the removal of “micro environment”
obstacles/barriers
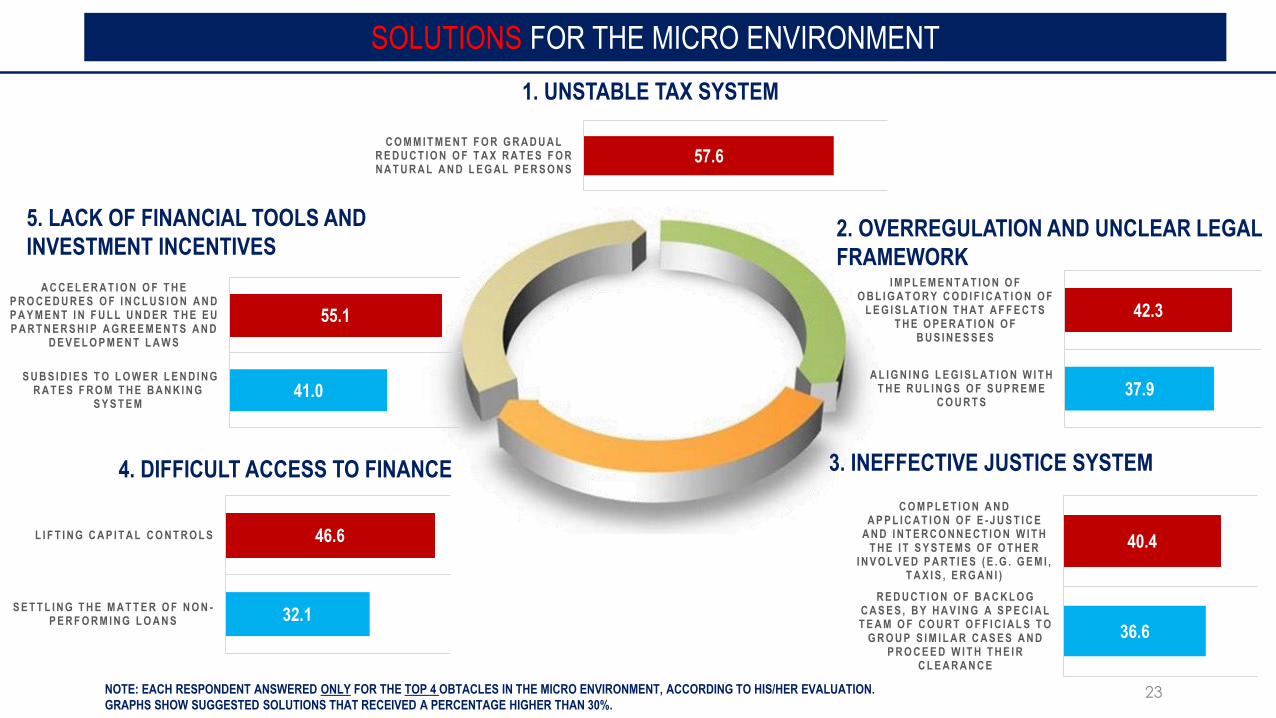
23
1. UNSTABLE TAX SYSTEM
2. OVERREGULATION AND UNCLEAR LEGAL
FRAMEWORK
3. INEFFECTIVE JUSTICE SYSTEM4. DIFFICULT ACCESS TO FINANCE
5. LACK OF FINANCIAL TOOLS AND
INVESTMENT INCENTIVES
NOTE: EACH RESPONDENT ANSWERED ONLY FOR THE TOP 4 OBTACLES IN THE MICRO ENVIRONMENT, ACCORDING TO HIS/HER EVALUATION.
GRAPHS SHOW SUGGESTED SOLUTIONS THAT RECEIVED A PERCENTAGE HIGHER THAN 30%.
SOLUTIONS FOR THE ΜICRO ENVIRONMENT
57.6C O M M I T M E N T F O R G R A D U A L
R E D U C T I O N O F T A X R A T E S F O R N A T U R A L A N D L E G A L P E R S O N S
42.3
37.9
I M P L E M E N T A T I O N O F O B L I G A T O R Y C O D I F I C A T I O N O F
L E G I S L A T I O N T H A T A F F E C T S T H E O P E R A T I O N O F
B U S I N E S S E S
A L I G N I N G L E G I S L A T I O N W I T H T H E R U L I N G S O F S U P R E M E
C O U R T S
40.4
36.6
C O M P L E T I O N A N D A P P L I C A T I O N O F E - J U S T I C E
A N D I N T E R C O N N E C T I O N W I T H T H E I T S Y S T E M S O F O T H E R
I N V O L V E D P A R T I E S ( E . G . G E M I , T A X I S , E R G A N I )
R E D U C T I O N O F B A C K L O G C A S E S , B Y H A V I N G A S P E C I A L T E A M O F C O U R T O F F I C I A L S T O
G R O U P S I M I L A R C A S E S A N D P R O C E E D W I T H T H E I R
C L E A R A N C E
46.6
32.1
L I F T I N G C A P I T A L C O N T R O L S
S E T T L I N G T H E M A T T E R O F N O N -P E R F O R M I N G L O A N S
55.1
41.0
A C C E L E R A T I O N O F T H E P R O C E D U R E S O F I N C L U S I O N A N D P A Y M E N T I N F U L L U N D E R T H E E U P A R T N E R S H I P A G R E E M E N T S A N D
D E V E L O P M E N T L A W S
S U B S I D I E S T O L O W E R L E N D I N G R A T E S F R O M T H E B A N K I N G
S Y S T E M
24
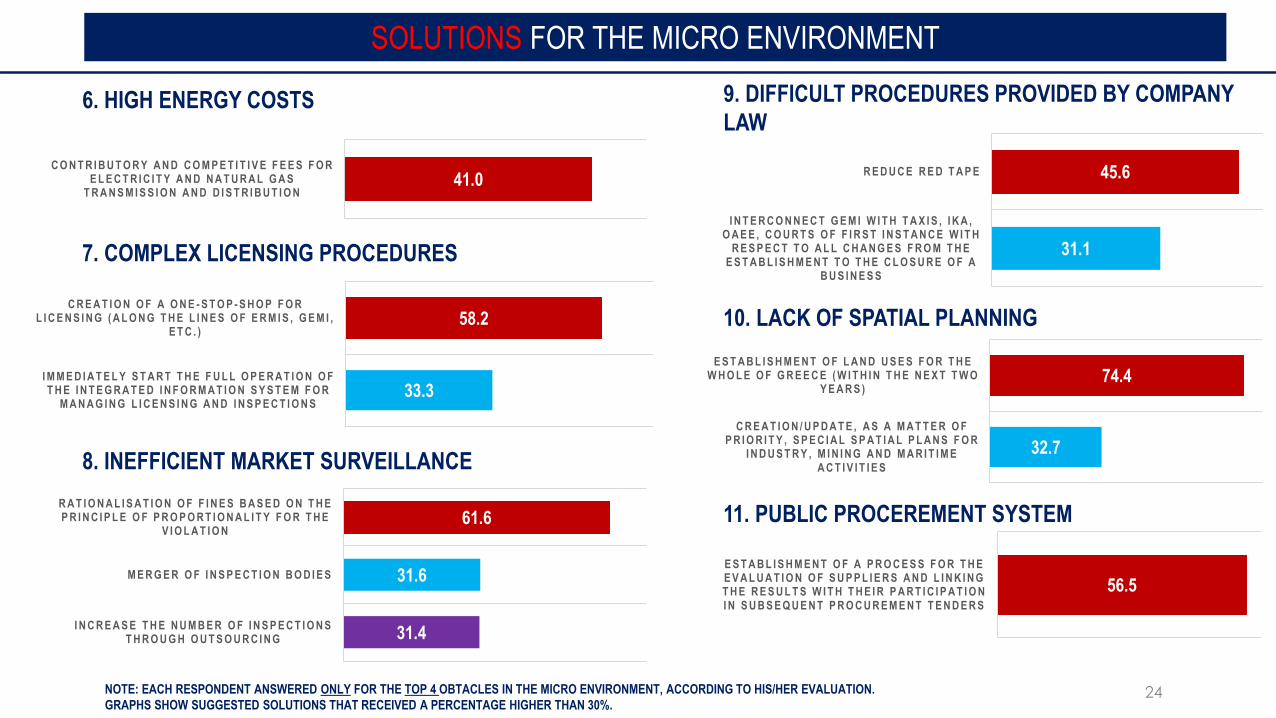
6. HIGH ENERGY COSTS
7. COMPLEX LICENSING PROCEDURES
8. INEFFICIENT MARKET SURVEILLANCE
9. DIFFICULT PROCEDURES PROVIDED BY COMPANY
LAW
10. LACK OF SPATIAL PLANNING
11. PUBLIC PROCEREMENT SYSTEM
SOLUTIONS FOR THE ΜICRO ENVIRONMENT
NOTE: EACH RESPONDENT ANSWERED ONLY FOR THE TOP 4 OBTACLES IN THE MICRO ENVIRONMENT, ACCORDING TO HIS/HER EVALUATION.
GRAPHS SHOW SUGGESTED SOLUTIONS THAT RECEIVED A PERCENTAGE HIGHER THAN 30%.
56.5
E S T A B L I S H M E N T O F A P R O C E S S F O R T H E E V A L U A T I O N O F S U P P L I E R S A N D L I N K I N G T H E R E S U L T S W I T H T H E I R P A R T I C I P A T I O N I N S U B S E Q U E N T P R O C U R E M E N T T E N D E R S
74.4
32.7
E S T A B L I S H M E N T O F L A N D U S E S F O R T H E W H O L E O F G R E E C E ( W I T H I N T H E N E X T T W O
Y E A R S )
C R E A T I O N / U P D A T E , A S A M A T T E R O F P R I O R I T Y , S P E C I A L S P A T I A L P L A N S F O R
I N D U S T R Y , M I N I N G A N D M A R I T I M E A C T I V I T I E S
45.6
31.1
R E D U C E R E D T A P E
I N T E R C O N N E C T G E M I W I T H T A X I S , I K A , O A E E , C O U R T S O F F I R S T I N S T A N C E W I T H
R E S P E C T T O A L L C H A N G E S F R O M T H E E S T A B L I S H M E N T T O T H E C L O S U R E O F A
B U S I N E S S
61.6
31.6
31.4
R A T I O N A L I S A T I O N O F F I N E S B A S E D O N T H E P R I N C I P L E O F P R O P O R T I O N A L I T Y F O R T H E
V I O L A T I O N
M E R G E R O F I N S P E C T I O N B O D I E S
I N C R E A S E T H E N U M B E R O F I N S P E C T I O N S T H R O U G H O U T S O U R C I N G
58.2
33.3
C R E A T I O N O F A O N E - S T O P - S H O P F O R L I C E N S I N G ( A L O N G T H E L I N E S O F E R M I S , G E M I ,
E T C . )
I M M E D I A T E L Y S T A R T T H E F U L L O P E R A T I O N O F T H E I N T E G R A T E D I N F O R M A T I O N S Y S T E M F O R
M A N A G I N G L I C E N S I N G A N D I N S P E C T I O N S
41.0C O N T R I B U T O R Y A N D C O M P E T I T I V E F E E S F O R
E L E C T R I C I T Y A N D N A T U R A L G A S T R A N S M I S S I O N A N D D I S T R I B U T I O N
25
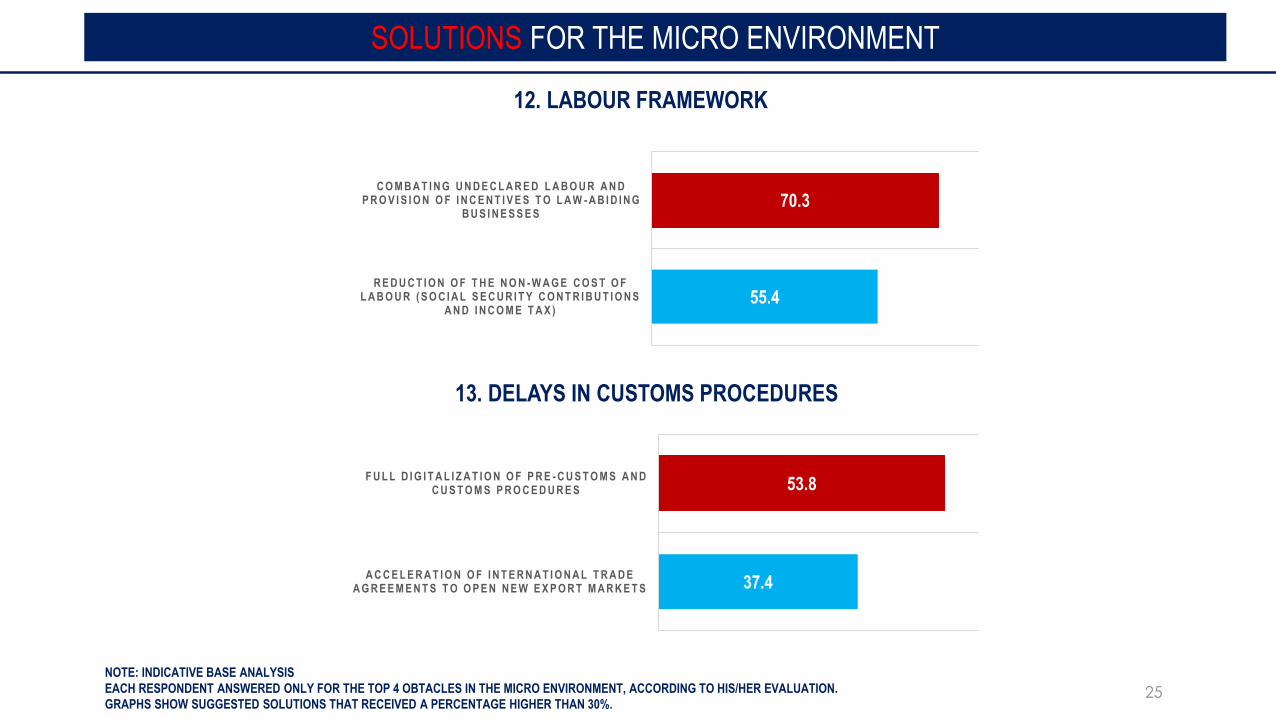
12. LABOUR FRAMEWORK
13. DELAYS IN CUSTOMS PROCEDURES
SOLUTIONS FOR THE ΜICRO ENVIRONMENT
NOTE: INDICATIVE BASE ANALYSIS
EACH RESPONDENT ANSWERED ONLY FOR THE TOP 4 OBTACLES IN THE MICRO ENVIRONMENT, ACCORDING TO HIS/HER EVALUATION.
GRAPHS SHOW SUGGESTED SOLUTIONS THAT RECEIVED A PERCENTAGE HIGHER THAN 30%.
53.8
37.4
F U L L D I G I T A L I Z A T I O N O F P R E - C U S T O M S A N D C U S T O M S P R O C E D U R E S
A C C E L E R A T I O N O F I N T E R N A T I O N A L T R A D E A G R E E M E N T S T O O P E N N E W E X P O R T M A R K E T S
70.3
55.4
C O M B A T I N G U N D E C L A R E D L A B O U R A N D P R O V I S I O N O F I N C E N T I V E S T O L A W - A B I D I N G
B U S I N E S S E S
R E D U C T I O N O F T H E N O N - W A G E C O S T O F L A B O U R ( S O C I A L S E C U R I T Y C O N T R I B U T I O N S
A N D I N C O M E T A X )
Reform assessment
27
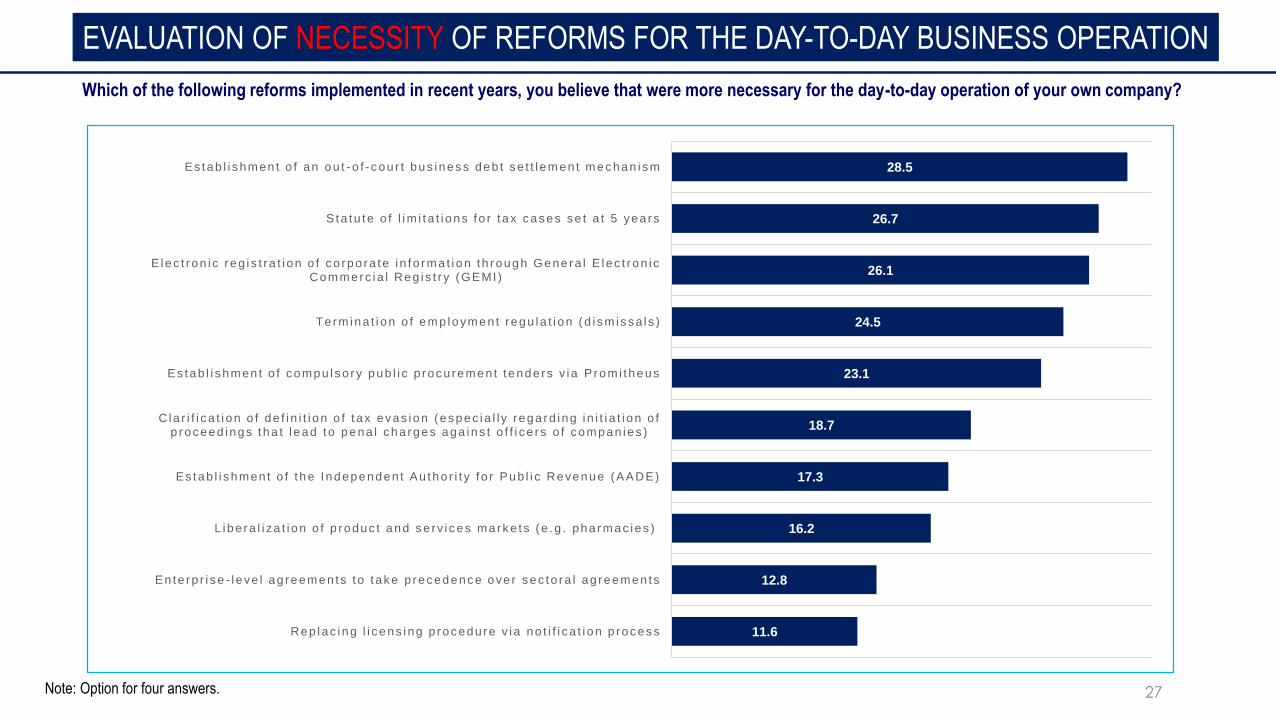
Which of the following reforms implemented in recent years, you believe that were more necessary for the day-to-day operation of your own company?
EVALUATION OF NECESSITY OF REFORMS FOR THE DAY-TO-DAY BUSINESS OPERATION
Note: Option for four answers.
28.5
26.7
26.1
24.5
23.1
18.7
17.3
16.2
12.8
11.6
Es tab l i shmen t o f an ou t -o f - cou r t bus iness deb t se t t l emen t mechan i sm
Sta tu te o f l im i t a t i ons fo r t ax cases se t a t 5 yea rs
Elec t ron i c reg i s t ra t i on o f co rpo ra te i n fo rma t i on t h rough Gene ra l E lec t ron i c Commerc ia l Reg i s t r y (GEMI )
Te rm ina t i on o f emp loymen t regu la t i on (d i sm issa l s )
Es tab l i shmen t o f compu l so ry pub l i c p rocu remen t t ende rs v i a P rom i theus
C la r i f i ca t i on o f de f i n i t i on o f t ax evas ion (espec ia l l y rega rd ing i n i t i a t i on o f p roceed ings t ha t l ead to pena l cha rges aga ins t o f f i ce rs o f compan ies )
Es tab l i shmen t o f t he I ndependen t Au tho r i t y f o r Pub l i c Revenue (AADE)
L ibe ra l i za t i on o f p roduc t and se rv i ces marke ts (e .g . pha rmac ies )
En te rp r i se - l eve l ag reemen ts t o t ake p recedence ove r sec to ra l ag reemen ts
Rep lac i ng l i cens ing p rocedu re v i a no t i f i ca t i on p rocess
28
54.3
31.3
26.2
26.1
23.6
23.3
22.6
22.1
21.1
15.1
10.8
16.3
11.9
13.6
23.8
14.8
19.2
10.6
11.4
15.9
5.8
9.9
12.7
8.5
6.9
8.5
7.4
9.8
5.5
8.2
26.8
40.6
46.0
47.3
43.0
51.0
49.7
54.7
52.6
53.6
E L E C T R ON IC R E GIS TR AT ION OF C OR P OR A TE IN F OR MA T ION T H R OU GH GE N E R A L E L ECT RONIC C OMME R C IA L R E GIS T R Y (GE MI )
T E R MIN A T ION OF E MP L OY MEN T R E GU L A T ION (D IS MIS S A L S )
S T A T U T E OF L IM IT A T ION S F OR T A X C A S E S S E T A T 5 Y E A R S
E S T A B L IS HMEN T OF A N OU T -O F -C OU RT B U S IN E S S D E B T S E T T L E ME NT ME C H A N IS M
E S T A B L IS HMEN T OF T H E IN D E P E N D ENT A U T H OR IT Y F OR P U B L IC R E V E N U E (A A D E )
C L A R IF IC A TION OF D E F IN IT ION OF T A X E V A S ION (E S P E C IA L LY R E GA R D IN GIN IT IA T ION OF P R OC E E D INGS T HA T L EA D T O P E N A L C H A R GE S A GA IN S T
OF F IC E R S OF C OMP A N IE S)
L IB E R A L IZ AT ION OF P R OD U C T A N D S E R V IC E S MA R K E T S (E .G . P H A R MA CIE S)
E S T A B L IS HMEN T OF C OMP U L S OR Y P U BL IC P R OC U R E ME NT T E N D E R S V IA P R OMIT H E US
R E P L A C ING L IC E N S IN G P R OC E D U RE V IA N OT IF IC A T ION P R OC E S S
E N T E R P RIS E-L E VE L A GR E E ME NT S T O T A K E P R E C E D EN CE OV E R S E C T OR AL A GR E E ME NTS
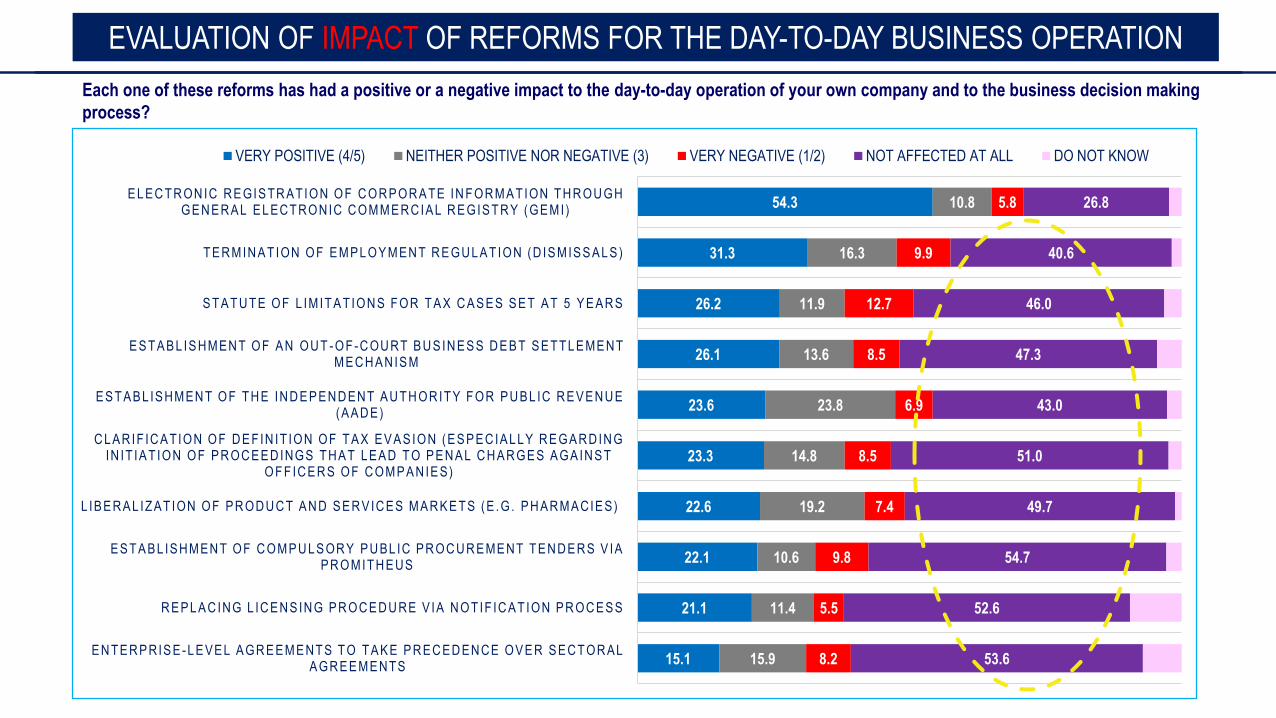
VERY POSITIVE (4/5) NEITHER POSITIVE NOR NEGATIVE (3) VERY NEGATIVE (1/2) NOT AFFECTED AT ALL DO NOT KNOW
Each one of these reforms has had a positive or a negative impact to the day-to-day operation of your own company and to the business decision making
process?
EVALUATION OF IMPACT OF REFORMS FOR THE DAY-TO-DAY BUSINESS OPERATION
29
Potential
Vulnerabilities
Necessity% ΤΟP2 BOX
Imp
act
% Τ
ΟP
2 B
OX
Replacing licensing procedure via
notification process
Liberalization of product and services markets (e.g. pharmacies)
Clarification of definition of tax evasion
(especially regarding initiation of proceedings
that lead to penal charges against officers
of companies)
Electronic registration of corporate information through
General Electronic Commercial Registry (GEMI)
Establishment of an out-of-court business debt
settlement mechanism
Establishment of compulsory public
procurement tenders via Promitheus
Termination of employment regulation
(dismissals)
Statute of limitations for tax cases set at 5 years
Establishment of the Independent Authority for Public Revenue
(AADE)
Enterprise-level agreements to take precedence over sectoral agreements
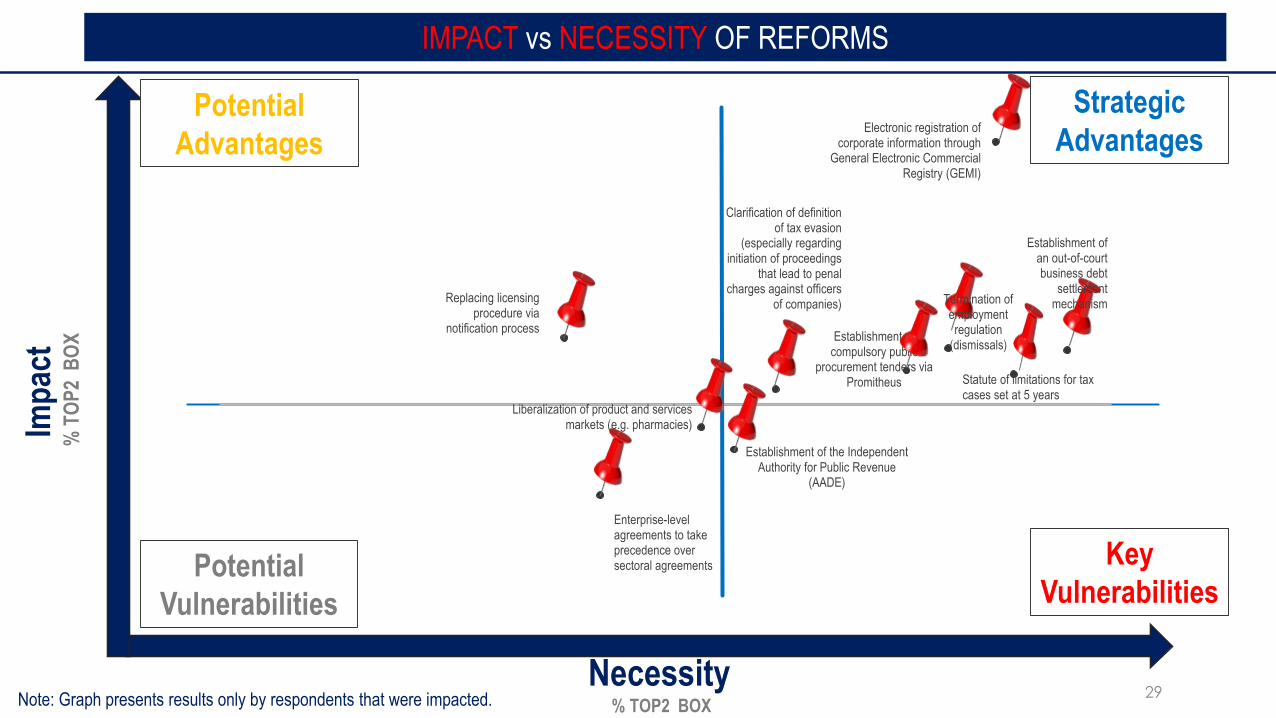
Note: Graph presents results only by respondents that were impacted.
IMPACT vs NECESSITY OF REFORMS
Strategic
Advantages
Key
Vulnerabilities
Potential
Advantages
Quality of services provided by public
administration to companies
(customer satisfaction survey)
31
31
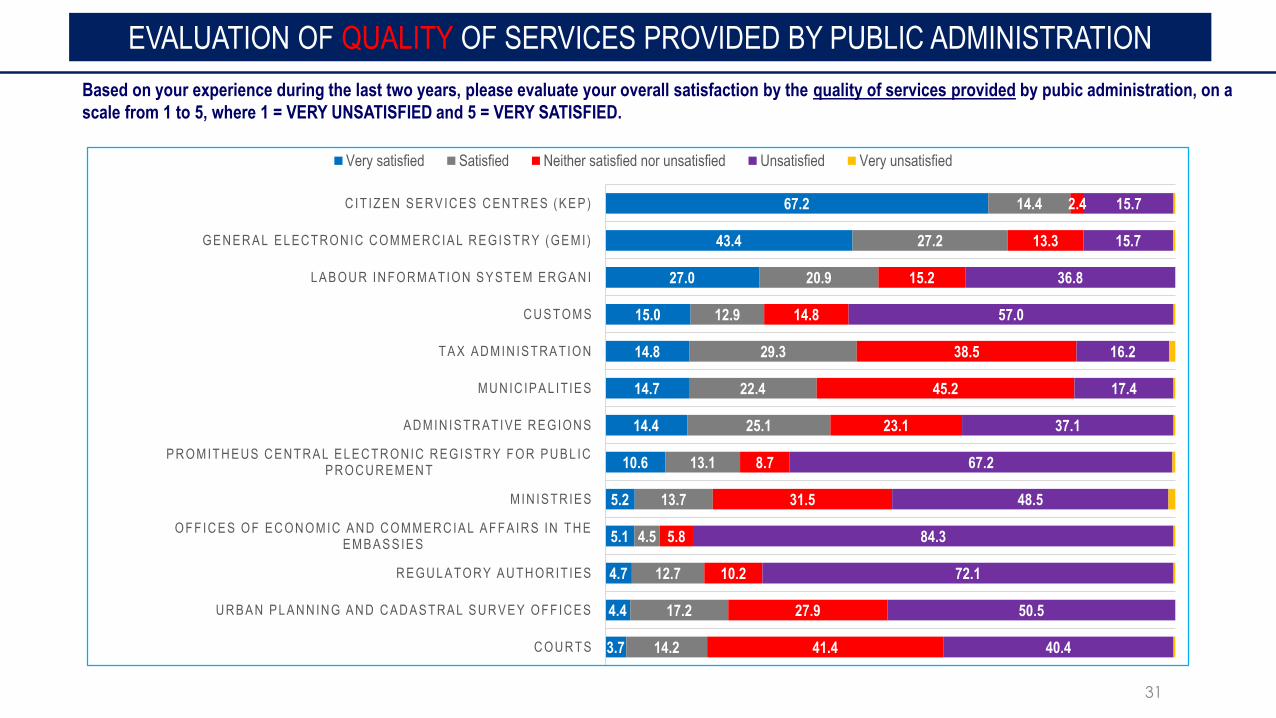
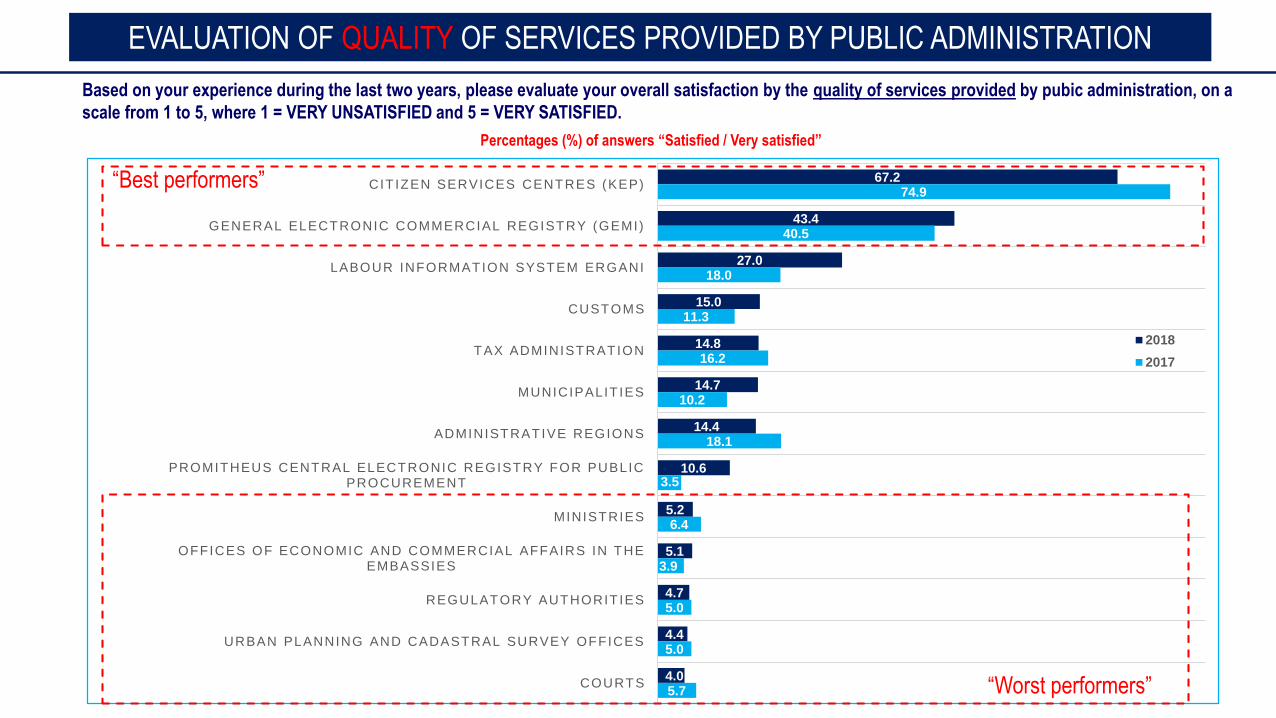
EVALUATION OF QUALITY OF SERVICES PROVIDED BY PUBLIC ADMINISTRATION
Based on your experience during the last two years, please evaluate your overall satisfaction by the quality of services provided by pubic administration, on a
scale from 1 to 5, where 1 = VERY UNSATISFIED and 5 = VERY SATISFIED.
67.2
43.4
27.0
15.0
14.8
14.7
14.4
10.6
5.2
5.1
4.7
4.4
3.7
14.4
27.2
20.9
12.9
29.3
22.4
25.1
13.1
13.7
4.5
12.7
17.2
14.2
2.4
13.3
15.2
14.8
38.5
45.2
23.1
8.7
31.5
5.8
10.2
27.9
41.4
15.7
15.7
36.8
57.0
16.2
17.4
37.1
67.2
48.5
84.3
72.1
50.5
40.4
C IT IZ E N S E R V IC E S C E NT RE S (K E P )
GE N E R A L E L ECT RONIC C OMME R C IA L R E GIS T R Y (GE MI )
L A B OU R IN F OR MA T ION S Y S T E M E R GA N I
C U S T OMS
T A X A D MIN IS T RA TION
MU N IC IP A L IT IE S
A D MIN IS T R AT IVE R E GION S
P R OMIT H E US C E N T R A L E L E C T R ONIC R E GIS T R Y F OR P U B L IC P R OC U R EMEN T
MIN IS T R IE S
OF F IC E S OF E C ON OMIC A N D C OMME R C IA L A F F A IR S IN T H E E MB A S S IE S
R E GU L A TORY A U T H OR IT IES
U R B A N P L A N N IN G A N D C A D A S T RA L S U R V E Y OF F IC E S
C OU R T S
Very satisfied Satisfied Neither satisfied nor unsatisfied Unsatisfied Very unsatisfied
32
67.2
43.4
27.0
15.0
14.8
14.7
14.4
10.6
5.2
5.1
4.7
4.4
4.0
74.9
40.5
18.0
11.3
16.2
10.2
18.1
3.5
6.4
3.9
5.0
5.0
5.7
CIT IZEN SERVICES CENTRES (KEP)
GENERAL ELECTRONIC COMMERCIAL REGISTRY (GEMI)
LABOUR INFORMATION SYSTEM ERGANI
CUSTOMS
TAX ADMINISTRATION
MUNICIPALIT IES
ADMINISTRATIVE REGIONS
PROMITHEUS CENTRAL ELECTRONIC REGISTRY FOR PUBLIC PROCUREMENT
MINISTRIES
OFFICES OF ECONOMIC AND COMMERCIAL AFFAIRS IN THE EMBASSIES
REGULATORY AUTHORIT IES
URBAN PLANNING AND CADASTRAL SURVEY OFFICES
COURTS
2018
2017
32Based on your experience during the last two years, please evaluate your overall satisfaction by the quality of services provided by pubic administration, on a
scale from 1 to 5, where 1 = VERY UNSATISFIED and 5 = VERY SATISFIED.
“Best performers”
“Worst performers”
EVALUATION OF QUALITY OF SERVICES PROVIDED BY PUBLIC ADMINISTRATION
Percentages (%) of answers “Satisfied / Very satisfied”
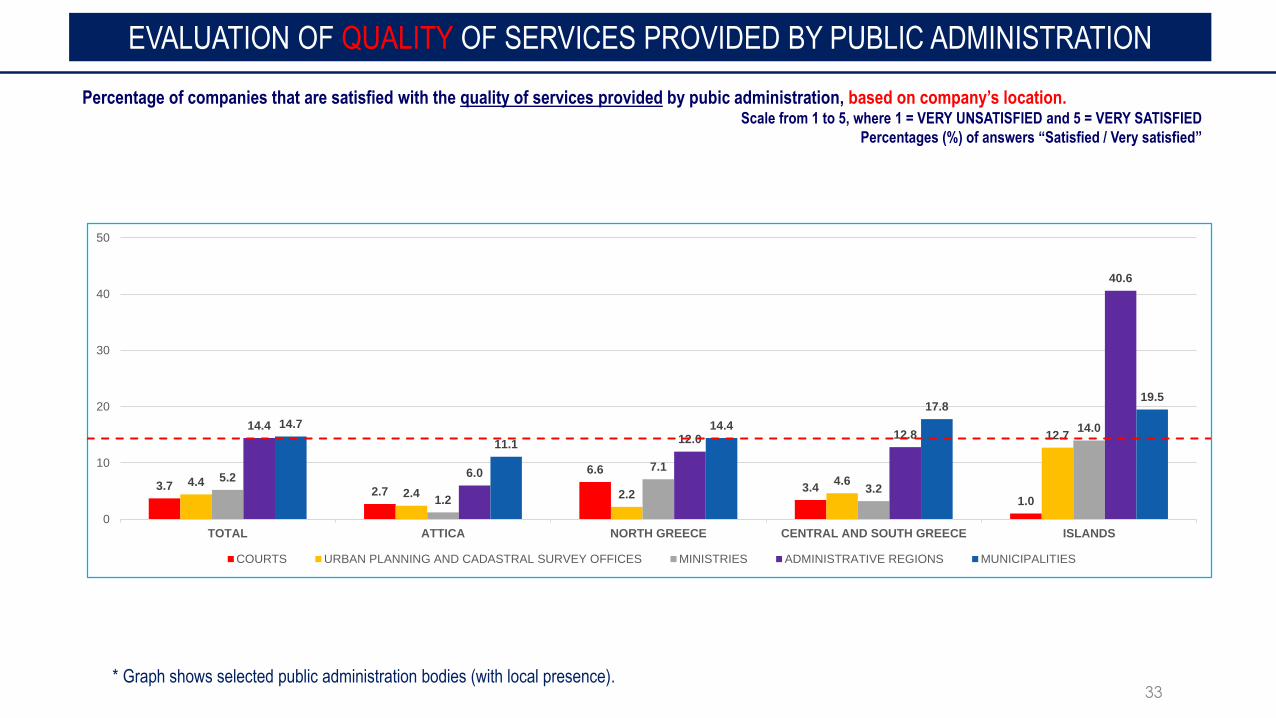
33
33Percentage of companies that are satisfied with the quality of services provided by pubic administration, based on company’s location.Scale from 1 to 5, where 1 = VERY UNSATISFIED and 5 = VERY SATISFIED
Percentages (%) of answers “Satisfied / Very satisfied”
* Graph shows selected public administration bodies (with local presence).
EVALUATION OF QUALITY OF SERVICES PROVIDED BY PUBLIC ADMINISTRATION
3.72.7
6.6
3.41.0
4.42.4 2.2
4.6
12.7
5.2
1.2
7.1
3.2
14.014.4
6.0
12.0 12.8
40.6
14.7
11.1
14.4
17.819.5
0
10
20
30
40
50
TOTAL ATTICA NORTH GREECE CENTRAL AND SOUTH GREECE ISLANDS
COURTS URBAN PLANNING AND CADASTRAL SURVEY OFFICES MINISTRIES ADMINISTRATIVE REGIONS MUNICIPALITIES
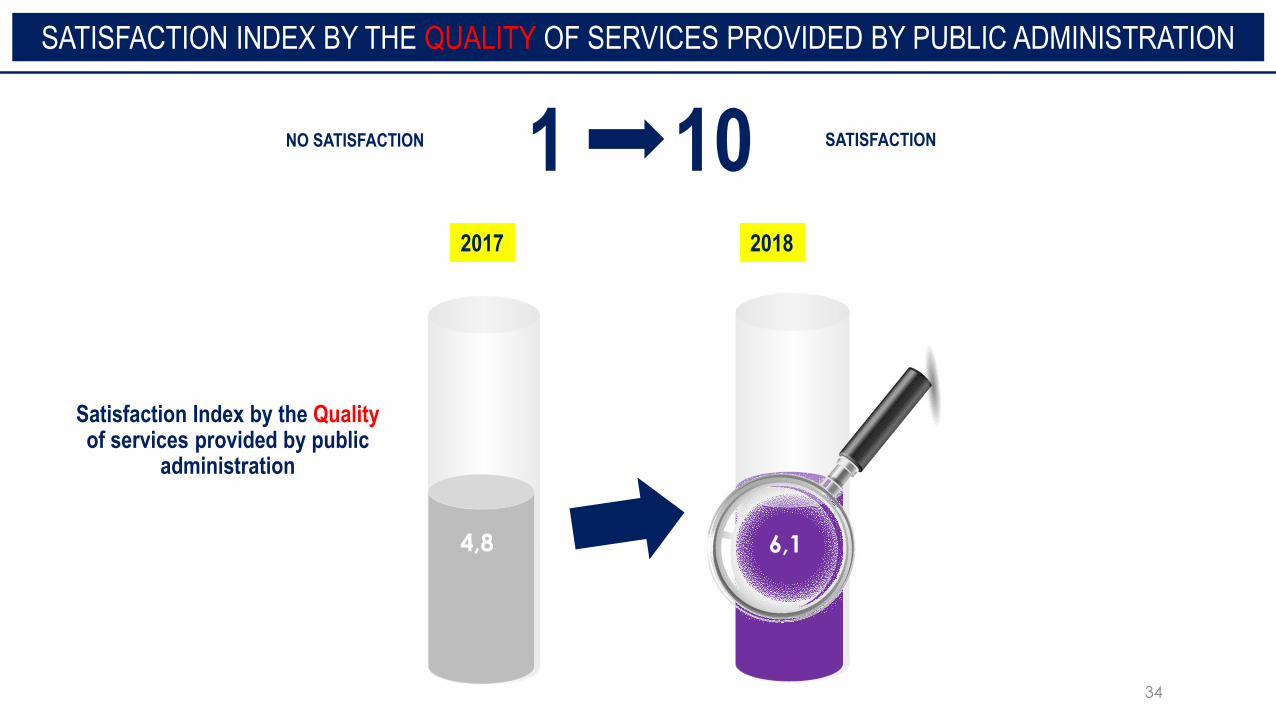
34
2017 2018
SATISFACTION INDEX BY THE QUALITY OF SERVICES PROVIDED BY PUBLIC ADMINISTRATION
NO SATISFACTION SATISFACTION1 10
6,14,8
Satisfaction Index by the Qualityof services provided by public
administration
35
35
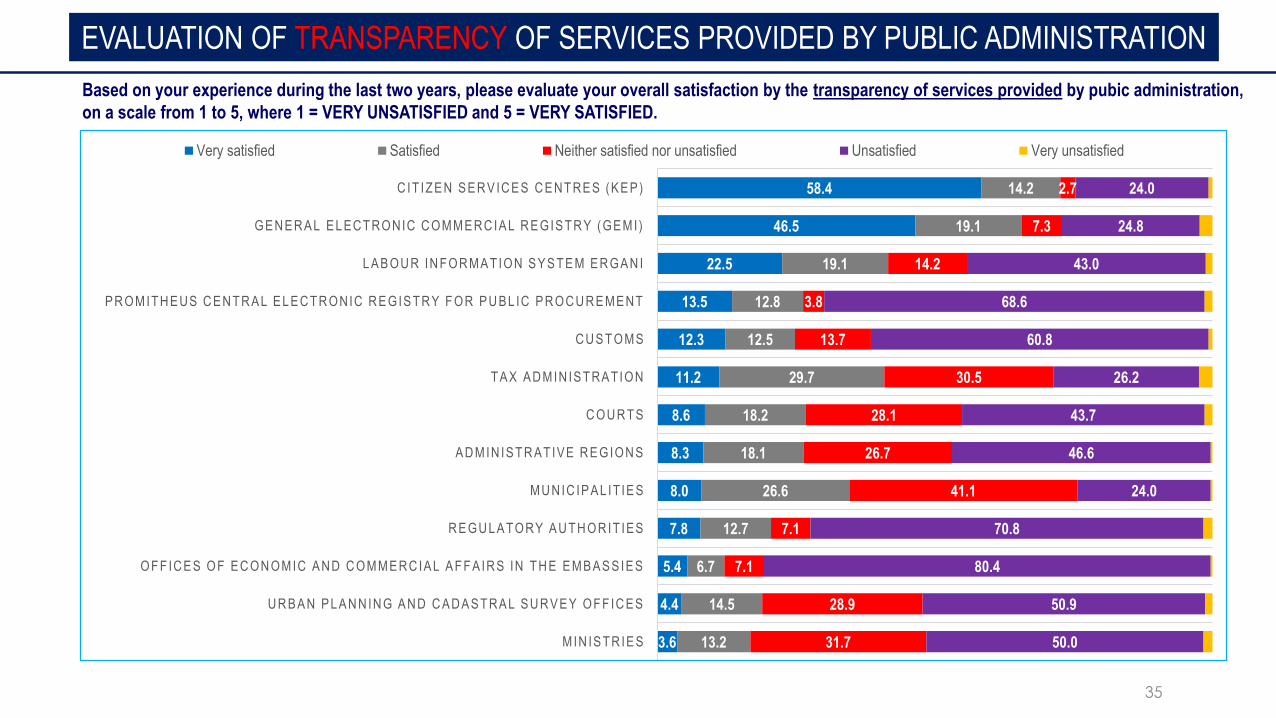
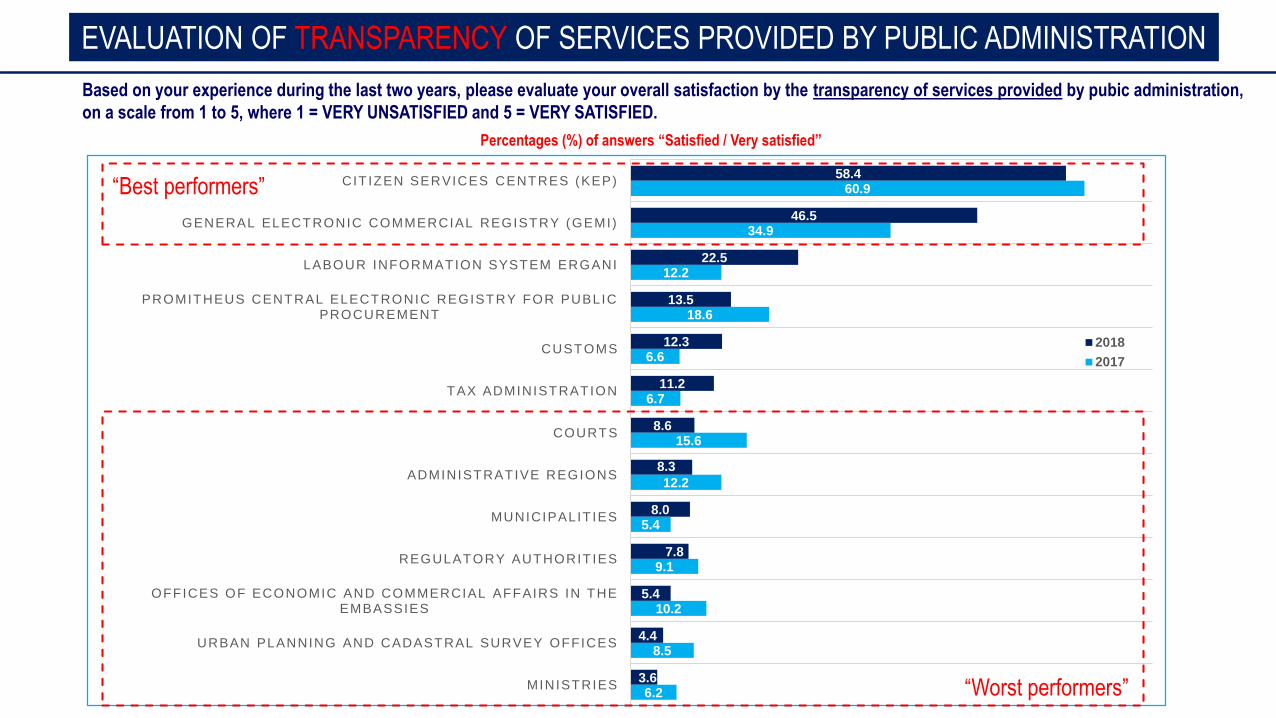
EVALUATION OF TRANSPARENCY OF SERVICES PROVIDED BY PUBLIC ADMINISTRATION
Based on your experience during the last two years, please evaluate your overall satisfaction by the transparency of services provided by pubic administration,
on a scale from 1 to 5, where 1 = VERY UNSATISFIED and 5 = VERY SATISFIED.
58.4
46.5
22.5
13.5
12.3
11.2
8.6
8.3
8.0
7.8
5.4
4.4
3.6
14.2
19.1
19.1
12.8
12.5
29.7
18.2
18.1
26.6
12.7
6.7
14.5
13.2
2.7
7.3
14.2
3.8
13.7
30.5
28.1
26.7
41.1
7.1
7.1
28.9
31.7
24.0
24.8
43.0
68.6
60.8
26.2
43.7
46.6
24.0
70.8
80.4
50.9
50.0
C IT IZ E N S E R V IC E S C E NT RE S (K E P )
GENERAL EL ECT RONIC COMMERCIAL REGIST RY (GEMI )
L A B OU R IN F OR MA T ION S Y S T E M E R GA N I
P R OMIT H E US C E N T R A L E L E C T R ONIC R E GIS T R Y F OR P U B L IC P R OC U R E ME NT
C U S T OMS
T A X A D MIN IS T RA TION
C OU R T S
A D MIN IS T R AT IVE R E GION S
MU N IC IP A L IT IE S
R E GU L A TORY A U T H OR IT IES
OF F IC E S OF E C ON OMIC A N D C OMME R C IA L A F F A IR S IN T H E E MB A S S IE S
U R B A N P L A N N IN G A N D C A D A S T RA L S U R V E Y OF F IC E S
MIN IS T R IE S
Very satisfied Satisfied Neither satisfied nor unsatisfied Unsatisfied Very unsatisfied
36
58.4
46.5
22.5
13.5
12.3
11.2
8.6
8.3
8.0
7.8
5.4
4.4
3.6
60.9
34.9
12.2
18.6
6.6
6.7
15.6
12.2
5.4
9.1
10.2
8.5
6.2
CIT IZEN SERVICES CENTRES (KEP)
GENERAL ELECTRONIC COMMERCIAL REGISTRY (GEMI)
LABOUR INFORMATION SYSTEM ERGANI
PROMITHEUS CENTRAL ELECTRONIC REGISTRY FOR PUBLIC PROCUREMENT
CUSTOMS
TAX ADMINISTRATION
COURTS
ADMINISTRATIVE REGIONS
MUNICIPALIT IES
REGULATORY AUTHORIT IES
OFFICES OF ECONOMIC AND COMMERCIAL AFFAIRS IN THE EMBASSIES
URBAN PLANNING AND CADASTRAL SURVEY OFFICES
MINISTRIES
2018
2017
EVALUATION OF TRANSPARENCY OF SERVICES PROVIDED BY PUBLIC ADMINISTRATION
Based on your experience during the last two years, please evaluate your overall satisfaction by the transparency of services provided by pubic administration,
on a scale from 1 to 5, where 1 = VERY UNSATISFIED and 5 = VERY SATISFIED.
Percentages (%) of answers “Satisfied / Very satisfied”
“Best performers”
“Worst performers”
37
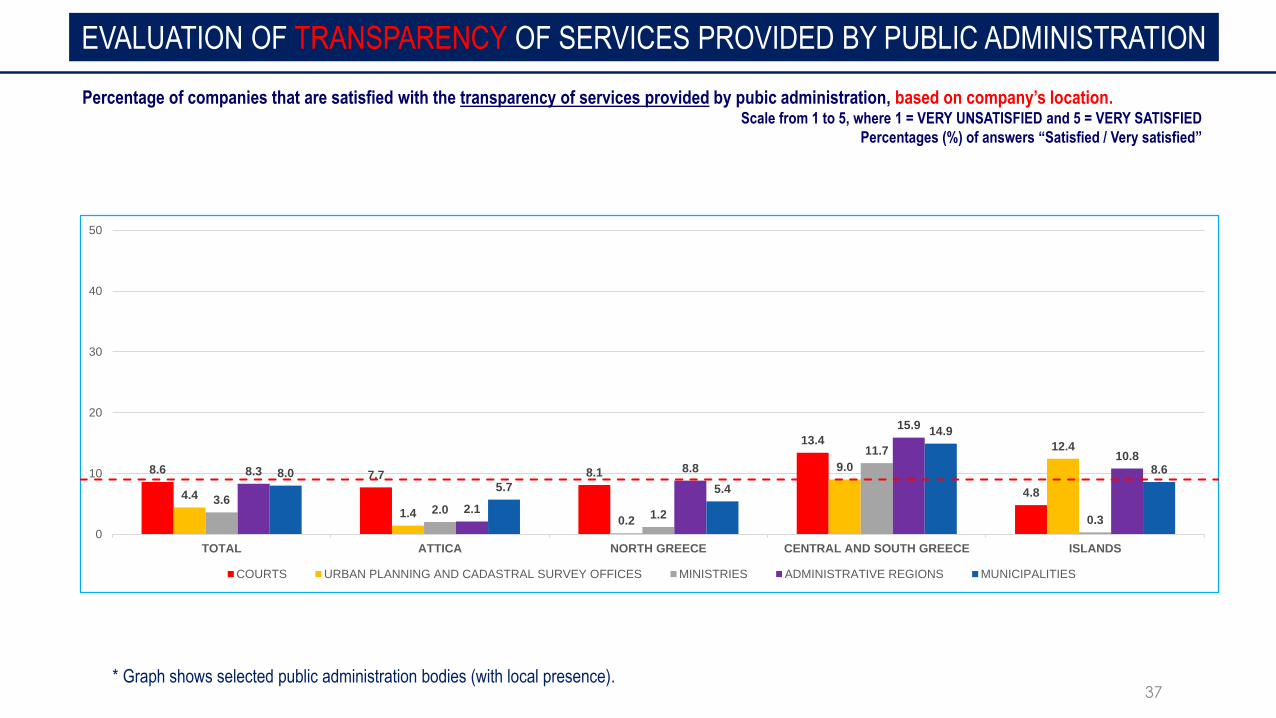
EVALUATION OF TRANSPARENCY OF SERVICES PROVIDED BY PUBLIC ADMINISTRATION
Percentage of companies that are satisfied with the transparency of services provided by pubic administration, based on company’s location.Scale from 1 to 5, where 1 = VERY UNSATISFIED and 5 = VERY SATISFIED
Percentages (%) of answers “Satisfied / Very satisfied”
* Graph shows selected public administration bodies (with local presence).
8.6 7.7 8.1
13.4
4.84.4
1.40.2
9.0
12.4
3.62.0 1.2
11.7
0.3
8.3
2.1
8.8
15.9
10.8
8.05.7 5.4
14.9
8.6
0
10
20
30
40
50
TOTAL ATTICA NORTH GREECE CENTRAL AND SOUTH GREECE ISLANDS
COURTS URBAN PLANNING AND CADASTRAL SURVEY OFFICES MINISTRIES ADMINISTRATIVE REGIONS MUNICIPALITIES
38
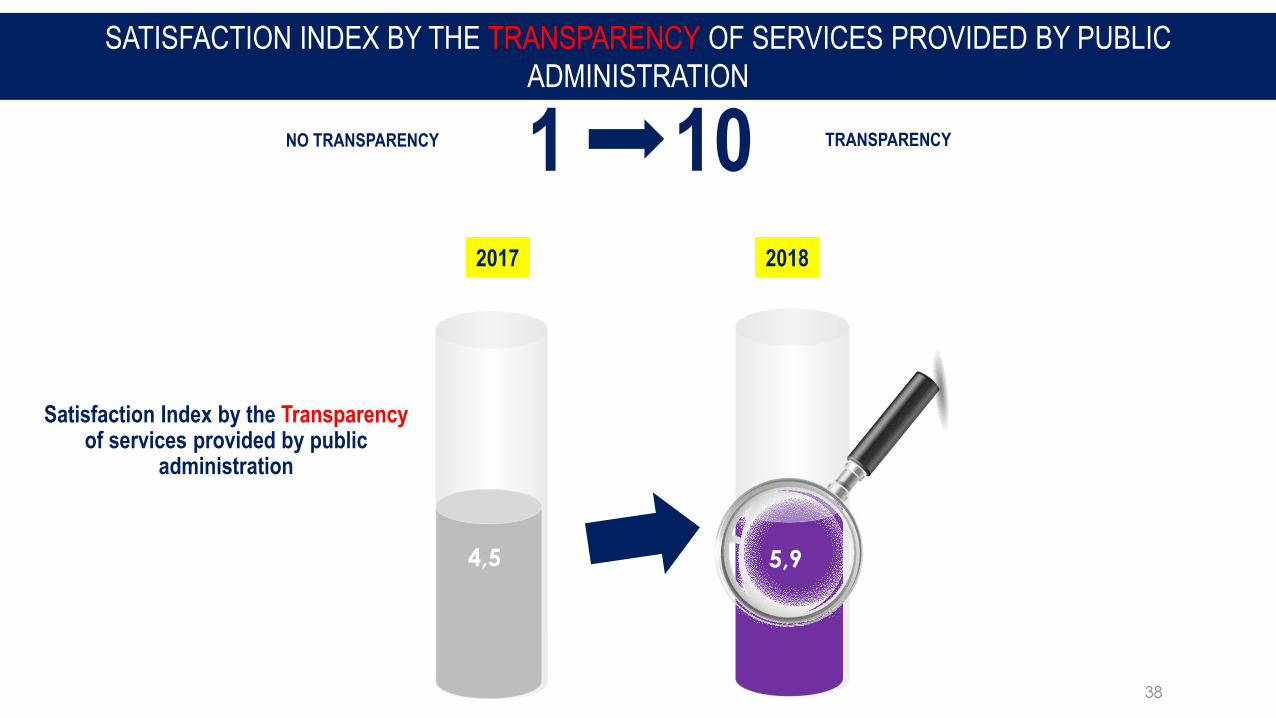
2017 2018
1 10
6,15,94,5
Satisfaction Index by the Transparency of services provided by public
administration
SATISFACTION INDEX BY THE TRANSPARENCY OF SERVICES PROVIDED BY PUBLIC
ADMINISTRATION
NO TRANSPARENCY TRANSPARENCY
39
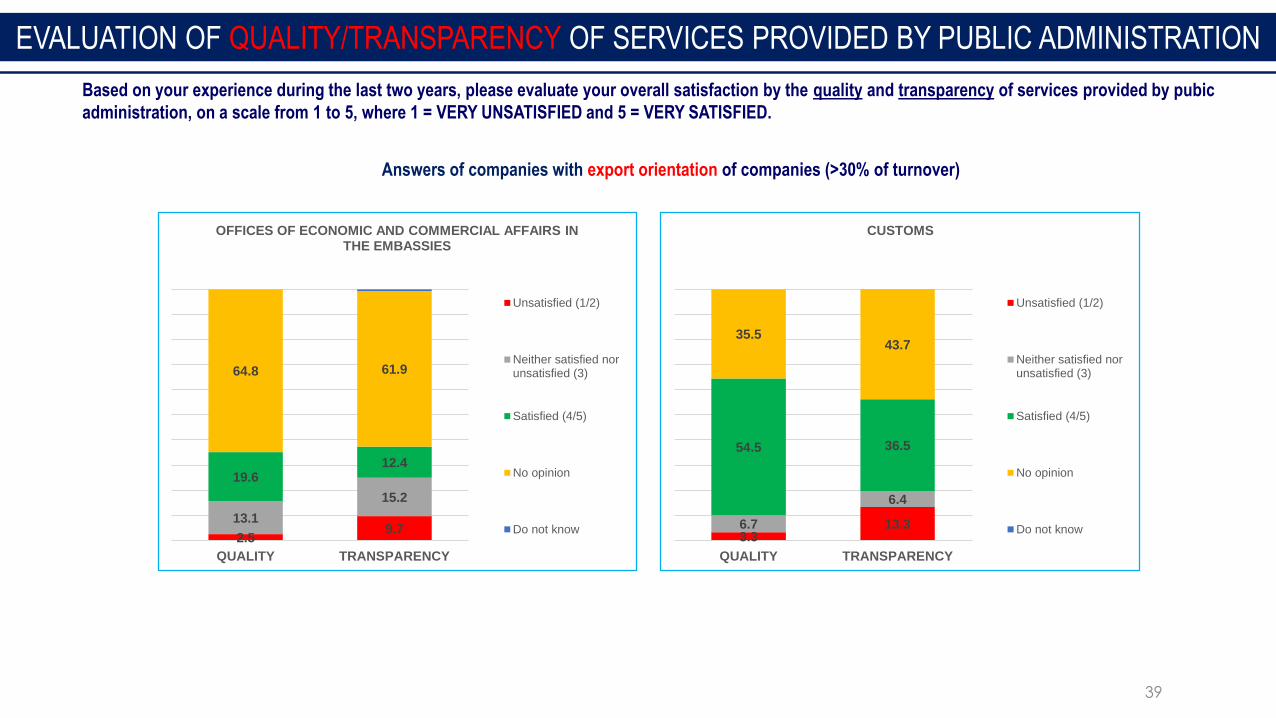
EVALUATION OF QUALITY/TRANSPARENCY OF SERVICES PROVIDED BY PUBLIC ADMINISTRATION
Answers of companies with export orientation of companies (>30% of turnover)
Based on your experience during the last two years, please evaluate your overall satisfaction by the quality and transparency of services provided by pubic
administration, on a scale from 1 to 5, where 1 = VERY UNSATISFIED and 5 = VERY SATISFIED.
3.313.36.7
6.4
54.5 36.5
35.543.7
QUALITY TRANSPARENCY
CUSTOMS
Unsatisfied (1/2)
Neither satisfied norunsatisfied (3)
Satisfied (4/5)
No opinion
Do not know2.5
9.713.1
15.2
19.612.4
64.8 61.9
QUALITY TRANSPARENCY
OFFICES OF ECONOMIC AND COMMERCIAL AFFAIRS IN THE EMBASSIES
Unsatisfied (1/2)
Neither satisfied norunsatisfied (3)
Satisfied (4/5)
No opinion
Do not know
Areas for improvement
for public administration
Areas for improvement
Efficiency (providing services efficiently - timely / at scheduled time period - without errors and omissions)
Service (providing services willingly - devoting time - rapidly)
Trust (transmitting a sense of trust - confidence in the knowledge and skills of the staff - confidentiality of data)
Interest / Courtesy (providing services in a climate of good cooperation / demonstration of personal interest for all phases of each
request - understanding the specialized requests of companies)
Infrastructure (quality of buildings and technological infrastructure, sufficient equipment and logistical infrastructure)
ONLY THOSE WHO ANSWERED VERY UNSATISFIED / UNSATISFIED / NEITHER
SATISFIED NOR SATISFIED BY THE QUALITY OF SERVICES PROVIDED BY
PUBLIC ADMINISTRATION
42
70.8
70.2
63.4
53.9
53.0
51.6
50.9
37.5
35.5
33.5
31.8
29.0
21.7
55.8
62.4
53.6
29.6
52.7
47.9
47.2
32.6
39.4
32.5
44.2
36.8
40.7
48.9
40.4
44.0
39.8
41.5
43.8
39.1
28.2
14.8
21.7
19.7
32.1
15.0
49.1
39.8
28.0
19.4
30.3
31.3
38.1
22.9
15.5
13.0
30.3
19.2
11.2
47.2
33.1
29.0
21.2
30.1
32.4
30.7
24.4
21.7
22.0
14.2
18.7
32.7
18.8
8.2
14.9
12.9
17.3
20.9
24.7
21.7
22.3
21.3
MUNICIPALITIES
MINISTRIES
COURTS
REGULATORY AUTHORITIES
URBAN PLANNING AND CADASTRAL SURVEY OFFICES
TAX ADMINISTRATION
ADMINISTRATIVE REGIONS
LABOUR INFORMATION SYSTEM ERGANI
GENERAL ELECTRONIC COMMERCIAL REGISTRY (GEMI)
PROMITHEUS CENTRAL ELECTRONIC REGISTRY FOR PUBLIC PROCUREMENT
OFFICES OF ECONOMIC AND COMMERCIAL AFFAIRS IN THE EMBASSIES
CUSTOMS
CITIZEN SERVICES CENTRES (KEP)
EFFICIENCY SERVICE TRUST INTEREST / COURTESY INFRASTRUCTURE DO NOT KNOW / NO OPINION
Based on your experience with the specific public administration bodies, in which areas should they improve in order to upgrade the quality of services
provided?
SUGGESTED AREAS OF IMPROVEMENT OF PUBIC ADMINISTRATION SERVICES
* Availability for multiple answers
Business environment
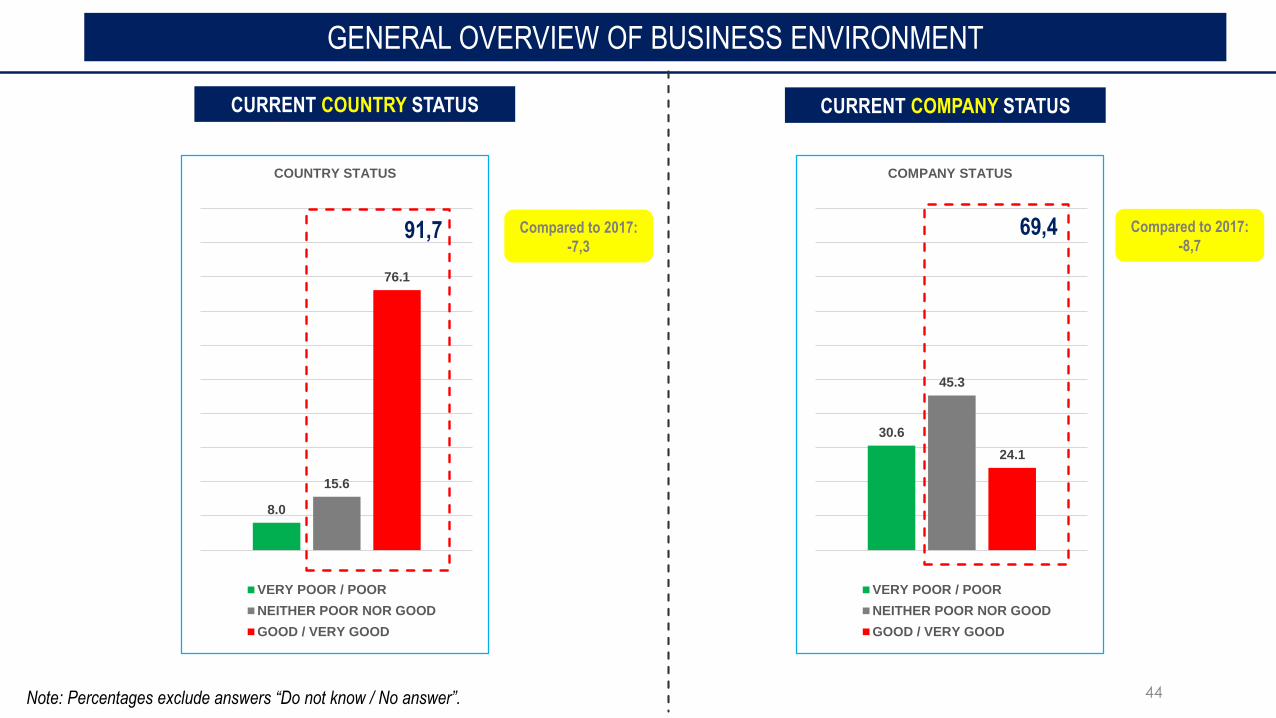
44
30.6
45.3
24.1
COMPANY STATUS
VERY POOR / POOR
NEITHER POOR NOR GOOD
GOOD / VERY GOOD
8.0
15.6
76.1
COUNTRY STATUS
VERY POOR / POOR
NEITHER POOR NOR GOOD
GOOD / VERY GOOD
69,4
Note: Percentages exclude answers “Do not know / No answer”.
Compared to 2017:
-8,7
GENERAL OVERVIEW OF BUSINESS ENVIRONMENT
CURRENT COUNTRY STATUS CURRENT COMPANY STATUS
91,7 Compared to 2017:
-7,3
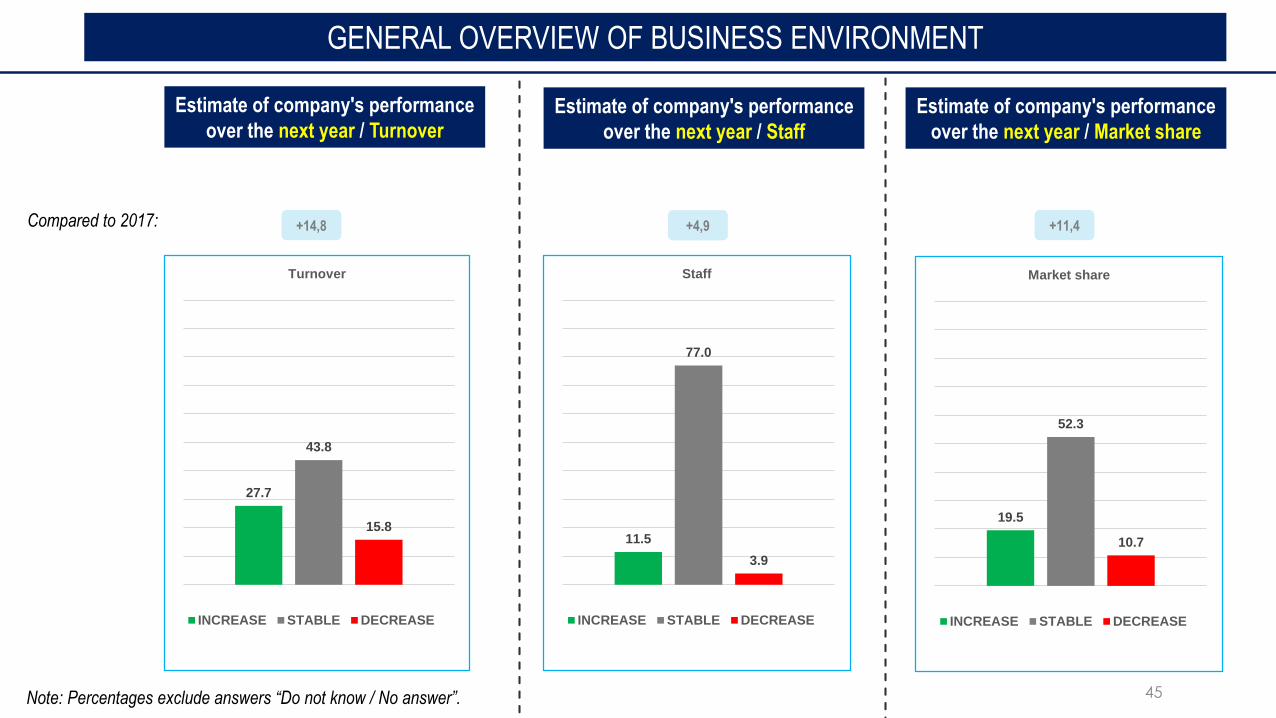
45
+14,8 +4,9 +11,4Compared to 2017:
Estimate of company's performance
over the next year / TurnoverEstimate of company's performance
over the next year / Staff
Estimate of company's performance
over the next year / Market share
GENERAL OVERVIEW OF BUSINESS ENVIRONMENT
Note: Percentages exclude answers “Do not know / No answer”.
27.7
43.8
15.8
Turnover
INCREASE STABLE DECREASE
11.5
77.0
3.9
Staff
INCREASE STABLE DECREASE
19.5
52.3
10.7
Market share
INCREASE STABLE DECREASE
46
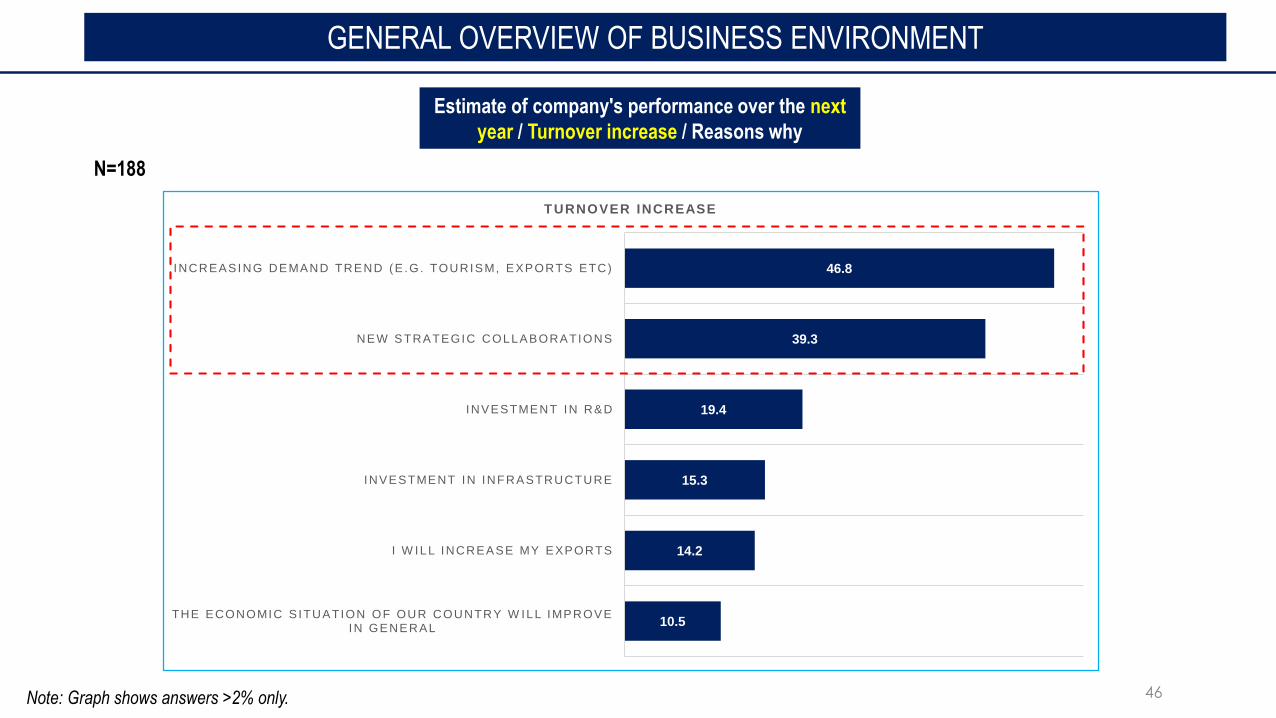
Ν=188
Estimate of company's performance over the next
year / Turnover increase / Reasons why
GENERAL OVERVIEW OF BUSINESS ENVIRONMENT
Note: Graph shows answers >2% only.
46.8
39.3
19.4
15.3
14.2
10.5
INCREASING DEMAND TREND (E .G. TOURISM, EXPORTS ETC)
NEW STRATEGIC COLLABORATIONS
INVESTMENT IN R&D
INVESTMENT IN INFRASTRUCTURE
I W ILL INCREASE MY EXPORTS
THE ECONOMIC S ITUATION OF OUR COUNTRY W ILL IMPROVE IN GENERAL
TURNOVER INCREASE
47
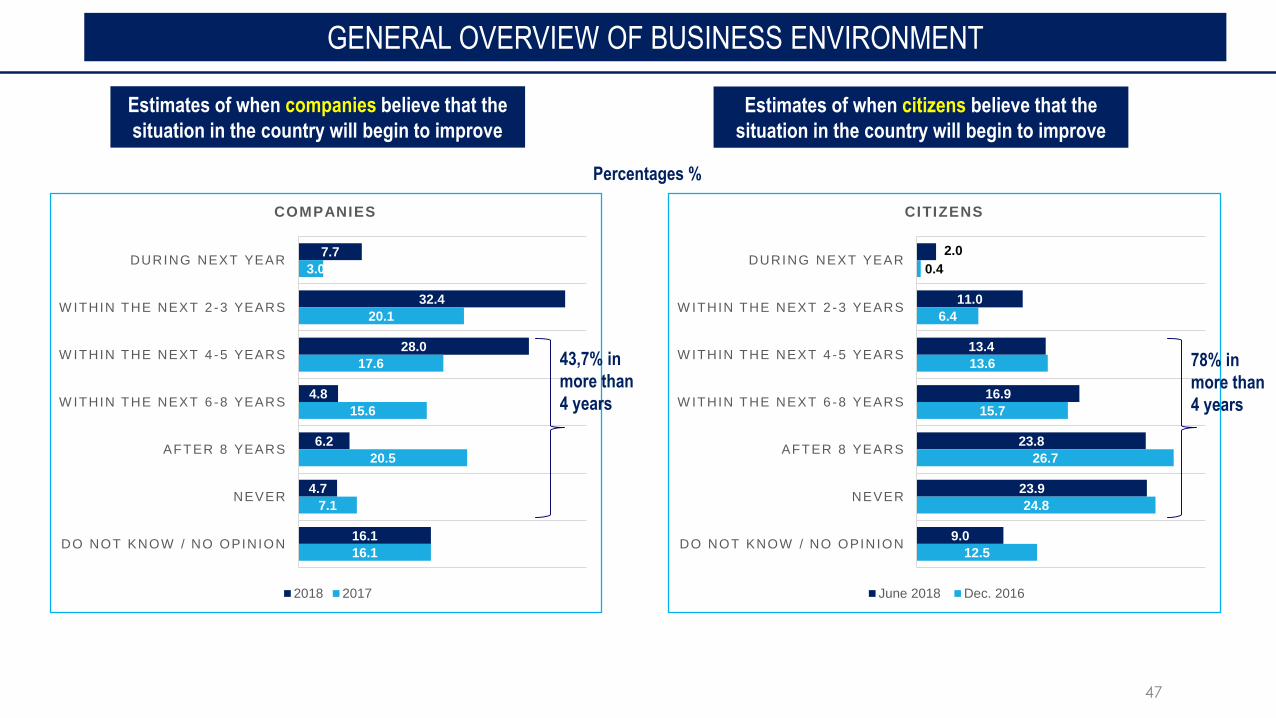
2.0
11.0
13.4
16.9
23.8
23.9
9.0
0.4
6.4
13.6
15.7
26.7
24.8
12.5
DURING NEXT YEAR
W ITHIN THE NEXT 2 -3 YEARS
W ITHIN THE NEXT 4 -5 YEARS
W ITHIN THE NEXT 6 -8 YEARS
AFTER 8 YEARS
NEVER
DO NOT KNOW / NO OPINION
CITIZENS
June 2018 Dec. 2016
7.7
32.4
28.0
4.8
6.2
4.7
16.1
3.0
20.1
17.6
15.6
20.5
7.1
16.1
DURING NEXT YEAR
W ITHIN THE NEXT 2 -3 YEARS
W ITHIN THE NEXT 4 -5 YEARS
W ITHIN THE NEXT 6 -8 YEARS
AFTER 8 YEARS
NEVER
DO NOT KNOW / NO OPINION
COMPANIES
2018 2017
Percentages %
43,7% in
more than
4 years
GENERAL OVERVIEW OF BUSINESS ENVIRONMENT
Estimates of when companies believe that the
situation in the country will begin to improve
Estimates of when citizens believe that the
situation in the country will begin to improve
78% in
more than
4 years
“Business Pulse” Measuring business friendly regulatory environment in Greece
“A customer satisfaction survey”
October 2018
A survey by:


![Variations on Japanese Children's Songs (1981) [Mrb]](https://img.pdfslide.us/doc/110x75/5695d1931a28ab9b02971691/variations-on-japanese-childrens-songs-1981-mrb.jpg)