Embed Size (px)
Citation preview
Recommended methods for conducting human factors experiments on the subjective evaluation of colour rendition Michael P. Royera,b Kevin Houserb,a Dorukalp Durmusc,a Tony Espositod Minchen Weie
a Pacific Northwest National Laboratory, Portland, OR, USA b School of Civil and Construction Engineering, Oregon State University, Corvallis, OR, USA c Department of Architectural Engineering, Penn State University, University Park, PA, USA d Lighting Research Solutions, LLC, Cambridge, MA, USA e Department of Building Services Engineering, The Hong Kong Polytechnic University, Hung Hom, Hong Kong
Corresponding Author: Michael P. Royer, Pacific Northwest National Laboratory, 620 SW, 5th Ave, Suite 810, Portland, OR 97204, USA. E-mail: [email protected]
This is an archival copy of an article first published online June 2, 2021, in Lighting Research & Technology. Please cite as:
Royer M, Houser K, Durmus D, Esposito T, and Wei M. Recommended methods for conducting human factors experiments on the subjective evaluation of colour rendition, Lighting Research & Technology, Online First June 2, 2021. doi.org/10.1177/14771535211019864
p. 2
Abstract This article explores best practices for conducting psychophysical experiments that investigate how colour rendition influences the perception of architectural environments. We offer guidance that covers all stages of research from preliminary development to publication, focusing especially on experiments that investigate qualities such as perceived naturalness, vividness, preference, or acceptability in response to changes in the spectral power distribution (SPD) of light sources. This article is intended to be a consolidated guide for researchers and reviewers of this type of research. Key recommendations include: 1) New work should be motivated by clearly expressed research questions and, when possible, explicit hypotheses that build on the existing body of knowledge, 2) Visual stimuli comprising SPDs and visual targets should be deliberately engineered to probe the research questions, 3) Experiments should be designed to lessen potential biases, 4) Reporting of experimental conditions and statistical analyses should be thorough, and 5) Results should be contextual, resisting overgeneralization that cannot be supported by the data. Our motivation is to encourage high quality research that is credible and discourage poor quality research that slows scientific progress and misuses resources.
p. 3
1. Introduction Colour rendition describes the influence of light source spectrum on the colour appearance of objects. The ability of a light source to render object colours in desirable ways has attracted much attention in the lighting community. Efforts to quantify colour rendition can be traced to the work of Bouma,1 who in the 1930s proposed an eight-band method to characterize the similarity between a light sources’ spectral power distribution (SPD) and the SPD of a model of daylight. In the more than 80 years since Bouma’s first study, many others have endeavoured to advance the theory and practice of how light source spectrum affects perceptions of object colour. Researchers have commonly employed psychophysical experimental techniques where human participants are asked to evaluate various subjective aspects of object colour appearance (e.g. colour preference, naturalness, vividness, acceptability) when a laboratory setting is illuminated by light of different SPDs. This article provides recommendations on the methods used in this type of research, although many of the recommendations are applicable to other experimental paradigms, including field studies, meta analyses, and the development of metrics that are intended to predict colour perceptions.
The number of articles reporting psychophysical experiments on subjective evaluations of colour rendition has significantly increased in the last decade, with more than 49 articles published since 2010,2–50 likely accounting for more than half of the published work of this nature. This intensifying interest has at least two causes, both arising because LEDs can have different spectral features than predecessor technologies and because the composite spectrum of an LED-based system can be engineered with relative ease. First, the scientific community has recognized that the CIE general colour rendering index Ra (colloquially, “CRI”) is an inaccurate measure of colour fidelity and has limited utility when used alone for characterizing other facets of colour rendition, such as colour preference or colour naturalness.51–59 Second, the availability of spectrally-tunable LED-based lighting systems has made it practical to generate a wide variety of lighting conditions, allowing researchers to more easily explore possibilities.
Increased interest in psychophysical experimentation on subjective evaluations of colour rendition and the ease with which these experiments can now be performed has not necessarily translated into improved research quality, a more diverse range of experiments, or more definitive findings. While the growing volume of research has increased knowledge and acceptance of the most detectable effects, the collective body of work has sometimes produced contradictory results, with widespread publication of research that employed questionable methods (by current standards) and overgeneralized the results.
A whirlwind of unfocused research activity leads to increased noise, not increased clarity. For example, CIE Ra has been reported to be a very good predictor of perceived naturalness (r > 0.9),12 but also very poor for that purpose (r < 0.3).24 Between these two examples, there were substantial differences in the colour rendition characteristics of the lighting stimuli, the objects viewed, the apparatus used, and procedures followed, so it is not possible to isolate a single factor causing the discrepancy in findings. Each of these important aspects of research design is discussed further in this article. Another contrast can be observed in reports of the importance of chromaticity for subjective evaluations of colour quality. Some studies40,41,60,61 that have employed relatively short periods of adaptation (≤ 1 min) coupled with variation in chromaticity between stimuli have reported chromaticity to be a significant or even dominant factor, whereas others27,29,44 that have employed procedures with longer periods of chromatic adaptation (> 3 mins) with stimuli grouped based on chromaticity have not—again, other aspects varied as well. As a third example, the importance of gamut area as a predictor of colour preference has been affirmed by some7,62 but revealed to have limitations by others.18,24,37 A key methodological difference that may explain the different conclusions is how SPD was operationalized.
p. 4
The goal of this article is not to determine what is “correct,” and evaluation of experimental results is not within the scope. Rather, these examples illustrate how research methods may affect experimental results, research conclusions, and design practice.
We were motivated to write this paper to encourage exceptional practices in conceptualization, design, implementation, analysis, and reporting of psychophysical experiments on light source colour rendition. We hope this manuscript will be of value for those planning studies and for those interpreting the results of others. We have tried to avoid duplicating general knowledge, such as best practices for psychophysical experiments, statistical analysis methods, open science, or general research quality considerations, as these topics are well covered by others, including specific treatment in lighting.63 Within the length and scope limits of a journal article, we describe what we believe to be the most important methodological considerations specifically related to laboratory-based psychophysical experiments on the subjective evaluation of scene colour appearance as influenced by light source spectrum (i.e. colour rendition).
2. Conceptualizing Colour Rendition Experiments There are many aspects of research conceptualization, including understanding the target audience, need, relevance, required effort, available budget, and existing capabilities that are important but not the focus of this article. Rather, here we limit our focus to three conceptualization topics: literature review and contextualization, developing appropriate research questions, and the difference between exploratory and confirmatory research.
2.1. Literature Review To conceptualize new research, it is important to understand the context provided by prior work, and in the case of subjective evaluations of colour rendition, there is an extensive body of literature.2–50,62,64–81 A well-executed and reported literature review should support and justify an experiment by positioning the research question(s) within an appropriate historical context and synthesizing past results within a contemporary framework. The latter is important, and challenging, because the conclusions of older work should not be blindly repeated, as subsequent research with modern methodologies may reveal previously unseen issues. For example, previous research indicated that gamut area measures are sufficient for capturing subjective qualities related to preference,e.g. 2,62,80,82,83 but newer research has shown that such hue-averaged measures are less informative when gamut shape84 is varied.e.g.
24,27,29,37,38,44 A similar issue has arisen with gamut area and colour discrimination.85,86 An incomplete assessment of the body of colour rendition literature could lead to an experimental design that is inadequate by today’s standards.
It is recommended that researchers conduct and report thorough literature reviews that connect the present work to the lineage of preceding work, with an emphasis on contemporary work that is directly applicable to the research question being posed. The citations included in this article—although not exhaustive—were selected to provide a good basis for understanding the body of literature. Further, it is recommended that authors scrutinize reviewed literature, including both the methods and results, based on current understanding. It is the limitations of past work that often justify new work.
2.2. Research Questions In conjunction with a literature review, experiment planning begins with a question. For example, Judd87 asked whether some colour shifts are more preferred than others. Houser and colleagues88 asked if a light source with proportionally more radiation near the prime colour wavelengths enhances brightness and colour perception. Several recent studies inquired about the relationship between colour rendition
p. 5
measures in ANSI/IES TM-3056,89,90 and subjective evaluations of naturalness, preference, and vividness.24,27,29,37,44
As this article continues, we will consider an arbitrary example where a hypothetical research team has identified the need to investigate the subjective evaluations of red tomatoes. Some specific research questions might be:
1. Do changes in SPD lead to changes in the preference for the colour of red tomatoes? 2. What level of chroma maximizes the colour preference of the tomatoes? 3. Do hue shifts affect the perceived ripeness of tomatoes? 4. Is colour preference of the tomatoes related to other aspects of the visual appreciation of the
tomatoes, such as perceived naturalness or saturation? 5. In what manner does context, such as placing the red tomatoes adjacent to other foods or
objects, affect the subjective evaluations?
The choice of the specific questions depends on many of the factors previously mentioned, including target audience, budget, and state of prior knowledge.
2.3. Research Types There are two primary classes of research, exploratory and confirmatory,91 each of which has appropriate uses.92 Understanding their differences is important for deciphering and weighing the results.93
When limited or no precedent exists, researchers may conduct exploratory research to investigate relationships between variables. This may take the form of “If X changes, what happens to Y?” This type of research is useful to gain a better understanding of a new or recently defined problem before a hypothesis can be solidified. It does not lend itself to conclusive or generalizable results but instead helps identify possible new relationships between variables and preliminary estimates of variance, which are useful for power analyses for subsequent studies. Exploratory research is most appropriate toward the beginning of a line of inquiry, as exemplified in the work of Judd87 and Thornton,94 or the early days of a research project, published as a “pilot study” (e.g. Houser et al.,77 Wang and Wei,95 Yang and Wei96). It helps sharpen the focus of research questions for subsequent studies.
Exploratory methods could help answer a question such as, “Do changes in SPD lead to changes in the preference for the colour of red tomatoes?” To probe this question, a handful of commercially available lamps could be selected (or several could be mixed together) to alter the colour appearance of the red tomatoes, the visual stimuli could then be shown to a sample of people, and their ratings of preference in response to those changes could be recorded. If the chosen light sources happened to have changed the tomatoes’ chroma, it would have provided early evidence that object chroma influences colour preference.e.g. 67,68,87,97,98 However, such results should not be interpreted to be predictive of what will happen if the same variable is manipulated in a different way in the future.
Exploratory research might inspire the development of a confirmatory experiment to further investigate the findings and establish a causal relationship. Confirmatory experiments typically utilize null-hypothesis (H0) significance testing and inferential statistics. Statistically, a hypothesis is a statement about a probability distribution or a population parameter. Informally, a hypothesis is a statement that is true in an alternate, imagined world (the alternate hypothesis, Ha). Continuing the example with the red tomatoes, an experimenter might test null and alternate hypotheses such as:
Null hypothesis, H0: Red chroma shift is not related to the colour preference of red tomatoes
p. 6
Alternate hypothesis, Ha: Increased red chroma is positively correlated with the colour preference of red tomatoes
The experimenter seeks data to support the alternative hypothesis (Ha) and reject the null hypothesis. Only through repeated and rigorous attempts to disprove the alternate hypothesis (Ha), and failing to do so, can we have confidence that the null hypothesis is likely untrue. It should be noted that a null hypothesis (H0) cannot be proven correct but can only be proven unlikely because hypothesis testing is based on the falsification theory.99 An effect can only be confidently established within the range of conditions studied. So, for example, given contemporary knowledge, we know that the alternative hypothesis given above is true up to a specific red chroma level, after which preference will decline as chroma shift oversaturates the red appearance of the tomatoes. Such nuance can be captured with progressively refined alternate hypotheses, such as:
Alternative hypothesis, H1: Decreased red chroma is negatively correlated with colour preference of red tomatoes
Alternative hypothesis, H2: Increased red chroma is positively correlated with colour preference of red tomatoes, up to a limit
Alternative hypothesis, H3: If red chroma is increased past a limit, colour preference of red tomatoes will begin to decline
This sequence of alternative hypotheses progressively bracket expectations as knowledge of the phenomenon grows. Further refinements of the hypotheses are possible by expressing them in quantitative terms; for example, replacing the phrase “red chroma shift” with a measurable quantity such as Rcs,h1 from ANSI/IES TM-30-20, and the vague notion of “limit” can be replaced with mathematical operators and values, such as:
Alternative hypothesis, H4: Colour preference of red tomatoes will be most preferred if -1% ≤ Rcs,h1 ≤ 15%, if viewed within a polychromatic environment at an illuminance between 200 and 700 lx
Depending on the complexity of the problem and available resources, it may take months, years, or decades to defensibly advance the specificity of alternative hypotheses. Given the advanced state of research on subjective evaluations of colour rendition, in most circumstances confirmatory research should be pursued rather than exploratory research, although there are new branches just beginning to be explored. In short, researchers should intentionally vary specific aspects of the visual stimulus based on an anticipated effect on the subjective evaluation, rather than simply generating a collection of SPDs and seeing what existing metrics best fit the response data.
3. Designing and Performing Colour Rendition Experiments The primary goal of experimental design is to devise a way to answer the research question that is credible, repeatable, and produces valuable results. Designing an experiment requires definition of the variables, apparatus, procedures, participants, and statistical analyses to be conducted, all in order to limit or counteract bias. Bias is the systematic error that causes distortions in the results of a study, which can occur throughout the design, participant selection, data collection, measurement, analysis, and publication processes.100–102 Experimental design is often an iterative process; as such, the order in which specific topics are presented in this section is not a recommended sequence and does not indicate the level of importance.
For confirmatory research, we recommend developing and explicitly documenting an experimental design and analysis plan prior to executing a study. This documentation may be internal (i.e. shared only
p. 7
among the research team), or external using a process known as preregistration,103,104 but the key is to differentiate between planned and unplanned research. There has been extensive discussion about replication in scientific research,105–107 or the fact that many published results, perhaps even a majority, are not replicated when the same experiment is repeated. It is evident that choices made by researchers regarding the design, conduct, and analysis of experiments—sometimes called researcher degrees of freedom—can influence the conclusions,108–111 for example, by increasing chances of false positive findings or inflating effect sizes. Carefully designing and thoroughly documenting an experimental plan, as well as following the plan exactly, is a strongly recommended practice that can help address the replication crisis.
3.1. Defining and Operationalizing Variables Operationalization is the process of defining the variables under investigation, accompanied by an explicit method of measuring such variables. Variables fall into three major categories: independent (i.e. the “causes”), dependent (i.e. the “effects”), and control. Independent variables are systematically manipulated in controlled experiments or thoroughly measured and reported in field studies. Dependent variables—also referred to as dependent measures—are the responses of interest, and may include perceptual, behavioural, or physiological outcomes. Control variables are known sources of variation, but of peripheral interest to the active study, and are intentionally fixed. They are held constant because, if not, they could confound results and make it difficult or impossible to make credible inferences between cause and effect. They can also help constrain the scope of a project. When a factor is not well controlled and not systematically manipulated, it becomes an uncontrolled or nuisance variable, which can harm the credibility of an experiment and the veracity of the results.
In the example of the red tomatoes, operationalization requires specifying the aspects of the SPD that will be varied to form the independent variable, such as Rcs,h1 according to the H4 hypothesis. It also requires precisely specifying the dependent measures, such as a numerical rating scale from 1 to 10 where 1 is least preferred and 10 is most preferred. Finally, it requires identifying lighting and non-lighting aspects that must be held constant to avoid creating a confounding variable, such as illuminance, gamut shape, or the tomatoes being evaluated (among others).
3.1.1. Types of Independent and Control Variables In typical experiments on subjective evaluations of colour rendition, essentially all lighting-related characteristics should be designated as independent or controlled variables—or as a last resort, as uncontrolled variables. The large variety of lighting conditions that can be manipulated or controlled by lighting researchers can be summarized in four major categories: spatial, temporal, intensity, and spectral. Spatial relates to the geometric patterns of optical radiation in an observer’s field of view. Temporal relates to the duration of exposure to optical radiation and the timing of that exposure. Intensity relates to the quantity of optical radiation. Spectral factors, dominant in colour rendition research, concern the wavelength distribution of optical radiation as described by a light source’s SPD. Optical radiation is normally weighted by an appropriate spectral weighting function to convert radiometric units to photometric, colorimetric, or physiological quantities intended to correlate with a perceptual or biological response.
While this manuscript focuses on experimental design considerations related to spectral factors, this does not diminish the importance of spatial, temporal, and intensity factors. We encourage review of other sources that treat those variables with greater detail.e.g. 63,112 A researcher may intend to vary only one or a few aspects of the illumination, but because variables are related, care is needed to ensure that intentional variation of one aspect does not produce unintentional variation in another. For example, light source spectrum often varies with dimming state. If not controlled, spectrum and intensity may be
p. 8
confounded, making it impossible to make independent inferences about either. Therefore, mechanical dimming is often employed in research where spectrum and light level must both be controlled.e.g.
15,37,113
3.1.2. Quantifying Independent and Control Variables Almost all research about perceptions of colour rendition involves varying the SPD of the light. While readily measured, SPD is still an infinitely complex independent variable. SPD is not particularly useful as a variable on its own because, for the purpose of operationalization, SPD must be reduced to a set of numbers that are expected to relate to one or more human responses. We recommend the following methods for characterizing many aspects of SPDs, which are rooted in the consensus recommendations of the International Commission on Illumination (CIE from its French title, Commission Internationale de l´Eclairage), Illumination Engineering Society (IES), and NEMA (National Electrical Manufacturers Association) that follow either ISO (International Standards Organization) or ANSI (American National Standards Institute) protocols and are recommended for scientific use:
• Chromaticity expressed with correlated colour temperature (CCT)114 and the distance of the light source chromaticity from the Planckian locus, Duv.115,116 Chromaticity can be equivalently expressed with CIE 1931 (x, y) or 1976 (u', v') chromaticity coordinates using the CIE 1931 2° standard observer, though context may also make it more suitable to employ the CIE 1964 10° standard observer or one of the CIE 2015 cone-fundamental-based tristimulus functions.114
• An average measure of colour fidelity. For accurate scientific use as expected in a peer-reviewed journal, Rf from CIE 224:2017 and ANSI/IES TM-30-20 should be employed.56,58,89,90
• A measure of relative gamut area, such as Rg from ANSI/IES TM-30-20.56,89,90 • Measures of chroma and hue shifts, such as Rcs,hj and Rhs,hj from ANSI/IES TM-30-20,84,89 which
relate to gamut shape and have been shown to be crucial for predicting subjective evaluations of colour rendition.e.g. 16,18,24,37
• An average measure of “red” fidelity, such as Rf,h1 from ANSI/IES TM-30-20. • A measure of the absolute quantity of illumination, such as luminance or illuminance. If this
varies spatially (across the scene) or temporally (across parts of the experiment), then such variation should be documented. The specific measure of quantity may vary with application. Illuminance is commonly used in laboratory-based colour rendition studies; luminance is commonly used in exterior or roadway lighting studies.
• Measures of photopigment responses weighted by α-opic action spectra,117 in accordance with recent reporting guidance.118 There is emerging evidence that response of intrinsically-photosensitive retinal ganglion cells, for example, may contribute to color perception.119,120
Beyond these requisites, other measures that are applicable should be reported. For example, other measures from ANSI/IES TM-30-20 may be relevant for specific objects, and reporting non-standardized measures is important when experimenting on the performance of new methods for evaluating light source colour rendition. Additionally, even though it is not recommended for scientific use, researchers may want to report Ra or other measures from CIE 13.3-1995 that are still used in professional practice.
Many SPD-derived quantities are documented in the scientific literature. The examples given below have, to date, not been adopted through a consensus-based process, but they offer unique information not currently covered with standardized measures and may have utility for research on subjective evaluations of colour rendition. Therefore, we recommend using and reporting these measures as appropriate:
• Alternative systems for quantifying light source chromaticity, based on a standard observer that is more representative of the experimental conditions (i.e. larger field of view). e.g. 121–124
p. 9
• Metrics quantifying metameric mismatch or metameric uncertainty. e.g. 125,126 • Metrics of colour discrimination. e.g. 86 • Metrics of colour preference.e.g. 3,51 • Ability of the source spectrum to excite fluorescent whitening agents (FWAs). e.g. 113,127,128
We expect continued refinement and debate about how to reduce light source SPDs to a set of numbers that correlate with human responses in laboratory and/or real-world settings, are simple to communicate, and are valuable for lighting practice. That is, we anticipate new research will continue to probe the effectiveness of existing and new non-standardized measures. We view this positively and are optimistic for future innovation that builds upon present knowledge. That said, we believe it is prudent to employ consensus-based measures as the building blocks for new understandings, which can provide continuity and a solid foundation for design practice. For example, a subset of the measures from TM-30 were shown by three separate laboratories to correlate with salient aspects of colour rendering perceptions,24,27,29,37,44 findings that were amalgamated into specification guidance (IES TM-30 Annex E).89 The amalgamation of the findings from those five studies was possible because the different laboratories operationalized SPD using common measures. New measures should be investigated within the context of the many existing tools that are at the disposal of researchers, and we discourage a new metric being proposed based on data-fitting to each new experimental result.
3.1.3. Operationalizing Independent Variables In operationalizing the independent variable(s), a researcher must choose the assigned values, or levels, of the variable(s). In the example of an experimenter studying the relationship between the colour preference of red tomatoes and light spectrum, the experimenter should operationalize light source SPD into a variable or variables that will, based on an a priori theory, be expected to relate to a subjective quality of the colour appearance. The experimenter might choose Rcs,h1 from TM-30, which characterizes chroma shift in nominally “red” colour evaluation samples. In another scenario where a researcher is trying to contrast the performance of existing and newly proposed evaluation methods, SPD can be operationalized based on the difference between measures.
The levels of the independent variable(s) should relate to current scientific understanding. With respect to the tomato example, if there was no prior knowledge about desirable colour appearance of red objects, then an experimenter might choose a range of red chroma shift beyond what would be expected in real settings, such as Rcs,h1 = -25% to 25%. If substantive differences in perception were not found within those two extremes, then it would be difficult to justify further study. Importantly, many colour rendition perception phenomena are non-linear, and two SPDs inducing shifts in opposite directions may be preferred equally, precluding the detection of an effect without an intermediate level. If a substantive difference were found, the researcher would be empowered to continue the research using more refined levels within a range of interest to real settings, such as Rcs,h1 with levels of -5%, 0%, 5%, 10%, 15%, and 20%. Such a range should provide information about preference as a function of Rcs,h1. In this example the levels were fixed at discrete intervals, but that is not a strict requirement. If an adjustment task were employed (see Section 3.1.5), participants could be given freedom to set the level of the independent variable within the range of an upper and lower bound.
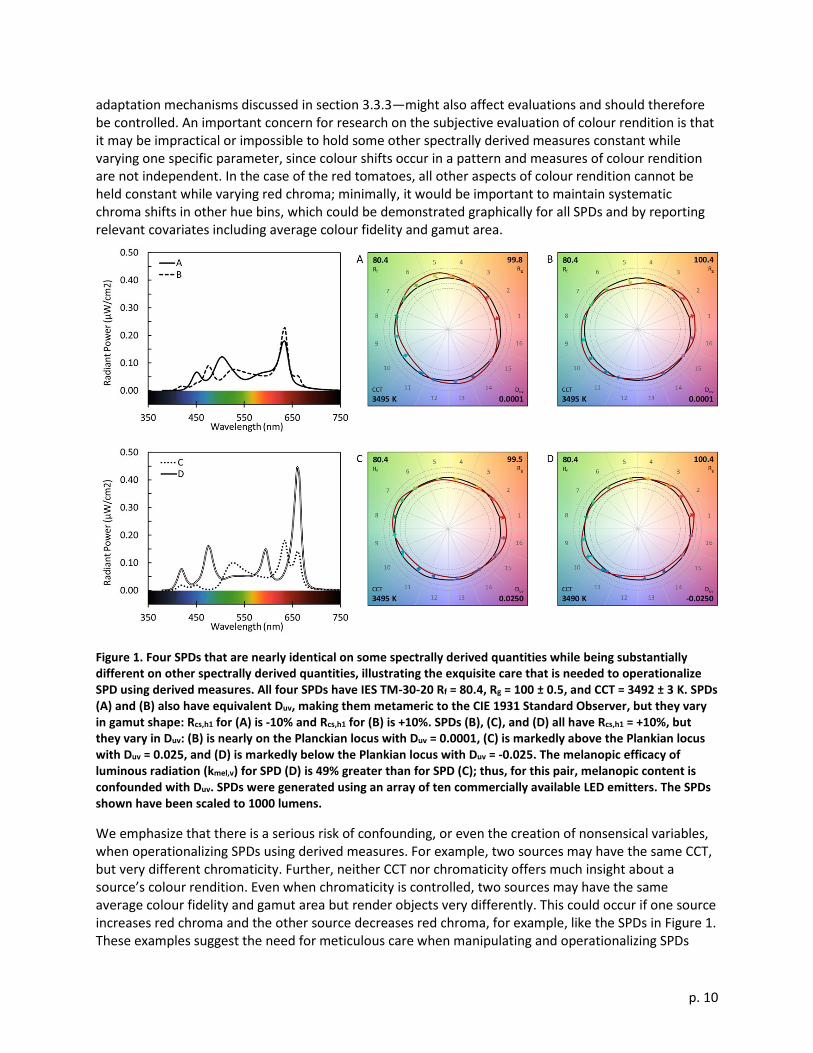
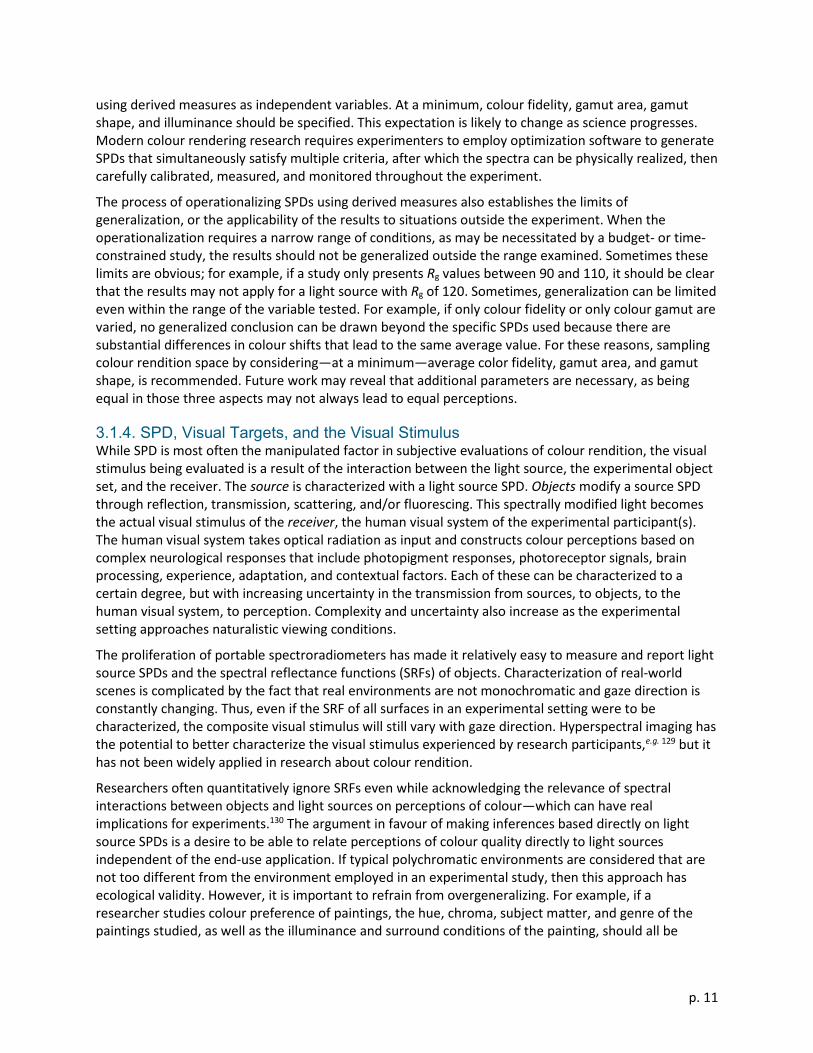
Operationalization of independent variables and definition of their levels must be done with knowledge, control, and characterization of other variables that may concurrently change and become sources of confounding and experimental error. Figure 1 demonstrates the operationalization of SPD where gamut shape is varied but average colour fidelity (Rf) and gamut area (Rg) are constant, presenting a confound that could be detrimental to external validity. In the hypothetical experiment studying subjective evaluation of the colour appearance of red tomatoes, chromaticity and illuminance—through visual
p. 10
adaptation mechanisms discussed in section 3.3.3—might also affect evaluations and should therefore be controlled. An important concern for research on the subjective evaluation of colour rendition is that it may be impractical or impossible to hold some other spectrally derived measures constant while varying one specific parameter, since colour shifts occur in a pattern and measures of colour rendition are not independent. In the case of the red tomatoes, all other aspects of colour rendition cannot be held constant while varying red chroma; minimally, it would be important to maintain systematic chroma shifts in other hue bins, which could be demonstrated graphically for all SPDs and by reporting relevant covariates including average colour fidelity and gamut area.
Figure 1. Four SPDs that are nearly identical on some spectrally derived quantities while being substantially different on other spectrally derived quantities, illustrating the exquisite care that is needed to operationalize SPD using derived measures. All four SPDs have IES TM-30-20 Rf = 80.4, Rg = 100 ± 0.5, and CCT = 3492 ± 3 K. SPDs (A) and (B) also have equivalent Duv, making them metameric to the CIE 1931 Standard Observer, but they vary in gamut shape: Rcs,h1 for (A) is -10% and Rcs,h1 for (B) is +10%. SPDs (B), (C), and (D) all have Rcs,h1 = +10%, but they vary in Duv: (B) is nearly on the Planckian locus with Duv = 0.0001, (C) is markedly above the Plankian locus with Duv = 0.025, and (D) is markedly below the Plankian locus with Duv = -0.025. The melanopic efficacy of luminous radiation (kmel,v) for SPD (D) is 49% greater than for SPD (C); thus, for this pair, melanopic content is confounded with Duv. SPDs were generated using an array of ten commercially available LED emitters. The SPDs shown have been scaled to 1000 lumens.
We emphasize that there is a serious risk of confounding, or even the creation of nonsensical variables, when operationalizing SPDs using derived measures. For example, two sources may have the same CCT, but very different chromaticity. Further, neither CCT nor chromaticity offers much insight about a source’s colour rendition. Even when chromaticity is controlled, two sources may have the same average colour fidelity and gamut area but render objects very differently. This could occur if one source increases red chroma and the other source decreases red chroma, for example, like the SPDs in Figure 1. These examples suggest the need for meticulous care when manipulating and operationalizing SPDs
p. 11
using derived measures as independent variables. At a minimum, colour fidelity, gamut area, gamut shape, and illuminance should be specified. This expectation is likely to change as science progresses. Modern colour rendering research requires experimenters to employ optimization software to generate SPDs that simultaneously satisfy multiple criteria, after which the spectra can be physically realized, then carefully calibrated, measured, and monitored throughout the experiment.
The process of operationalizing SPDs using derived measures also establishes the limits of generalization, or the applicability of the results to situations outside the experiment. When the operationalization requires a narrow range of conditions, as may be necessitated by a budget- or time-constrained study, the results should not be generalized outside the range examined. Sometimes these limits are obvious; for example, if a study only presents Rg values between 90 and 110, it should be clear that the results may not apply for a light source with Rg of 120. Sometimes, generalization can be limited even within the range of the variable tested. For example, if only colour fidelity or only colour gamut are varied, no generalized conclusion can be drawn beyond the specific SPDs used because there are substantial differences in colour shifts that lead to the same average value. For these reasons, sampling colour rendition space by considering—at a minimum—average color fidelity, gamut area, and gamut shape, is recommended. Future work may reveal that additional parameters are necessary, as being equal in those three aspects may not always lead to equal perceptions.
3.1.4. SPD, Visual Targets, and the Visual Stimulus While SPD is most often the manipulated factor in subjective evaluations of colour rendition, the visual stimulus being evaluated is a result of the interaction between the light source, the experimental object set, and the receiver. The source is characterized with a light source SPD. Objects modify a source SPD through reflection, transmission, scattering, and/or fluorescing. This spectrally modified light becomes the actual visual stimulus of the receiver, the human visual system of the experimental participant(s). The human visual system takes optical radiation as input and constructs colour perceptions based on complex neurological responses that include photopigment responses, photoreceptor signals, brain processing, experience, adaptation, and contextual factors. Each of these can be characterized to a certain degree, but with increasing uncertainty in the transmission from sources, to objects, to the human visual system, to perception. Complexity and uncertainty also increase as the experimental setting approaches naturalistic viewing conditions.
The proliferation of portable spectroradiometers has made it relatively easy to measure and report light source SPDs and the spectral reflectance functions (SRFs) of objects. Characterization of real-world scenes is complicated by the fact that real environments are not monochromatic and gaze direction is constantly changing. Thus, even if the SRF of all surfaces in an experimental setting were to be characterized, the composite visual stimulus will still vary with gaze direction. Hyperspectral imaging has the potential to better characterize the visual stimulus experienced by research participants,e.g. 129 but it has not been widely applied in research about colour rendition.
Researchers often quantitatively ignore SRFs even while acknowledging the relevance of spectral interactions between objects and light sources on perceptions of colour—which can have real implications for experiments.130 The argument in favour of making inferences based directly on light source SPDs is a desire to be able to relate perceptions of colour quality directly to light sources independent of the end-use application. If typical polychromatic environments are considered that are not too different from the environment employed in an experimental study, then this approach has ecological validity. However, it is important to refrain from overgeneralizing. For example, if a researcher studies colour preference of paintings, the hue, chroma, subject matter, and genre of the paintings studied, as well as the illuminance and surround conditions of the painting, should all be
p. 12
expected to influence perceptions—this will constrain the ability to apply conclusions to other paintings in other contexts. Finally, using object sets that are not polychromatic, such as only skin tone, or do not have context (such as an X-rite Colour Checker Chart), may limit the general applicability of the results, even if they are informative for a specific scenario. Object selection is discussed further in Section 3.2.2.
3.1.5. Dependent Measures Psychophysics aims to measure perception and performance by linking perceptual experiences with physical stimuli using psychometric scales. There are several important concepts. Validity concerns whether the measurement tool captures the concept intended, without unintentionally overlapping with other concepts. Face validity concerns whether the measurement looks like it ought to measure what is intended. For example, evaluating colour perception in the absence of coloured objects does not have face validity. Face validity is a necessary first step, but it is inadequate on its own. A psychometric scale should also exhibit convergent validity (i.e. it should correlate with other concepts to which it is logically related) and discriminant validity (i.e. it should not correlate with other concepts to which it is not logically related). Reliability concerns both the internally consistency of the psychometric scale and its repeatability—if the same person responds repeatedly to the same conditions using the same scale, the responses should be the same. Refer to Ghiselli et al.131 for a more thorough treatment of these concepts.
For experiments on the subjective evaluation of colour rendition, the dependent measures are perceived attributes of the visual environment. The most studied attributes have been preference and naturalness, but others include vividness, colourfulness, saturation, normalness, fidelity, acceptability, attractiveness, pleasantness, and suitability. These adjectives can anecdotally be divided into three categories: desirability, vibrancy, and similarity to a reference. However, a lack of consistent terminology between studies, and no concerted effort to understand if terms are truly interchangeable or valid—with some evidence against132—has introduced uncertainty when trying to make inferences from the larger body of literature. We recommend more research explicitly aimed at understanding the relationships between these constructs.
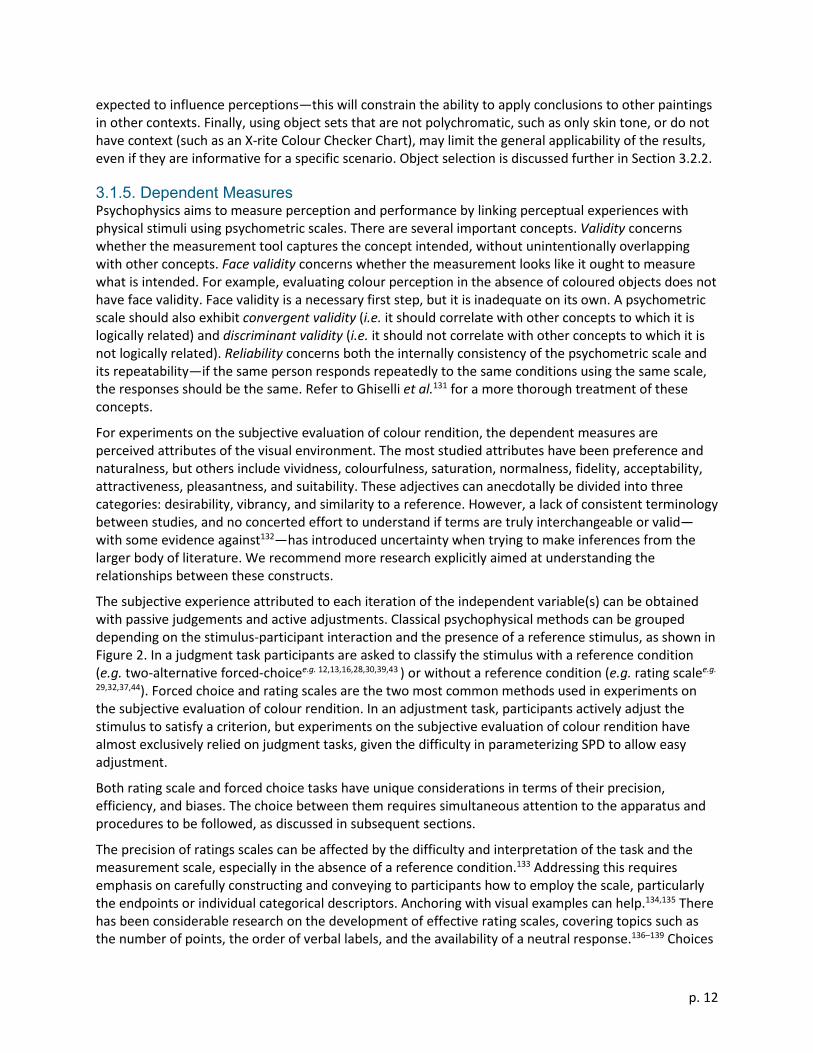
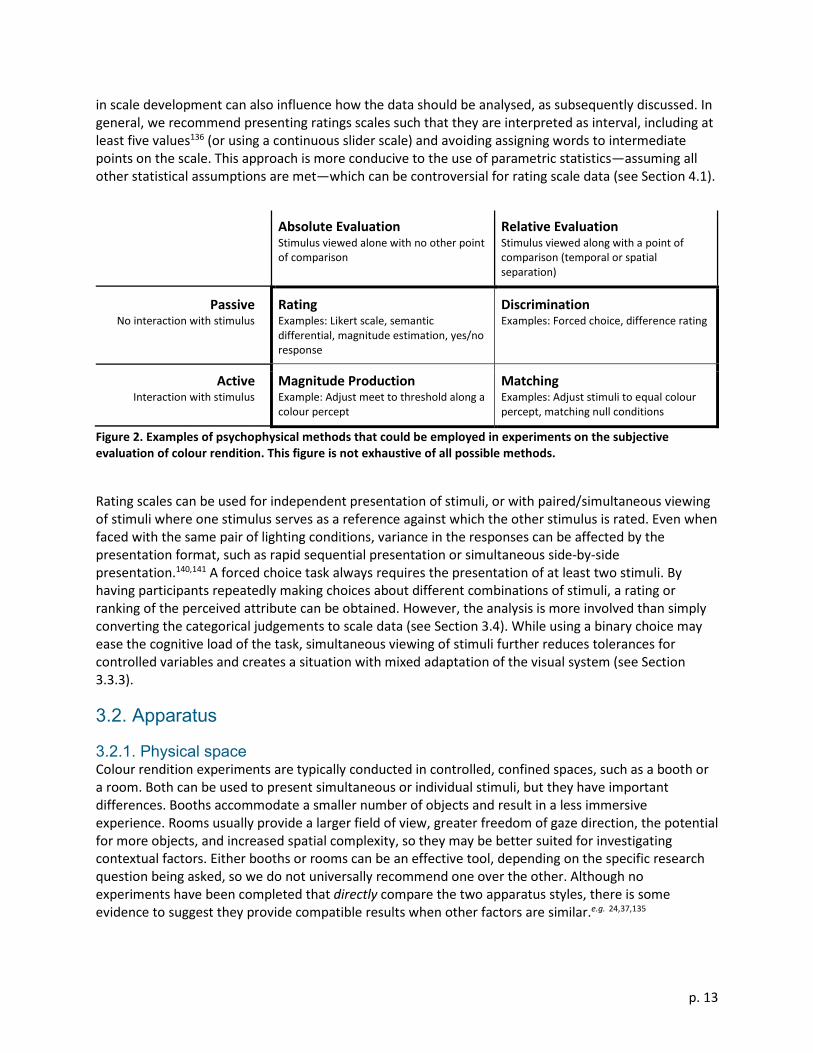
The subjective experience attributed to each iteration of the independent variable(s) can be obtained with passive judgements and active adjustments. Classical psychophysical methods can be grouped depending on the stimulus-participant interaction and the presence of a reference stimulus, as shown in Figure 2. In a judgment task participants are asked to classify the stimulus with a reference condition (e.g. two-alternative forced-choicee.g. 12,13,16,28,30,39,43 ) or without a reference condition (e.g. rating scalee.g.
29,32,37,44). Forced choice and rating scales are the two most common methods used in experiments on the subjective evaluation of colour rendition. In an adjustment task, participants actively adjust the stimulus to satisfy a criterion, but experiments on the subjective evaluation of colour rendition have almost exclusively relied on judgment tasks, given the difficulty in parameterizing SPD to allow easy adjustment.
Both rating scale and forced choice tasks have unique considerations in terms of their precision, efficiency, and biases. The choice between them requires simultaneous attention to the apparatus and procedures to be followed, as discussed in subsequent sections.
The precision of ratings scales can be affected by the difficulty and interpretation of the task and the measurement scale, especially in the absence of a reference condition.133 Addressing this requires emphasis on carefully constructing and conveying to participants how to employ the scale, particularly the endpoints or individual categorical descriptors. Anchoring with visual examples can help.134,135 There has been considerable research on the development of effective rating scales, covering topics such as the number of points, the order of verbal labels, and the availability of a neutral response.136–139 Choices
p. 13
in scale development can also influence how the data should be analysed, as subsequently discussed. In general, we recommend presenting ratings scales such that they are interpreted as interval, including at least five values136 (or using a continuous slider scale) and avoiding assigning words to intermediate points on the scale. This approach is more conducive to the use of parametric statistics—assuming all other statistical assumptions are met—which can be controversial for rating scale data (see Section 4.1).
Absolute Evaluation Stimulus viewed alone with no other point of comparison
Relative Evaluation Stimulus viewed along with a point of comparison (temporal or spatial separation)
Passive No interaction with stimulus
Rating Examples: Likert scale, semantic differential, magnitude estimation, yes/no response
Discrimination Examples: Forced choice, difference rating
Active Interaction with stimulus
Magnitude Production Example: Adjust meet to threshold along a colour percept
Matching Examples: Adjust stimuli to equal colour percept, matching null conditions
Figure 2. Examples of psychophysical methods that could be employed in experiments on the subjective evaluation of colour rendition. This figure is not exhaustive of all possible methods.
Rating scales can be used for independent presentation of stimuli, or with paired/simultaneous viewing of stimuli where one stimulus serves as a reference against which the other stimulus is rated. Even when faced with the same pair of lighting conditions, variance in the responses can be affected by the presentation format, such as rapid sequential presentation or simultaneous side-by-side presentation.140,141 A forced choice task always requires the presentation of at least two stimuli. By having participants repeatedly making choices about different combinations of stimuli, a rating or ranking of the perceived attribute can be obtained. However, the analysis is more involved than simply converting the categorical judgements to scale data (see Section 3.4). While using a binary choice may ease the cognitive load of the task, simultaneous viewing of stimuli further reduces tolerances for controlled variables and creates a situation with mixed adaptation of the visual system (see Section 3.3.3).
3.2. Apparatus
3.2.1. Physical space Colour rendition experiments are typically conducted in controlled, confined spaces, such as a booth or a room. Both can be used to present simultaneous or individual stimuli, but they have important differences. Booths accommodate a smaller number of objects and result in a less immersive experience. Rooms usually provide a larger field of view, greater freedom of gaze direction, the potential for more objects, and increased spatial complexity, so they may be better suited for investigating contextual factors. Either booths or rooms can be an effective tool, depending on the specific research question being asked, so we do not universally recommend one over the other. Although no experiments have been completed that directly compare the two apparatus styles, there is some evidence to suggest they provide compatible results when other factors are similar.e.g. 24,37,135
p. 14
Beyond the physical size of the apparatus, the configuration of the apparatus into one, two, or more individual spaces is an important factor that intersects with other key procedural details. Both single-scene and side-by-side viewing have been widely used. Direct comparison of the configuration is challenging because they are often used with different procedures (e.g. rating versus choice, as described in Figure 2), and simultaneous viewing of multiple scenes can create a different adaptation condition (see Section 3.3.3).
In the case of the red tomatoes, either a booth or a room could be a suitable apparatus. A booth would allow narrower focus on one or a small number of tomatoes, whereas a room filled with a variety of vegetables simulating a supermarket might offer a more contextualized stimulus. If the study is targeting sales or appreciation in a supermarket context, then it would be worth considering running the experiment in an appropriate vignette.
3.2.2. Objects In colour rendition research, all physical entities in an architectural space, including people and the walls, should be considered as objects being evaluated. The objects are integral part of the visual stimulus (see Section 3.1.4) and thus require careful consideration during experimental design.130 Objects contribute to a simple or complex stimulus and an experiment can contain only a limited number of them. Therefore, selecting a sample that is representative of the population of object characteristics in a target application is necessary to answer the primary research question. Choosing objects that span the colour volume, or at least the hue-chroma plane, is often useful when attempting to develop generalized recommendations for architectural lighting practice.
It is also recognized that no one set of objects or colours is a definitive representation of a particular lighting application. Thus, any one set of objects is insufficient to make generalized colour rendition recommendations for a specific application. Because there is limited ability to create visual scenes of different application but equivalent colour composition, it is difficult to conclusively demonstrate application specificity in subjective evaluations of colour rendition. Nonetheless, it is evident that subjective evaluations can vary from one scene to the next, even within a given application. For example, the appearance of different paintings may be viewed most favourably with different colour rendition,6 even though they would both fall under the application of museum lighting.
Colour psychology can play an important role in colour rendition research, with different hues carrying different meaning and importance.142 Several colour rendition experiments have confirmed the weight placed on nominally red objects.2,16,18,24,27,44,143 If red objects are omitted or are used exclusively, however, the results may not be applicable to general architectural lighting applications, because while red tends to be dominant, it is not the exclusive driver of perception. Attention should also be paid to the chroma of objects, balancing across hues and potentially varying within hues. In the case of the red tomatoes, any results about the significance of a particular colour rendition measure as a predictor, or establishment of desirable levels of a given measure, should not be suggested to have validity for other applications—and may have little benefit for lighting practice.
Another important consideration in the creation of a sample of objects, particularly for a small number of objects, is metamerism. Any single object may not represent the central tendency of shift for a group of objects with the same nominal hue, or even the same colour coordinates. This may influence the external validity of an experiment. For example, the colour shift of a red tomato is unlikely to be identical to the shift of one or more standardized colour samples used to calculate a measure of red chroma shift, such as Rcs,h1 in TM-30 (which is an average of several colour evaluation samples with similar hue angles). Depending on the degree of mismatch, the standardized calculation may not represent the change in the visual stimulus. Further, two similarly coloured objects, represented by the
p. 15
same standardized measure, could shift in opposite directions, potentially leading to undesirable mismatch that is not effectively characterized with typical measures of colour rendition; this is a topic of current research.125,144,145
We recommended carefully measuring SRFs and documenting the expected visual stimulus. Custom versions of familiar measures of colour rendition can be calculated by swapping the standardized colour evaluation samples for the SRFs of experimental objects (or another set of colour samples), as exemplified by Royer and Wei.130 Alternatively, it is possible to report individual shifts in the appearance of objects using colorimetric tools, such as colour difference or chroma shift formulae.e.g. 21,26-30,34,70 This practice can help identify unusual behaviours—or a mismatch between the experimental stimulus and standardized characterization of the stimulus—before an experiment begins, and is generally valuable when reporting the results. If the customized measures are substantially different from the standardized measures, using the experimental results to establish generalized criteria with the standardized measures is less reliable.
For red tomatoes, it would be important to consider the specific type of tomato being evaluated, as there are many varieties. There are also concerns about freshness or ripeness, as colour is an important indicator of state for fresh foods.146 Further, it is important to reiterate that average measures, like Rf and Rg, have little predictive power for the colour appearance of specific objects.
In past research, the objects have included standardized colour swatches (e.g. X-rite Colour Checker), packaged goods, fresh produce, clothing, artwork, and human skin complexion. For some objects that people have frequently seen in the past (i.e. familiar objects), participants have an internal memory that helps establish expectations for the appearance and makes the object carry more subjective meaning and have more influence on overall scene evaluation.24,27 Evaluation of familiar objects may also reduce variability and thus provide a more conclusive result. However, sometimes particular objects can have a substantial colour shift or notable contrast with its surround that can elevate its importance in subjective evaluations.44 Nonetheless, memory colours can be shifted in time even for familiar objects.147,148 Therefore, solely depending on long-term memory may not be appropriate. For unfamiliar objects without an internal memory reference, as with colour samples, evaluators must rely on contextual factors alone to make judgements. In most cases, subjective evaluations of context-less objects (e.g. colour swatches in isolation) will not produce meaningful data about percepts such as colour preference or naturalness, though they may be used to probe vividness and colour discrimination. While specific situations may vary, we recommended inclusion of familiar objects, in an appropriate context, whenever possible.
The colour appearance of the objects in a scene may not be the same as when the objects are viewed in isolation. The human visual system determines colour appearance using the complexities of the environment—local surrounds and backgrounds, distant surrounds, patterns, mean colour, etc.—both for local areas and across the entire scene.149–151 For example, objects may appear more vivid against a grey background than a multi-coloured, high-variance one,149 which could influence the subjective evaluation of a scene. Thus, the visual stimulus in experiments is not the average spectral power reaching the eye, nor is it the aggregate of individual colour shifts calculated for individual items. It is the entirety of the complex scene. This suggests value in presenting scenes that mimic real environments when the goal is to understand perception in real environments. Nonetheless, there is little evidence that carefully contrived experimental environments produce results that are not applicable to real scenes, and there is some evidence that a small number of objects (e.g. Esposito and Houser37) can produce a similar result to a large number of objects (e.g. Royer et al.24) when similar lighting conditions are used. The effect of colour rendition may be large enough to overwhelm other factors influencing colour appearance.
p. 16
3.3. Procedures Experimental procedures may introduce several forms of systematic error that can greatly reduce the internal and external validity of results.102 This section provides a brief overview of important biases and other procedural considerations important to research on colour rendition.
3.3.1. Observer, Investigator, and Response Considerations Recruiting people to participate in research studies is a familiar part of human subject research. It is important to remember that research participants are a sample of a population that is being investigated, and most statistical tests rely on the assumption that this sample is randomly selected from the population, with participants acting independently. In most cases, it is accepted that the sample is not strictly random, because of proximity, availability, or other convenience factors. However, obviously skewed samples (e.g. only 18-22 years old, substantial imbalance between males and females, racial or cultural homogeneity) should not be used to draw conclusions about the full adult population unless there is strong evidence that the factor sampled with bias plays no role on subjective evaluations of colour rendition. Furthermore, there is both considerable constancy and considerable variation in human colour vision, making a broad, and moderately large sample recommended. Beyond vision, there can be variations in the likes and dislikes of individuals, which may or may not be influenced by culture.6,38,152,153
Another important decision is whether to include participants with colour vision deficiencies, which constitute about 8% of men and 0.4% of women of European Caucasian descent.154 We are not aware of work examining colour perceptions as a function of light source SPD among people with colour vision deficiencies, although there are bodies of research about colour vision anomalies155–157 and adjusting images for observers with abnormal colour vision.158–160 Chroma-enhancing glasses have been developed that can change colour perception for dichromats or anomalous trichromats.161
Generally, a sample size of 30 is considered moderately large for psychophysical experiments, satisfying the central limit theorem and making violations of important statistical assumptions about normality162 less prone to causing errors. Therefore, we recommend this as a minimum target sample size, unless a power analysis—a recommended practice—suggests a greater number is necessary for the anticipated effect size. If fewer than 30 participants are included, extra care should be taken during statistical analysis.
Lay (agnostic to lighting and colour science) and naïve (agnostic to the purpose of the study) participants’ responses may differ from expert participants or participants who are informed of the purpose of the study (i.e. not naïve). Since expertise and naivete are not mutually exclusive, it is possible to run experiments with expert and naïve participants (i.e. lighting/colour science experts who do not know the purpose of the study). Naivete and expertise of the participants should be reported. Experiments about colour and brightness perceptions using both naive and expert participants suggest that expertise might77 or might not88,163 influence participant responses.
Beyond selecting an appropriate sample of a population, the actions of the participants are important to consider. Participants’ inaccurate or false responses to research questions can impact the validity of the results. An observer’s response to rating questions can be skewed due to response contraction bias (overestimating small and underestimating large values), centring bias (tendency to choose middle values in a scale), stimulus-equalizing bias (tendency to use the full range of responses regardless of the actual physical spacing), and stimulus-spacing bias (responding as if the stimuli are equally spaced regardless of the actual physical spacing).100,101,164–166
p. 17
The participants may sometimes modify their responses to meet experimenters’ expectations, when they consciously or subconsciously introduce bias by providing too much or little information to the participants or asking leading questions. An infamous example is the Hawthorne effect (also known as the observer effect), where factory workers’ productivity increased regardless of the change in illumination levels (until the illumination levels were reduced to moonlight illumination level) because factory workers were aware that their performance was being recorded.167 Double-blind techniques (hiding the order/properties of test conditions from both participants and experimenters) or blind analysis can minimize the effect of researchers’ expectations on study outcomes.168,169 For the visually-based assessments made in experiments on the subjective evaluation of colour rendition, complete blinding is often impractical. Standardizing interaction with participants using scripts is another way to reduce investigator bias.
Inter- and intra- observer differences can be checked using the standardized residual sum of squares (STRESS)170 to report variation in participant responses and to account for observer variations in colour perception.e.g. 171–173 Previous colour rendition studies suggest that inter-observer variations can be similar174 or slightly larger than intra-observer variations.175,176 The observer variations can also be affected by the dependent measures. For example, it is possible that intra-observer differences in preference judgments can outweigh inter-observer differences, while the relationship could be inverted for naturalness judgments.29 In general, a lower variability in inter and intra-observer judgments indicate higher reliability of the experimental results.
3.3.2. Stimulus Presentation Considerations Numerous biases can be introduced based on the stimulus presentation procedures, including position bias, order bias, and range bias. Position bias can occur due to asymmetry in the stimuli in a simultaneous comparison task (e.g. differences in chromaticity, booth size and shape, non-uniform paint finish, unbalanced object positions) or due to unequal tendencies of observers. Precise calibration, counterbalancing the position of the stimuli (between or within subjects), randomization of the stimuli order, and testing null conditions (i.e. a trial where both stimuli are identical) can help address some of these biases.177
The order of the stimuli can affect participants’ judgment relative to previous trials.164 This is of particular concern for colour perception studies due to adapting and memory effects of human colour perception. Because the visual system is constantly adapting at a variety of timescales (see Section 3.3.3), the visual experience preceding an evaluation can influence how a given stimulus is rated (or chosen), regardless of the apparatus and other procedures.
Randomization of stimuli or use of specific designs that allow for counterbalancing the order of presentation are basic requirements that can prevent order bias. Other recommended mitigation efforts include ensuring the transition of visible stimuli is not visible to observers—potentially introducing a null or dark stimulus between test cases—or introducing long periods away from the experiment between evaluations (e.g. one stimulus evaluated per day37). Sometimes randomizing blocks of stimuli is prudent; for example, when chromaticity and colour rendition are both varied.
Randomization does not eliminate order effects, but simply spreads the added variance across the levels of the independent variable This reduces correlation when evaluating the individual data, but not when evaluating the mean response data for each condition. The latter may give a better indication of the size of the effect of a variable on the dependent measure.
Stimulus range bias describes the effect of the extents of the stimuli performance characteristics on the evaluations. Range bias has been studied and thoroughly documented for the field of discomfort glare, where it is hypothesized to be a substantial contributor to inconsistencies between studies.178 Others
p. 18
have examined how it affects preferred illuminance.179,180 Range bias has also been demonstrated to be in effect in an experiment related to CCT preferences.181 To our knowledge, no experiments have been conducted to explicitly examine how the range of stimuli presented may affect subjective evaluations of colour rendition with all other factors held constant. However, some anecdotal evidence from similar studies suggests that the stimulus range bias can affect the optimum range of performance, if not the factors (e.g. red chroma) that are most strongly correlated with perceptions. We recommend confirmatory research on this topic.
Returning to the tomatoes experiment, let us say the experimenter has reason to hypothesize that preference will be maximal near Rcs,h1 = 15%. One set of participants might then evaluate conditions with Rcs,h1 = 0%, 5%, 10%, 15%, and 20%. A second set of participants might evaluate conditions with Rcs,h1 = 10%, 15%, 20%, 25%, and 30%. If there is a stimulus range bias in the form of a centring bias, the first group might select a preferred level near the centre of their range, at 10%, whereas the second group might select the preferred level near the centre of their range, at 20%. That result would indicate that participants responses were likely driven more by the range of conditions presented rather than by a true visual preference. If instead both groups demonstrated a preference at 15%, which would be away from the centre point for both groups, then the results are much more likely free of a centring bias.
Training that anchors the stimulus range can reduce range effects,101,134 but probably not eliminate them. Like order bias, range bias is a particularly important concern for colour rendition experiments because of the visual adaptation that occurs over various time scales. As an example of this effect, it has been observed anecdotally that studies employing shorter durations of adaptation to a new stimulus have often found an effect that the preferred or most natural chromaticity, in the context of colour appearance evaluation, is at the centre of the range shown,e.g. 40,41,60,61 corresponding to the average state of adaptation—this effect is often not present in experiments using longer adaptation periods.27,29,44
3.3.3. Adaptation The visual experience is heavily dependent on adaptation to accommodate the vast range of visual stimuli. Several distinct but related adaptive processes (e.g. light adaptation, dark adaptation, chromatic adaptation, contrast adaptation) follow different timescales—from nearly instantaneous to weeks or months—and rely on a variety of mechanisms in the eye-brain system.182 Adaptation state is critical to understanding colour perception, and can greatly influence the results of psychophysical experiments on colour rendition via the apparatus and experimental procedures. The consequence of not addressing adaptation can mean the results lack external validity and have minimal value for advancing lighting practice.
Light and dark adaptation refer to adjustments of the visual system in response to the intensity of light.183,184 Light adaptation generally occurs rapidly (within seconds), whereas dark adaptation can take minutes and full dark adaptation can take an hour or longer. Light and dark adaptation help to facilitate brightness constancy,185 whereby a wide range of intensities appear neutral brightness, but as with other adaptive processes, there are limits. Light and dark adaptation are important to colour rendition experiments, even though they are often conducted at constant luminance. Colour perception varies with lighting intensity,186 and care should be taken to ensure that experiment participants have had sufficient time to adapt to the intensity of the viewed conditions, especially if they have come from daytime outdoor conditions (i.e. high illumination levels).
The processes of chromatic and colour contrast adaptation are both highly relevant to colour rendition experiments. These forms of adaptation help the visual system have nominal colour constancy,187,188 meaning that objects’ colour appearance stays (almost) the same over time and across a wide range of
p. 19
illumination. However, there are limitations to the ability of the visual system to adapt and produce constancy,150,185,187,189–191 with different time courses and different mechanisms of adaptation, which enables changes to the colour appearance of a scene through colour rendition. For example, colour constancy varies with context and spatial characteristics150,187 and is relational.150 Colour constancy varies with hue189 and can be attenuated by high-chroma objects,192 which tend to be less constant. It is not entirely clear what objects in a scene are most important for establishing colour constancy;187 colour constancy likely depends on multiple cues and mechanisms.
Chromatic adaptation, studied for well over 100 years, is the change in the visual system’s sensitivity in response to the changes in the average chromaticity of the visual scene, according to the prevalent illumination. There is a cognitive (cortical) component that occurs very rapidly, potentially accounting for up to 60% of the visual change;193–195 it is potentially influenced by colour contrasts within the scene and contextual factors.195,196 The sensory component is slower, with existing evidence suggesting two stages of what is effectively gain control of the three cone photoreceptors. An initial rapid mechanism lasts up to a few seconds,194,195,197 and may be asymmetric (i.e. adaptation to middle-wavelength light is faster than adaptation to short and long-wavelength light) in the presence of complex viewing conditions.198 This initial phase of sensory adaptation may account for about 50% of the adaptive change. For constant-luminance changes, chromatic adaptation is 90% complete between 60 s and 310 s.194,195,197–199 There can be substantial differences between observers194 and the time course can be longer if light-dark adaptation is also involved.200,201 Changes in colour appearance tend to be part of the slower stages of chromatic adaptation, and contextual effects have a relatively greater effect over time.197 In some cases, chromatic adaption may never be complete, leaving residual bias.185,190,196
Beyond the initial short-term adaptation, there are long-term adaptation and aftereffects than can occur on a timescale of days, months, or longer.187,191,202–208 Long-term and short-term chromatic adaptation effects are cumulative, despite some differences in mechanisms, but long-term effects are generally weaker.204 Long-term effects are less asymptotic, however, and decay slower.
The visual system also adapts to the colour contrast within a scene, with both retinal and cortical processes;209 enabling the visual system to adapt to variations in chromaticity (and luminance) around a fixed average.210 This adaptation occurs for individual scenes and overall environments due to variation in chromaticity,211,212 and can vary with illumination.213 There is some evidence for long-term contrast adaptation effects,214 but other work does not support that conclusion.202
In short, visual adaptation takes several forms, relies on several mechanisms, and occurs over multiple time scales. Thus, it is important to understand the visual state of the participants in experiments on colour rendition, so the results can be related to their intended practical use. In this regard, it is important to consider if the primary concern is occupants’ initial impression, long-term impression, or relative impression of a space.
In general, we recommend a minimum of two minutes of adaptation if the chromaticity must change within a sequence of lighting conditions. (If possible, it would be better to avoid changes in chromaticity within an experimental session altogether.) If chromaticity change is necessary, we recommend following procedures that reduce or eliminate the ability of participants to detect chromaticity changes or that result in mixed adaptation, which may include:
1. Eliminate any sources of stray light, such as from windows without blackout curtains that provide a contextual clue about the chromaticity of the experimental condition.
2. Ensure that auxiliary light sources, such as computer screens, are not seen by observers. If unavoidable, adjust the colour appearance as the chromaticity of the lighting being evaluated changes.
p. 20
3. Use an auxiliary space, outside of the experimental space, to adapt participants to a new chromaticity.
4. Show all conditions with the same nominal chromaticity in a block. 5. Avoid visible transitions in lighting conditions, even if the specified chromaticity is the same,
because the chromaticity cannot precisely match for all observers (even if all conditions could have a perfect match in calculated chromaticity).
For colour rendition research—and perhaps more broadly—we recommend being cautious with scenarios where mixed chromatic adaptation is elicited, such as side-by-side viewing conditions. This is especially true when chromaticity does not match but may also be a concern when chromaticity is specified to match (for a standard observer), because observer variability will mean chromaticity is not matched for all participants. Avoiding mixed adaptation might be safer (with the notable exception of research investigating mixed adaptation itself)e.g. 215,216 because existing standardized measures of colour rendition assume complete chromatic adaptation to the illuminant. In cases of mixed adaptation, the visual stimulus will not be characterized by the standardized measures. If mixed adaptation is elicited, extra care should be taken to understand the visual stimulus and researchers should use relevant colorimetric tools to characterize stimuli.
It is true that many lighting scenarios involve lights with different chromaticities, such as adjacent retail establishments, different spaces within a restaurant, or daylit offices. However, real environments are complex and usually feature blended illumination. It would be rare (outside a laboratory) to see identical objects illuminated in two different ways, whether differences in chromaticity or colour rendition. This contrived situation may confuse cortical adaptation mechanisms—for chromaticity or contrast—and at the very least means the visual system, no matter the duration of exposure, cannot adapt to each local scene. Mixed adaptation scenarios may compromise external validity because the appearance of each stimulus is relative, and the same relative reference will not be present in architectural lighting applications. To be clear, being cautious does not mean probing the effects of mixed adaptation on subjective evaluations of colour rendition is not warranted, but that the presentation of such a visual stimulus should be intentional and the effects accounted for when assessing the validity of the results.
3.4. Statistical Planning Planning and documenting data analysis is important because the statistical analysis is related to all other aspects of the experimental design, including the design of the response instruments and the stimuli presentation. It is also important to determine the statistical tests that will be conducted a priori to avoid “fishing” for significant results, which can lead to false positive findings.108,109,111 It is useful to indicate if the study is exploratory, so the methods and analyses can be appropriately interpreted.
In addition to identifying appropriate statistical analysis techniques, it is important in the experimental design phase to understand the assumptions of those tests, anticipate if the assumptions will be met, and have a plan of action if they are not met. For example, repeated measures analysis of variance (ANOVA) assumes homogeneity of variance across the conditions (i.e. assumption of sphericity),217 among other assumptions. The assumption of sphericity, which results in an inflated Type 1 error rate if violated, can be tested in several ways (e.g. Mauchly’s test218), and if not met, alternative analysis approaches should be used to avoid a positively biased F statistic (e.g. the Huynh-Feldt or Greenhouse-Geisser corrections). See Wei et al.18 for an example of how this was employed in an experiment on colour preference.
p. 21
Statistical planning should also include a power analysis219 to ensure the planned sample size is appropriate to detect an effect of a given size at a desired level of statistical significance, typically α ≤ 0.05.
4. Reporting and Analysis Properly analysing and reporting an experiment is a critical part of the research enterprise and, like all aspects of research, must be done ethically.63 Common reporting practices in this field of research often result in omission of valuable information. At a minimum, we recommend a measure(s) of central tendency and variation to be reported for all independent, dependent, and controlled variables. In the case of independent and controlled variables, this provides information about the temporal and spatial variability, which is a way to document careful execution of the experiment. Where applicable, measurements should be taken with a calibrated meter, with the exact procedures carefully documented to ensure repeatability.
Because colour rendition experiments usually rely on operationalized variables that are derived from SPDs, and because knowledge changes over time, we join others220,221 in recommending the reporting the SPD of each lighting condition, preferably in tabular format. To the extent possible, providing complete results to beyond central tendency and variation is also valuable. Extensive data can be included in supplemental files and made available through (preferably open source) online repositories.
To help contribute to replicable science, authors should be fully transparent in reporting the study design and results, including both significant and not significant findings of any statistical tests conducted. Best practices dictate that the statistical tests to be performed should be identified a priori—and perhaps pre-registered—and only those tests should be performed after data collection is complete, or according to plan. Choices associated with reporting contribute to researcher degrees of freedom, the mistreatment of which induces bias.108 Authors should also report information related to the population of interest, how it was sampled (including any inclusion/exclusion criteria), and descriptive statistics about the sample. Any manipulation, cleaning, or exclusion of data should be clearly identified and justified, along with the relationship of the reported data to any larger dataset or other publication (if applicable).
In general, we recommend providing as much of the underlying data and computational workings as is practical and possible. Online repositories now easily facilitate the posting and tracking of data for all types of variables as well as data analyses.
4.1. Statistical Analysis Rather than attempting to provide a complete overview of potential statistical analysis techniques, here we address a few key concerns relevant to the most common techniques used to date in this genre of research. Regardless of the technique, the specific methods used should be reported, including the treatment of each factor in the model(s)—which should have been determined before the experiment. For confirmatory research, the finding related to each previously identified hypothesis should be explicitly stated, with reporting of both statistical significance and effect size. In addition to the main statistical analysis, it is recommended to report results related to tests of the underlying assumptions. At a minimum, it should be verified in the report that these assumptions were examined and met.
Uttley219 examined, among other research practices, the prevalence of assessment of statistical assumptions in lighting research. As with the general and glare-specific datasets generated by Uttley, our preliminary survey completed during preparation of this article suggests that more thorough reporting of statistical tests and evaluation of assumptions is warranted in colour rendition research. A full review is planned as future work.
p. 22
Experiments on the subjective evaluation of colour rendition often involve multiple dependent measures. For example, participants may rate naturalness, preference, vividness, acceptability, or appreciation of the colour appearance of objects in a scene. Guidelines for quality and replicability recommend disclosure of all variables, using language that conveys that the reported variables were the only variables.110 Adjustments to significance criteria may also be necessary if multiple dependent measures are not independent (e.g. ratings of naturalness and normalness). In some cases, multivariate statistical methods can help address this situation.
As previously discussed, rating scales are the predominant psychophysical procedure used to subjectively evaluate light source colour rendition, and a wide variety of specific assessment tools have been used. To properly analyse scale data, it is important to identify whether the data is ordinal data (having an order but not defined increment) or interval data (having both an order and an increment)222—nominal and ratio data types also exist, but are not common in colour rendition research. Some hold the view that ordinal data, such as generated from individual Likert items, should be analysed with non-parametric statistics222–228—thus excluding regression analysis, ANOVA, factor analysis, etc. Others have found that parametric statistics are robust and acceptable for use with ordinal scale data, at least under some circumstances.136,229–238 The latter viewpoint aligns with the approach of a vast majority of researchers investigating light source colour rendition; however, it is not clear if the researchers are aware of the underlying assumptions and debate among methodologists when treating the data in this way. In general, anchored numerical rating scales with five or more values or continuous line marking scales are recommended for treatment as interval data, and are most likely an improvement over the use of individual Likert items (using the traditional Likert format outside of the original Likert scale framework).136
Forced choice data has its own unique set of analysis considerations.239 Foremost, the choices should not simply be summarized as percentages and assumed to be on an interval scale. Instead, evaluation frameworks such as Item Response Theory,240 relying on Thurstone’s law of comparative judgement,241 may be considered, but are also subject to important assumptions that should be checked.
4.2. Model Fitting and Implications It has become increasingly common in colour rendition experiments to fit numerous regression models that combine multiple measures of colour rendition, chromaticity, and sometimes other lighting parameters to compare the ability of various measures to explain the visual response. This analysis technique can be useful in exploratory work but is not a substitute for null-hypothesis significance testing in confirmatory research because a relatively small SPD set that is not intentionally designed to test the difference between two or more measures may not be suitable for comparing performance in a generalized fashion. Rather, it is better to design a specific set of SPDs to compare performance, exploring specific differences in characterization of colour rendition.
Even when appropriate, searching for best-fit models should be undertaken with care. For example, increasing the number of parameters will increase the correlation, but at some point, the data will be over fit.242,243 This can lead to failures to replicate and make the models less useful in predictive applications. When comparing models, additional statistics, such as Mallow’s Cp
244 or the Akaike Information Criterion,245 should be used to guide selection. Adjusted or predicted r2 values can be more informative than standard r2 values, compensating for the number of terms in the model. Beyond statistics, the terms included in the model should have a strong theoretical basis that justifies their inclusion.
When fitting linear regression models, reporting should include the statistical significance of the factors, not just the overall statistic on correlation. Additionally, the statistical significance of the difference in
p. 23
correlation coefficients can be determined, instead of just investigating the rank order.246 It should be noted that it is possible to have a high coefficient of determination r2 value with a not significant p-value.
Even if comparing measures is not the purpose, regression models can be prone to overgeneralization, especially for studies with insufficient variation of SPDs and their derived colour rendition metrics that seek to support specification guidance for a wide range of architectural lighting applications. That is, the model should only be applied to the population that was sampled and may not be useful for establishing performance criteria that are applicable to all possible lighting conditions if only a small range were examined.
While a small number of targeted SPDs can be appropriate for testing a specific hypothesis, it can be difficult or impossible to sample the range of possible colour rendition solutions—varying at least average colour fidelity, gamut area, and gamut shape, which are all known to influence colour rendition perceptions in polychromatic environments—using only a few SPDs. The problem of using few SPDs selected for convenience to examine the performance of colour rendition measures is not new. Ouweltjes247 wrote in 1960: “…most authors compare a few commercial fluorescent lamps, mainly of the Standard type, with those of the de Luxe type. The difference between Standard fluorescent lamps and the de Luxe lamps is so pronounced that any method having a more or less sound background will show de Luxe lamps to be better than the Standard lamps.” However, many colour rendition studies have continued to include few SPDs, while seeking to establish generalized relationships or recommendations. The median number of SPDs presented in the 49 studies reported since 2010 is 12. A small sample of SPDs may result in an incomplete test of the relationship between measures of colour rendition and subjective evaluations of scene colour appearance. Notwithstanding the above, if an experimenter is testing a specific hypothesis rather than probing a general trend, it may be suitable to employ a small number of SPDs that are explicitly engineered to probe the hypothesis under study.
It has been shown that if only limited aspects of colour rendition are varied (e.g. colour fidelity) and others excluded (e.g. gamut shape), subjective evaluations of colour rendition (e.g. colour preference) can be explained with average measures of colour rendition, even though these measures have far less ability to predict the same perception across a wide range of SPDs.248 Likewise, if the range of possible values is limited (e.g. Rg < 115 and Rcs,h1 < 15%), a linear model can show strong correlation without accounting for nonlinearity in the relationship (e.g. colour preference can decrease when chroma enhancement becomes too great). Therefore, regression can be internally valid without being externally valid due to insufficient sampling. Further, conglomerating and averaging correlation coefficients for measures of colour rendition across multiple studies using small numbers of SPDs does not address external validity. Correlation can be high for many small SPDs sets, but low for a wider range of SPDs.
Regression models fit to one dataset often do not show high correlation for other datasets, even if the same factors have a statistically significant relationship. In other words, the coefficients of the model can vary substantially. This could at least partially be the result of range bias (i.e. the type and extents of SPDs included), with additional effects potentially arising from other variable factors, such as the objects, questionnaire, or participant demographics. For these reasons, it is generally not recommended to use regression modelling to derive single-number metrics from experimental data that are intended for general use.
It is important that all articles include an honest reflection on the limited inference that can be gained from a single experiment, without attempting to justify methodological flaws. Most of the methodological considerations discussed in this article can be addressed with proper experimental planning. Given the advanced stage of colour rendition research, there is unlikely to be sufficient justification for publication of results arising from experiments conducted that do not follow good
p. 24
practices. The processes that were followed in the past cannot be assumed to be appropriate given today's understandings.
5. Discussion Much has been learned from more than 60 years of research on subjective evaluations of colour rendition. This period has included plenty of exploratory, pre-hypothesis research (e.g. observational studies), with a slowly increasing presence of hypothesis-driven confirmatory research. Though some field studies of lighting have employed colour as one of the independent variables, further field studies in varied settings may help validate the results of additional confirmatory research. Still, the mixture of high-quality and questionable research that forms the body of research on colour rendition quality has likely slowed progress, with assertions from past work often being contradicted with later studies—in hindsight, more rigorous experimental methods could have avoided the need for so many iterative experiments. Some of the most common quality concerns include:
1. Failing to control for all lighting variables, such as chromaticity, Duv, and gamut shape, resulting in confounded data
2. Compounding poor control of chromaticity with insufficient chromatic adaptation, resulting in a visual stimulus that may be perceived differently from its numerical characterizations
3. Exploratory research with insufficient sampling of the range of possible colour rendition characteristics, with results that should not be extended and used for guiding architectural lighting practice, but for which authors sometimes use to justify generalized recommendations
4. Small sample sizes and poor reporting on statistical power 5. Failing to establish clear research hypotheses, design experiments that will test them, and
perform appropriate statistical analyses.
These concerns all leave a large portion of the available data unsuitable for establishing generalized recommendations on the quantification and specification of light source colour rendition. A precise critical review of this entire body of literature, using guidance established in this manuscript, will be the focus of future work.
To establish a solid foundation for future research on subjective evaluations of colour rendition, we recommend a collective, convergent research effort to directly investigate how common experimental methods may be biasing results or limiting external validity. The following research questions are a starting point, but not all are equally worthwhile:
1. How does mixed adaptation (which could be spatial if presented with two scenes simultaneously, or temporal if presented with two scenes in sequence) influence the subjective evaluation of colour rendition compared to complete adaptation? How long of an adaptation period is necessary?
2. Does inclusion of a simultaneously appearing reference illuminant influence the subjective evaluation of colour rendition compared to judging each condition individually?
3. What are the relationships between similar words (e.g. preference, pleasantness, attractiveness, or acceptability) that are employed as dependent measures? Is it desirable and possible to adopt consistent language to guide future research on perceptions of colour rendition?
4. How does the quantity and type of visual targets influence colour rendition perception? 5. How does the range and quantity of SPDs affect subjective evaluation of colour rendition? 6. What is the role of colour contrast adaptation in short-term laboratory-based experiments and
how does it affect the application of knowledge to real architectural environments?
p. 25
7. Can the results from rating scales be corroborated with other measurement tools, particularly ones that rely more on physiological measurements (e.g. heart-rate variability, electroencephalogram, or behavioural patterns like sales)?
8. How do subjective evaluations change over short (i.e. minutes) and long (i.e. days or months) periods?
In addition to initiating a line of research on experimental methods, we recommend an increase in hypothesis-driven research—which in some cases could be done concurrently. Some important inquiries include deeper investigation of the role of gamut shape in driving subjective evaluations, interactive effects of objects and light source colour rendition characteristics, and the role of illuminance level in assessing colour rendition quality—all of which have downstream implications for specification targets. The best practices identified in this article, summarized for easy reference in Figure 3, can help researchers address these objectives. This could be used as a checklist by researchers or reviewers, potentially in conjunction with the more general STrengthening the Reporting of OBservation studies in Epidemiology (STROBE) Statement.249 Figure 3 focuses on issues related to subjective evaluations of colour rendition, and is not a comprehensive record of good research practices.
While there is already some anecdotal experiential evidence, field studies are needed to determine the external validity of laboratory-based research on colour rendition. In this process, we encourage use of measures that go beyond self-reports to include objective measures such as sales, employee turnover, and student performance. Such dependent measures make the most use of the real setting and cannot be easily administered in a laboratory.
6. Conclusions This article provides methodological recommendations to increase the evidential value of laboratory-based psychophysical experiments investigating the effect of light source spectral power distribution on the subjective evaluation of the colour appearance of scenes, and it is intended to serve as a resource for researchers, reviewers, and readers. There are many ways to conduct excellent research, and there is no single prescription for quality.
Research in this field has proliferated in the past decade, but a lack of methodological rigor has made deciphering and applying the results difficult. This article identifies a range of issues that can (and have) reduced the credibility and usability of published results on colour preference, colour naturalness, and other subjectively evaluated aspects of colour rendition. A renewed focus on how research is conducted in this field, rather than simply adding new data to an already crowded collection, can help resolve pressing questions about perceptions of colour rendition, and will hopefully inspire new research.
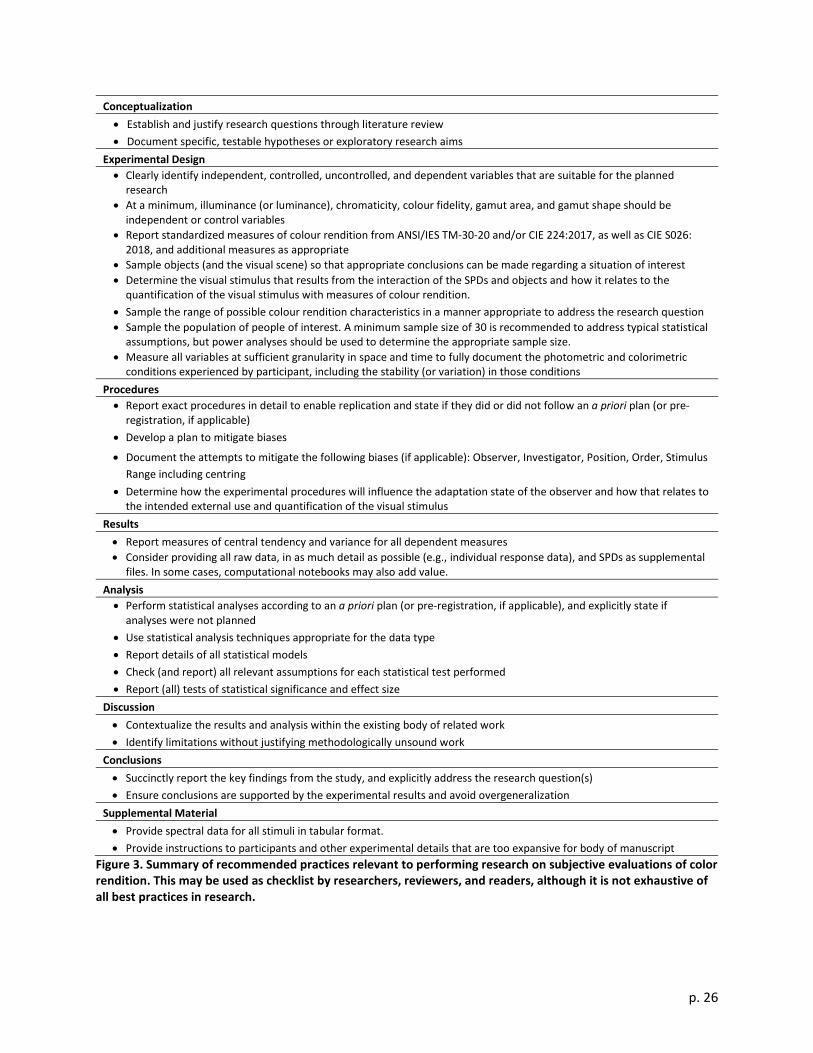
p. 26
Conceptualization • Establish and justify research questions through literature review • Document specific, testable hypotheses or exploratory research aims
Experimental Design • Clearly identify independent, controlled, uncontrolled, and dependent variables that are suitable for the planned
research • At a minimum, illuminance (or luminance), chromaticity, colour fidelity, gamut area, and gamut shape should be
independent or control variables • Report standardized measures of colour rendition from ANSI/IES TM-30-20 and/or CIE 224:2017, as well as CIE S026:
2018, and additional measures as appropriate • Sample objects (and the visual scene) so that appropriate conclusions can be made regarding a situation of interest • Determine the visual stimulus that results from the interaction of the SPDs and objects and how it relates to the
quantification of the visual stimulus with measures of colour rendition. • Sample the range of possible colour rendition characteristics in a manner appropriate to address the research question • Sample the population of people of interest. A minimum sample size of 30 is recommended to address typical statistical
assumptions, but power analyses should be used to determine the appropriate sample size. • Measure all variables at sufficient granularity in space and time to fully document the photometric and colorimetric
conditions experienced by participant, including the stability (or variation) in those conditions Procedures • Report exact procedures in detail to enable replication and state if they did or did not follow an a priori plan (or pre-
registration, if applicable) • Develop a plan to mitigate biases
• Document the attempts to mitigate the following biases (if applicable): Observer, Investigator, Position, Order, Stimulus Range including centring
• Determine how the experimental procedures will influence the adaptation state of the observer and how that relates to the intended external use and quantification of the visual stimulus
Results • Report measures of central tendency and variance for all dependent measures • Consider providing all raw data, in as much detail as possible (e.g., individual response data), and SPDs as supplemental
files. In some cases, computational notebooks may also add value. Analysis • Perform statistical analyses according to an a priori plan (or pre-registration, if applicable), and explicitly state if
analyses were not planned • Use statistical analysis techniques appropriate for the data type • Report details of all statistical models • Check (and report) all relevant assumptions for each statistical test performed • Report (all) tests of statistical significance and effect size
Discussion • Contextualize the results and analysis within the existing body of related work • Identify limitations without justifying methodologically unsound work
Conclusions • Succinctly report the key findings from the study, and explicitly address the research question(s) • Ensure conclusions are supported by the experimental results and avoid overgeneralization
Supplemental Material • Provide spectral data for all stimuli in tabular format. • Provide instructions to participants and other experimental details that are too expansive for body of manuscript
Figure 3. Summary of recommended practices relevant to performing research on subjective evaluations of color rendition. This may be used as checklist by researchers, reviewers, and readers, although it is not exhaustive of all best practices in research.
p. 27
References 1. Bouma PJ. Colour reproduction in the use of different sources of ‘white’ light. Philips Technical
Review 1937; 2: 1–7.
2. Rea MS, Freyssinier JP. Color rendering: Beyond pride and prejudice. Color Research and Application 2010; 35: 401–409.
3. Smet KAG, Ryckaert WR, Pointer MR, Deconinck G, Hanselaer P. Memory colours and colour quality evaluation of conventional and solid-state lamps. Optics Express 2010; 18: 26229.
4. Baniya RR, Dangol R, Bhusal P, Wilm A, Baur E, Puolakka M, et al. User-acceptance studies for simplified light-emitting diode spectra. Lighting Research and Technology 2015; 47: 177–191.
5. Bodrogi P, Brückner S, Khanh TQ, Winkler H. Visual assessment of light source color quality. Color Research and Application 2013; 38: 4–13.
6. Liu A, Tuzikas A, Žukauskas A, Vaicekauskas R, Vitta P, Shur M. Cultural preferences to color quality of illumination of different artwork objects revealed by a color rendition engine. IEEE Photonics Journal 2013; 5: 6801010.
7. Tsukitani A. Optimization of colour quality for landscape lighting based on feeling of contrast index. In: CIE Centenary Conference ‘Towards a New Century of Light’. Paris, France: Commission Internationale de l’Eclairage, 2013, pp. 68–71.
8. Vick K, Allen G, Lighting GE. Quantifying Consumer Lighting Preference. In: 14th International Symposium on the Science and Technology of Lighting (LS14). Como, Italy, 2014.
9. Szabó F, Kéri R, Schanda J, Csuti P, Mihálykó-Orbán E. A study of preferred colour rendering of light sources: Home lighting. Lighting Research and Technology 2016; 48: 103–125.
10. Wei M, Houser KW, Allen GR, Beers WW. Color preference under LEDs with diminished yellow emission. Leukos 2014; 10: 119–131.
11. Lin Y, Wei M, Smet KAG, Tsukitani A, Bodrogi P, Khanh TQ. Colour preference varies with lighting application. Lighting Research and Technology 2017; 49: 316–328.
12. Jost-Boissard S, Avouac P, Fontoynont M. Assessing the colour quality of LED sources: Naturalness, attractiveness, colourfulness and colour difference. Lighting Research and Technology 2015; 47: 769–794.
13. Ohno Y, Fein M, Miller C. Vision experiment on chroma saturation for colour quality preference. In: 28th CIE Session. Manchester, UK: Commission Internationale de l’Eclairage, 2015.
14. Smet K, Ryckaert WR, Pointer MR, Deconinck G, Hanselaer P. Colour appearance rating of familiar real objects. Color Research and Application 2011; 36: 192–200.
15. Wei M, Houser KW, David A, Krames MR. Perceptual responses to LED illumination with colour rendering indices of 85 and 97. Lighting Research and Technology 2015; 47: 810–827.
16. Wei M, Houser KW. Systematic Changes in Gamut Size Affect Color Preference. Leukos 2017; 13: 23–32.
17. Lin Y, He J, Tsukitani A, Noguchi H. Colour quality evaluation of natural objects based on the Feeling of Contrast Index. Lighting Research and Technology 2016; 48: 323–339.
18. Wei M, Houser KW, David A, Krames MR. Colour gamut size and shape influence colour preference. Lighting Research and Technology 2017; 49: 992–1014.
p. 28
19. Khanh TQ, Bodrogi P, Vinh QT, Stojanovic D. Colour preference, naturalness, vividness and colour quality metrics, Part 1: Experiments in a room. Lighting Research and Technology 2017; 49: 697–713.
20. Khanh TQ, Bodrogi P, Vinh QT, Stojanovic D. Colour preference, naturalness, vividness and colour quality metrics, Part 2: Experiments in a viewing booth and analysis of the combined dataset. Lighting Research and Technology 2017; 49: 714–726.
21. Khanh TQ, Bodrogi P. Colour preference, naturalness, vividness and colour quality metrics, Part 3: Experiments with makeup products and analysis of the complete warm white dataset. Lighting Research and Technology 2018; 50: 218–236.
22. Khanh TQ, Bodrogi P, Vinh QT, Guo X, Anh TT. Colour preference, naturalness, vividness and colour quality metrics, Part 4: Experiments with still life arrangements at different correlated colour temperatures. Lighting Research and Technology 2018; 50: 862–879.
23. Khanh TQ, Bodrogi P, Guo X, Vinh QT, Fischer S. Colour preference, naturalness, vividness and colour quality metrics, Part 5: A colour preference experiment at 2000 lx in a real room. Lighting Research and Technology 2019; 51: 262–279.
24. Royer MP, Wilkerson A, Wei M, Houser K, Davis R. Human perceptions of colour rendition vary with average fidelity, average gamut, and gamut shape. Lighting Research and Technology 2017; 49: 966–991.
25. Žukauskas A, Vaicekauskas R, Shur M. Color-dulling solid-state sources of light. Optics Express 2012; 20: 9755.
26. Bieske K, Hartwig UM, Schierz C, Wilm A, Horst C. TM-30-15 and CIE-CRI-RA: Investigation of colour rendering of white PC LEDs. Light and Engineering 2018; 26: 81–87.
27. Royer MP, Wilkerson A, Wei M. Human perceptions of colour rendition at different chromaticities. Lighting Research and Technology 2018; 50: 965–994.
28. Durmus D, Davis W. Object color naturalness and attractiveness with spectrally optimized illumination. Optics Express 2017; 25: 12839.
29. Zhang F, Xu H, Feng H. Toward a unified model for predicting color quality of light sources. Applied Optics 2017; 56: 8186.
30. Kawashima Y, Ohno Y. Vision experiment on verification of hunt effect in lighting. In: 29th CIE Session. Washington, D.C.: CIE, 2019, pp. 496–504.
31. He J, Lin Y, Yano T, Noguchi H, Yamaguchi S, Matsubayashi Y. Preference for appearance of Chinese complexion under different lighting. Lighting Research and Technology 2017; 49: 228–242.
32. Zhai Q, Luo MR. Colour quality assessment under LED tuneable sources with varying gamut sizes and shapes. In: CIE Midterm Meeting. Jeju, South Korea: Commission Internationale de l’Eclairage, 2018, pp. 47–52.
33. Revantino, Mangkuto RA, Enge A, Munir F, Soelami FXN, Faridah. The effects of illuminance, colour temperature, and colour rendering of various existing light-emitting diode lamps on subjective preference and performance in Indonesia. Journal of Building Engineering 2018; 19: 334–341.
p. 29
34. Huang Z, Liu Q, Liu Y, Pointer MR, Luo MR, Wang Q, et al. Best lighting for jeans, part 1: Optimising colour preference and colour discrimination with multiple correlated colour temperatures. Lighting Research and Technology 2019; 51: 1208–1223.
35. Khanh TQ, Bodrogi P, Guo X. Towards a user preference model for interior lighting, Part 3: An alternative model. Lighting Research and Technology 2020; 52: 189–201.
36. Spaulding JM. Evaluation of desirability assessment techniques for tunable solid state lighting applications. In: Human Factors and Ergonomics Society Annual Meeting. 2012, pp. 643–647.
37. Esposito T, Houser K. Models of colour quality over a wide range of spectral power distributions. Lighting Research and Technology 2019; 51: 331–352.
38. Tang X, Teunissen C. The appreciation of LED-based white light sources by Dutch and Chinese people in three application areas. Lighting Research and Technology 2019; 51: 353–372.
39. Wei M, Bao W, Huang HP. Consideration of light level in specifying light source color rendition. Leukos 2020; 16: 55–65.
40. Liu Q, Huang Z, Pointer MR, Luo MR, Xiao K, Westland S. Evaluating colour preference of lighting with an empty light booth. Lighting Research and Technology 2018; 50: 1249–1256.
41. Huang Z, Liu Q, Westland S, Pointer MR, Luo MR, Xiao K. Light dominates colour preference when correlated colour temperature differs. Lighting Research and Technology 2018; 50: 995–1012.
42. Acosta I, León J, Bustamante P. Daylight spectrum index: A new metric to assess the affinity of light sources with daylighting. Energies 2018; 11: 2545.
43. Bao W, Wei M. Change of gamut size for producing preferred color appearance from 20 to 15000 lux. Leukos 2021; 17: 21–42.
44. Royer MP, Wei M, Wilkerson A, Safranek S. Experimental validation of colour rendition specification criteria based on ANSI/IES TM-30-18. Lighting Research and Technology 2020; 52: 323–349.
45. Teunissen C, Van Der Heijden FHFW, Poort SHM, De Beer E. Characterising user preference for white LED light sources with CIE colour rendering index combined with a relative gamut area index. Lighting Research and Technology 2017; 49: 461–480.
46. Imai Y, Kotani T, Fuchida T. A Study of Color Rendering Properties based on Color Preference of Objects in Adaptation to LED Lighting. In: CIE Centenary Conference “Towards a New Century of Light”. Vienna, Austria: Commission Internationale de l’Eclairage, 2013: 62–67.
47. Islam MS, Dangol R, Hyvärinen M, Bhusal P, Puolakka M, Halonen L. User preferences for LED lighting in terms of light spectrum. Lighting Research and Technology 2013; 45: 641–665.
48. Dangol R, Islam M, Lisc MH, Bhusal P, Puolakka M, Halonen L. Subjective preferences and colour quality metrics of LED light sources. Lighting Research and Technology 2013; 45: 666–688.
49. Veitch JA, Whitehead LA, Mossman M, Pilditch TD. Chromaticity-matched but spectrally different light source effects on simple and complex color judgments. Color Research and Application 2014; 39: 263–274.
50. Dangol R, Islam MS, Hyvärinen M, Bhushal P, Puolakka M, Halonen L. User acceptance studies for LED office lighting: Preference, naturalness and colourfulness. Lighting Research and Technology 2015; 47: 36–53.
p. 30
51. Davis W. Color quality scale. Optical Engineering 2010; 49: 033602.
52. Davis W, Ohno Y. Approaches to color rendering measurement. Journal of Modern Optics 2009; 56: 1412–1419.
53. Commission Internationale de l’Eclairage. Colour Rendering of White Led Light Sources. CIE 177:2007. Vienna, Austria: Commission Internationale de l’Eclairage, 2007.
54. Van Trigt C. Color rendering, a reassessment. Color Research and Application 1999; 24: 197–206.
55. Houser K, Mossman M, Smet K, Whitehead L. Tutorial: Color rendering and its applications in lighting. Leukos 2016; 12: 7–26.
56. David A, Fini PT, Houser KW, Ohno Y, Royer MP, Smet KAG, et al. Development of the IES method for evaluating the color rendition of light sources. Optics Express 2015; 23: 15888.
57. Commission Internationale de l’Eclairage. Method of measuring and specifying colour rendering properties of light sources. CIE 13.3-1995. Vienna, Austria: Commission Internationale de l’Eclairage, 1995.
58. Commission Internationale de l’Eclairage. CIE 2017 colour fidelity index for accurate scientific use. CIE 224:2017. Vienna, Austria: Commission Internationale de l’Eclairage, 2017.
59. De Beer E, Van Der Burgt P, Van Kemenade J. Another color rendering metric: Do we really need it, van we live without it? Leukos 2016; 12: 51–59.
60. Bodrogi P, Lin Y, Xiao X, Stojanovic D, Khanh TQ. Intercultural observer preference for perceived illumination chromaticity for different coloured object scenes. Lighting Research and Technology 2017; 49: 305–315.
61. Huang Z, Liu Q, Pointer MR, Luo MR, Wu B, Liu A. White lighting and colour preference, Part 1: Correlation analysis and metrics validation. Lighting Research and Technology 2020; 52: 5–22.
62. Rea MS, Freyssinier-Nova JP. Color rendering: A tale of two metrics. Color Research and Application 2008; 33: 192–202.
63. Veitch JA, Fotios SA, Houser KW. Judging the scientific quality of applied lighting research. Leukos 2019; 15: 97–114.
64. Sanders CL. Colour preferences for natural objects. Journal of the Illuminating Engineering Society 1959; 54: 452–456.
65. Sanders CL. Assessment of color rendition under an illuminant using color tolerances for natural objects. Journal of the Illuminating Engineering Society 1959; 54: 640–646.
66. Aston SM, Bellchambers HE. Illumination, colour rendering and visual clarity. Lighting Research and Technology 1969; 1: 259–261.
67. Jerome CW. Flattery vs color rendition. Journal of the Illuminating Engineering Society 1972; 1: 208–211.
68. Thornton WA. A validation of the color-preference index. Journal of the Illuminating Engineering Society 1974; 4: 48–52.
69. Siple P, Springer RM. Memory and preference for the colors of objects. Perception and Psychophysics 1983; 34: 363–370.
p. 31
70. Boray PF, Gifford R, Rosenblood L. Effects of warm white, cool white and full-spectrum fluorescent lighting on simple cognitive performance, mood and ratings of others. Journal of Environmental Psychology 1989; 9: 297–307.
71. Boynton RM, Fargo L, Collins BL. Categorical color rendering of four common light sources. Color Research and Application 1990; 15: 222–230.
72. Rea MS, Robertson AR, Petrusic WM. Colour rendering of skin under fluorescent lamp illumination. Color Research and Application 1990; 15: 80–92.
73. Yano T, Hashimoto K. Preference for Japanese complexion color under illumination. Color Research and Application 1997; 22: 269–274.
74. Veitch JA, Tiller DK, Pasini I, Arsenault CD, Jaekel RR, Svec JM. The effects of fluorescent lighting filters on skin appearance and visual performance. Journal of the Illuminating Engineering Society 2002; 31: 40–60.
75. Quellman EM, Boyce PR. The light source color preferences of people of different skin tones. Journal of the Illuminating Engineering Society 2002; 31: 109–118.
76. Narendran N, Deng L. Color rendering properties of LED light sources. In: Fergusen I, Narendran N, DenBaars S, et al. (eds) SPIE 4776, Solid State Lighting II. International Society for Optics and Photonics, 2002, p. 61.
77. Tiller DK, Hu X, Houser KW. Tuning the fluorescent spectrum for the trichromatic visual response: A pilot study. Leukos 2005; 1: 7–23.
78. Szabó F, Schanda J, Bodrogi P, Radkov E. A comparative study of new solid state light sources. Proceedings of the 26th Session of the CIE 2007; 5: 4–5.
79. Boissard S, Fontoynont M. Optimization of led-based light blendings for object presentation. Color Research and Application 2009; 34: 310–320.
80. Jost-Boissard S, Fontoynont M, Blanc-Gonnet J. Perceived lighting quality of LED sources for the presentation of fruit and vegetables. Journal of Modern Optics 2009; 56: 1420–1432.
81. Szabó F, Bodrogi P, Schanda J. A colour harmony rendering index based on predictions of colour harmony impression. Lighting Research and Technology 2009; 41: 165–180.
82. Smet K, Ryckaert WR, Pointer MR, Deconinck G, Hanselaer P. Correlation between color quality metric predictions and visual appreciation of light sources. Optics Express 2011; 19: 8151.
83. Hashimoto K, Yano T, Shimizu M, Nayatani Y. New method for specifying color-rendering properties of light sources based on feeling of contrast. Color Research and Application 2007; 32: 361–371.
84. Royer MP, Houser KW, David A. Chroma shift and gamut shape: Going beyond average color fidelity and gamut area. Leukos 2018; 14: 149–165.
85. Royer MP, Houser KW, Wilkerson AM. Color discrimination capability under highly structured spectra. Color Research and Application 2012; 37: 441–449.
86. Esposito T, Houser K. A new measure of colour discrimination for LEDs and other light sources. Lighting Research and Technology 2019; 51: 5–23.
87. Judd D. A flattery index for artificial illumiants. Ies Transactions 1967; 593.
p. 32
88. Houser KW, Hu X. Visually matching daylight fluorescent lamplight with two primary sets. Color Research and Application 2004; 29: 428–437.
89. Illuminating Engineering Society. IES Method for Evaluating Light Source Color Rendition. ANSI/IES TM-30-20. New York, NY: Illuminating Engineering Society, 2020.
90. Royer MP. Tutorial: Background and guidance for using the ANSI/IES TM-30 method for evaluating light source color rendition. Leukos 2021; Online Bef: 1–41.
91. Jaeger RG, Halliday TR. On confirmatory versus exploratory research. Herpetologica 1998; 54: S64–S66.
92. Tukey JW. We need both exploratory and confirmatory. American Statistician 1980; 34: 23–25.
93. Kimmelman J, Mogil JS, Dirnagl U. Distinguishing between Exploratory and Confirmatory Preclinical Research Will Improve Translation. PLoS Biology 2014; 12: e1001863.
94. Thornton WA. Color-discrimination index. Journal of the Optical Society of America 1972; 62: 191–194.
95. Wang Y, Wei M. Preference among light sources with different Duv but similar colour rendition: A pilot study. Lighting Research and Technology 2018; 50: 1013–1023.
96. Yang B, Wei M. Road lighting: A pilot study investigating improvement of visual performance using light sources with a larger gamut area. Lighting Research and Technology 2020; 52: 895–905.
97. Thornton WA, Jerome CW. The Flattery Index. Journal of the Illuminating Engineering Society 1973; 2: 351–354.
98. Einhorn HD, Naudé DEH. Colour-rendering preferences for lighting the face. Lighting Research and Technology 1963; 28: 149–154.
99. Popper K. The logic of scientific discovery. Routledge, 2005.
100. Poulton EC. Quantitative subjective assessments are almost always biased, sometimes completely misleading. British Journal of Psychology 1977; 68: 409–425.
101. Poulton EC. Biases in quantitative judgements. Applied Ergonomics 1982; 13: 31–42.
102. Smith J, Noble H. Bias in research. Evidence-Based Nursing 2014; 17: 100–101.
103. Nosek BA, Ebersole CR, DeHaven AC, Mellor DT. The preregistration revolution. Proceedings of the National Academy of Sciences of the United States of America 2018; 115: 2600–2606.
104. Nosek BA, Beck ED, Campbell L, Flake JK, Hardwicke TE, Mellor DT, et al. Preregistration is hard, and worthwhile. Trends in Cognitive Sciences 2019; 23: 815–818.
105. Aarts AA, Anderson JE, Anderson CJ, Attridge PR, Attwood A, Axt J, et al. Estimating the reproducibility of psychological science. Science 2015; 349: aac4716.
106. Camerer CF, Dreber A, Holzmeister F, Ho TH, Huber J, Johannesson M, et al. Evaluating the replicability of social science experiments in Nature and Science between 2010 and 2015. Nature Human Behaviour 2018; 2: 637–644.
107. Ioannidis JPA. Why most published research findings are false. Getting to Good: Research Integrity in the Biomedical Sciences 2018; 2: 2–8.
p. 33
108. Wicherts JM, Veldkamp CLS, Augusteijn HEM, Bakker M, van Aert RCM, van Assen MALM. Degrees of freedom in planning, running, analyzing, and reporting psychological studies: A checklist to avoid P-hacking. Frontiers in Psychology 2016; 7: 1832.
109. Head ML, Holman L, Lanfear R, Kahn AT, Jennions MD. The extent and consequences of p-hacking in science. PLoS Biology 2015; 13: e1002106.
110. Simmons JP, Nelson LD, Simonsohn U. False-positive psychology: Undisclosed flexibility in data collection and analysis allows presenting anything as significant. Psychological Science 2011; 22: 1359–1366.
111. Kerr NL. HARKing: Hypothesizing after the results are known. Personality and Social Psychology Review 1998; 2: 196–217.
112. Commission Internationale de l’Eclairage. Guide to protocols for describing lighting. CIE 213:2014. Vienna, Austria: Commission Internationale de l’Eclairage, 2014.
113. Houser KW, Wei M, David A, Krames MR. Whiteness perception under LED illumination. Leukos 2014; 10: 165–180.
114. Commission Internationale de l’Eclairage. Colorimetry, 4th Edition. CIE 15:2018. Vienna, Austria: Commission Internationale de l’Eclairage, 2018.
115. Ohno Y. Practical use and calculation of CCT and Duv. Leukos 2014; 10: 47–55.
116. National Electrical Manufacturers Association. American National Standard for Electric Lamps-Specifications for the Chromaticity of Solid-State Lighting Products National Electrical Manufacturers Association. ANSI/NEMA C78.377-2017. Rosslyn, Virginia: National Electral Manufacturers Association, 2017.
117. Commission Internationale de L’Eclairage. CIE System for Metrology of Optical Radiation for ipRGC-Influenced Responses to Light. CIE S 026/E:2018. Vienna, Austria: Commission Internationale de l’Eclairage, 2018.
118. Commission Internationale de l’Eclairage. What to document and report in studies of ipRGC-influenced responses to light. CIE TN 011:2020. Vienna, Austria: Commission Internationale de l’Eclairage, 2020.
119. Cao D, Chang A, Gai S. Evidence for an impact of melanopsin activation on unique white perception. Journal of the Optical Society of America A 2018; 35: B287.
120. Patterson SS, Kuchenbecker JA, Anderson JR, Neitz M, Neitz J. A color vision circuit for non-image-forming vision in the primate retina. Current Biology 2020; 30: 1269-1274.e2.
121. CIE. Fundamental chromaticity diagram with physiological axes - Part 1. Commission Internationale de l’Eclairage, 2006.
122. Commission Internationale de l’Eclairage. Fundamental Chromaticity Diagram with Physiological Axes - Part 2: Spectral Luminous Efficiency Functions and Chromaticity Diagrams. CIE 170-2:2015. Vienna, Austria: Commission Internationale de l’Eclairage, 2015.
123. Royer M, Whitehead L, Smet K, Murdoch MJ, David AA, Houser K, et al. Improved system for evaluating and specifying the chromaticity of light sources. In: IES Annual Conference. New Orleans, Louisiana: Illuminating Engineering Society, 2020.
124. Hu X, Houser KW. Large-field color matching functions. Color Research and Application 2006; 31: 18–29.
p. 34
125. David A, Esposito T, Houser K, Royer M, Smet KAG, Whitehead L. A vector field color rendition model for characterizing color shifts and metameric mismatch. Leukos 2020; 16: 99–114.
126. Mirzaei H, Funt B. Metamer mismatching as a measure of the color rendering of lights. In: AIC2015 Color and Image. Tokyo, Japan, 2015, pp. 1001–1006.
127. David A, Krames MR, Houser KW. Whiteness metric for light sources of arbitrary color temperatures: proposal and application to light-emitting-diodes. Optics Express 2013; 21: 16702.
128. Ma S, Wei M, Liang J, Wang B, Chen Y, Pointer M, et al. Evaluation of whiteness metrics. Lighting Research and Technology 2018; 50: 429–445.
129. Foster DH, Amano K. Hyperspectral imaging in color vision research: tutorial. Journal of the Optical Society of America A 2019; 36: 606.
130. Royer MP, Wei M. The role of presented objects in deriving color preference criteria from psychophysical studies. Leukos 2017; 13: 143–157.
131. Schmitt N, Ghiselli EE, Campbell JP, Zedeck S. Measurement Theory for the Behavioral Sciences. WH Freeman, 1983.
132. Delaney WB, Hughes PC, McNelis JF, Sarver JF, Soules TF. An examination of visual clarity with high color rendering fluorescent light sources. Journal of the Illuminating Engineering Society 1978; 7: 74–84.
133. Huber VL. Effects of task difficulty, goal setting, and strategy on performance of a heuristic task. Journal of Applied Psychology 1985; 70: 492–504.
134. Fotiosand SA, Houser KW. Research methods to avoid bias in categorical ratings of brightness. Leukos 2009; 5: 167–181.
135. Commission Internationale de l’Eclairage. Guidance towards best practice in psychophysical procedures used when measuring relative spatial brightness. CIE 212:2014. Vienna, Austria: Commission Internationale de l’Eclairage, 2014.
136. Harpe SE. How to analyze Likert and other rating scale data. Currents in Pharmacy Teaching and Learning 2015; 7: 836–850.
137. Nadler JT, Weston R, Voyles EC. Stuck in the middle: The use and interpretation of mid-points in items on questionnaires. Journal of General Psychology 2015; 142: 71–89.
138. Matell MS, Jacoby J. Is there an optimal number of alternatives for Likert-scale items? Effects of testing time and scale properties. Journal of Applied Psychology 1972; 56: 506–509.
139. Chan JC. Response-Order effects in Likert-Type scales. Educational and Psychological Measurement 1991; 51: 531–540.
140. Foster DH, Amano K, Nascimento SMC. How temporal cues can aid colour constancy. Color Research and Application 2001; 26: S180–S185.
141. Foster DH, Amano K, Nascimento SMC. Colour constancy from temporal cues: Better matches with less variability under fast illuminant changes. Vision Research 2001; 41: 285–293.
142. Elliot AJ, Maier MA. Color psychology: Effects of perceiving color on psychological functioning in humans. Annual Review of Psychology 2014; 65: 95–120.
p. 35
143. Wei M, Houser K, David A, Krames M. Effect of gamut shape on colour preference. In: CIE 2016 Lighting Quality and Energy Efficiency. Melbourne, Australia: Commission Internationale de l’Eclairage, 2016, pp. 32–41.
144. Zhang X, Funt B, Mirzaei H. Metamer mismatching in practice versus theory. Journal of the Optical Society of America A 2016; 33: A238.
145. Logvinenko AD, Funt B, Mirzaei H, Tokunaga R. Rethinking colour constancy. PLoS ONE 2015; 10: e0135029.
146. Lee SM, Lee KT, Lee SH, Song JK. Origin of human colour preference for food. Journal of Food Engineering 2013; 119: 508–515.
147. Pérez-Carpinell J, De Fez MD, Baldoví R, Soriano JC. Familiar objects and memory color. Color Research and Application 1998; 23: 416–427.
148. Olkkonen M, Hansen T, Gegenfurtner KR. Color appearance of familiar objects: Effects of object shape, texture, and illumination changes. Journal of Vision 2008; 8: 13–13.
149. Brown RO, MacLeod DIA. Color appearance depends on the variance of surround colors. Current Biology 1997; 7: 844–849.
150. Shevell SK, Kingdom FAA. Color in complex scenes. Annual Review of Psychology 2008; 59: 143–166.
151. Luo MR, Gao XW, Scrivener SAR. Quantifying colour appearance. part V. simultaneous contrast. Color Research and Application 1995; 20: 18–28.
152. Smet KAG, Lin Y, Nagy B V., Németh Z, Duque-Chica GL, Quintero JM, et al. Cross-cultural variation of memory colors of familiar objects. Optics Express 2014; 22: 32308.
153. Smet KAG, Hanselaer P. Impact of cross-regional differences on color rendition evaluation of white light sources. Optics Express 2015; 23: 30216.
154. Birch J. Worldwide prevalence of red-green color deficiency. Journal of the Optical Society of America A 2012; 29: 313.
155. JUDD DB. The color perceptions of deuteranopic and protanopic observers. Journal of the Optical Society of America 1949; 39: 252–256.
156. Smith VC, Pokorny J. Large-field trichromacy in protanopes and deuteranopes. Journal of the Optical Society of America 1977; 67: 213–220.
157. Neitz M, Neitz J. Molecular genetics and the biological basis of color vision. Color Vision: Perspectives from Different Disciplines 2011; 101: 101–120.
158. Hassan MF, Paramesran R. Naturalness preserving image recoloring method for people with red–green deficiency. Signal Processing: Image Communication 2017; 57: 126–133.
159. Ching SL, Sabudin M. A study of color transformation on website images for the color blind. World Academy of Science, Engineering and Technology 2010; 62: 808–811.
160. Yang S, Ro YM. Visual contents adaptation for color vision deficiency. In: 2003 International Conference on Image Processing. Barcelona, Spain: IEEE, 2003, pp. 453–456.
161. Gómez-Robledo L, Valero EM, Huertas R, Martínez-Domingo MA, Hernández-Andrés J. Do EnChroma glasses improve color vision for colorblind subjects? Optics Express 2018; 26: 28693.
p. 36
162. Ghasemi A, Zahediasl S. Normality tests for statistical analysis: A guide for non-statisticians. International Journal of Endocrinology and Metabolism 2012; 10: 486–489.
163. Houser KW, Fotios SA, Royer MP. A Test of the S/P ratio as a correlate for brightness perception using rapid-sequential and side-by-side experimental protocols. Leukos 2009; 6: 119–137.
164. Gescheider GA. Psychophysical scaling. Annual review of psychology 1988; 39: 169–200.
165. Fotios SA, Cheal C. The effect of a stimulus frequency bias in side-by-side brightness ranking tests. Lighting Research and Technology 2008; 40: 43–50.
166. Fotios SA, Cheal C. Evidence for response contraction bias in side-by-side matching tasks. Lighting Research and Technology 2007; 39: 159–167.
167. Wickstrom G, Bendix T. The ″Hawthorne effect″ - What did the original Hawthorne studies actually show? Scandinavian Journal of Work, Environment and Health 2000; 26: 363–367.
168. Hróbjartsson A, Thomsen ASS, Emanuelsson F, Tendal B, Hilden J, Boutron I, et al. Observer bias in randomized clinical trials with measurement scale outcomes: A systematic review of trials with both blinded and nonblinded assessors. Cmaj 2013; 185: E201.
169. Burghardt GM, Bartmess-Levasseur JN, Browning SA, Morrison KE, Stec CL, Zachau CE, et al. Perspectives - Minimizing observer bias in behavioral studies: A review and recommendations. Ethology 2012; 118: 511–517.
170. Kruskal JB. Nonmetric multidimensional scaling: A numerical method. Psychometrika 1964; 29: 115–129.
171. García PA, Huertas R, Melgosa M, Cui G. Measurement of the relationship between perceived and computed color differences. Journal of the Optical Society of America A 2007; 24: 1823.
172. Melgosa M, García PA, Gómez-Robledo L, Shamey R, Hinks D, Cui G, et al. Notes on the application of the standardized residual sum of squares index for the assessment of intra- and inter-observer variability in color-difference experiments. Journal of the Optical Society of America A 2011; 28: 949.
173. Melgosa M, Huertas R, Berns RS. Performance of recent advanced color-difference formulas using the standardized residual sum of squares index. Journal of the Optical Society of America A 2008; 25: 1828.
174. Wei M, Royer M, Huang HP. Perceived colour fidelity under LEDs with similar Rf but different Ra. Lighting Research and Technology 2019; 51: 858–869.
175. Jost S, Cauwerts C, Avouac P. CIE 2017 color fidelity index Rf: a better index to predict perceived color difference? Journal of the Optical Society of America A 2018; 35: B202.
176. Gu HT, Luo MR, Liu XY. Testing different colour rendering metrics using colour difference data. Lighting Research and Technology 2017; 49: 539–560.
177. Fotios SA, Houser KW, Cheal C. Counterbalancing needed to avoid bias in side-by-side brightness matching tasks. Leukos 2008; 4: 207–223.
178. Kent MG, Fotios S, Cheung T. Stimulus range bias leads to different settings when using luminance adjustment to evaluate discomfort due to glare. Building and Environment 2019; 153: 281–287.
179. Fotios SA, Cheal C. Stimulus range bias explains the outcome of preferred-illuminance adjustments. Lighting Research and Technology 2010; 42: 433–447.
p. 37
180. Logadóttir Á, Christoffersen J, Fotios SA. Investigating the use of an adjustment task to set the preferred illuminance in a workplace environment. Lighting Research and Technology 2011; 43: 403–422.
181. Logadõttir Á, Fotios SA, Christoffersen J, Hansen SS, Corell DD, Dam-Hansen C. Investigating the use of an adjustment task to set preferred colour of ambient illumination. Color Research and Application 2013; 38: 46–57.
182. Rushton W. Visual adaptation. Proceedings of the Royal Society of London Series B, Containing papers of a biological character 1965; 162: 20–46.
183. Reuter T. Fifty years of dark adaptation 1961-2011. Vision Research 2011; 51: 2243–2262.
184. Barlow HB. Dark and light sdaptation: Psychophysics. Springer, Berlin, Heidelberg, pp. 1–28.
185. Fotios SA. Chromatic adaptation and the relationship between lamp spectrum and brightness. Lighting Research and Technology 2006; 38: 3–17.
186. Hunt RW. Light and dark adaptation and the perception of color. Journal of the Optical Society of America 1952; 42: 190–199.
187. Foster DH. Color constancy. Vision Research 2011; 51: 674–700.
188. Goldstein E, Brainard DH. Color Constancy. John Wiley and Sons, 2013.
189. Worthey JA. Limitations of color constancy. Journal of the Optical Society of America A 1985; 2: 1014.
190. Arend LE. How much does illuminant color affect unattributed colors? Journal of the Optical Society of America A 1993; 10: 2134.
191. Werner A. Spatial and temporal aspects of chromatic adaptation and their functional significance for colour constancy. Vision Research 2014; 104: 80–89.
192. Morovič J, Morovič P. Can highly chromatic stimuli have a low color inconstancy index? In: 13th IS&T/SID Color Imaging Conference. Scottsdale, Arizona: Society for Imaging Science and Technology, 2005, pp. 321–325.
193. Fernandez-Maloigne C, Trémeau A. Color Appearance Models. In: Digital Color. Chichester, UK: Wiley, 2013, pp. 65–92.
194. Fairchild MD, Reniff L. Time course of chromatic adaptation for color-appearance judgments. Journal of the Optical Society of America A 1995; 12: 824.
195. Rinner O, Gegenfurtner KR. Time course of chromatic adaptation for color appearance and discrimination. Vision Research 2000; 40: 1813–1826.
196. Webster MA, Wilson JA. Interactions between chromatic adaptation and contrast adaptation in color appearance. Vision Research 2000; 40: 3801–3816.
197. Shevell SK. The time course of chromatic adaptation. Color Research and Application 2001; 26: S170–S173.
198. Werner A, Sharpe LT, Zrenner E. Asymmetries in the time-course of chromatic adaptation and the significance of contrast. Vision Research 2000; 40: 1101–1113.
p. 38
199. Spieringhs RM, Murdoch MJ, Vogels IMLC. Time course of chromatic adaptation under dynamic lighting. In: 27th IS&T/SID Color Imaging Conference. Paris, France: Society for Imaging Science and Technology, 2019, pp. 13–18.
200. Hunt RWG. The effects of daylight and tungsten light-adaptation on color perception. Journal of the Optical Society of America 1950; 40: 362.
201. Jameson D, Hurvich LM, Varner FD. Receptoral and postreceptoral visual processes in recovery from chromatic adaptation. Proceedings of the National Academy of Sciences of the United States of America 1979; 76: 3034–3038.
202. Tregillus K, Webster MA. Dynamics of color contrast adaptation. Journal of the Optical Society of America A 2014; 31: A314.
203. Delahunt PB, Webster MA, Ma L, Werner JS. A long-term chromatic adaptation mechanism. Journal of Vision 2002; 2: 31.
204. Belmore SC, Shevell SK. Very-long-term and short-term chromatic adaptation: Are their influences cumulative? Vision Research 2011; 51: 362–366.
205. Webster MA, Mizokami Y, Webster SM. Seasonal variations in the color statistics of natural images. Network: Computation in Neural Systems 2007; 18: 213–233.
206. Cockram AH, Collins JB. A study of user preferences for fluorescent lamp colours for daytime and night-time lighting. Lighting Research and Technology 1970; 2: 249–256.
207. Belmore S, Shevell S. Very-long-term chromatic adaptation and short-term chromatic adaptation: Are their influences cumulative? Journal of Vision 2010; 10: 392–392.
208. Belmore SC, Shevell SK. Very-long-term chromatic adaptation: Test of gain theory and a new method. Visual Neuroscience. 2008; 25: 411–414.
209. Kohn A. Visual adaptation: Physiology, mechanisms, and functional benefits. Journal of Neurophysiology 2007; 97: 3155–3164.
210. Webster MA, Mollon JD. The influence of contrast adaptation on color appearance. Vision Research 1994; 34: 1993–2020.
211. Webster MA, Mollon JD. Adaptation and the color statistics of natural images. Vision Research 1997; 37: 3283–3298.
212. Webster MA, Malkoc G, Bilson AC, Webster SM. Color contrast and contextual influences on color appearance. Journal of Vision 2002; 2: 505–519.
213. Webster MA, Mollon JD. Colour constancy influence by contrast adaptation. Nature 1995; 373: 694–698.
214. Kwon MY, Legge GE, Fang F, Cheong AMY, He S. Adaptive changes in visual cortex following prolonged contrast reduction. Journal of Vision 2009; 9: 1–16.
215. Sueeprasan S, Luo R. Incomplete chromatic adaptation under mixed illuminations. In: 9th IS&T/SID Color Imaging Conference. Scottsdale, Arizona: Society for Imaging Science and Technology, 2001, pp. 316–320.
216. Commission Internationale de l’Eclairage. Chromatic Adaptation Under Mixed Illumination Condition When Comparing Softcopy and Hardcopy Images. CIE 162:2010. Vienna, Austria: Commission Internationale de l’Eclairage, 2004.
p. 39
217. Lane DM. The assumption of sphericity in repeated-measures designs: What it means and what to do when it is violated. The Quantitative Methods for Psychology 2016; 12: 114–122.
218. Mauchly JW. Significance test for sphericity of a normal n-variate distribution. The Annals of Mathematical Statistics 1940; 11: 204–209.
219. Uttley J. Power analysis, sample size, and assessment of statistical assumptions—Improving the evidential value of lighting research. Leukos 2019; 15: 143–162.
220. Knoop M, Broszio K, Diakite A, Liedtke C, Niedling M, Rothert I, et al. Methods to describe and measure lighting conditions in experiments on non-image-forming aspects. Leukos 2019; 15: 163–179.
221. Spitschan M, Stefani O, Blattner P, Gronfier C, Lockley S, Lucas R. How to report light exposure in human chronobiology and sleep research experiments. Clocks and Sleep 2019; 1: 280–289.
222. Stevens SS. On the theory of scales of measurement. Science 1946; 103: 677–680.
223. Jamieson S. Likert scales: How to (ab)use them. Medical Education 2004; 38: 1217–1218.
224. Kuzon WM, Urbanchek MG, McCabe S. The seven deadly sins of statistical analysis. Annals of Plastic Surgery 1996; 37: 265–272.
225. Knapp TR. Treating ordinal scales as interval scales: An attempt to resolve the controversy. Nursing Research 1990; 39: 121–123.
226. Salkind N. Nonparametric Statistics for the Behavioral Sciences. McGraw-hill New York, 2012.
227. Cohen L, Manion L, Morrison K. Research Methods in Education. 8th ed. London, UK: Routledge, 2017.
228. Miller DC, Salkind N. Handbook of Research Design and Social Measurement. 6th ed. Sage, 2002.
229. Norman G. Likert scales, levels of measurement and the ‘laws’ of statistics. Advances in Health Sciences Education 2010; 15: 625–632.
230. Anderson NH. Scales and statistics: Parametric and nonparametric. Psychological Bulletin 1961; 58: 305–316.
231. Carifio J, Perla RJ. Ten common misunderstandings, misconceptions, persistent myths and urban legends about Likert scales and Likert response formats and their antidotes. Journal of Social Sciences 2007; 3: 106–116.
232. Carifio J, Perla R. Resolving the 50-year debate around using and misusing Likert scales. Medical Education 2008; 42: 1150–1152.
233. Boone HN, Boone DA. Analyzing Likert data. Journal of Extension 2012; 50: 1–5.
234. Willits F, Theodori G, Luloff A. Another look at Likert scales. Journal of Rural Social Sciences 2016; 31: 6.
235. Desselle SP. Construction, implementation, and analysis of summated rating attitude scales. American Journal of Pharmaceutical Education 2005; 69: 97.
236. Armstrong GD. Methodology comer parametric statistics and ordinal data: A pervasive misconception. Nursing Research 1981; 30: 60–62.
237. Pell G, Jamieson S. Use and misuse of Likert scales. Medical Education 2005; 39: 970.
p. 40
238. Gaito J. Measurement scales and statistics: Resurgence of an old misconception. Psychological Bulletin 1980; 87: 564–567.
239. Brown TC, Peterson GL. An enquiry into the method of paired comparison: Reliability; scaling; and thurstone’s law of comparative judgment, http://www.fs.fed.us/rm/publications (2009, accessed 23 October 2020).
240. Brown A, Maydeu-Olivares A. Item response modeling of forced-choice questionnaires. Educational and Psychological Measurement 2011; 71: 460–502.
241. Thurstone LL. A law of comparative judgment. Psychological Review 1927; 34: 273–286.
242. Babyak MA. What you see may not be what you get: A brief, nontechnical introduction to overfitting in regression-type models. Psychosomatic Medicine 2004; 66: 411–421.
243. Hawkins DM. The problem of overfitting. Journal of Chemical Information and Computer Sciences 2004; 44: 1–12.
244. Mallows CL. Some comments on CP. Technometrics 1973; 15: 661.
245. Bertrand P V., Sakamoto Y, Ishiguro M, Kitagawa G. Akaike Information Criterion statistics. Journal of the Royal Statistical Society Series A, Statistics in Society 1988; 151: 567.
246. Steiger JH. Tests for comparing elements of a correlation matrix. Psychological Bulletin 1980; 87: 245–251.
247. Ouweltjes JL. The specification of colour rendering properties of fluorescent lamps. Die Farbe 1960; 4: 207–246.
248. Royer MP. Comparing measures of average color fidelity. Leukos 2018; 14: 69–85.
249. von Elm E, Altman DG, Egger M, Pocock SJ, Gøtzsche PC, Vandenbroucke JP. The Strengthening the Reporting of Observational Studies in Epidemiology (STROBE) Statement: Guidelines for reporting observational studies. Preventive Medicine 2007; 45: 247–251.