Embed Size (px)
Citation preview
City of Portland, Maine City Manager's
Recommended Budget
FY20 Budget July 1, 2019 - June 30, 2020
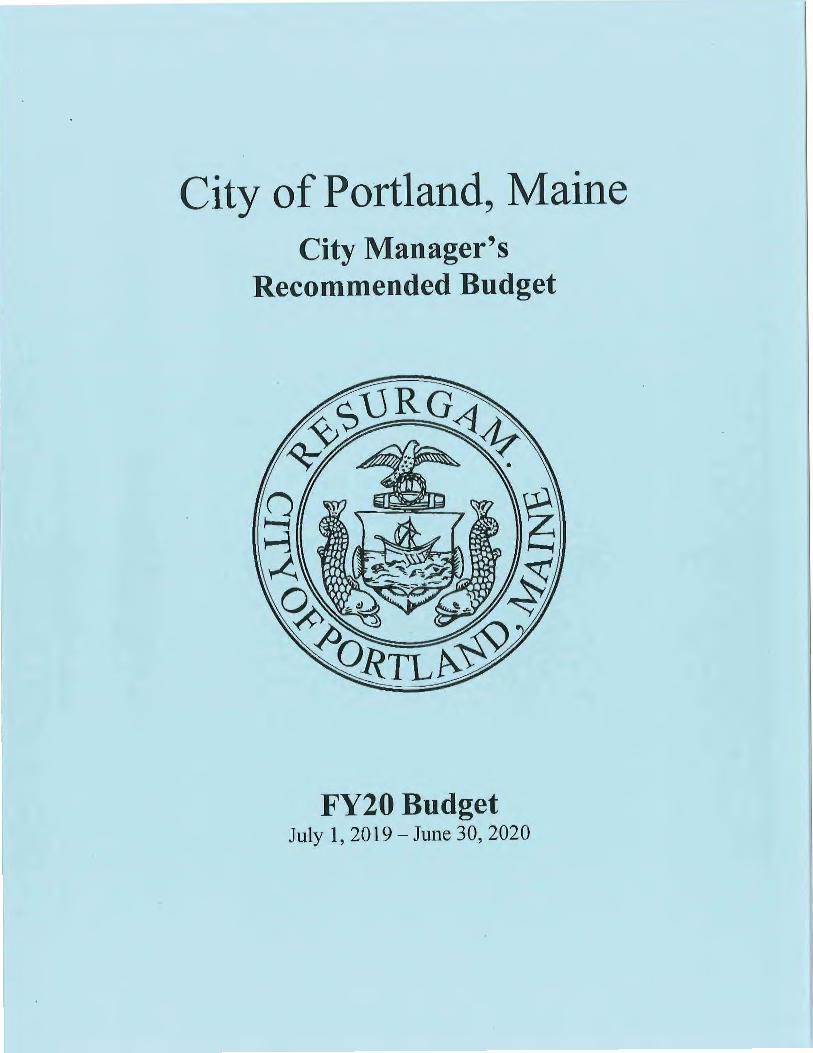
FY2020 BUDGET CITY MANAGER'S RECOMMENDATION
TABLE OF CONTENTS
LETTER OF TRANSM!TT AL
COMPARATIVE BUDGET PLAN (GENERAL FUND)
COMPARATIVE BUDGET PLAN (ENTERPRISE FUNDS)
TAX RATE COMPUTATION
NON-TAX REVENUE SUMMARY BY DEPARTMENT
EXPENDITURE SUMMARY BY CATEGORY
TAX LEVY BY BUDGET CATEGORY
STAFFING FTE CHANGE SUMMARY
APRIL BUDGET CALENDAR
MAY BUDGET CALENDAR
Page
8
12
13
14
15
16
17
18
19
CM: 04/08/19
April 8, 2019
CITY OF PORTLAND
Executive Department
Jon P. Jennings, City Manager
To Mayor Strimling and Members of the Po1tland City Council:
Pursuant to Article VI, Section 5( e) and Attic le VII, Sections 5 and 6 of the City of Portland Charter, I am hereby submitting the City Manager's Recommended $263.4 million FY20 Municipal Operating Budget.
As you know, my budget submission is typically shaped by guidance from Council goals along with my operational priorities. This year, however, because there were not final Council goals to guide us, and because we were facing a number of difficult operational decisions in order to remain fiscally responsible, you will see this budget submission is essentially status quo. We had many cost increases outside of our control which exceeded tbe regular rate of inflation/ the Consumer Price Index, but I felt strongly that our budget overall should align closely to those metrics, even if it meant making very tough budget decisions. Jf I had recommended everything requested by our City depmtments this budget would reflect an I 1.1% tax rate increase. However, I cut $7.4 million from depmtmental requests in order to come in with a budget with less than a three percent tax rate increase. Should there be any additional priorities the Council wants to address, I felt it most appropriate for those decisions to be made by the Council before being added to the final budget.
Over my nearly four years as City Manager, I continue to be extremely proud of all we've accomplished and the progress we've made in terms of making municipal government more innovative, efficient, inclusive, and transparent. We've made good progress in addressing critical infrastructure needs that had been neglected for too long and we continue to fund as many of these projects as we can. We've continued our focus on right-sizing municipal services and improving our processes not only because it is good customer service, but because I believe the efficiencies we achieve will afford us the oppmtunity to tackle our long-range plans.
There's no doubt that Portland continues to be a healthy, vibrant city with diverse sectors driving its economy. We are a major center for commerce, finance, arts and ente rtainment, food and drink, healthcare, Information Technology, the marine industry, post-secondary education, and tourism. Our world renowned and award-winning food and drink sector economy received another high honor this yea r when Bon Appetit magazine named Portland the 2018 Restaurant City of the Year. While this fumly roots our city on the national food map and was cause for celebration, we're working hard at the staff level to make sure Pmtland is known as more than just a foodie city. One example of this is when INRIX, a global leader in mobility analytics and connected car services, selected Portland to pilot its highly autonomous vehicle mapping program. I believe that Portland can benefit from leveraging our technology and start up scene to make us an attractive city for companies to pilot additional products and services. We look forward to collaborating fu1ther with Sta1t Up Maine this year as their annual conference will focus on the role civic t ech can play in our economy.
The growth our city has seen has been very beneficial in many ways, although it 's not without its challenges. While growth is a good problem for a city to have, it means our valuation has continued to rise, lowering our state revenue share and increasing our county tax.
FY19 Recap
Our Planning and Inspections Departments issued Certificates of Occupancy to approximately 317 additional units of new housing in calendar year 2018 and a total of more than 1,263 units in the last five years combined. Beyond this, more than 139 units of new housing across the city are currently in the development pipeline. At the same time, our inclusionary zoning ordinance has helped make that new development equitable, by requiring all projects larger than 10 units provide a set aside of 10% of the units for workforce housing or make a financial contribution to the Housing Trnst Fund. Since the ordinance went into effect, there have been five additional projects completed or under construction, adding an additional 18 workforce homes with many more in the pipeline.
During 2018, the Planning Board approved eight Inclusionary Zoning projects with a total of 29 workforce units ofrental, condo and single-family housing. The Housing Trust fund balance is cmTently $1,275,820.08, with $556,500 being collected to date. Additional funding is expected as current projects under development are completed.
Commercial development has continued at or above levels not experienced in the city in the last hundred years. In response, we've continued to update our land use regulations to help advance our economy sustainably. Highlights include:
• The Recode effmt to rewrite the Zoning Code is underway with the goal of simplifying and clarifying the City's regulations for all development. In addition, work has begun on rewriting both the sign regulations and the site plan ordinance. Concun-ently, the Technical Manual was recently updated to include specifications for LED street lights and improved exterior lighting for cost effective and efficient lighting.
• Po,tland's Impact Fee system was adopted in 2018, which assesses fees on all development based upon the anticipated infrastructure needs to serve new development. It applies to any new building or building addition that results in net new residential units, non-residential square footage, hotel rooms, or water meters.
• Another major policy initiative adopted this year is the Hotel IZ conditional use. The ordinance requires either the creation of affordable housing units or a contribution to the Housing Trust Fund for the development of new hotel rooms.
In suppmt of our small business community, the Pmtland Development Corporation invested approximately $1,082,000 in FYl8 in 19 businesses and economic development projects, which leveraged more than $5 million in private sector funds associated with creating 26 jobs and retaining 62 jobs. Fiscal year 2018 loan activity included a public to private investment ratio of 1:7. And just a few weeks ago we found out we are receiving the U.S. Conference of Mayor's 2019 Partner America Small Business Friendly Community Award. Pmtland has demonstrated its commitment and support of small business by creating a business friendly environment for businesses to grow and prosper.
Our transpmtation hub of air, rail, cruise, and shipping continues to be a vital economic driver, connecting Portland to the world. For the 2018 season, the Port of Portland had substantial growth again with 119 cruise ships and a passenger count that exceeded 170,000 and 68,000 crew. The Jetpmt, which once again won the customer experience award for Nmth America among airpmts with fewer than 2 million passengers, is the fastest growing airpo1t in New England with a record setting 2.1 million passengers coming through last year. On top of that, they added new direct service to Denver, Tampa, Ft. Myers and Raleigh-Durham and expanded routes to New York City, Chicago, and several destinations in Florida.
While there are many needs to balance with this growth, it is clear that Portland is an attractive place to live, work, and play.
2
We also continue to provide key health and human services for our people. The Office of Elder Affairs responded to approximately 750 requests from Portland senior citizens in need of services and information, and is working to implement multiple goals outlined in P01tland's Age-Friendly Community initiative, in pa1tnership with the AARP Maine. The office operates two adult day health programs at the Barron Center, licensed to accommodate 45 clients, and also provides transitional housing and supp01t services for older victims of domestic abuse through the Martha's Cottage Project, in collaboration with the Elder Abuse Institute of Maine.
The Social Services' Helping Individuals Regain Employment (HIRE) Program continues to help General Assistance recipients get out of poverty and into self sufficiency by removing barriers to employment. From January 2018 through December 2018, we completed 367 intakes helping 279 eligible adults secure employment, 13 individuals successfully obtain disability benefits, 231 individuals connect to ESL classes, 15 individuals enroll in vocational rehabilitation services, assisted 46 individuals secure employment authorization, and 27 individuals enroll in certificate training programs that led to job placements.
Our emergency shelter services continue to serve unprecedented levels on a nightly basis. In spite of this, our staff works extremely hard to find permanent housing solutions for our most vulnerable populations. The Oxford Street Shelter placed 249 total clients, 29 of whom were long-term stayers, into permanent housing. The 249 clients equaled a total of 43,729 bed nights. The Family Shelter served 183 families totaling 664 individuals. Of the 183 families, 160 secured permanent housing (87%) with only two families returning for a second stay.
As I alluded to earlier, we're focused on working to make our community an innovation hub, a place where data and technology are used to improve people's lives and make interactions with city government more efficient. As pmt of those effmts, we've converted all of our City's streetlights to LED technology and deployed intelligent traffic signals at Morrill's Corner to improve the flow of vehicles through the intersection thereby reducing traffic congestion and the length of time vehicles idle at the signals. Preliminmy rep01ts show a 23% reduction in travel times through this intersection. We're now in the process of installing this technology at additional intersections along Forest Avenue to further improve traffic flow, and we' II be installing it along Franklin and Commercial Streets. The more we are able to use this technology along our busiest transportation nodes, the more the signals speak to each other and improve traffic flow. We're also utilizing environmental sensors to monitor air quality through a pilot project with Google.
As we look to complete our implementation of Tyler Technologies' software this year, we'll be creating an internal data governance team so we can take a look at the data we have and collect to make sure we're using it strategically to inform our decision making processes. I believe these decisions will lead to greater efficiencies in our municipal operations, allowing us to achieve savings that we can reinvest toward our long-range goals. It's our goal to then share this data with the public through an open data portal so we can better tell Po1tland's story through the use of data.
BUDGET GOALS & REALITIES
The goal of this budget was to bring forward a recommendation that allows us to continue moving forward on the progress we've made, but in a fiscally responsible way. Our staff goals for FY20 revolve around efficiency and innovation so we can fmther improve city services while reducing costs, emphasizing customer service, and fulfilling our commitment to getting things done on a timely basis. We must continue to take care of our infrastructure needs that were set aside for too long. This year I asked Depa1tment Heads to present me with the requests they felt they needed to accomplish their jobs efficiently, but not necessarily to meet each and every goal they have given the budget constraints we face.
3
The reality of this budget is that the roughly $3 million increase in expenditures is driven by personnel costs, due to contractual obligations and cost of living increases.
All depaitments had to work extremely hard to meet the budget guidance I provided, which was to come in under a 3% tax rate increase. If I had simply recommended the budget as requested by our City Departments, without making difficult budget cuts and choices, the resulting impact would have been an 11.1 % City tax rate increase. As we developed the City budget, we eliminated approximately $7.4 million of those requests and other adjustments on the path to our 2.9% tax rate increase.
The most difficult budget reality we are facing this year is within our Social Services division. While Portland is a compassionate city, and we always will be, we simply cannot afford to continue providing all of the current services and believing this to be a sustainable path. I am asking the City Council to have a fundamental discussion about what services we can provide and what we can afford.
As you know, we dedicated $200,000 in last year's budget to fund the Community Support Fund, which provides temporary assistance for those who are seeking asylum, but are no longer covered by General Assistance. Unf01tunately, this fund was exhausted much earlier than anticipated in March 2019 given the influx in people seeking emergency shelter services.
Because the FY 19 Community Supp01t Fund was exhausted so quickly, I am proposing that the Community Suppmt Fund supp01t individuals who are living in the city as of July I, 2019 and only cover rental assistance in FY20. We will utilize our other existing community partners who already offer food and other basic necessities to cover those needs. Therefore, this budget recommends reducing the Community Suppmt Fund by $50,000 and funding it with $150,000. It is also my recommendation that the Council look to phase out the Community Suppo1t Fund over the next two fiscal years as individuals leave the program.
Additionally, because of the fact that there are limits to our resources, I propose eliminating the second overflow space for both the Oxford Street Shelter and the Family Shelter. This would mean that we will use space at Preble Street for overflow needs at OSS and space at the Salvation Army for overflow at the Family Shelter, but no longer allow our General Assistance offices to be used as a third overflow space given the costs in staffing this facility.
As we developed this budget, we had to make some very tough choices to keep P01tland affordable while at the same time trying to maintain the level of services we provide for our residents and businesses, and address a few items within our key priorities. While this budget overall includes a net increase of six positions, four of which are for Social Services, there were several positions that were eliminated as pait of departmental reorganizations.
As I said last year, I firmly believe we cannot focus on one pait of government to the detriment of another. I take my responsibilities to the Council and the taxpayers of the city very seriously. As we have discussed on many occasions, we are all concerned about the affordability of the city and government can be a driver of costs that make it unaffordable to live in Pmtland. That is why I felt it was impmtant for us to limit the tax impact due to the drivers outlined in the budget.
4
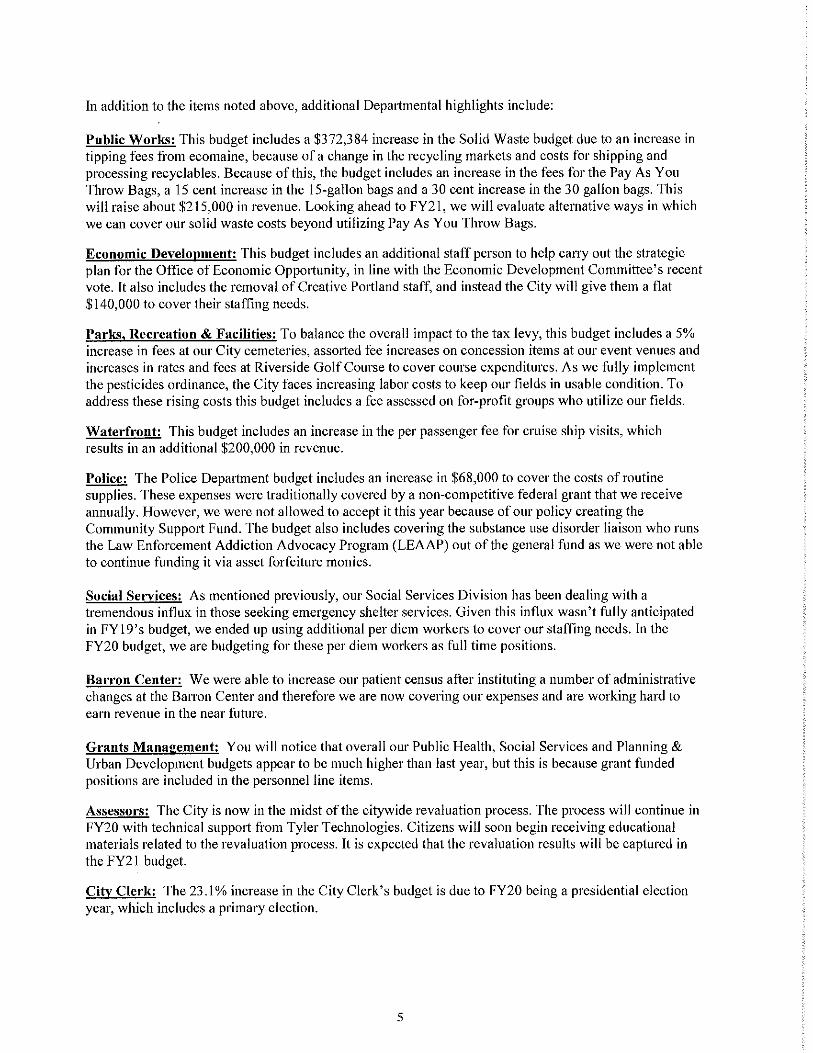
In addition to the items noted above, additional Depatimental highlights include:
Public Works: This budget includes a $372,384 increase in the Solid Waste budget due to an increase in tipping fees from ecomaine, because of a change in the recycling markets and costs for shipping and processing recyclables. Because of this, the budget includes an increase in the fees for the Pay As You Throw Bags, a 15 cent increase in the IS-gallon bags and a 30 cent increase in the 30 gallon bags. This will raise about $215,000 in revenue. Looking ahead to FY21, we will evaluate alternative ways in which we can cover our solid waste costs beyond utilizing Pay As You Throw Bags.
Economic Development: This budget includes an additional staff person to help carry out the strategic plan for the Office of Economic Oppotiunity, in line with the Economic Development Committee's recent vote. It also includes the removal of Creative Portland staff'. and instead the City will give them a flat $140,000 to cover their staffing needs.
Parks, Recreation & Facilities: To balance the overall impact to the tax levy, this budget includes a 5% increase in fees at our City cemeteries, assmted fee increases on concession items at our event venues and increases in rates and fees at Riverside Golf Course to cover course expenditures. As we fully implement the pesticides ordinance, the City faces increasing labor costs to keep our fields in usable condition. To address these rising costs this budget includes a fee assessed on for-profit groups who utilize our fields.
Waterfront: This budget includes an increase in the per passenger fee for cruise ship visits, which results in an additional $200,000 in revenue.
Police: The Police Depattment budget includes an increase in $68,000 to cover the costs of routine supplies. These expenses were traditionally covered by a non-competitive federal grant that we receive annually. However, we were not allowed to accept it this year because of our policy creating the Community Support Fund. The budget also includes covering the substance use disorder liaison who runs the Law Enforcement Addiction Advocacy Program (LEAAP) out of the general fund as we were not able to continue funding it via asset forfeiture monies.
Social Services: As mentioned previously, our Social Services Division has been dealing with a tremendous influx in those seeking emergency shelter services. Given this influx wasn't fully anticipated in FY19's budget, we ended up using additional per diem workers to cover our staffing needs. In the FY20 budget, we are budgeting for these per diem workers as full time positions.
Barron Center: We were able to increase our patient census after instituting a number of administrative changes at the Barron Center and therefore we are now covering our expenses and are working hard to earn revenue in the near future.
Grants Management: You will notice that overall our Public Health, Social Services and Planning & Urban Development budgets appear to be much higher than last year, but this is because grant funded positions are included in the personnel line items.
Assessors: The City is now in the midst of the citywide revaluation process. The process will continue in FY20 with technical suppott from Tyler Technologies. Citizens will soon begin receiving educational materials related to the revaluation process. It is expected that the revaluation results will be captured in the FY2 I budget.
City Clerk: The 23. I% increase in the City Clerk's budget is due to FY20 being a presidential election year, which includes a primary election.
5
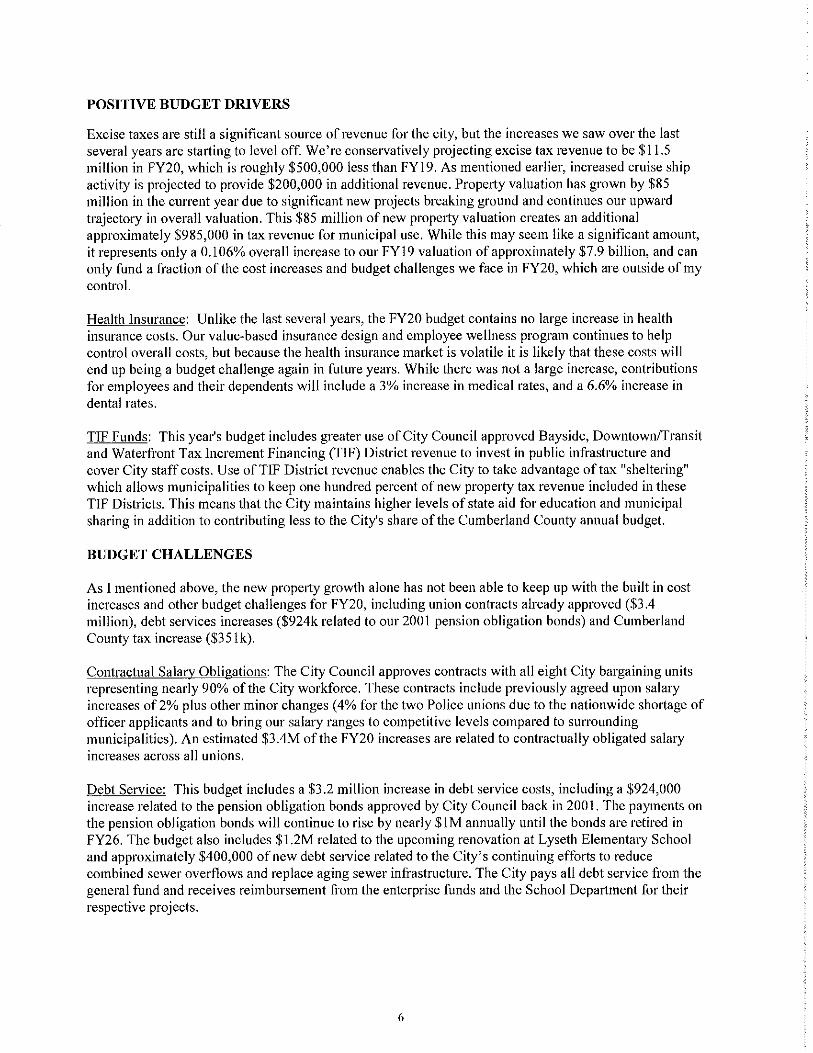
POSITIVE BUDGET DRIVERS
Excise taxes are still a significant source of revenue for the city, but the increases we saw over the last several years are sta1ting to level off. We're conservatively projecting excise tax revenue to be $11.5 million in FY20, which is roughly $500,000 less than FY19. As mentioned earlier, increased cruise ship activity is projected to provide $200,000 in additional revenue. Propetty valuation has grown by $85 million in the current year due to significant new projects breaking ground and continues our upward trajectory in overall valuation. This $85 million of new prope1ty valuation creates an additional approximately $985,000 in tax revenue for municipal use. While this may seem like a significant amount, it represents only a 0.106% overall increase to our FYI 9 valuation of approximately $7.9 billion, and can only fund a fraction of the cost increases and budget challenges we face in FY20, which are outside of my control.
Health Insurance: Unlike the last several years, the FY20 budget contains no large increase in health insurance costs. Our value-based insurance design and employee wellness program continues to help control overall costs, but because the health insurance market is volatile it is likely that these costs will end up being a budget challenge again in future years. While there was not a large increase, contributions for employees and their dependents will include a 3% increase in medical rates, and a 6.6% increase in dental rates.
TIF Funds: This year's budget includes greater use of City Council approved Bayside, Downtown/Transit and Waterfront Tax Increment Financing (TIF) District revenue to invest in public infrastructure and cover City staff costs. Use ofTIF District revenue enables the City to take advantage of tax "sheltering" which allows municipalities to keep one hundred percent of new property tax revenue included in these TIF Districts. This means that the City maintains higher levels of state aid for education and municipal sharing in addition to contributing less to the City's share of the Cumberland County annual budget.
BUDGET CHALLENGES
As I mentioned above, the new prope1ty growth alone has not been able to keep up with the built in cost increases and other budget challenges for FY20, including union contracts already approved ($3.4 million), debt services increases ($924k related to our 2001 pension obligation bonds) and Cumberland County tax increase ($35 lk).
Contractual Salary Obligations: The City Council approves contracts with all eight City bargaining units representing nearly 90% of the City workforce. These contracts include previously agreed upon salary increases of 2% plus other minor changes ( 4% for the two Police unions due to the nationwide shortage of officer applicants and to bring our salmy ranges to competitive levels compared to surrounding municipalities). An estimated $3.4M of the FY20 increases are related to contractually obligated salary increases across al1 unions.
Debt Service: This budget includes a $3 .2 million increase in debt service costs, including a $924,000 increase related to the pension obligation bonds approved by City Council back in 2001. The payments on the pension obligation bonds will continue to rise by nearly $1 M annually until the bonds are retired in FY26. The budget also includes $1.2M related to the upcoming renovation at Lyseth Elementary School and approximately $400,000 ofnew debt service related to the City's continuing efforts to reduce combined sewer overflows and replace aging sewer infrastructure. The City pays all debt service from the general fund and receives reimbursement from the enterprise funds and the School Department for their respective projects.
6
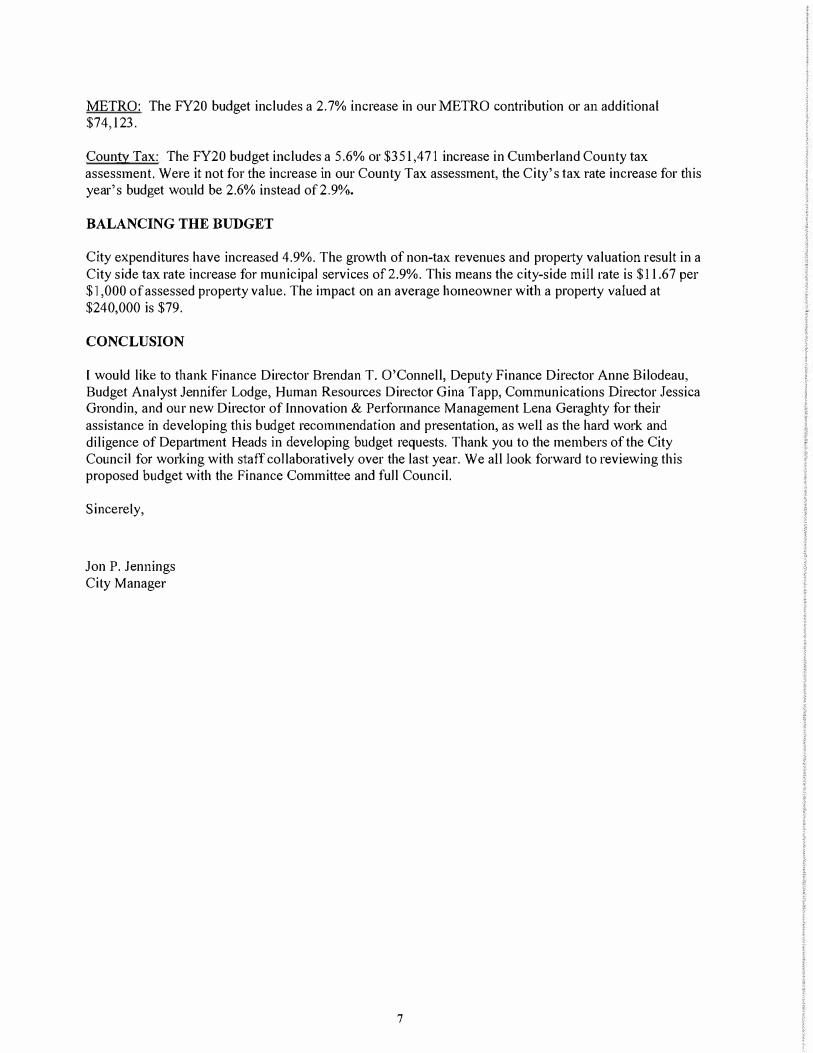
METRO: The FY20 budget includes a 2. 7% increase in our METRO contribution or an additional $74,123.
County Tax: The FY20 budget includes a 5.6% or $351,471 increase in Cumberland County tax assessment. Were it not for the increase in our County Tax assessment, the City's tax rate increase for this year's budget would be 2.6% instead of2.9%.
BALANCING THE BUDGET
City expenditures have increased 4.9%. The growth of non-tax revenues and prope1ty valuation result in a City side tax rate increase for municipal services of2.9%. This means the city-side mill rate is $11.67 per $1,000 of assessed property value. The impact on an average homeowner with a prope1ty valued at $240,000 is $79.
CONCLUSION
I would like to thank Finance Director Brendan T. O'Connell, Deputy Finance Director Anne Bilodeau, Budget Analyst Jennifer Lodge, Human Resources Director Gina Tapp, Communications Director Jessica Grondin, and our new Director of Innovation & Performance Management Lena Geraghty for their assistance in developing this budget recommendation and presentation, as well as the hard work and diligence of Depaitment Heads in developing budget requests. Thank you to the members of the City Council for working with staff collaboratively over the last year. We all look forward to reviewing this proposed budget with the Finance Committee and full Council.
Sincerely,
Jon P. Jennings City Manager
7
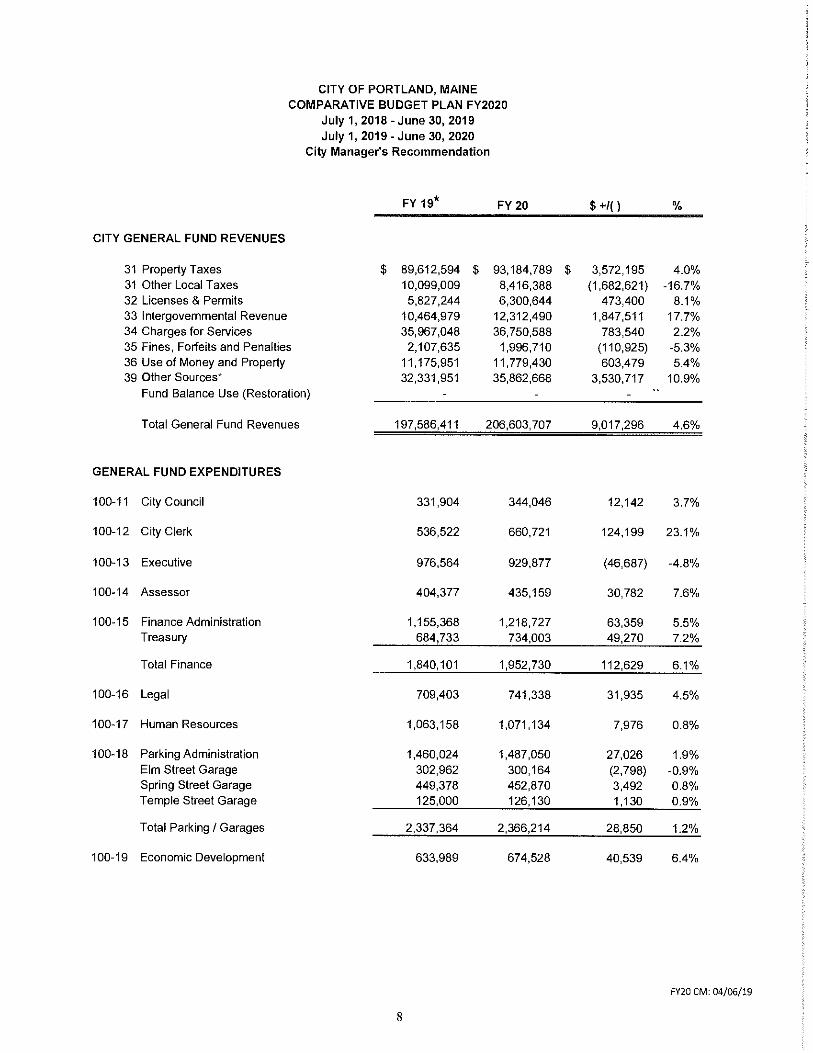
CITY OF PORTLAND, MAINE COMPARATIVE BUDGET PLAN FY2020
July 1, 2018-June 30, 2019 July 1, 2019 -June 30, 2020
City Manager's Recommendation
FY 19* FY 20 $ +/() %
CITY GENERAL FUND REVENUES
31 Property Taxes $ 89,612,594 $ 93,184,789 $ 3,572,195 4.0% 31 Other Local Taxes 10,099,009 8,416,388 (1,682,621) -16.7% 32 Licenses & Permits 5,827,244 6,300,644 473,400 8.1% 33 Intergovernmental Revenue 10,464,979 12,312,490 1,847,511 17.7% 34 Charges for Services 35,967,048 36,750,588 783,540 2.2% 35 Fines, Forfeits and Penalties 2,107,635 1,996,710 (110,925) -5.3% 36 Use of Money and Property 11,175,951 11,779,430 603,479 5.4% 39 other Sources' 32,331,951 35,862,668 3,530,717 10.9%
Fund Balance Use (Restoration)
Total General Fund Revenues 197,586,411 206,603,707 9,017,296 4.6%
GENERAL FUND EXPENDITURES
100-11 City Council 331,904 344,046 12,142 3.7%
100-12 City Clerk 536,522 660,721 124,199 23.1%
100-13 Executive 976,564 929,877 (46,687) ~4.8%
100-14 Assessor 404,377 435,159 30,782 7.6%
100-15 Finance Administration 1,155,368 1,218,727 63,359 5.5% Treasury 684,733 734,003 49,270 7.2%
Total Finance 1,840,101 1,952,730 112,629 6.1%
100-16 Legal 709,403 741,338 31,935 4.5%
100-17 Human Resources 1,063,158 1,071,134 7,976 0.8%
100-18 Parking Administration 1,460,024 1,487,050 27,026 1.9% Elm Street Garage 302,962 300,164 (2,798) ~0.9% Spring Street Garage 449,378 452,870 3,492 0.8% Temple Street Garage 125,000 126,130 1,130 0.9%
Total Parking / Garages 2,337,364 2,366,214 28,850 1.2%
100-19 Economic Development 633,989 674,528 40,539 6.4%
FY20 CM: 04/06/19
8
CITY OF PORTLAND, MAINE COMPARATIVE BUDGET PLAN FY2020
July 1, 2018 - June 30, 2019 July 1, 2019 - June 30, 2020
City Manager's Recommendation
FY 19* FY 20 $ +/() %
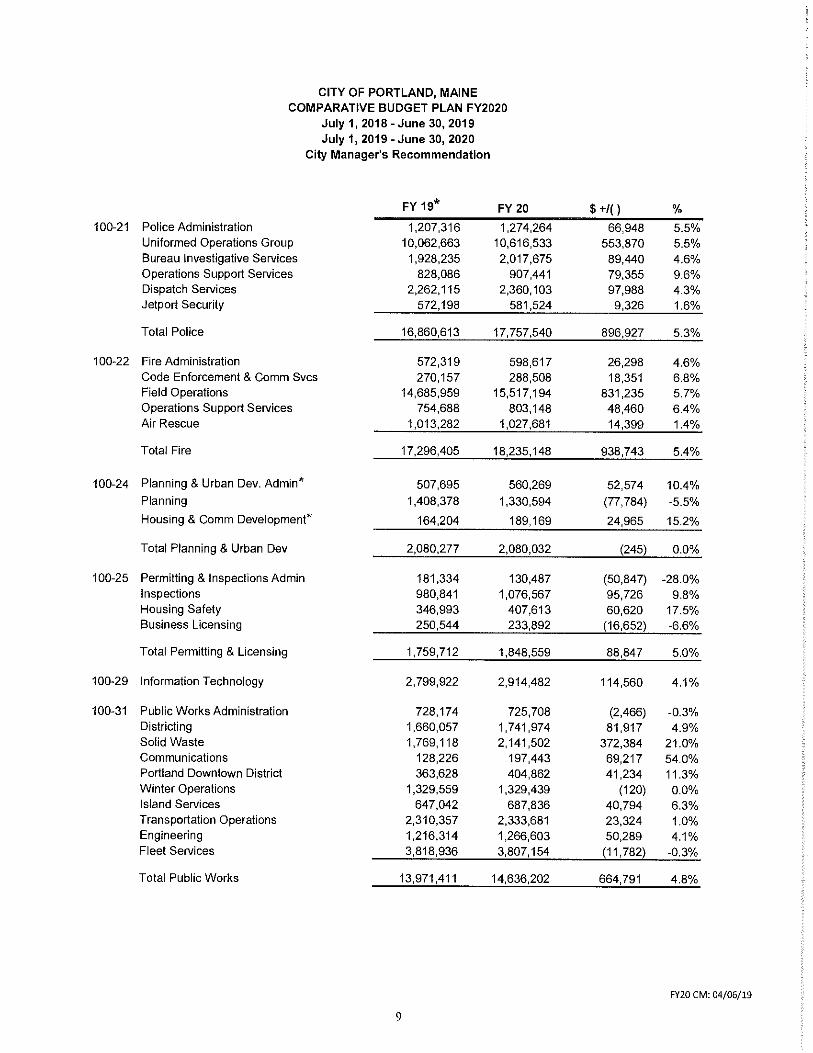
100-21 Police Administration 1,207,316 1,274,264 66,948 5.5% Uniformed Operations Group 10,062,663 10,616,533 553,870 5.5% Bureau Investigative Services 1,928,235 2,017,675 89,440 4.6% Operations Support Services 828,086 907,441 79,355 9.6% Dispatch Services 2,262,115 2,360,103 97,988 4.3% Jetport Security 572,198 581,524 9,326 1.6%
Total Police 16,860,613 17,757,540 896,927 5.3%
100-22 Fire Administration 572,319 598,617 26,298 4.6% Code Enforcement & Comm Svcs 270,157 288,508 18,351 6.8% Field Operations 14,685,959 15,517,194 831,235 5.7% Operations Support Services 754,688 803,148 48,460 6.4% Air Rescue 1,013,282 1,027,681 14,399 1.4%
Total Fire 17,296,405 18,235,148 938,743 5.4%
100-24 Planning & Urban Dev. Admin* 507,695 560,269 52,574 10.4% Planning 1,408,378 1,330,594 (77,784) -5.5%
Housing & Comm Development* 164,204 189,169 24,965 15.2%
Total Planning & Urban Dev 2,080,277 2,080,032 (245) 0.0%
100-25 Permitting & Inspections Admin 181,334 130,487 (50,847) -28.0% Inspections 980,841 1,076,567 95,726 9.8% Housing Safety 346,993 407,613 60,620 17.5% Business Licensing 250,544 233,892 (16,652) -6.6%
Total Permitting & Licensing 1,759,712 1,848,559 88,847 5.0%
100-29 Information Technology 2,799,922 2,914,482 114,560 4.1%
100-31 Public Works Administration 728,174 725,708 (2,466) ~0.3% Districting 1,660,057 1,741,974 81,917 4.9% Solid Waste 1,769,118 2,141,502 372,384 21.0% Communications 128,226 197,443 69,217 54.0% Portland Downtown District 363,628 404,862 41,234 11.3% Winter Operations 1,329,559 1,329,439 (120) 0.0% Island Services 647,042 687,836 40,794 6.3% Transportation Operations 2,310,357 2,333,681 23,324 1.0% Engineering 1,216,314 1,266,603 50,289 4.1% Fleet Services 3,818,936 3,807,154 (11,782) -0.3%
Total Public Works 13,971,411 14,636,202 664,791 4.8%
FY20 CM: 04/06/19
9
CITY OF PORTLAND, MAINE COMPARATIVE BUDGET PLAN FY2020
July 1, 2018 -June 30, 2019 July 1, 2019 -June 30, 2020
City Manager's Recommendation
FY 19* FY 20 $ +/() %
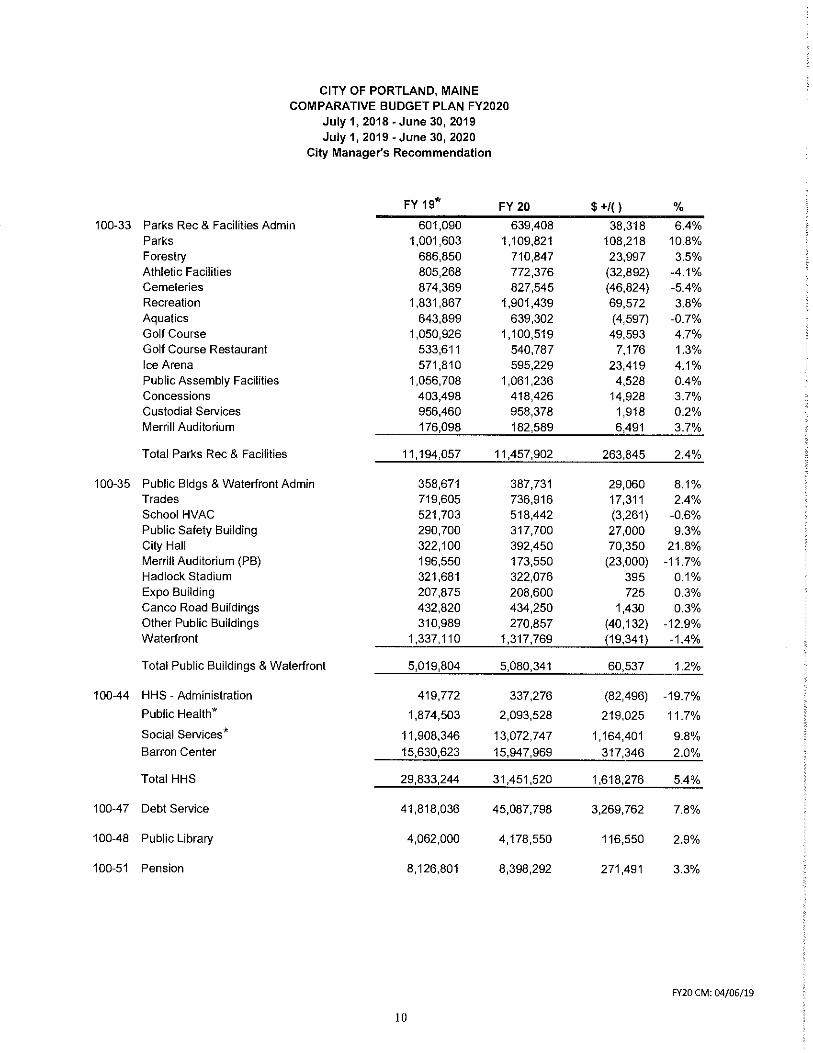
100-33 Parks Rec & Facilities Admin 601,090 639,408 38,318 6.4% Parks 1,001,603 1,109,821 108,218 10.8% Forestry 686,850 710,847 23,997 3.5% Athletic Facilities 805,268 772,376 (32,892) -4.1% Cemeteries 874,369 827,545 (46,824) -5.4% Recreation 1,831,867 1,901,439 69,572 3.8% Aquatics 643,899 639,302 (4,597) -0.7% Golf Course 1,050,926 1,100,519 49,593 4.7% Golf Course Restaurant 533,611 540,787 7,176 1.3% Ice Arena 571,810 595,229 23,419 4.1% Public Assembly Facilities 1,056,708 1,061,236 4,528 0.4% Concessions 403,498 418,426 14,928 3.7% Custodial Services 956,460 958,378 1,918 0.2% Merrill Auditorium 176,098 182,589 6,491 3.7%
Total Parks Rec & Facilities 11,194,057 11,457,902 263,845 2.4%
100-35 Public Bldgs & Waterfront Admin 358,671 387,731 29,060 8.1% Trades 719,605 736,916 17,311 2.4% School HVAC 521,703 518,442 (3,261) -0.6% Public Safety Building 290,700 317,700 27,000 9.3% City Hall 322,100 392,450 70,350 21.8% Merrill Auditorium (PB) 196,550 173,550 (23,000) -11.7% Hadlock Stadium 321,681 322,076 395 0.1% Expo Building 207,875 208,600 725 0.3% Canco Road Buildings 432,820 434,250 1,430 0.3% Other Public Buildings 310,989 270,857 (40,132) -12.9% Waterfront 1,337,110 1,317,769 (19,341) -1.4%
Total Public Buildings & Waterfront 5,019,804 5,080,341 60,537 1.2%
100-44 HHS - Administration 419,772 337,276 (82,496) -19.7%
Public Health* 1,874,503 2,093,528 219,025 11.7%
Social Services* 11,908,346 13,072,747 1,164,401 9.8% Barron Center 15,630,623 15,947,969 317,346 2.0%
Total HHS 29,833,244 31,451,520 1,618,276 5.4%
100-47 Debt Service 41,818,036 45,087,798 3,269,762 7.8%
100-48 Public Library 4,062,000 4,178,550 116,550 2.9%
100-51 Pension 8,126,801 8,398,292 271,491 3.3%
FY20 CM: 04/06/19
10
100-52
100-61
100-62
100-65
100-67
100-63
100-65
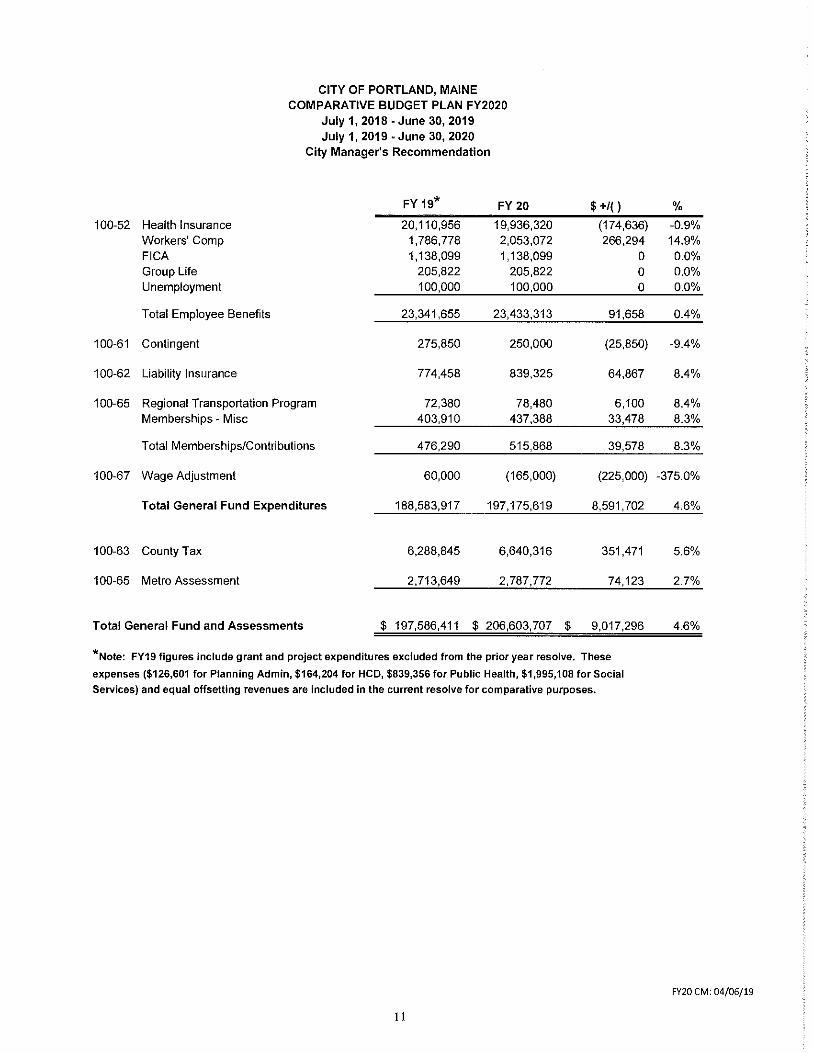
Health Insurance Workers' Comp FICA Group Life Unemployment
Total Employee Benefits
Contingent
Liability Insurance
CITY OF PORTLAND, MAINE COMPARATIVE BUDGET PLAN FY2020
July 1, 2018 - June 30, 2019 July 1, 2019 - June 30, 2020
City Manager's Recommendation
FY 19* FY 20
20,110,956 19,936,320 1,786,778 2,053,072 1,138,099 1,138,099
205,822 205,822 100,000 100,000
23,341,655 23,433,313
275,850 250,000
774,458 839,325
Regional Transportation Program 72,380 78,480 Memberships - Misc 403,910 437,388
Total Memberships/Contributions 476,290 515,868
Wage Adjustment 60,000 (165,000)
Total General Fund Expenditures 188,583,917 197,175,619
County Tax 6,288,845 6,640,316
Metro Assessment 2,713,649 2,787,772
Total General Fund and Assessments $ 197,586,411 $ 206,603,707
$ +/()
(174,636) 266,294
0 0 0
91,658
(25,850)
64,867
6,100 33,478
39,578
(225,000)
8,591,702
351,471
74,123
$ 9,017,296
*Note: FY19 figures include grant and project expenditures excluded from the prior year resolve. These
expenses ($126,601 for Planning Admin, $164,204 for HCD, $839,356 for Public Health, $1,995,108 for Social
Services) and equal offsetting revenues are included in the current resolve for comparative purposes.
11
%
-0.9% 14.9%
0.0% 0.0% 0.0%
0.4%
-9.4%
8.4%
8.4% 8.3%
8.3%
-375.0%
4.6%
5.6%
2.7%
4.6%
FY20 CM: 04/06/19
CITY OF PORTLAND, MAINE COMPARATIVE BUDGET PLAN FY2020
July 1, 2018 - June 30, 2019 July 1, 2019 - June 30, 2020
City Manager's Recommendation
FY 19* FY 20 $ +/() %
ENTERPRISE FUND REVENUES
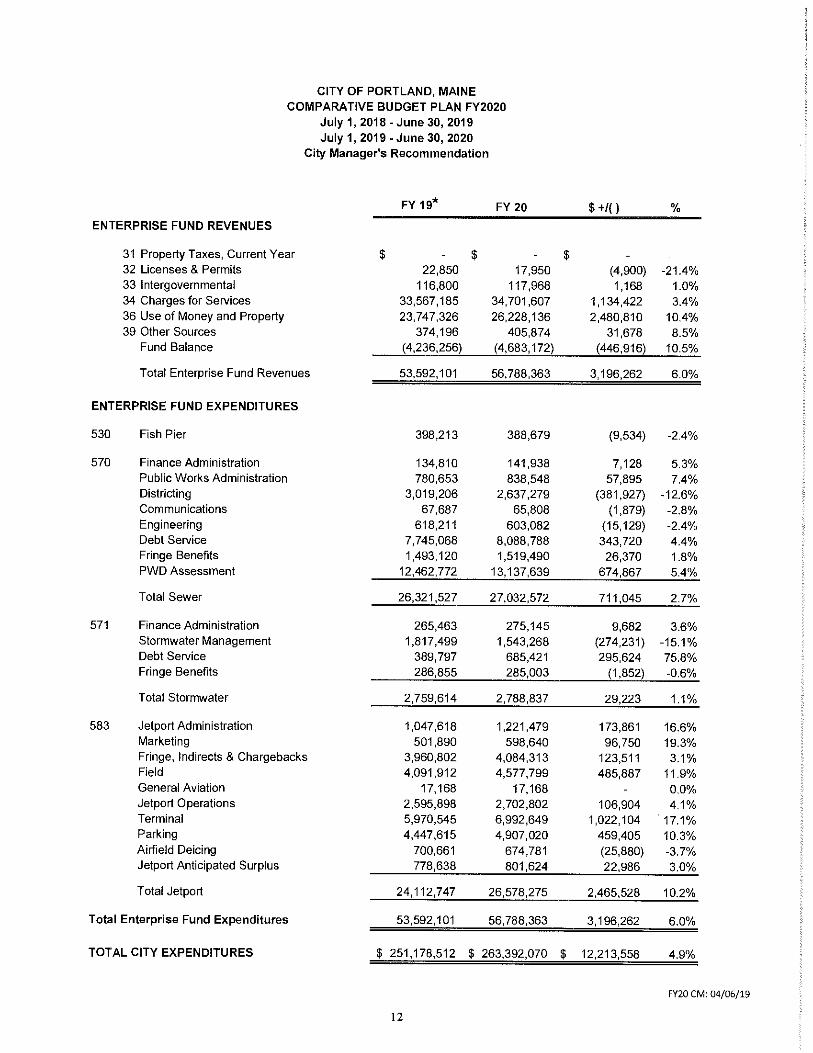
31 Property Taxes, Current Year $ $ $ 32 Licenses & Permits 22,850 17,950 (4,900) -21.4% 33 Intergovernmental 116,800 117,968 1,168 1.0% 34 Charges for Services 33,567,185 34,701,607 1,134,422 3.4% 36 Use of Money and Property 23,747,326 26,228,136 2,480,810 10.4% 39 Other Sources 374,196 405,874 31,678 8.5%
Fund Balance (4,236,256) (4,683,172) (446,916) 10.5%
Total Enterprise Fund Revenues 53,592,101 56,788,363 3,196,262 6.0%
ENTERPRISE FUND EXPENDITURES
530 Fish Pier 398,213 388,679 (9,534) -2.4%
570 Finance Administration 134,810 141,938 7,128 5.3% Public Works Administration 780,653 838,548 57,895 7.4% Districting 3,019,206 2,637,279 (381,927) -12.6% Communications 67,687 65,808 (1,879) -2.8% Engineering 618,211 603,082 (15,129) ~2.4% Debt Service 7,745,068 8,088,788 343,720 4.4% Fringe Benefits 1,493,120 1,519,490 26,370 1.8% PWD Assessment 12,462,772 13,137,639 674,867 5.4%
Total Sewer 26,321,527 27,032,572 711,045 2.7%
571 Finance Administration 265,463 275,145 9,682 3.6% Stormwater Management 1,817,499 1,543,268 (274,231) -15.1 % Debt Service 389,797 685,421 295,624 75.8% Fringe Benefits 286,855 285,003 (1,852) -0.6%
Total Stormwater 2,759,614 2,788,837 29,223 1.1%
583 Jetport Administration 1,047,618 1,221,479 173,861 16.6% Marketing 501,890 598,640 96,750 19.3% Fringe, Indirects & Chargebacks 3,960,802 4,084,313 123,511 3.1% Field 4,091,912 4,577,799 485,887 11.9% General Aviation 17,168 17,168 0.0% Jetport Operations 2,595,898 2,702,802 106,904 4.1% Terminal 5,970,545 6,992,649 1,022,104 17.1% Parking 4,447,615 4,907,020 459,405 10.3% Airfield Deicing 700,661 674,781 (25,880) ~3.7% Jetport Anticipated Surplus 778,638 801,624 22,986 3.0%
Total Jetport 24,112,747 26,578,275 2,465,528 10.2%
Total Enterprise Fund Expenditures 53,592,101 56,788,363 3,196,262 6.0%
TOTAL CITY EXPENDITURES $ 251,178,512 $ 263,392,070 $ 12,213,558 4.9%
FY20 CM: 04/06/19
12
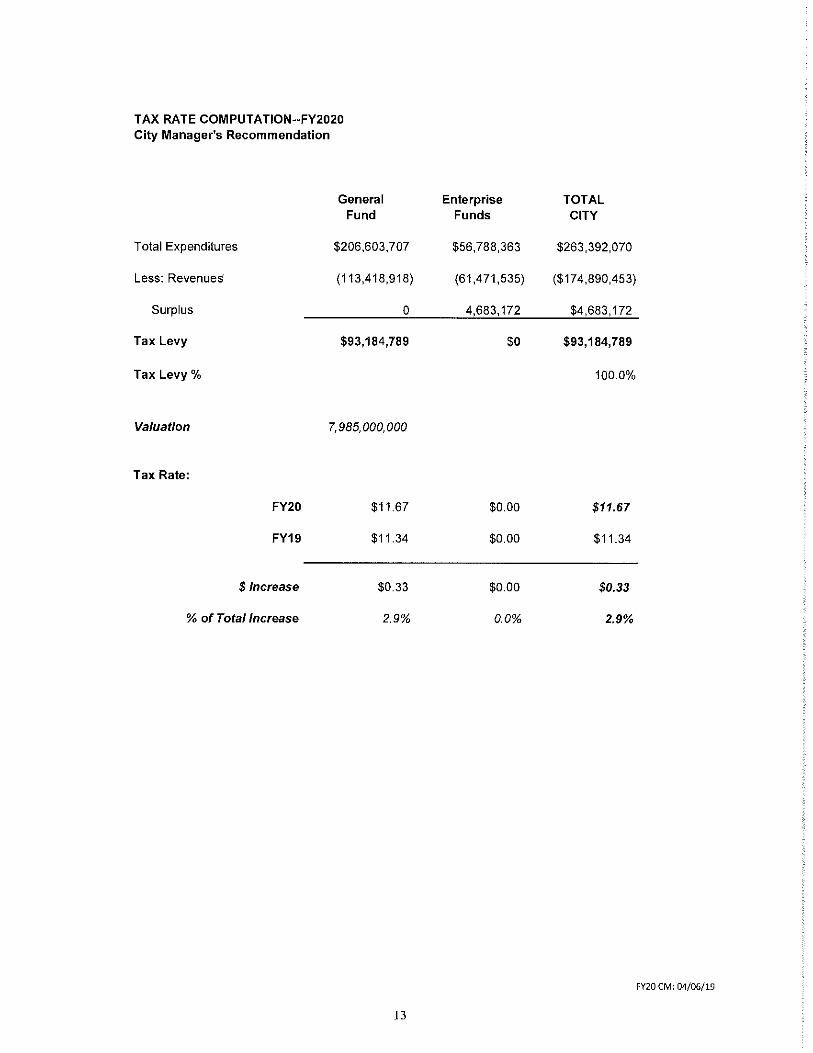
TAX RATE COMPUTATION--FY2020 City Manager's Recommendation
General Fund
Total Expenditures $206,603,707
Less: Revenues (113,418,918)
Surplus 0
Tax Levy $93,184,789
Tax Levy¾
Valuation 7,985,000,000
Tax Rate:
FY20 $11.67
FY19 $11.34
$ Increase $0.33
% of Total Increase 2.9%
13
Enterprise TOTAL Funds CITY
$56,788,363 $263,392,070
(61,471,535) ($174,890,453)
4,683,172 $4,683,172
$0 $93,184,789
100.0%
$0.00 $11.67
$0.00 $11.34
$0.00 $0.33
0.0% 2.9%
FY20 CM: 04/06/19
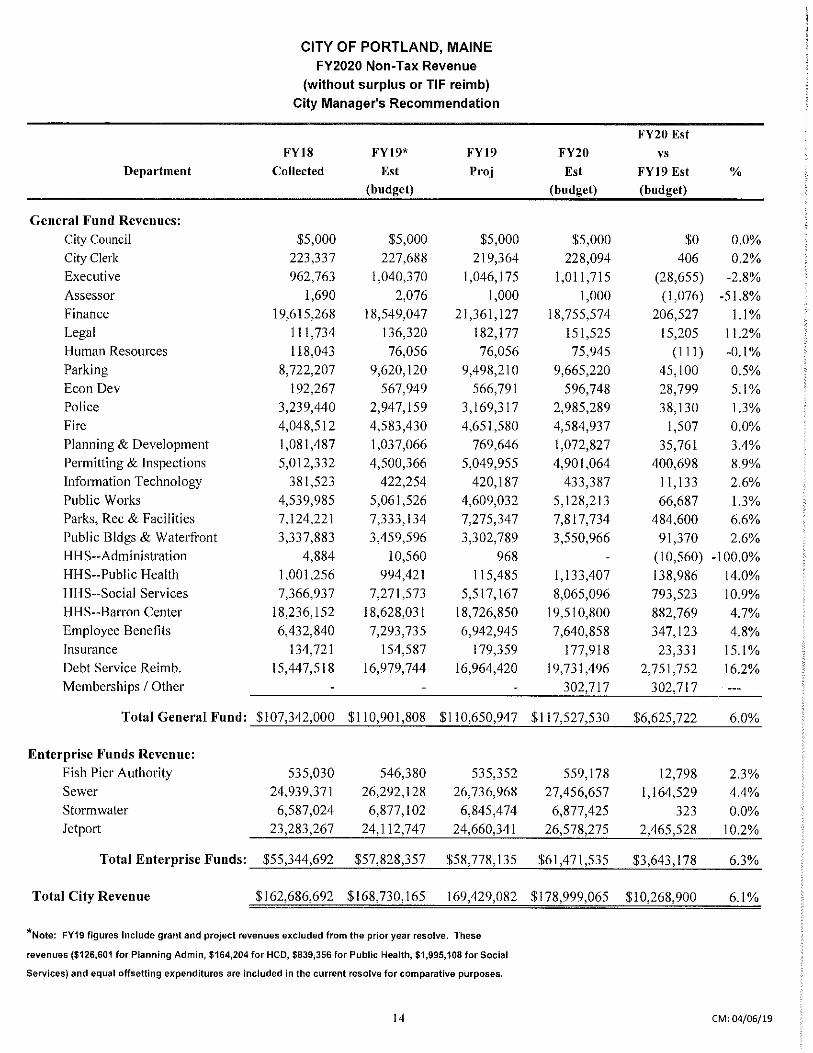
CITY OF PORTLAND, MAINE FY2020 Non-Tax Revenue
(without surplus or TIF reimb) City Manager's Recommendation
FY20 Est FYl8 FY19* FY19 FY20 vs
Department Collected Est Proj Est FYl9 Est % (budget) (budget) (budget)
General Fund Revenues: City Council $5,000 $5,000 $5,000 $5,000 $0 0.0% City Clerk 223,337 227,688 219,364 228,094 406 0.2% Executive 962,763 1,040,370 1,046,175 1,011,715 (28,655) -2.8% Assessor 1,690 2,076 1,000 1,000 (1,076) -51.8% Finance 19,615,268 18,549,047 21,361,127 18,755,574 206,527 1.1% Legal 111,734 136,320 182,177 151,525 15,205 11.2% Human Resources 118,043 76,056 76,056 75,945 ( 111) -0.1% Parking 8,722,207 9,620,120 9,498,210 9,665,220 45,100 0.5% Econ Dev 192,267 567,949 566,791 596,748 28,799 5.1% Police 3,239,440 2,947,159 3,169,317 2,985,289 38,130 1.3% Fire 4,048,512 4,583,430 4,651,580 4,584,937 1,507 0.0% Planning & Development 1,081,487 1,037,066 769,646 1,072,827 35,761 3.4% Permitting & Inspections 5,012,332 4,500,366 5,049,955 4,901,064 400,698 8.9% Information Technology 381,523 422,254 420,187 433,387 11,133 2.6% Public Works 4,539,985 5,061,526 4,609,032 5,128,213 66,687 1.3% Parks, Rec & Facilities 7,124,221 7,333,134 7,275,347 7,817,734 484,600 6.6% Public Bldgs & Waterfront 3,337,883 3,459,596 3,302,789 3,550,966 91,370 2.6% HHS--Administration 4,884 10,560 968 (10,560) -100.0% HHS--Public Health 1,001,256 994,421 115,485 1,133,407 138,986 14.0% HHS--Social Services 7,366,937 7,271,573 5,517,167 8,065,096 793,523 10.9% HHS--Barron Center 18,236,152 18,628,031 18,726,850 19,510,800 882,769 4.7% Employee Benefits 6,432,840 7,293,735 6,942,945 7,640,858 347,123 4.8% Insurance 134,721 154,587 179,359 177,918 23,331 15.1% Debt Service Reimb. 15,447,518 16,979,744 16,964,420 19,731,496 2,751,752 16.2% Memberships I Other 302,717 302,717
Total General Fund: $107,342,000 $110,901,808 $110,650,947 $117,527,530 $6,625,722 6.0%
Enterprise Funds Revenue: Fish Pier Authority 535,030 546,380 535,352 559,178 12,798 2.3% Sewer 24,939,371 26,292,128 26,736,968 27,456,657 1,164,529 4.4% Storm water 6,587,024 6,877,102 6,845,474 6,877,425 323 0.0% Jetport 23,283,267 24,112,747 24,660,341 26,578,275 2,465,528 10.2%
Total Enterprise Funds: $55,344,692 $57,828,357 $58,778,135 $61,471,535 $3,643,178 6.3%
Total City Revenue $ I 62,686,692 $168,730,165 169,429,082 $178,999,065 $ I 0,268,900 6.1%
*Note: FY19 figures include grant and project revenues excluded from the prior year resolve. These
revenues ($126,601 for Planning Admin, $164,204 for HCC, $839,356 for Public Health, $1,995,108 for Social
Services) and equal offsetting expenditures are included in the current resolve for comparative purposes.
14 CM; 04/06/19
0 I Personnel--General Fund --Ent Funds
Total
02+ Contractual--General Fund --Ent Funds
Total
55 Supplies--General Fund --Ent Funds
Total
63 Utilities--Genera I Fund --Ent Funds
Total
70 Capital--General Fund --Ent Funds
Total
75 Debt Svc--Total GF --Ent Funds
Total
75 Jetport Rev Bond Debt Svc
Jetport Surplus
Total General Fund Total Enterprise Funds
Total
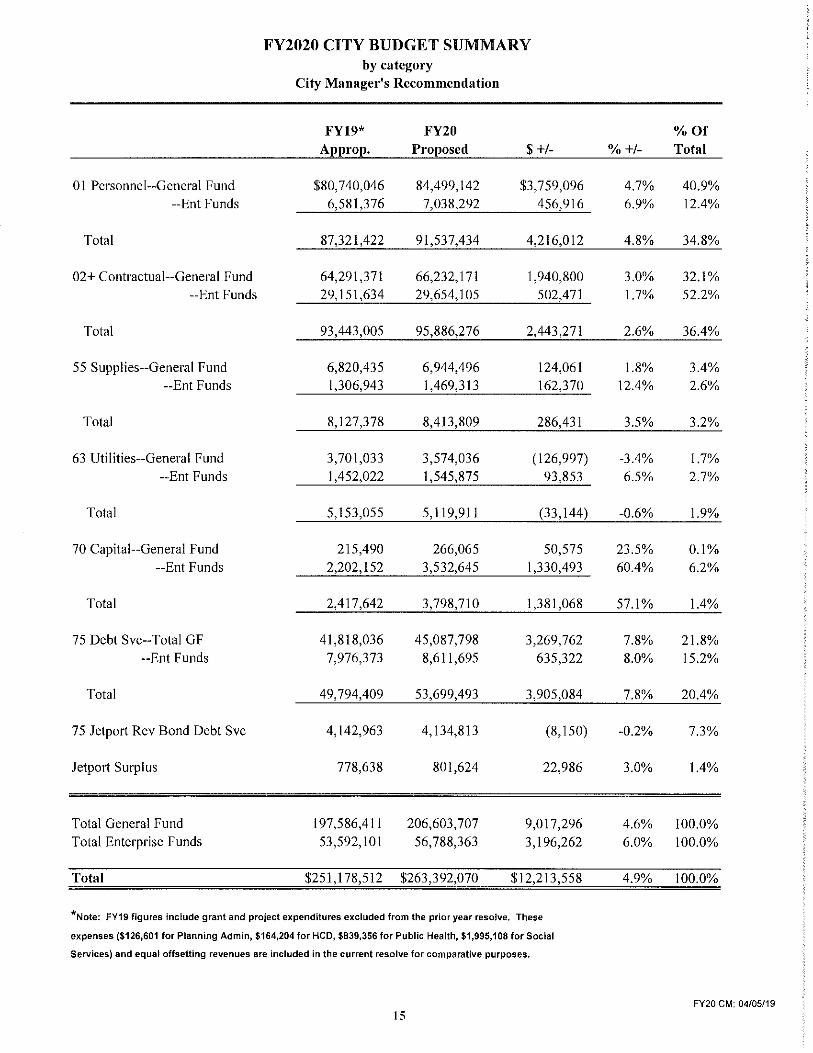
FY2020 CITY BUDGET SUMMARY by category
City Manager's Recommendation
FY19* Approp.
$80,740,046 6,581,376
87,321,422
64,291,371 29,151,634
93,443,005
6,820,435 1,306,943
8,127,378
3,701,033 1,452,022
5,153,055
215,490 2,202,152
2,417,642
41,818,036 7,976,373
49,794,409
4,142,963
778,638
197,586,411 53,592,101
$251,178,512
FY20 Proposed
84,499,142 7,038,292
91,537,434
66,232,171 29,654,105
95,886,276
6,944,496 1,469,3 I 3
8,413,809
3,574,036 1,545,875
5,119,911
266,065 3,532,645
3,798,710
45,087,798 8,611,695
53,699,493
4, I 34,813
801,624
206,603,707 56,788,363
$263,392,070
$ +/-
$3,759,096 456,916
4,216,012
1,940,800 502,471
2,443,271
124,061 162,370
286,431
(126,997) 93,853
(33,144)
50,575 1,330,493
1,381,068
3,269,762 635,322
3,905,084
(8,150)
22,986
9,017,296 3,196,262
$12,2 I 3,558
*Note: FY19 figures include grant and project expenditures excluded from the prior year resolve, These
expenses ($126,601 for Planning Admin, $164,204 for HCD, $839,356 for Public Health, $1,995,108 for Social
Services) and equal offsetting revenues are included in the current resolve for comparative purposes.
15
%+/-
4.7% 6.9%
4.8%
3.0% 1.7%
2.6%
1.8% 12.4%
3.5%
-3.4% 6.5%
-0.6%
23.5% 60.4%
57.1%
7.8% 8.0%
7.8%
-0.2%
3.0%
4.6% 6.0%
4.9%
%Of Total
40.9% 12.4%
34.8%
32.1% 52.2%
36.4%
3.4% 2.6%
3.2%
1.7% 2.7%
1.9%
0.1% 6.2%
1.4%
21.8% 15.2%
20.4%
7.3%
1.4%
100.0% 100.0%
100.0%
FY20 CM: 04/05/19
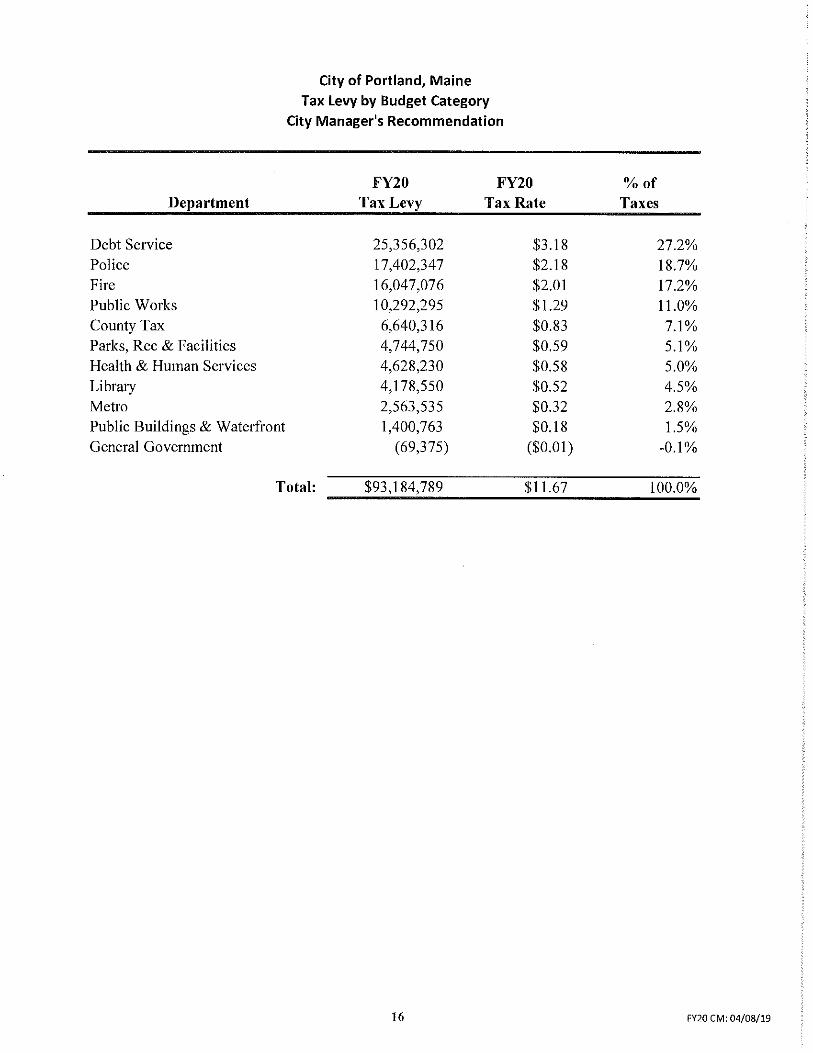
Department
Debt Service Police Fire Public Works County Tax Parks, Rec & Facilities Health & Human Services Library Metro Public Buildings & Waterfront General Government
City of Portland, Maine
Tax Levy by Budget Category
City Manager's Recommendation
FY20 FY20 Tax Levy Tax Rate
25,356,302 $3.18 17,402,347 $2.18 16,047,076 $2.01 10,292,295 $1.29 6,640,316 $0.83 4,744,750 $0.59 4,628,230 $0.58 4,178,550 $0.52 2,563,535 $0.32 1,400,763 $0.18
(69,375) ($0.01)
Total: $93,184,789 $11.67
16
¾of Taxes
27.2% 18.7% 17.2% 11.0% 7.1% 5.1% 5.0% 4.5% 2.8% 1.5%
-0.1%
100.0%
FY20 CM: 04/08/19

City of Portland
Staffing FTE Change
FY2020 City Manager's Recommendation
+/-
Department FY15 FY16 FY17 FY18 FY19 FY20 Chg
General Fund:
City Council 1.0
City Clerk 9.2 8.9 7.4 7.8 7.9 7.9
Executive 10.0 14.0 10.0 13.0 10.5 9.5 (1.0)
Assessor 4.9 4.9 5.9 5.9 5.9 5.9
Finance 26.0 24.3 24.0 25.0 25.0 25.0
Legal 6.0 6.0 6.0 6.0 7.0 7.0
Human Resources 10.0 10.0 10.5 11.0 11.0 10.5 (0.5)
Parking 29.6 29.6 29.6 29.6 29.6 30.0 0.4
Economic Development 3.0 4.0 5.8 5.8 7.1 7.0 (0.1)
Police 225.3 223.3 227.3 232.3 226.3 227.0 0.7
Fire 235.7 228.1 229.6 229.2 226.0 226.0
Planning & Urban Dev. 35.4 34.7 21.5 24.0 24.0 24.0
Permitting & Inspections 25.0 28.0 28.0 28.5 0.5
IT 17.3 17.0 17.0 17.0 17.3 16.0 (1.3)
Public Works 152.5 132.0 125.0 129.0 131.0 131.5 0.5
Parks Rec & Fae 121.6 136.5 155.2 161.5 142.0 140.7 (1.3)
Pubic Bldgs & Waterfront 24.5 24.5
HHS Administration 5.0 5.0 5.0 4.0 (1.0)
Public Health 70.0 62.3 38.2 25.0 27.1 28.3 1.2
Social Services 79.4 90.7 78.3 80.1 87.8 93.5 5.7
Barron Center 266.2 266.7 260.7 263.7 244.0 246.8 2.8
Total HHS: ./15.6 ./19. 7 382.2 373.8 363.9 372.6 8.7
General Fund Subtotal: 1,302.1 1,293.0 1,283.0 1,298.9 1,287.0 1,293.6 6.6
Enterprise Funds:
Sewer Fund 39.0 32.0 31.0 30.0 33.0 33.0
Stormwater Fund 11.5 11.0 13.0 10.0 10.0
Jetport 49.0 49.5 50.5 52.5 56.0 59.0 3.0
Enterprise Subtotal: 88.0 93.0 92.5 95.5 99.0 102.0 3.0
Total City Employees: 1,390.1 1,386.0 1,375.5 1,394.4 1,386.0 1,395.6 9.6
17 FY20 CM: 04/04/19
18
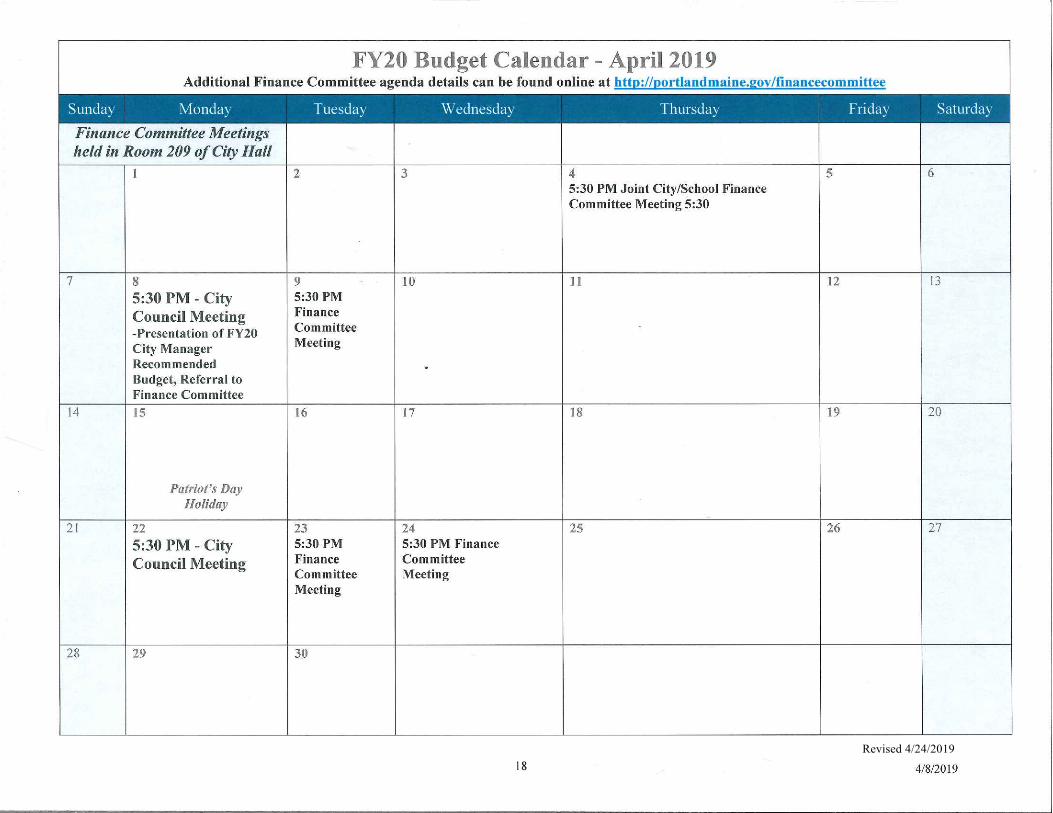
FY20 Budget Calendar - April 2019 Additional Finance Committee agenda details can be found online at http://portlandmaine.gov/financecommittee
Sunday Monday Tuesday Wednesday Thursday Friday Saturday
Finance Committee Meetings held in Room 209 of City Hall
I 2 3 4 5 6 5:30 PM Joint City/School Finance Committee Meeting 5:30
7 8 9 10 11 12 13
5:30 PM - City 5:30 PM
Council Meeting Finance
-Presentation of FY20 Committee
City Manager Meeting
Recommended . Budget, Referral to Finance Committee
14 15 16 17 18 19 20
Patriot's Day Holiday
21 22 23 24 25 26 27
5:30 PM - City 5:30 PM 5:30 PM Finance
Council Meeting Finance Committee Committee Meeting Meeting
28 29 30
4/8/2019
Revised 4/24/2019
19
5:30 PM Finance CommitteeMeeting
5:30 PM Finance CommitteeMeeting
5:30 PM Finance CommitteeMeeting
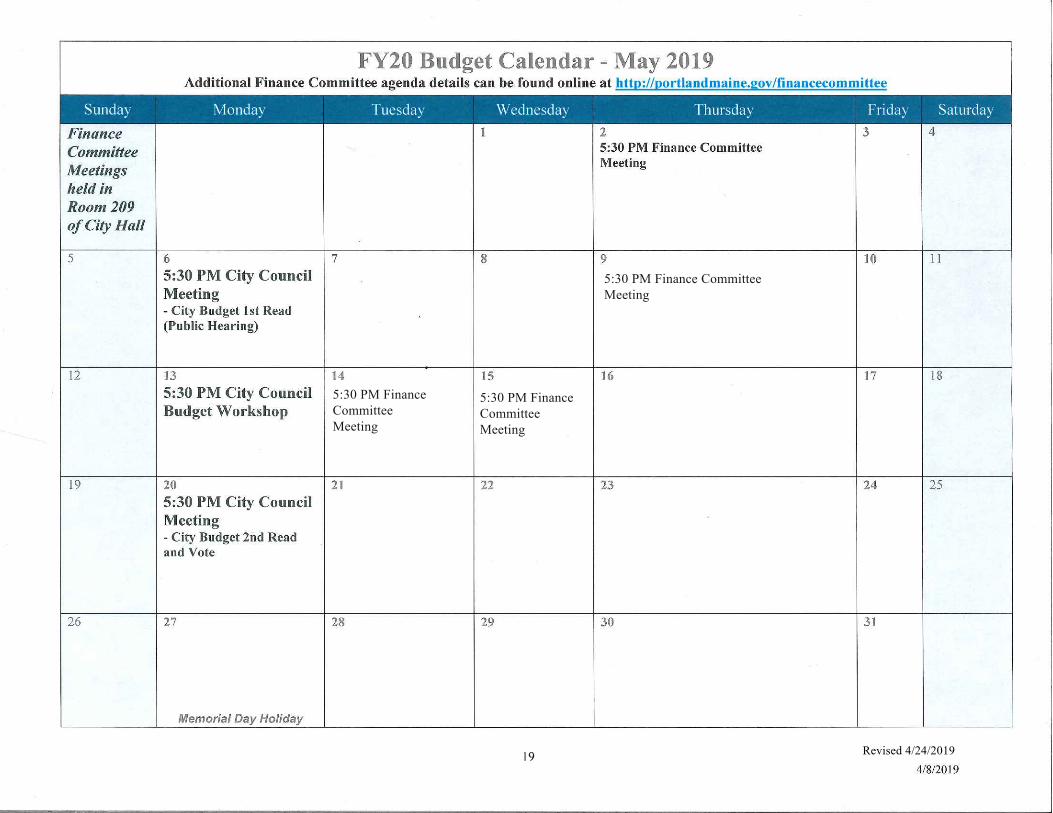
FY20 Budget Calendar - May 2019 Additional Finance Committee agenda details can be found online at http://portlandmaine.gov/financecommittee
Sunday Monday Tuesday Wednesday Thursday Friday Saturday
Finance l 2 3 4
Committee 5:30 PM Finance Committee
Meetings Meeting
held in Room209 of City Hall
5 6 7 8 9 10 11 5:30 PM City Council Meeting - City Budget 1st Read (Public Hearing)
12 13 14 15 16 ]7 18
5:30 PM City Council Budget Workshop
19 20 21 22 23 24 25
5:30 PM City Council Meeting - City Budget 2nd Read and Vote
26 27 28 29 30 31
Memorial Day Holiday
4/8/2019
Revised 4/24/2019