Embed Size (px)
Citation preview
RecommendationstoEstimateSwineNutrient
ProductioninthePhase6WatershedModel
DRAFTREPORT
ReporttotheAgriculturalModelingSubcommitteeandAgricultural
Workgroup
November2016
Reportgeneration
RobertMeinen,PennStateDepartmentofAnimalScience,UniversityPark,PAMarkEstienne,VirginiaTechDepartmentofAnimalandPoultrySciences,Blacksburg,VATimSexton,DivisionofSoilandWaterConservation,VirginiaDepartmentofConservationandRecreation,Richmond,VA
TechnicalSupportTeam
TimSexton,DivisionofSoilandWaterConservation,VirginiaDepartmentofConservationandRecreation,Richmond,VABobbyLong,DivisionofSoilandWaterConservation,VirginiaDepartmentofConservationandRecreation,Richmond,VAJordanKristoff,DivisionofSoilandWaterConservation,VirginiaDepartmentofConservationandRecreation,Richmond,VA
2
SwineDataReport
Background
QuantificationofswineindustrycharacteristicsisimportantforChesapeakeBayModelingadvancement.Thepurposeofthisreportistoprovidecurrentandhistoricalperspectiveontheswineindustryinregardstomanurenutrientgeneration.Althoughindependentlyownedandoperatedpigfarmsstillexist,theswineindustryintheChesapeakeBayWatershedfallslargelyintothefollowingcategoricalunitscommontomodernintegratedswineproductionsystems.
SowFarms-Aunitthatmaintainsasowherdforthepurposeofproducingpigs.Dependingonthestageofthereproductivecycle,sowsarehousedinbarnsspecificforbreedingandgestationorfarrowing(birthing),allatacommonfarmlocation.Oncebred,sowswillbefedforagestationperiodof114days.Shortlybeforeherduedatethesowismovedfromthegestationbarntoaroomwithinthefarrowingbarn.Theroomsarefilledinagroupedsystemsothatanewlyfilledroomcontainssowsthatareallduetofarrowwithinthesame1-7dayperiod.Thisallowsnursingsowsinthatgrouptoallbeweanedatthesametime.Theweanedpiglets(approximately12to15poundsbodyweighteach)aremovedtoanoff-sitenurseryfarm,whilethesowsaremovedasagroupbacktothebreeding/gestationbarnwheretheyarebredagain.Weanageistypicallyabout21daysandsowswillbreedagainabout5daysafterweaning.Multiplefarrowingroomsexistinmodernfacilitiessothatanewroomcanbeusedeachweek.Afterweaningandremovalofthesowsandthelittertheroomiswashedanddisinfectedsoanothergroupofsowscanmoveintotheroom.Thusthegestationandfarrowingbarnseachoperatewithaninternalrotation.Althoughthereisvariationduetoage,bodycondition,genetics,etc.,sowstypicallyweigh450to500poundseach.Sinceyoungerandlighterfemalesareincludedinthesemanureproductionestimatesanaverageweightof450poundsshouldbeusedinmodelingactivitiesinvolvingsowfarms.Youngfemalesthathavenotyetproducedalitterarecalledgilts.Asupplyofgiltsisnecessaryforsowfarmsinordertoreplacedeadsowsorsowsculled(removed)fromtheherdforpoorreproductiveperformance.Priortointroductiontothesowfarm,giltsmaybelocatedatseparateunitscalledIsolationBarnsorgiltdevelopmentunits.Sowfarmswillcontainonlyalimitednumberofboarsduetowidespreadadoptionofartificialinseminationusingsemenfromoff-siteboarstuds.Theboarsonsowfarmsareutilizedas‘teaser’animalsinordertodetect‘standingheat’insowsatwhichtimethesowisartificiallyinseminatedbyafarmtechnician.Theratioofsowstogiltsisapproximately10:1.Theratioofsowstoteaserboarsis100:1orgreater.Formodelingactivities,giltsandboarshousedwithinasowunitshouldsimplybeincludedasamemberofthesowherd.Forgiltisolationbarnsorgiltdevelopmentunitsthathaveseparatemanurestorage,giltsmaybeconsideredfinisherhogs(definedlaterinthisreport)sincebodysizeandfeedrationsaresimilar.Justificationforthisinclusionofgiltsintothefinishercategoryisbasedonthefactthattherearenotalargenumberofgiltisolationbarnsorgiltdevelopmentunitsor
3
animalnumbershousedinthismanner.Futuremodelingconsiderationsmaybegiventoaseparategiltisolationbarnorgiltdevelopmentunitcategory.
BoarStuds
Therearefewfarmsinthewatershedthathouseonlyboars.Thesefacilitiesexisttosupplysementosowfarms.Becauseejaculatesfromboarstypicallycontainmanymorespermcellsthanareneededtoimpregnateasinglesow,semenisdilutedtocreatemultipleartificialinseminationdoses.Thus,semenfromasmallnumberofboarswillserviceallthesowsonanumberofsowfarms.
NurseryFarmsWeanedpigsaretypicallymovedfromthesowfarmtoanoff-sitefacilitycalledanurseryfarm.Someolderfarmsmaintainon-sitenurseryfacilitiesatthesowfarms,buttheindustryislargelymovingawayfromthispracticeforherdhealthreasons.Nurserybuildingsallowspecializedandfocusedmanagementforyoungpigs.Buildingsdesignedspecificallyforlowerweightanimalsalsoallowsforefficientgrowthandeconomics.Thesefacilitieshouseyoungswineforapproximatelysevenweeks,soattheageoftenweekstheanimalsarecalledfeederpigsandaremovedtoafinisherfarm,weighing50to60poundseach.FinisherFarmsFeederpigsarebroughttothefinisherfarmwheretheywillgrowuntiltheyare‘finished’,meaningtheyaregrowntomarketweightsofapproximately270pounds.Oncetheyreachthisweighttheyarecalledmarkethogsandmovedtotheprocessingplant.Bothnurseryandfinisherfarmsoperateinanall-in-all-outmanner.Thismeansthatanentirebuildingispopulatedatthesametimeandthatallanimalsareremovedatthesametime.Afterthebuildingisemptied,washinganddisinfectionoccurpriortorepopulation.Bothtypesofbarnsareoftenconstructedinverysimilarmannersfromsitetosite.Companieswithmultiplesitemanagementandefficientproductionhavedriventhesecommonhousingstandards.Wean-FinishFarmsWean-finishfarmscombineboththeNurseryandFinishingphasesofproductionintoonebarn.Pigsweighing12to15poundsaremovedinafterweaningandtransportationfromsowfarmsandaremovedoutatmarketweightsofapproximately270pounds.Thus,thepigremainsinthesamepenfromweaningtomarket.CorporatefarmsownedandoperatedbySmithfieldHogProductionDivisioninVirginiaarewean-finish.NutrientBalancesSowfarmscontainenoughsowsthatproducelargeenoughlitterstosupplypigstoanumberofnurseryandfinisherfarms.Forthisreasontherearefarfewersowfarmscomparedtootherunitsofproduction.However,sowfarmsmaybehigherinAnimalUnitsand,dependingonthefarm’slandbase,mayneedtoexportmanurenutrients.Swinemanureismostlyliquidandverylowinsolidcontent.Therefore,exportedswinemanureisusuallydeliveredtonearbyneighborsandlands.Itisnoteconomicallyfeasibletoexportswinenutrientsmorethanafewmilesoroutofthewatershed.
4
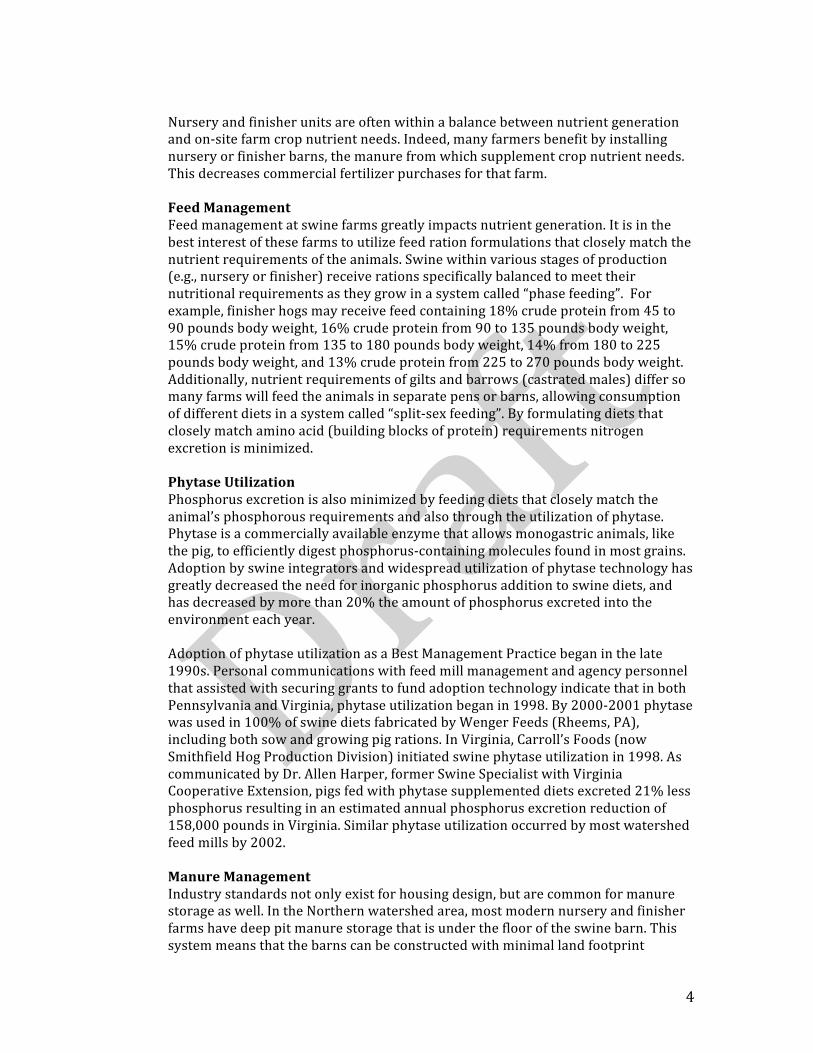
Nurseryandfinisherunitsareoftenwithinabalancebetweennutrientgenerationandon-sitefarmcropnutrientneeds.Indeed,manyfarmersbenefitbyinstallingnurseryorfinisherbarns,themanurefromwhichsupplementcropnutrientneeds.Thisdecreasescommercialfertilizerpurchasesforthatfarm.FeedManagementFeedmanagementatswinefarmsgreatlyimpactsnutrientgeneration.Itisinthebestinterestofthesefarmstoutilizefeedrationformulationsthatcloselymatchthenutrientrequirementsoftheanimals.Swinewithinvariousstagesofproduction(e.g.,nurseryorfinisher)receiverationsspecificallybalancedtomeettheirnutritionalrequirementsastheygrowinasystemcalled“phasefeeding”.Forexample,finisherhogsmayreceivefeedcontaining18%crudeproteinfrom45to90poundsbodyweight,16%crudeproteinfrom90to135poundsbodyweight,15%crudeproteinfrom135to180poundsbodyweight,14%from180to225poundsbodyweight,and13%crudeproteinfrom225to270poundsbodyweight.Additionally,nutrientrequirementsofgiltsandbarrows(castratedmales)differsomanyfarmswillfeedtheanimalsinseparatepensorbarns,allowingconsumptionofdifferentdietsinasystemcalled“split-sexfeeding”.Byformulatingdietsthatcloselymatchaminoacid(buildingblocksofprotein)requirementsnitrogenexcretionisminimized.PhytaseUtilizationPhosphorusexcretionisalsominimizedbyfeedingdietsthatcloselymatchtheanimal’sphosphorousrequirementsandalsothroughtheutilizationofphytase.Phytaseisacommerciallyavailableenzymethatallowsmonogastricanimals,likethepig,toefficientlydigestphosphorus-containingmoleculesfoundinmostgrains.Adoptionbyswineintegratorsandwidespreadutilizationofphytasetechnologyhasgreatlydecreasedtheneedforinorganicphosphorusadditiontoswinediets,andhasdecreasedbymorethan20%theamountofphosphorusexcretedintotheenvironmenteachyear.AdoptionofphytaseutilizationasaBestManagementPracticebeganinthelate1990s.PersonalcommunicationswithfeedmillmanagementandagencypersonnelthatassistedwithsecuringgrantstofundadoptiontechnologyindicatethatinbothPennsylvaniaandVirginia,phytaseutilizationbeganin1998.By2000-2001phytasewasusedin100%ofswinedietsfabricatedbyWengerFeeds(Rheems,PA),includingbothsowandgrowingpigrations.InVirginia,Carroll’sFoods(nowSmithfieldHogProductionDivision)initiatedswinephytaseutilizationin1998.AscommunicatedbyDr.AllenHarper,formerSwineSpecialistwithVirginiaCooperativeExtension,pigsfedwithphytasesupplementeddietsexcreted21%lessphosphorusresultinginanestimatedannualphosphorusexcretionreductionof158,000poundsinVirginia.Similarphytaseutilizationoccurredbymostwatershedfeedmillsby2002.ManureManagementIndustrystandardsnotonlyexistforhousingdesign,butarecommonformanurestorageaswell.IntheNorthernwatershedarea,mostmodernnurseryandfinisherfarmshavedeeppitmanurestoragethatisundertheflooroftheswinebarn.Thissystemmeansthatthebarnscanbeconstructedwithminimallandfootprint
5
requirements.Sowfarmsmayalsohaveunder-floordeeppitstorage.Manurefromdeeppitsisremoveddirectlyfromthebarnsandappliedtoland.Somesowfarmsandsomeolderfinishersiteshaveexternalopen-airmanurestorage.Thesestoragefacilitiesaredesignedinavarietyofmanners,withmostmodernoutdoorconstructionintheformoflinedearthenbasinsorconcretestructures.Innorthernareasofthewatershedthesefacilitiesaresimplyoutdoormanurestoragebasins.Insouthernwatershedregionsmanyoutdoormanurefacilitiesoperateastruelagoons.Inthesesystems,penswithinbarnsaretypicallyovershallowmanurepitsandareroutinelyemptiedintolargeoutdoorlagoonsforstorage.Manyofthesesystemscontainbothaprimarystageandsecondarystagemanurelagoon.Whenpitsinbarnsareemptied,manureflowsintotheprimarylagoon.There,solidswithinthemanuresettletothebottom.Asthelevelofliquidrisesinthefirststagelagoon,itflowsthroughapipetothesecondstagelagoon.Thecontentsofthesecondstagelagooncanbeusedtorefillmanurepitswithinthebarnsand/orspray-irrigatedonadjacentfarmland.Liquidfromthesecondstagestorageisexpectedtobeverylowinnutrientandsolidcontentssincesettledsolidsinthefirststagewillholdhighconcentrationsofnutrients,especiallyphosphorus,inthatstoragearea.Whilesecondstageliquidisirrigatedtofarmlandonaroutinebasis,firststagesolidscanberetainedinstorageforyearsbeforeremovalisnecessary.Lagoonsystemscanbeconsideredaformofmanuretreatmentsincenutrientsareremovedandheldforlongperiods.Othertypesofalternativemanuretreatmentsarenotcommonwithswinemanure.Thefollowingmanurestoragetypesareconsideredforthisreport:
1. Deeppit,underfloormanurestorage2. Outdoorstoragebasins(earthenorconcrete)3. Lagoons,includingfirstandsecondstagetreatments
Methodology
Severalsourceswereutilizedtoassurethatcurrentdatawereavailableforthisreport.CountryViewFamilyFarms,inPennsylvania,andSmithfieldHogProductionDivision,inVirginia,cooperatedtoprovidemanureanalysesfrommanyoftheirfarms.Manureanalysesthatwereolderthan14monthswerenotconsidered.Technicianswerealsoemployedthroughcontracttovisitanumberoffarmstocollectmanuresamples.SamplesweresenttolaboratoriesateitherClemsonUniversityorPennStateUniversityforanalyses.BothCountryViewFamilyFarmsandSmithfieldHogProductionDivisionalsoprovidedanimalweightsandfarminventoriesthatwerepairedwithmanureanalysesdata.Athirdsourcewashistoricdataprovidedfromseveralreputablesources.Producerinformationwasremovedfromdataforconfidentiality.Thecommitteemadeseveraldeterminationsbasedonindustrystandardsandprofessionaljudgmentthathelpedtoshapetherecommendationsfoundinthisreport.
• Giltsandboarswereincludedinsowfarmdata.Giltsareareoftenhousedwithsowsandthenumberofboarsonsowfarmsislimitedtothoseneededforheatdetection.Futureadditionoftheseanimalgroupstothemodel,byinclusionofgiltisolationordevelopmentunitsandboarstudsshouldbeconsidered.
6
• Sowswithlittersarecountedassows.Eventhoughnursinglittersarewithsowswithinthefarrowingbarnsofsowfarms,thepigletsreceivelittleornosupplementalfeednutrientsandthemanureproductionofthelitterisaverysmallfractionofthatproducedbythesow.
• Wean-Finishfarmsarenotconsideredinthisreport.Thistypeofproductionbarnislesscommonthanthemultiplesitenurseryandfinishersystems.Theresimplywasnotenoughdataavailabletocreateaseparatecategoryforthistypeoffarm.Therecommendationforthistypeoffacilityistoadjustanimalweightaccordinglytoentryandexitweights,andtoutilizeactualfarmmanuresamples.Ifmanuresamplesarenotavailablethenfinishingfarmnutrientvaluesshouldbeused.Thecorrespondingfinishinganimalsrepresentfargreaterweights,feedconsumptionandresidencetimeatthesefacilities.Futureadditionofthistypeoffarmtothemodelshouldbeconsidered.
• Weightsreportedrepresenttheaverageweightofanimalsduringthetimetheypopulatethespecificphaseofproduction.Addingentryandexitanimalweights,anddividingthatsumbytwowasusedtodetermineaverageweights.
• LagoonsystemsfoundinVirginiaoftencontainbothaPrimaryandSecondarymanurelagoon.Manurenutrientdataforlagoonsystemsisprovidedforbothoftheselagoonsaswellasatotalaverage.
• Becausethisreportwasdevelopedundertimeandresourceconstraintsthedatasetfromwhichconclusionsaredrawnisnotperfect.Muchdataoriginatesfromonlyafewcooperativeintegratedcompanies.Whilethedatafromthefarmswithintheselargeintegratedsystemsisquiterepresentativeofthelargenumberofanimalsmanagedwithinthecompany’ssystems,differencesmaybeexpectedwithotherintegratedsystemsduetovariationinsuchfactorsasgenetics,orfeedregimens.Nonetheless,thejudgmentofthisprofessionalpanelisthatthevariationnotedherewouldnotbegreat.Wefeelthatthisdatasetisafairrepresentationoftheindustrygiventhecollectionconstraintsnotedabove.Futureendeavorsshouldincludelargerdatasetsfromamorediversesetofoperations.
7
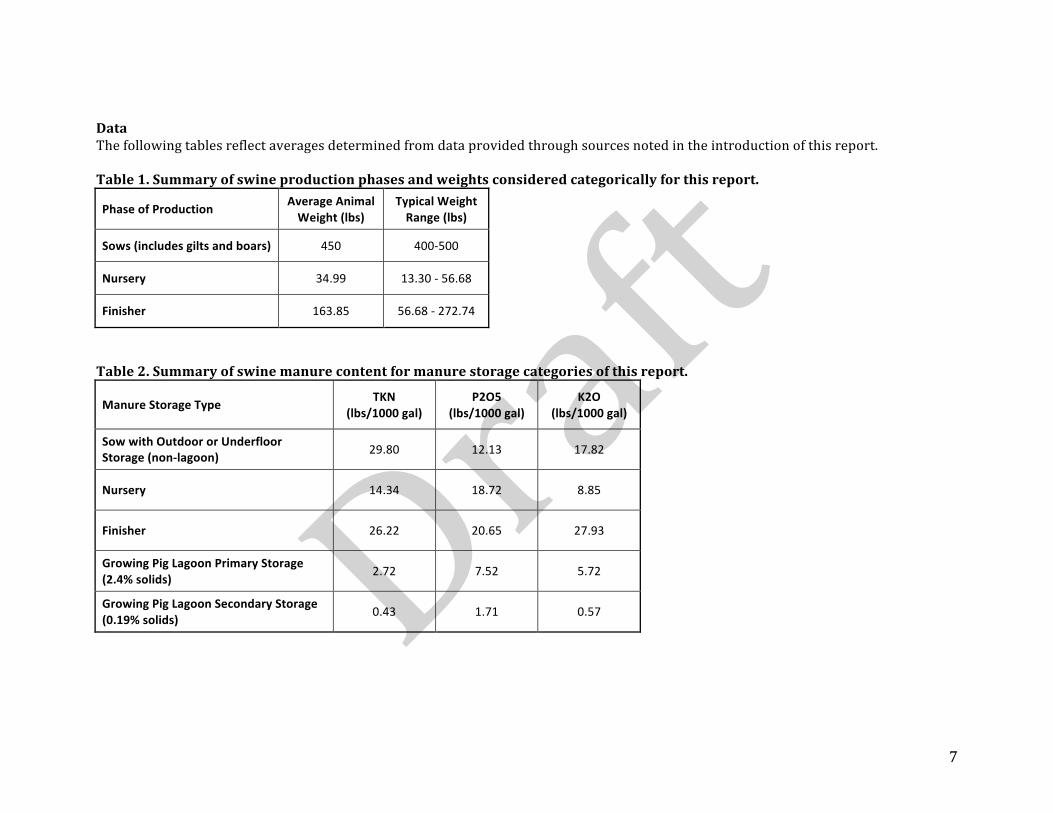
DataThefollowingtablesreflectaveragesdeterminedfromdataprovidedthroughsourcesnotedintheintroductionofthisreport.Table1.Summaryofswineproductionphasesandweightsconsideredcategoricallyforthisreport.
PhaseofProduction AverageAnimalWeight(lbs)
TypicalWeightRange(lbs)
Sows(includesgiltsandboars) 450 400-500
Nursery 34.99 13.30-56.68
Finisher 163.85 56.68-272.74
Table2.Summaryofswinemanurecontentformanurestoragecategoriesofthisreport.
ManureStorageType TKN(lbs/1000gal)
P2O5(lbs/1000gal)
K2O(lbs/1000gal)
SowwithOutdoororUnderfloorStorage(non-lagoon) 29.80 12.13 17.82
Nursery 14.34 18.72 8.85
Finisher 26.22 20.65 27.93
GrowingPigLagoonPrimaryStorage(2.4%solids) 2.72 7.52 5.72
GrowingPigLagoonSecondaryStorage(0.19%solids) 0.43 1.71 0.57
8
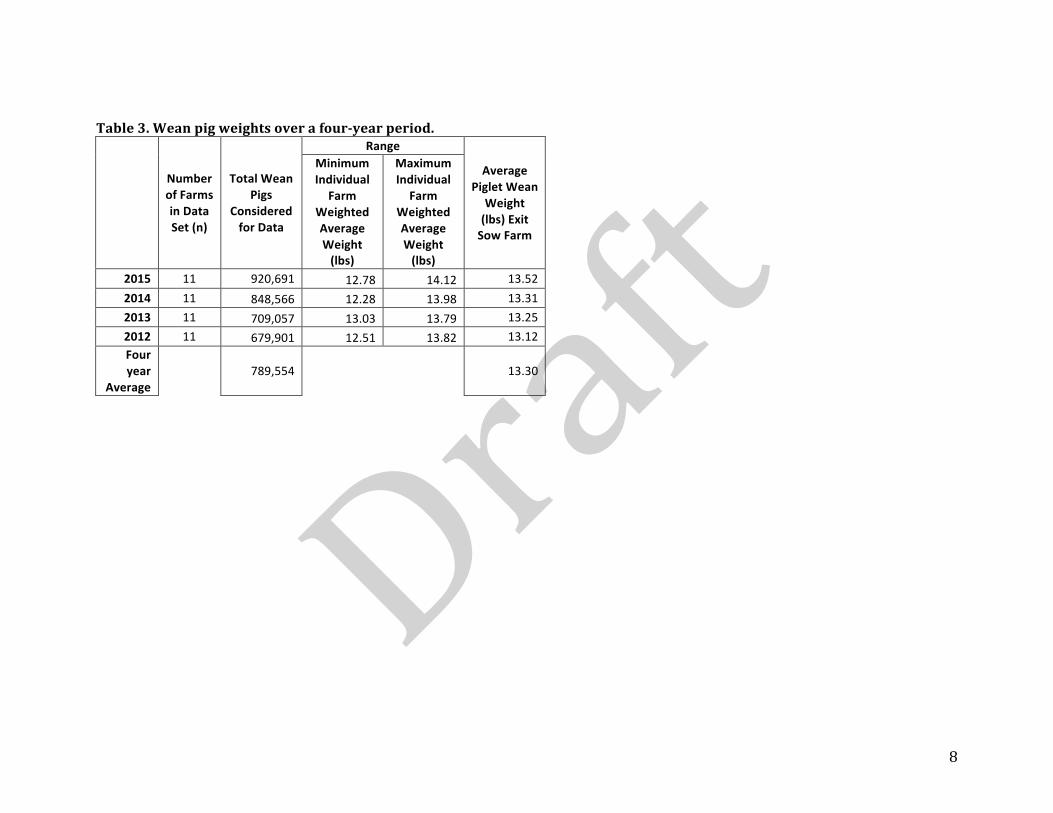
Table3.Weanpigweightsoverafour-yearperiod.
NumberofFarmsinDataSet(n)
TotalWeanPigs
ConsideredforData
Range
AveragePigletWean
Weight(lbs)ExitSowFarm
MinimumIndividual
FarmWeightedAverageWeight(lbs)
MaximumIndividual
FarmWeightedAverageWeight(lbs)
2015 11 920,691 12.78 14.12 13.522014 11 848,566 12.28 13.98 13.312013 11 709,057 13.03 13.79 13.252012 11 679,901 12.51 13.82 13.12Fouryear
Average 789,554 13.30
9
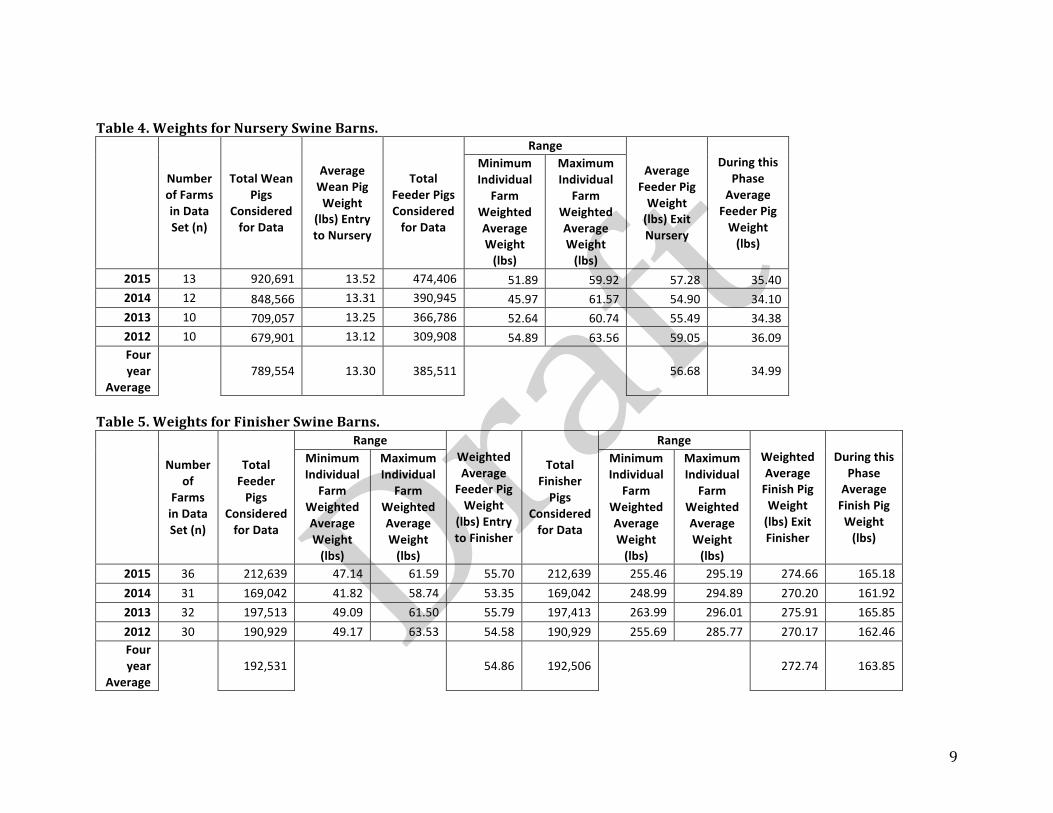
Table4.WeightsforNurserySwineBarns.
NumberofFarmsinDataSet(n)
TotalWeanPigs
ConsideredforData
AverageWeanPigWeight
(lbs)EntrytoNursery
TotalFeederPigsConsideredforData
Range
AverageFeederPigWeight(lbs)ExitNursery
DuringthisPhaseAverageFeederPigWeight(lbs)
MinimumIndividual
FarmWeightedAverageWeight(lbs)
MaximumIndividual
FarmWeightedAverageWeight(lbs)
2015 13 920,691 13.52 474,406 51.89 59.92 57.28 35.402014 12 848,566 13.31 390,945 45.97 61.57 54.90 34.102013 10 709,057 13.25 366,786 52.64 60.74 55.49 34.382012 10 679,901 13.12 309,908 54.89 63.56 59.05 36.09Fouryear
Average 789,554 13.30 385,511 56.68 34.99
Table5.WeightsforFinisherSwineBarns.
Numberof
FarmsinDataSet(n)
TotalFeederPigs
ConsideredforData
RangeWeightedAverageFeederPigWeight
(lbs)EntrytoFinisher
TotalFinisherPigs
ConsideredforData
RangeWeightedAverageFinishPigWeight(lbs)ExitFinisher
DuringthisPhaseAverageFinishPigWeight(lbs)
MinimumIndividual
FarmWeightedAverageWeight(lbs)
MaximumIndividual
FarmWeightedAverageWeight(lbs)
MinimumIndividual
FarmWeightedAverageWeight(lbs)
MaximumIndividual
FarmWeightedAverageWeight(lbs)
2015 36 212,639 47.14 61.59 55.70 212,639 255.46 295.19 274.66 165.182014 31 169,042 41.82 58.74 53.35 169,042 248.99 294.89 270.20 161.922013 32 197,513 49.09 61.50 55.79 197,413 263.99 296.01 275.91 165.852012 30 190,929 49.17 63.53 54.58 190,929 255.69 285.77 270.17 162.46Fouryear
Average 192,531 54.86 192,506 272.74 163.85
10
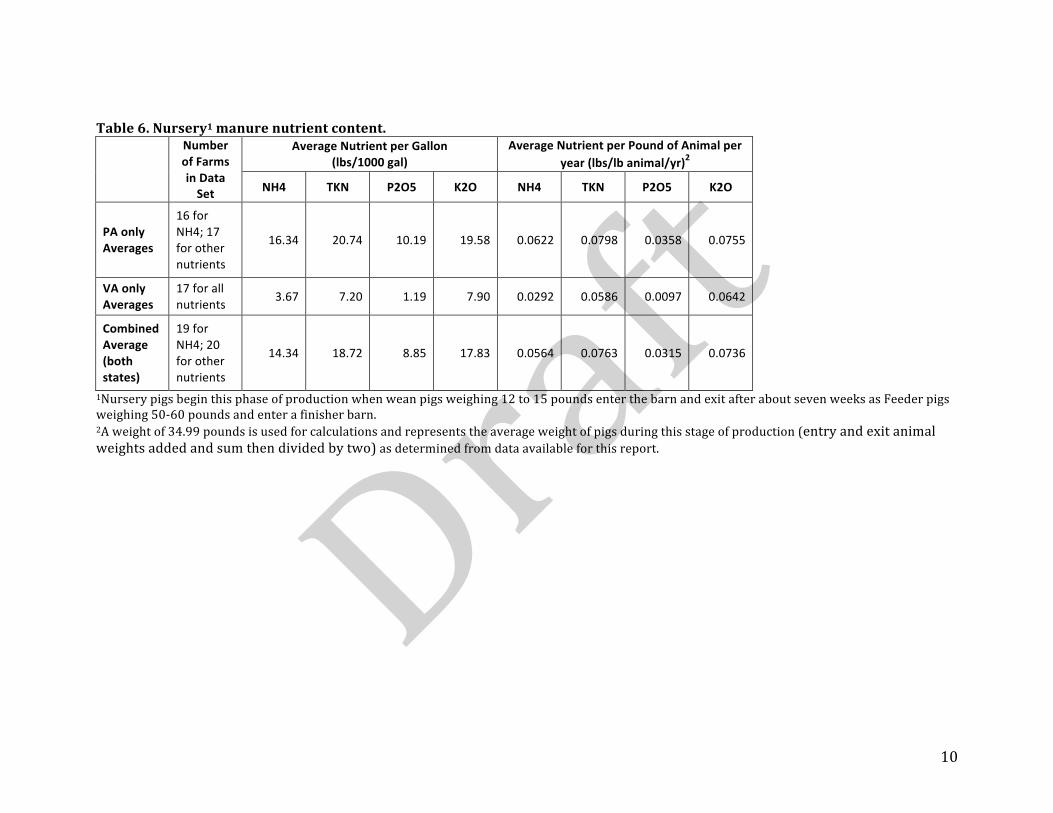
Table6.Nursery1manurenutrientcontent.
NumberofFarmsinDataSet
AverageNutrientperGallon(lbs/1000gal)
AverageNutrientperPoundofAnimalperyear(lbs/lbanimal/yr)2
NH4 TKN P2O5 K2O NH4 TKN P2O5 K2O
PAonlyAverages
16forNH4;17forothernutrients
16.34 20.74 10.19 19.58 0.0622 0.0798 0.0358 0.0755
VAonlyAverages
17forallnutrients 3.67 7.20 1.19 7.90 0.0292 0.0586 0.0097 0.0642
CombinedAverage(bothstates)
19forNH4;20forothernutrients
14.34 18.72 8.85 17.83 0.0564 0.0763 0.0315 0.0736
1Nurserypigsbeginthisphaseofproductionwhenweanpigsweighing12to15poundsenterthebarnandexitafteraboutsevenweeksasFeederpigsweighing50-60poundsandenterafinisherbarn.2Aweightof34.99poundsisusedforcalculationsandrepresentstheaverageweightofpigsduringthisstageofproduction(entryandexitanimalweightsaddedandsumthendividedbytwo)asdeterminedfromdataavailableforthisreport.

11
Table7.Finisher1manurenutrientcontent.
NumberofFarmsinData
NutrientSet
AverageNutrientperGallon(lbs/1000gal)
NumberofFarms
ProvidingInventory
Data
AverageNutrientperPoundofAnimalperyear(lbs/lbanimal/yr)2
NH4 TKN P2O5 K2O NH4 TKN P2O5 K2O
PAonlyAverages 29 26.65 35.95 29.55 35.98 29 0.0236 0.0316 0.0285 0.0316
VAonlyAverages 14 3.94 6.07 2.21 11.27 10 0.0041 0.0062 0.0017 0.0132
CombinedAverage(bothstates)
43 19.26 26.22 20.65 27.93 39 0.0186 0.0251 0.0216 0.0269
1Finisherpigsbeginthefinisherphaseofproductionweighingapproximately50to60poundsandaremarketedatweightsofapproximately270pounds.Averagefinisherpigweightisapproximately165pounds.2Aweightof163.85poundsisusedforcalculationsandrepresentstheaverageweightofpigsduringthisstageofproduction(entryandexitanimalweightsaddedandsumthendividedbytwo)asdeterminedfromdataavailableforthisreport.Table8.SowFarm1manurenutrientcontentforfarmswithoutdoorstoragebasinsanddeeppitunder-floorstorageinPennsylvania.
NumberofFarmsinData
NutrientSet
AverageNutrientperGallon(lbs/1000gal)AverageNutrientperPoundofAnimalper
year(lbs/lbanimal/yr)1
NH4 TKN P2O5 K2O NH4 TKN P2O5 K2O
PAonlyAverage2 11 20.62 29.80 12.13 17.82 0.0751 0.1096 0.0475 0.0613
1SowFarmsincludesowsandarelativelysmallernumberofboarsandgilts.Theaverageanimalweightonsowfarmsisroutinelyconsideredtobe450pounds.2NonutrientdatawasreceivedfromVAforthisnon-lagoontypeofoutdoorstorage.
12
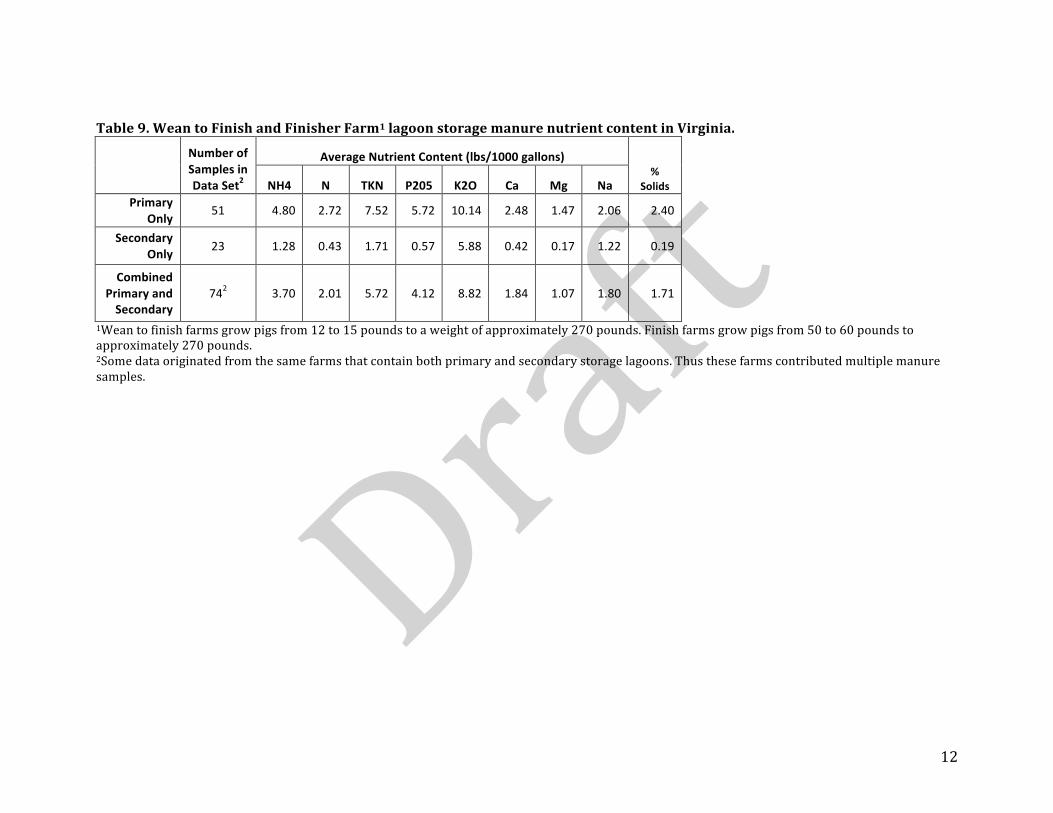
Table9.WeantoFinishandFinisherFarm1lagoonstoragemanurenutrientcontentinVirginia.
NumberofSamplesinDataSet2
AverageNutrientContent(lbs/1000gallons)%
SolidsNH4 N TKN P205 K2O Ca Mg NaPrimary
Only 51 4.80 2.72 7.52 5.72 10.14 2.48 1.47 2.06 2.40
SecondaryOnly 23 1.28 0.43 1.71 0.57 5.88 0.42 0.17 1.22 0.19
CombinedPrimaryandSecondary
742 3.70 2.01 5.72 4.12 8.82 1.84 1.07 1.80 1.71
1Weantofinishfarmsgrowpigsfrom12to15poundstoaweightofapproximately270pounds.Finishfarmsgrowpigsfrom50to60poundstoapproximately270pounds.2Somedataoriginatedfromthesamefarmsthatcontainbothprimaryandsecondarystoragelagoons.Thusthesefarmscontributedmultiplemanuresamples.
13
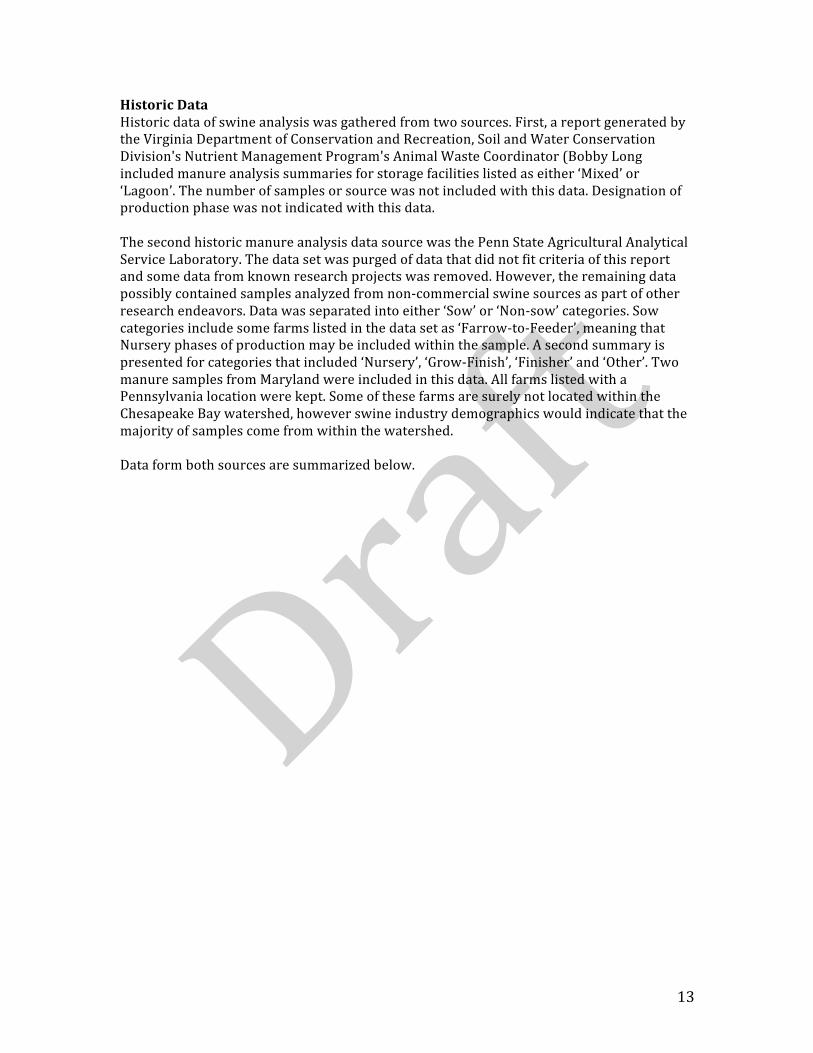
HistoricDataHistoricdataofswineanalysiswasgatheredfromtwosources.First,areportgeneratedbytheVirginiaDepartmentofConservationandRecreation,SoilandWaterConservationDivision'sNutrientManagementProgram'sAnimalWasteCoordinator(BobbyLongincludedmanureanalysissummariesforstoragefacilitieslistedaseither‘Mixed’or‘Lagoon’.Thenumberofsamplesorsourcewasnotincludedwiththisdata.Designationofproductionphasewasnotindicatedwiththisdata.ThesecondhistoricmanureanalysisdatasourcewasthePennStateAgriculturalAnalyticalServiceLaboratory.Thedatasetwaspurgedofdatathatdidnotfitcriteriaofthisreportandsomedatafromknownresearchprojectswasremoved.However,theremainingdatapossiblycontainedsamplesanalyzedfromnon-commercialswinesourcesaspartofotherresearchendeavors.Datawasseparatedintoeither‘Sow’or‘Non-sow’categories.Sowcategoriesincludesomefarmslistedinthedatasetas‘Farrow-to-Feeder’,meaningthatNurseryphasesofproductionmaybeincludedwithinthesample.Asecondsummaryispresentedforcategoriesthatincluded‘Nursery’,‘Grow-Finish’,‘Finisher’and‘Other’.TwomanuresamplesfromMarylandwereincludedinthisdata.AllfarmslistedwithaPennsylvanialocationwerekept.SomeofthesefarmsaresurelynotlocatedwithintheChesapeakeBaywatershed,howeverswineindustrydemographicswouldindicatethatthemajorityofsamplescomefromwithinthewatershed.Dataformbothsourcesaresummarizedbelow.
14
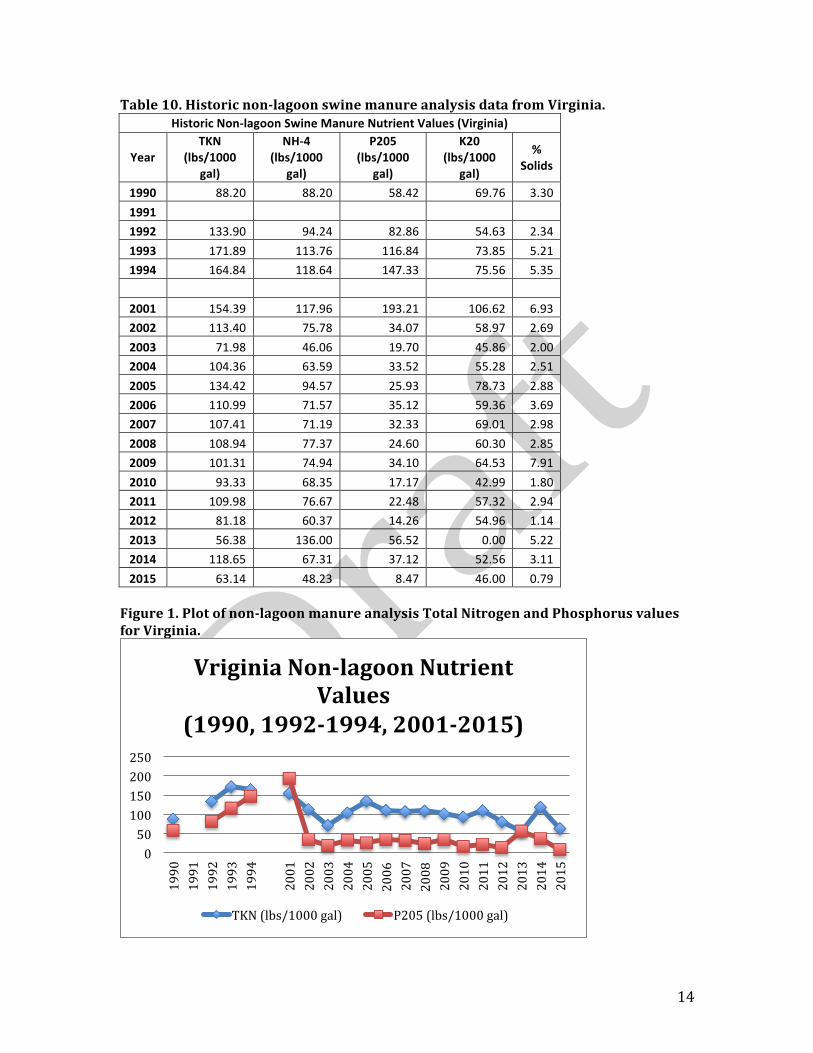
Table10.Historicnon-lagoonswinemanureanalysisdatafromVirginia.HistoricNon-lagoonSwineManureNutrientValues(Virginia)
YearTKN
(lbs/1000gal)
NH-4(lbs/1000
gal)
P205(lbs/1000
gal)
K20(lbs/1000
gal)
%Solids
1990 88.20 88.20 58.42 69.76 3.301991 1992 133.90 94.24 82.86 54.63 2.341993 171.89 113.76 116.84 73.85 5.211994 164.84 118.64 147.33 75.56 5.35
2001 154.39 117.96 193.21 106.62 6.932002 113.40 75.78 34.07 58.97 2.692003 71.98 46.06 19.70 45.86 2.002004 104.36 63.59 33.52 55.28 2.512005 134.42 94.57 25.93 78.73 2.882006 110.99 71.57 35.12 59.36 3.692007 107.41 71.19 32.33 69.01 2.982008 108.94 77.37 24.60 60.30 2.852009 101.31 74.94 34.10 64.53 7.912010 93.33 68.35 17.17 42.99 1.802011 109.98 76.67 22.48 57.32 2.942012 81.18 60.37 14.26 54.96 1.142013 56.38 136.00 56.52 0.00 5.222014 118.65 67.31 37.12 52.56 3.112015 63.14 48.23 8.47 46.00 0.79Figure1.Plotofnon-lagoonmanureanalysisTotalNitrogenandPhosphorusvaluesforVirginia.
050100150200250
1990
1991
1992
1993
1994
2001
2002
2003
2004
2005
2006
2007
2008
2009
2010
2011
2012
2013
2014
2015
VriginiaNon-lagoonNutrientValues
(1990,1992-1994,2001-2015)
TKN(lbs/1000gal) P205(lbs/1000gal)
15
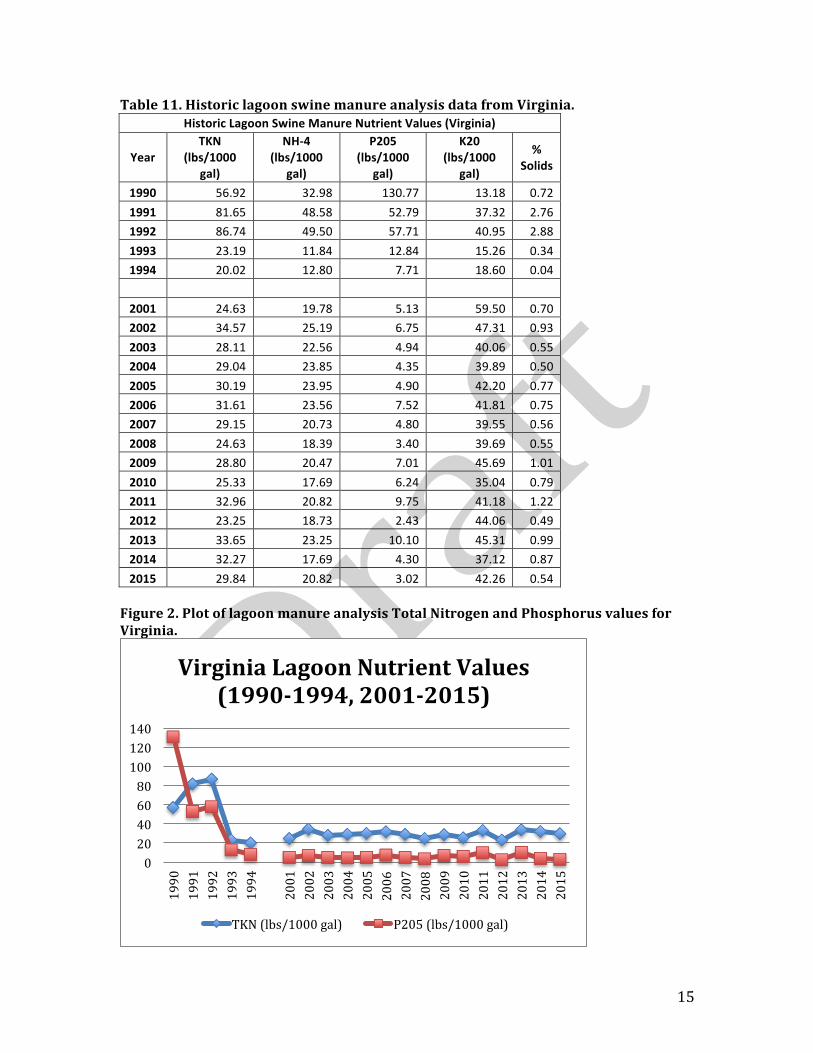
Table11.HistoriclagoonswinemanureanalysisdatafromVirginia.HistoricLagoonSwineManureNutrientValues(Virginia)
YearTKN
(lbs/1000gal)
NH-4(lbs/1000
gal)
P205(lbs/1000
gal)
K20(lbs/1000
gal)
%Solids
1990 56.92 32.98 130.77 13.18 0.721991 81.65 48.58 52.79 37.32 2.761992 86.74 49.50 57.71 40.95 2.881993 23.19 11.84 12.84 15.26 0.341994 20.02 12.80 7.71 18.60 0.04
2001 24.63 19.78 5.13 59.50 0.702002 34.57 25.19 6.75 47.31 0.932003 28.11 22.56 4.94 40.06 0.552004 29.04 23.85 4.35 39.89 0.502005 30.19 23.95 4.90 42.20 0.772006 31.61 23.56 7.52 41.81 0.752007 29.15 20.73 4.80 39.55 0.562008 24.63 18.39 3.40 39.69 0.552009 28.80 20.47 7.01 45.69 1.012010 25.33 17.69 6.24 35.04 0.792011 32.96 20.82 9.75 41.18 1.222012 23.25 18.73 2.43 44.06 0.492013 33.65 23.25 10.10 45.31 0.992014 32.27 17.69 4.30 37.12 0.872015 29.84 20.82 3.02 42.26 0.54Figure2.PlotoflagoonmanureanalysisTotalNitrogenandPhosphorusvaluesforVirginia.
020406080100120140
1990
1991
1992
1993
1994
2001
2002
2003
2004
2005
2006
2007
2008
2009
2010
2011
2012
2013
2014
2015
VirginiaLagoonNutrientValues(1990-1994,2001-2015)
TKN(lbs/1000gal) P205(lbs/1000gal)
16
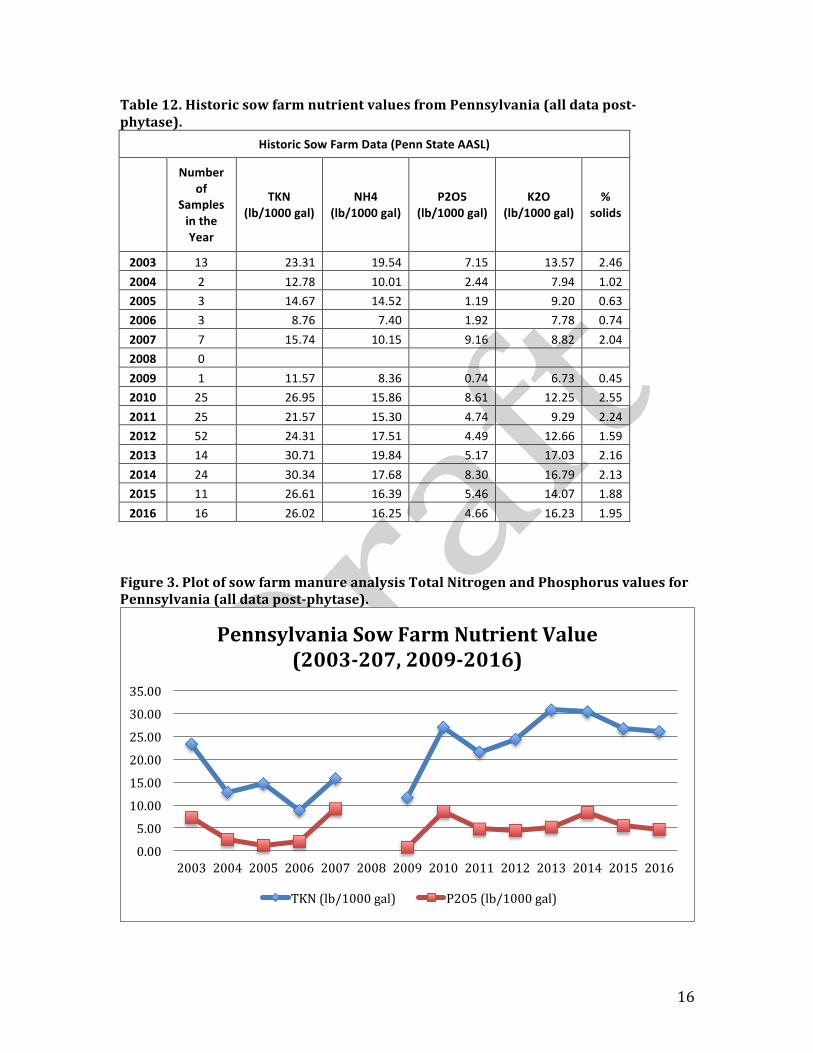
Table12.HistoricsowfarmnutrientvaluesfromPennsylvania(alldatapost-phytase).
HistoricSowFarmData(PennStateAASL)
Numberof
SamplesintheYear
TKN(lb/1000gal)
NH4(lb/1000gal)
P2O5(lb/1000gal)
K2O(lb/1000gal)
%solids
2003 13 23.31 19.54 7.15 13.57 2.462004 2 12.78 10.01 2.44 7.94 1.022005 3 14.67 14.52 1.19 9.20 0.632006 3 8.76 7.40 1.92 7.78 0.742007 7 15.74 10.15 9.16 8.82 2.042008 0 2009 1 11.57 8.36 0.74 6.73 0.452010 25 26.95 15.86 8.61 12.25 2.552011 25 21.57 15.30 4.74 9.29 2.242012 52 24.31 17.51 4.49 12.66 1.592013 14 30.71 19.84 5.17 17.03 2.162014 24 30.34 17.68 8.30 16.79 2.132015 11 26.61 16.39 5.46 14.07 1.882016 16 26.02 16.25 4.66 16.23 1.95Figure3.PlotofsowfarmmanureanalysisTotalNitrogenandPhosphorusvaluesforPennsylvania(alldatapost-phytase).
0.005.0010.0015.0020.0025.0030.0035.00
2003 2004 2005 2006 2007 2008 2009 2010 2011 2012 2013 2014 2015 2016
PennsylvaniaSowFarmNutrientValue(2003-207,2009-2016)
TKN(lb/1000gal) P2O5(lb/1000gal)
17
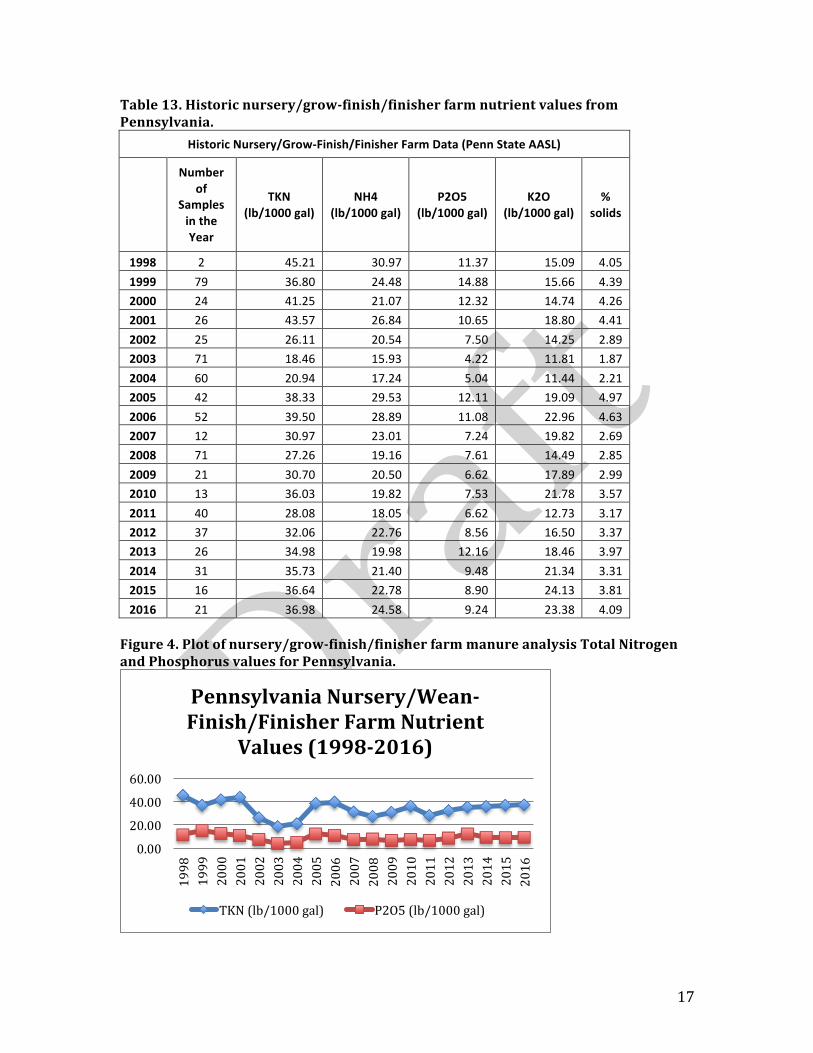
Table13.Historicnursery/grow-finish/finisherfarmnutrientvaluesfromPennsylvania.
HistoricNursery/Grow-Finish/FinisherFarmData(PennStateAASL)
Numberof
SamplesintheYear
TKN(lb/1000gal)
NH4(lb/1000gal)
P2O5(lb/1000gal)
K2O(lb/1000gal)
%solids
1998 2 45.21 30.97 11.37 15.09 4.051999 79 36.80 24.48 14.88 15.66 4.392000 24 41.25 21.07 12.32 14.74 4.262001 26 43.57 26.84 10.65 18.80 4.412002 25 26.11 20.54 7.50 14.25 2.892003 71 18.46 15.93 4.22 11.81 1.872004 60 20.94 17.24 5.04 11.44 2.212005 42 38.33 29.53 12.11 19.09 4.972006 52 39.50 28.89 11.08 22.96 4.632007 12 30.97 23.01 7.24 19.82 2.692008 71 27.26 19.16 7.61 14.49 2.852009 21 30.70 20.50 6.62 17.89 2.992010 13 36.03 19.82 7.53 21.78 3.572011 40 28.08 18.05 6.62 12.73 3.172012 37 32.06 22.76 8.56 16.50 3.372013 26 34.98 19.98 12.16 18.46 3.972014 31 35.73 21.40 9.48 21.34 3.312015 16 36.64 22.78 8.90 24.13 3.812016 21 36.98 24.58 9.24 23.38 4.09Figure4.Plotofnursery/grow-finish/finisherfarmmanureanalysisTotalNitrogenandPhosphorusvaluesforPennsylvania.
0.0020.0040.0060.00
1998
1999
2000
2001
2002
2003
2004
2005
2006
2007
2008
2009
2010
2011
2012
2013
2014
2015
2016
PennsylvaniaNursery/Wean-Finish/FinisherFarmNutrient
Values(1998-2016)
TKN(lb/1000gal) P2O5(lb/1000gal)
18
APPENDICESAppendix1:SwineBiosecurityGuidelines(TimSexton)Thefollowingprotocolwasfollowedduringdatacollection.
• Respectallentranceprohibitionsonswinefarmsand/orbarns• Onlyenteraswinehouseifabsolutelynecessary.NOEntranceonInfectedBarn
UnderAnyConditions• Uponarrivalatanyswinefarm,reporttothefarmmanagerorresponsibleparty• Washhandsimmediatelyuponarrivalbeforeputtingondisposablegloves,and
againbeforeleavingfarm.• Leavevehiclesoutsideofserviceareas.Walk!• Avoidvisitingtwoswinefarmswithin48hoursifpossibleabsolutelynovisitationof
swinefarmsfromtwoseparatesowunitswithin48hours• WearBootsthatcanbedisinfected,disposablegloves• Putallmanuresamplesintosealedbottles,sprayoutsideofbottleandthenput
sampleintosealableplasticbag.• Allmaterialsusedonthesitemustbedisinfectedbeforeandafteruse• BootsshouldbedippedattheentranceandexitofeveryfarmwithCloroxsolution
orVirconsolution• Sprayallequipmentwithamixof8oz.ofClorox/gallonor10%Virconsolutionof
wateruntilwet.Leaveonfor30seconds.Dryoffwithdisposablepapertowels.Putglovesandpapertowelsinplasticbagandkeeptightlysealed.
• Keepcleanedmaterialsawayfromcontaminatedmaterials.• Removealldrylitter,manure,mud,strawetc.fromvehicle,especiallywheelsand
wheelwells• Spraywheels,tiresandwheelwellswithdisinfectionsolution.Letdrainanddry
beforemoving.Ifdustyorwet,sprayundersideofvehicle.Alternative:parkvehicleoutsidefarmentranceandWALK!
Appendix2:SwineManureSamplingProtocolandMethodology(TimSexton)FortheSwinecharacterizationstudyinPennsylvania,manuresamplesaretakenfromunderfloordeeppitstorageofeachbarnlocatedonthefarmvisited.Thesamplesfromeachbarnaremixedtogetherunlessthegrowerindicatedthatthemanurefromeachbarnistreateddifferentlyonseparatefields.Thesamplesaremixedinaplasticbucketandtransferredto500mlbottles,labeled,refrigerateduntilpreparedforshippingtoClemsonandPSUlaboratories.SamplesaretakenusingaTeflonLiquidPointCupSamplerwithlid,controlledinthehandlesothatsamplestakenfromtheunderhousestoragecanbetakenatvaryingdepths,asmixingofthestorageisnotfeasible.Thesamplerisinsertedintothemanureinverteduntilthedesireddepthisreachedinthepit.Itisthenturnedoverandtheleverinthehandleispushedsothatmanurecanbegathered.Sincethe
19
pitsaresixfeetdeepsamplesaretakenat1.5ft.,3.0ft.and4.5ft.Thesamplesarepouredintoabucketmixedandthenthecompositesampleisdeliveredinto500mllabeledbottles,refrigerateduntilshipping.ThisprocedureisconsistentwithPSU’sAgronomyFactSheet#69“ManureSamplingforNutrientManagementPlanning".AllEquipmentisthenwashed,andsprayeddownwitha10%solutionofVircondriedandplacedseparatelyfromanysamplingmaterialasspelledoutintheBio-SecurityProtocol.
Appendix3:PennStateFactSheet#69,ManureSamplingforNutrientManagementPlanning
(tobeinsertedorattached)Appendix4:QualityControlProtocolforSwineCharacterizationStudy(TimSexton)
AsaCo-principalinvestigatoroftheSwineCharacterizationStudy,itistheresponsibilityofTimSextontomakesurethattheIRBstandardsaremetandfollowed,thatthefarmerinterviewproceduresaremaintained,thesamplingproceduresoutlinedarefollowed,andthebio-securityproceduresarestrictlyadheredto.Atthebeginningoftheproject,Imetwiththeintern,JordanKristoffandexplainedtheprotocolsandthesecurityissuesbothwithpersonaldatathatwouldbecollected,theroutinesthatwouldbeexpected,thestrictbio-securityproceduresthatwouldberequiredonallfarmvisits,andtheIRBprocessthatwouldalsoberequired.TheinternwasawardedaVTcomputersothatnoinformationcollectedwouldbestoredonanyDCRorgovernmentrelatedserver,orcomputerorstoragedevice.Allhandwrittendatasheetsandnotesarekeptinasecurelocation,withaccessonlytotheinternandtheCo-PI.TheCo-PIcheckedthedatabasethatwascreatedonaweeklybasisforjournalentryerrors,andentriesthatappearedtobeoutsidethenorm,andrequestedthattheinternsfollowbackupwiththosefarmerstoseeiftheycoulddeterminewhytheinformationgatheredmightbeoutsidethenorm.ThedatacollectedfromSmithfieldHogProductionDivisionismaintainedononedatasheet,andtheCountryViewFamilyFarmsdatabaseismaintainedonanothertoinsurethatthereisnocrosscontaminationofdatacollected.Theinternisquizzedonaregularbasistomakesurethatsheiscontinuingtofollowthequestioningprocessforallfarmers,thatthesamplingproceduresarethesame,andthatthebio-securityproceduresarebeingadheredto.InformationforwardedtotheVTand/orPSUPIisalsocopiedtothisPIsothatifaquestionarises,thisPIhastheabilitytoanswerifpossible.


![swine flu kbk-1.ppt [Read-Only]ocw.usu.ac.id/.../1110000141-tropical-medicine/tmd175_slide_swine_… · MAP of H1 N1 Swine Flu. Swine Influenza (Flu) Swine Influenza (swine flu) is](https://img.pdfslide.us/doc/110x75/5f5a2f7aee204b1010391ac9/swine-flu-kbk-1ppt-read-onlyocwusuacid1110000141-tropical-medicinetmd175slideswine.jpg)