Embed Size (px)
Citation preview
2019
July 2019
LPC NO. 12 (2019)
Recommendations for the National Minimum Wage


Primary aim:
To have a minimum wage that provides an incentive to work,
is set at a rate that is both fair and sustainable, and helps as
many people as possible, without a significant adverse effect
on competitiveness or a significant negative effect on
employment.

Contents
Overview 1
1 Introduction 4
2 Minimum Wage in Ireland 11
3 National Minimum Wage Statistics 18
4 The Economic Context 25
5 The Irish Labour Market 39
6 Compliance 55
7 National Minimum Wage and Tax and
Benefit System
58
8 Conclusions and Recommendations 61
Minority Report
Appendices
64
i-9


1
Overview
There is international variance in the mechanisms used to set minimum wages. Since 2015,
the Low Pay Commission (LPC) has set down the issues and principles which it considers
as of particular importance in terms of the concept of a minimum wage, and the approach
most suited in an Irish context. By and large these issues and principles remain the same in
2019.
The OECD carried out a review of the role of minimum wages following the economic crisis.
They highlight some underlying principles of the role of minimum wages and note “use
minimum wages as a tool to raise wages at the bottom of the wage ladder, but accompany
them with other tax and benefit measures to effectively fight poverty in and out of work”1.
Thus, minimum wages alone are not sufficient as a poverty alleviation strategy. Coordinated
policies in areas such as housing, childcare and transport are also required.
The Low Pay Commission is of the view that:
1. A National Minimum Wage (NMW) provides the best model for Ireland to
establish a ‘pay floor’ below which no-one should be expected to work
The rate should be simple and straight-forward. The Commission continues to believe
that, in a small country such as Ireland, regional rates would prove unduly complex
and could not be targeted sufficiently (e.g. people often live and work in different areas
and as such have different housing costs, for example.)
2. When setting the NMW the LPC should, among a range of factors, take
cognisance of the level of the minimum wage relative to median pay.
In order to avoid growth in income inequality and to limit the employment effects of
minimum wage, changes in the value of the minimum wage should take cognisance of
the median rate of pay of employees. There are a number of reasons for doing this.
Firstly, a comparison of the minimum wage to the median wage provides an indication
of how binding a given minimum wage is likely to be. Secondly, this comparison
provides a benchmark for making comparisons over time and across countries.
Thirdly, the median wage may provide a useful reference point when deciding what a
reasonable minimum wage should be. The inter-quartile range of minimum wage bite
(minimum wage level relative to median wage of full-time workers) currently stands at
35-86 percent in OECD countries.
1 OECD (2015) OECD Employment Outlook 2015
2
3. Any changes to the National Minimum Wage must take place on an incremental
basis to avoid negative impacts on jobs and on Ireland’s competitiveness,
particularly given the backdrop of Brexit.
Ireland’s current NMW is already amongst the highest in the EU in absolute terms, and
a negative impact on competitiveness could undermine the growth that has been
achieved in recent years. However commissioned research indicates that previous
minimum wage increases recommended by the Low Pay Commission have had little
effect on employment, while reducing wage inequality.2
4. Decisions in relation to changes to the National Minimum Wage must be made
on a clear evidence base.
The Minimum Wage (Low Pay Commission) Act 2015 charges the members of the
Commission with making its recommendations based on a set of clearly identified
criteria (see following Chapter).
Thus, in making our recommendation for the minimum wage we have had regard to the
matters which the Minimum Wage (Low Pay Commission) Act 2015 sets down for
consideration, and we have taken account of the following:
Strong increases in employment have taken place and economic predictions indicate
that Ireland may reach close to full employment in 2019.
The Irish economy has experienced growth in domestic demand and personal
consumption.
The recommendations made by the Commission are on the basis of an orderly exit
from the EU by the United Kingdom.
The costs of childcare, housing and transport continue to grow. They are significant
issues for minimum wage and low pay workers – these issues cannot be resolved by
increases in the NMW alone.
Growth which was initially focussed on Dublin has spread to all regions of the
country, but not equally.
Across most sectors, both average weekly and average hourly earnings have
increased.
Level of inflation
2ESRI (2018) Estimating the effect of an increase in the Minimum Wage on hours worked and
employment in Ireland- https://www.esri.ie/system/files/media/file-uploads/2018-04/BKMNEXT354.pdf

3
Recommendations
In light of its conclusions as outlined above the Commission recommends the following:
1. That the rate of the National Minimum Wage for an experienced adult worker be fixed
at an hourly rate of €10.10. This recommendation assumes an orderly transition for
the exit of the UK from the European Union.
2. The Commission for the third time strongly recommends that provision should be
made for the display of basic entitlements in all places of employment where the
minimum wage is in operation. See Appendix 7 for suggested information to be
provided.
3. Similarly, the Commission recommends that, the Government should remove the
anomaly created by the sudden increase in the rate of employer’s PRSI from 8.6% to
10.85 % on weekly earnings of €386. The Commission is of the view that this issue
has reached a critical juncture given the recommended increase in the NMW, and
stresses the need for the Government to address this issue.
The recommendation on the hourly rate is supported by six of the nine members of the
Commission. The recommendation is not supported by three members of the Commission.
Those members have submitted minority statements to the Report, which follow the main
body of the Report.
Recommendations 2 and 3 are supported unanimously by all 9 members of the Commission.

4
Chapter 1 Introduction
National Minimum Wage (Low Pay Commission) Act 2015
Under the legislation establishing the Low Pay Commission, the National Minimum Wage
(Low Pay Commission) Act 2015, the duty of the Commission is determined as being to
“… make recommendations to the Minister regarding the national minimum hourly rate
of pay that—
(a) is designed to assist as many low paid workers as is reasonably practicable,
(b) is set at a rate that is both fair and sustainable,
(c) where adjustment is appropriate, is adjusted incrementally, and
(d) over time, is progressively increased,
without creating significant adverse consequences for employment or competitiveness.”
Our remit, and the legislation, require that the Commission give consideration to a range of
issues in coming to a decision on a recommendation to the Minister for an appropriate rate
for the national minimum wage (NMW). Some of the issues are, essentially, matters of fact,
while others necessitate an element of assessment and appraisal, and considered
judgement.
The particular issues the Commission is obliged to have regard to in considering its
recommendation are —
(a) changes in earnings during the relevant period,
(b) changes in currency exchange rates during the relevant period,
(c) changes in income distribution during the relevant period,
(d) whether during the relevant period—
(i) unemployment has been increasing or decreasing,
(ii) employment has been increasing or decreasing, and
(iii) productivity has been increasing or decreasing,
both generally and in the sectors most affected by the making of an order,
(e) international comparisons, particularly with Great Britain and Northern Ireland,
(f) the need for job creation, and
(g) the likely effect that any proposed order will have on —
(i) levels of employment and unemployment,
(ii) the cost of living, and
(iii) national competitiveness.
The legislation requires the Commission in making its recommendation to have regard to
these factors in the period since the most recent making of a National Minimum Wage Order.
The last Order in relation to the minimum wage was made on 4th October 2018 and it took
effect from 1 January 2019. This review therefore looks particularly at developments since
5
October 2018, insofar as data is available, or at developments in the period between the
data used in the making of the recommendations in 2018 and the latest available data (as of
30th June 2019).
The Low Pay Commission
The remit of the Low Pay Commission (LPC) is to recommend levels for the minimum wage
rates that will help as many low-paid workers as possible without any significant adverse
impact on employment or the economy. The recommendations that the LPC provides are
based on the best available evidence.
The Commission comprises of eight members and an independent Chairman. There are
members who have an understanding of the interests of employers, particularly small to
medium-sized employers and those operating in traditionally low pay sectors, and who
possess a good knowledge and understanding of the specific issues faced by Irish
businesses, particularly in relation to labour costs, and competitiveness. There are
members who have an understanding of the interests of employees, especially the impact of
living on the minimum wage and the sectors where low pay and minimum wage workers are
concentrated. There are also academics that have particular knowledge or expertise in
relation to economics, labour market economics, statistics, and employment law, as well as
proven competence in analysing and evaluating economic research and statistical analysis.
The term of office of a member of the Commission is three years from the date of
appointment. A person may not be a member of the Commission for more than two
consecutive terms of office but is otherwise eligible for re-appointment.
Current Commission Members
Dr Donal de Buitléir Chairperson
Caroline Fahey Head of Social Justice and Policy, Society of St.
Vincent de Paul
Vincent Jennings Chief Executive Officer, Convenience Stores and
Newsagents Association
Patricia King General Secretary of ICTU
Gerry Light Assistant General Secretary, Mandate Trade Union
Mary Mosse Former Lecturer in Economics, School of Business,
Waterford Institute of Technology
Sinead Mullins Senior Employer Relations Executive, IBEC
Tom Noonan Former Chief Executive, The Maxol Group
Frank Walsh Associate Professor, University College Dublin
The Secretariat for the Commission is provided by the Department of Employment Affairs
and Social Protection (John O’Toole, Principal Officer, Secretary to the Commission, Anne
6
Marie Doherty, Assistant Principal, Kate O’Donnell, Administrative Officer and Chris Smith,
Executive Officer).
1.1. Acknowledgements
We wish to acknowledge the contribution of Dr. Seamus McGuinness, Dr. Helen Russell, Mr.
Bertrand Maître and Dr. Paul Redmond of the Economic and Social Research Institute in
providing some of the research essential to our work through the research partnership
established in 2015.
We are very grateful to Mr. Brian Ring and Ms. Edel Flannery and their colleagues in the
Central Statistics Office for their help in developing very valuable new data sources. We
also wish to thank Mr. Tim Butcher, Chief Economist and Deputy Secretary at the UK Low
Pay Commission for his continued support, which is greatly appreciated.
We are also grateful to the individuals and organisations that gave presentations to the
Commission in response to our requests, including Ms. Rowena Dywer (Enterprise Ireland),
Mr. Andrea Garnero (OECD), Professor Edgar Morgenroth (DCU), Mr. Robert Sweeney
(TASC), and Mr. Brendan O’Connor and Mr Kevin Threadgold (Department of Finance) and
Mr. Michael Cunningham (Department of Employment Affairs and Social Protection).
We give our deepest thanks to all the individual employees and employers, as well as
representative groups, who gave their time to meet the Commissioners in Oral Hearings in
Dublin and Waterford.
Finally, we also wish to thank the Secretariat, John O’Toole, Anne Marie Doherty, Neil
Kavanagh, Kate O’Donnell and Chris Smith, for greatly facilitating our work throughout the
year, and for the diligent and efficient way they drafted our report. We would also like to
thank the previous secretary of the Commission from 2015 to April 2019, Máire Ní Chuirc, for
all of her assistance during that time.
1.2. The Work of the Commission
Meetings
The Commission met on 8 occasions since July 2018 and received a significant number of
submissions from various groups and individuals with an interest in NMW issues through its
annual consultation process and in general correspondence. The Chairman and members
of the Commission also met directly (on two occasions, in Dublin and Waterford) with a wide
range of stakeholders. These included, among others, individual workers and businesses,
employer and employee representative groups. This enabled the Commission to get as
broad an understanding as possible of the issues relating to the minimum wage.
Data
In the course of our work the Commission examined data from a wide range of sources, and
reviewed a broad variety of reports, papers and commentary. For statistical purposes we
7
relied principally on data from the CSO, Eurostat, OECD, ESRI, ECB, the Department of
Finance, and the National Competitiveness Council.
As reported in 2018 there are significant gaps in the data which would ideally be available to
assist in coming to a recommendation on the level of the minimum wage, and we continue to
seek to address this issue during the course of our work over the coming years. In this
regard, the research partnership with the Economic and Social Research Institute (ESRI) is
ongoing and continues to greatly enhance the body of data and research available in this
area.
The LPC/ESRI partnership is governed by a Steering Committee comprised of two
Commissioners and two senior members from the ESRI (the membership of the steering
committee is set out in Appendix 6. In addition, in the light of the central importance of data
to the effective functioning of the LPC, the Central Statistics Office (CSO) has, at the request
of the Commission, nominated an independent member to the Steering Committee to assist
in relation to technical and data matters.
Starting in 2016 a question relating to the National Minimum Wage has been included in the
Labour Force Survey (LFS), formerly the Quarterly National Household Survey (QNHS). This
has provided the Commission with up to date data as to the number of people on the NMW
as well as certain worker characteristics such as age, gender, nationality and sector of
employment.
While significant progress has been made in terms of data since the establishment of the
Commission, there remain substantial gaps in the data which should ideally be available for
the Commission on which to base its recommendations. In particular the Commission, as
previously highlighted, is of the view that data needs to be collected and made available
relating to firm level profitability, productivity and employee hourly earnings. Following the
introduction of General Data Protection Regulation (GDPR) in May 2018, the Commission
considers it vital that essential data continues to remain available to researchers and
Government Departments.
1.3. The Consultation Process and Oral Hearings
Consultation Process
In January 2019 the Commission invited submissions from the public regarding the National
Minimum Wage. In an effort to improve engagement with individuals on the National
Minimum Wage an advertising campaign was undertaken on social media and radio. There
was also a targeted emailing of both business-interest and employee-interest groups as well
as Universities, Institutes of Technology and Government Departments. It was noted that all
comments, observations, and submissions would be published subject to the Freedom of
Information Act, 2014. We received 65 submissions in 2019 in contrast with the 94
submissions received in 2018 (see Appendix 3 for a full list of submissions).
8
The Commission met with various groups and individuals during the course of the year
whose work or research was deemed to be of particular interest. An information day was
also held at which papers which the Commission deemed relevant to its work were
presented by the Department of Finance, Enterprise Ireland, the OECD, the UK Low Pay
Commission, TASC, Dublin City University and the Department of Employment Affairs and
Social Protection.
Stakeholder Views
The submissions which the Commission received fell into distinct categories. Those from
groups representing employer interests were generally opposed to any further increase in
the National Minimum Wage this year. It was noted, however, that in the case of an orderly
Brexit, an increase in line with inflation could be appropriate. These submissions cited
concerns over Brexit and the possibility that it could have a disproportionately negative effect
on sectors in which a significant number of NMW employees work (retail, hospitality,
agriculture etc.). Concerns were also raised about repercussive pay claims as a result of
NMW increases and the potential for further increases to impact negatively on economic
growth and competitiveness. A number of the submissions made by employers were in
favour of a NMW but felt that stability in the rate is essential, so employers can fix costs in
order to mitigate against external developments of which they have no control such as
Brexit.
Groups, such as trade unions and non-governmental organisations, representing employees
generally expressed the view that increases in the NMW are required. A number of
submissions, as in previous years, stated that the NMW is set too low and that a timetable
needs to be recommended by the Commission to take the NMW up to the level of the “Living
Wage”3. These submissions cited the cost of childcare and rent in Ireland and questioned
whether a person could afford a reasonable standard of living on the NMW as it currently
stands. However, employers generally expressed that these public policy issues are a
matter for government and responsibility should not be shifted to the employer.
The 32 submissions made by individuals were in favour of increasing the NMW,
recommending rates ranging from the current rate to €15.00 per hour. Reference was made
in these submissions to the difficulty of surviving on the current minimum wage in Ireland
given the high cost of rent, childcare and taxes and charges. Meanwhile individual
employers who employed minimum wage workers supported the view of employer
representative groups that the minimum wage should not be increased given the already
high costs for employers and the uncertainly created by Brexit.
Oral Hearings
The Commission held oral hearings in Waterford and Dublin over the course of the year. The
Waterford meeting included individuals on minimum wage and low pay, local employers,
3 The Living wage is calculated by the “Living Wage Technical Group” and is intended as a wage which will
provide a minimum essential standard of living. The living wage for 2018 is estimated at €11.90 per hour.
9
individuals on Community Employment schemes, student representatives and local trade
union activists. A number of common themes emerged:
1. The cost of childcare – The high cost of and lack of childcare was referenced by a
number of contributors as acting as a disincentive to work as well as the difficulty of
meeting such costs while working on the NMW.
2. The withdrawal of social welfare benefits as a disincentive to employment or to
work extra hours and/or days – Both employers and workers made regular
references to social welfare supports acting as a disincentive to work. The
Commission was informed that many employees are effectively inhibited from
working more than a certain number of hours or days as this will affect their social
welfare payments. The Working Family Payment, Disability Allowance, Rent
Supplement and medical cards were all referenced on multiple occasions as
supports – which are relied upon and valued by low paid employees – the loss of
which can act or are perceived to act as disincentives to work.4
3. Knock on pay claims as a result of NMW increases – A number of employers
advised that they experienced repercussive pay claims from staff earning above the
NMW due to NMW increases. The Commission was told that further substantial
increases would be difficult to bear.
4. A stigma associated with being on the NMW - Several individuals made reference
to a stigma associated with being on the NMW and the feeling that
experienced/qualified staff should not be kept on the NMW.
5. Exploitation of workers – The Commission heard accounts of individuals working
without contracts earning below the NMW. Reference was made to workers being
reluctant to seek assistance from the Workplace Relations Commission or other
bodies due to a fear that it would lead to negative consequences. This relates in
particular to undocumented workers in the economy including both migrants and
those working in the ‘informal economy’.
6. Irregular and uncertain hours – Irregular and uncertain hours of work were cited as
an issue especially for students who are relying on NMW jobs to fund college (other
State supports such as the SUSI grant are insufficient).5
7. Experience of living on the National Minimum Wage– Through the oral hearings
and the written submissions the Commission heard evidence of people struggling to
live while working on the NMW. Various representative groups said that in work
poverty was a particular issue for certain vulnerable groups such as lone parents.
4 In order to gain a better understanding of the interaction between social welfare payments and low pay and
minimum wage workers the Commission received a presentation from the Department of Employment Affairs and Social Protection. Information on selected income supports can be found in Appendix 5. 5 SUSI is the Student Grant Scheme is the main financial support scheme for students. The Scheme
is governed by legislation made under the Student Support Act 2011.
10
The Commission conducted a further set of hearings in Dublin with representatives from a
number of groups that had made submissions to the Commission or worked in areas of
particular interest to the Commission. Again common themes emerged as follows;
1. Most employer representative groups and individual employers expressed their view
at these hearings that the minimum wage should not be increased again in 2019.
They cited the negative impact of Brexit on sectors such as tourism and agriculture
as well as knock on claims for pay increases from those above the NMW following
NMW increases. Employer groups also stressed that the Commission must be
cognisant of regional differences in the economy.
2. Groups representing the unemployed and people on low pay meanwhile advocated
increasing the NMW over time so that it comes into line with the ‘living wage’. They
argued that issues such as precarious work and uncertain hours contracts mean that
while more people are in employment they are not necessarily working in jobs which
provide them with a decent standard of living.
3. Both employer and employee representatives were of the view that the high costs of
childcare and housing in Ireland continue to be challenges for employees, especially
those on the NMW.
1.4. Conclusions
The Commission continues to build on its evidence based approach to making its
recommendations each year. The stakeholder views submitted as part of the consultation
process and the evidence heard through oral hearings remain a key pillar of this approach.
The information day also continues to be a key support to the Commission in its work.
11
Chapter 2 The Minimum Wage in Ireland.
This chapter provides an overview of the National Minimum Wage in Ireland and the
changes in the rates over the years. It also details international comparisons of the
minimum wage.
2.1 The Introduction of the National Minimum Wage
The National Minimum Wage (NMW) was introduced in Ireland in 2000 as a social policy
commitment to protect workers considered to be most vulnerable and at risk of exploitation
and to protect against poverty. The Government of the time also recognised that, as a social
policy issue, the National Minimum Wage (NMW) had significant economic implications. The
stated purpose of the legislation was “to protect those workers who are vulnerable and prone
to being exploited, especially women and young people” while also having regard to the
need “to protect employment and competitiveness”.
The National Minimum Wage Commission was established in 1998 to advise the
Government on the best way to implement a national minimum wage. It recommended that
the minimum wage should be measured against the median earnings of all employees, and
that the initial rate for the national minimum wage should take into account employment,
overall economic conditions and competitiveness. These principles remain central to the
Low Pay Commission’s deliberations today.
2.2 The Establishment of the Low Pay Commission
In its Statement of Government Priorities 2014-2016, the Government, as part of its
commitment to ensure that the economic recovery was felt by low and middle-income
working families, committed to establishing the Low Pay Commission on a statutory basis.
The Commission is an independent, non-political body that takes specified economic and
social considerations into account in order to make annual recommendations to the
Government about the appropriate level of the minimum wage and related matters.
The establishment of the Low Pay Commission put in place an independent body that, taking
specified economic and social matters into account, advises the government on the National
Minimum Wage and related matters. The particular role of the Commission is to ensure that
any recommendation it makes to Government is evidence-based; utilising agreed data,
carrying out research and consultations with employers, workers and their representatives
and taking written and oral evidence from a wide range of organisations. This is to ensure
that any suggested changes to the National Minimum Wage have minimum adverse impact
on employment and competitiveness.
12
Prior to the establishment of the Low Pay Commission under the National Minimum Wage
Act 2000, the hourly rate of pay was declared by Order by the Minister and could be
reviewed with reference to prevailing national economic agreements or upon
recommendation by the Labour Court.
2.3 The National Minimum Wage
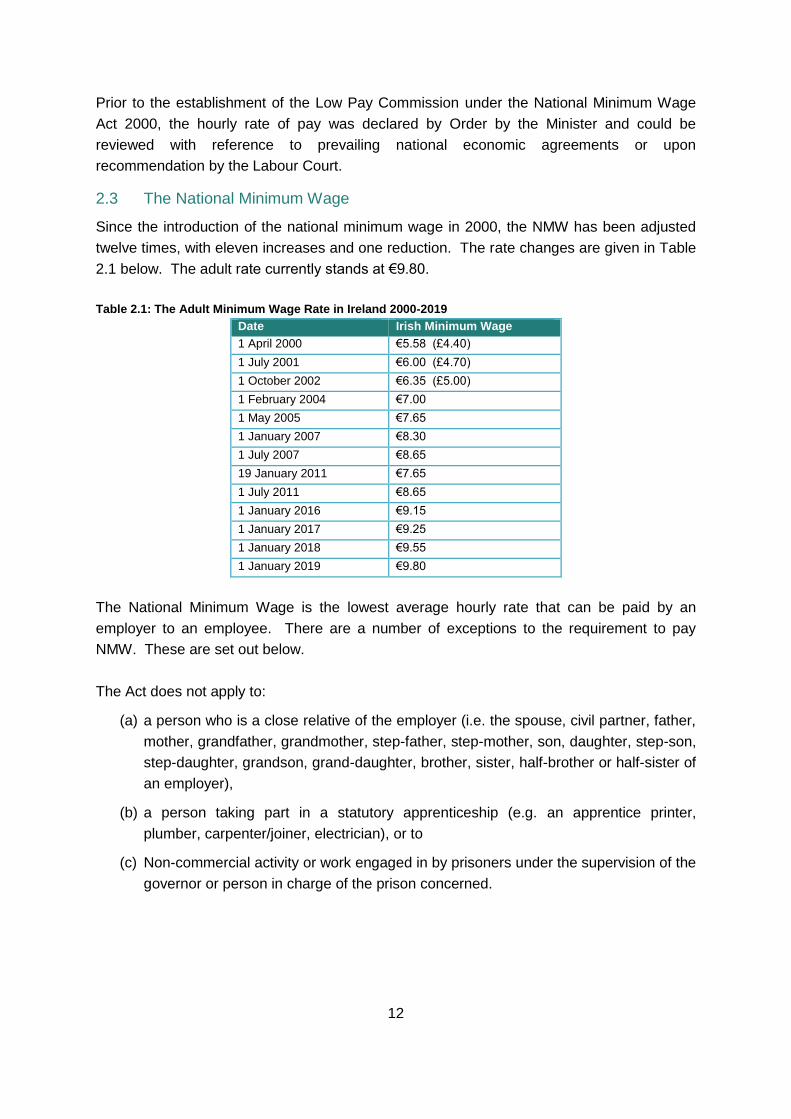
Since the introduction of the national minimum wage in 2000, the NMW has been adjusted
twelve times, with eleven increases and one reduction. The rate changes are given in Table
2.1 below. The adult rate currently stands at €9.80.
Table 2.1: The Adult Minimum Wage Rate in Ireland 2000-2019
Date Irish Minimum Wage
1 April 2000 €5.58 (£4.40)
1 July 2001 €6.00 (£4.70)
1 October 2002 €6.35 (£5.00)
1 February 2004 €7.00
1 May 2005 €7.65
1 January 2007 €8.30
1 July 2007 €8.65
19 January 2011 €7.65
1 July 2011 €8.65
1 January 2016 €9.15
1 January 2017 €9.25
1 January 2018 €9.55
1 January 2019 €9.80
The National Minimum Wage is the lowest average hourly rate that can be paid by an
employer to an employee. There are a number of exceptions to the requirement to pay
NMW. These are set out below.
The Act does not apply to:
(a) a person who is a close relative of the employer (i.e. the spouse, civil partner, father,
mother, grandfather, grandmother, step-father, step-mother, son, daughter, step-son,
step-daughter, grandson, grand-daughter, brother, sister, half-brother or half-sister of
an employer),
(b) a person taking part in a statutory apprenticeship (e.g. an apprentice printer,
plumber, carpenter/joiner, electrician), or to
(c) Non-commercial activity or work engaged in by prisoners under the supervision of the
governor or person in charge of the prison concerned.
13
2.4 Sub Minima Rates
The Commission undertook a review of the Sub-Minima rates as part of its work programme
and recommended, in 2017, abolishing the training rates and simplifying the youth rates by
moving to age related as opposed to experience based rates. The Commission’s
recommendations were accepted by Government and were introduced as part of the
Employment (Miscellaneous Provisions) Act 2018. The Commission commissioned
research by the ESRI and consulted widely on this matter before making their
recommendations.
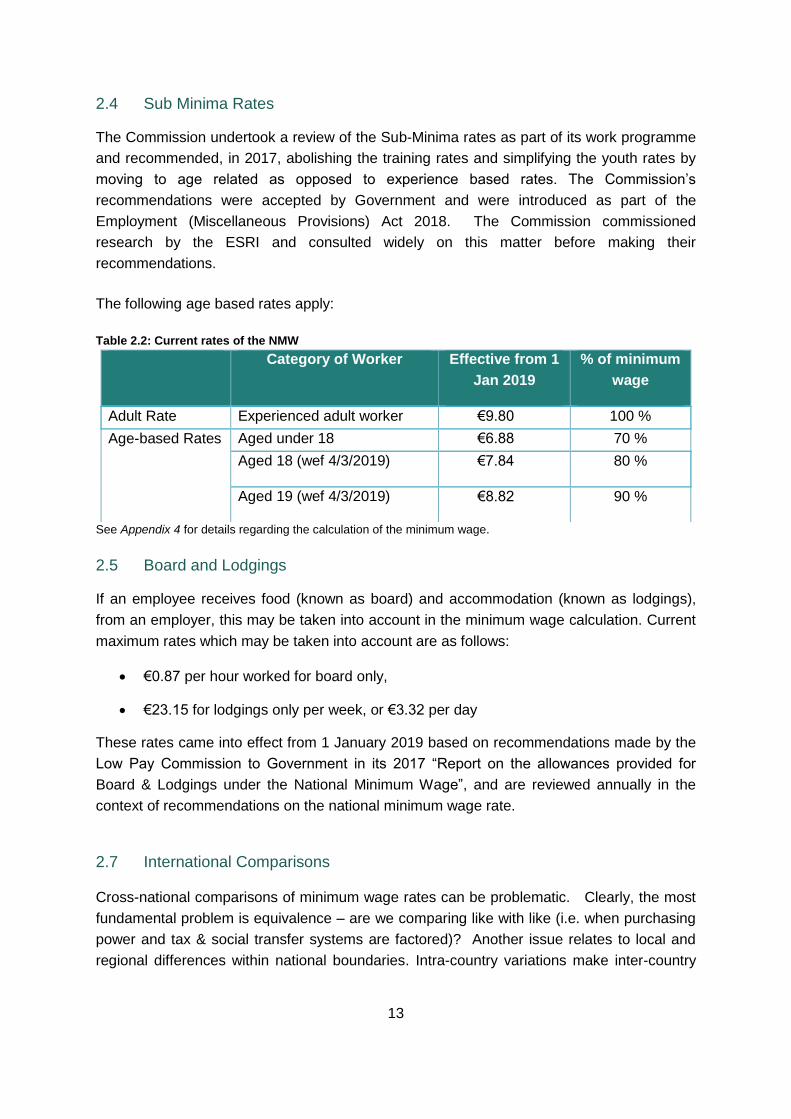
The following age based rates apply:
Table 2.2: Current rates of the NMW
See Appendix 4 for details regarding the calculation of the minimum wage.
2.5 Board and Lodgings
If an employee receives food (known as board) and accommodation (known as lodgings),
from an employer, this may be taken into account in the minimum wage calculation. Current
maximum rates which may be taken into account are as follows:
€0.87 per hour worked for board only,
€23.15 for lodgings only per week, or €3.32 per day
These rates came into effect from 1 January 2019 based on recommendations made by the
Low Pay Commission to Government in its 2017 “Report on the allowances provided for
Board & Lodgings under the National Minimum Wage”, and are reviewed annually in the
context of recommendations on the national minimum wage rate.
2.7 International Comparisons
Cross-national comparisons of minimum wage rates can be problematic. Clearly, the most
fundamental problem is equivalence – are we comparing like with like (i.e. when purchasing
power and tax & social transfer systems are factored)? Another issue relates to local and
regional differences within national boundaries. Intra-country variations make inter-country
Category of Worker Effective from 1
Jan 2019
% of minimum
wage
Adult Rate Experienced adult worker €9.80 100 %
Age-based Rates Aged under 18 €6.88 70 %
Aged 18 (wef 4/3/2019) €7.84 80 %
Aged 19 (wef 4/3/2019) €8.82 90 %
14
comparisons challenging. Regional variations in national minimum wages are well
established and well documented.
Currently, 22 out of the 28 EU member states have National Minimum Wages (Denmark,
Italy, Austria, Cyprus, Finland and Sweden are the exceptions, although these countries do
have centrally bargained minimum wages across a number of sectors). Comparing minimum
wages across countries is not without difficulties as many technical issues emerge, including
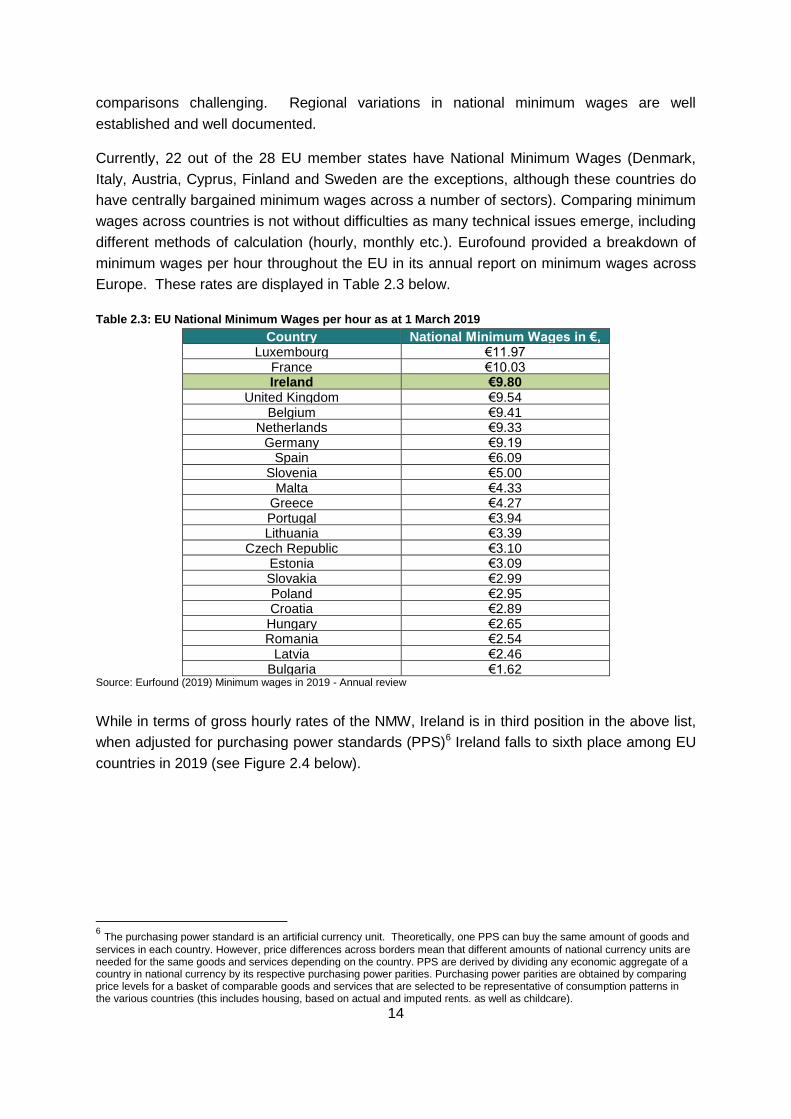
different methods of calculation (hourly, monthly etc.). Eurofound provided a breakdown of
minimum wages per hour throughout the EU in its annual report on minimum wages across
Europe. These rates are displayed in Table 2.3 below.
Table 2.3: EU National Minimum Wages per hour as at 1 March 2019
Country National Minimum Wages in €,
per hour Luxembourg €11.97 France €10.03 Ireland €9.80
United Kingdom €9.54 Belgium €9.41
Netherlands €9.33 Germany €9.19
Spain €6.09 Slovenia €5.00
Malta €4.33 Greece €4.27 Portugal €3.94 Lithuania €3.39
Czech Republic €3.10 Estonia €3.09 Slovakia €2.99 Poland €2.95 Croatia €2.89 Hungary €2.65 Romania €2.54
Latvia €2.46 Bulgaria €1.62
Source: Eurfound (2019) Minimum wages in 2019 - Annual review
While in terms of gross hourly rates of the NMW, Ireland is in third position in the above list,
when adjusted for purchasing power standards (PPS)6 Ireland falls to sixth place among EU
countries in 2019 (see Figure 2.4 below).
6 The purchasing power standard is an artificial currency unit. Theoretically, one PPS can buy the same amount of goods and
services in each country. However, price differences across borders mean that different amounts of national currency units are needed for the same goods and services depending on the country. PPS are derived by dividing any economic aggregate of a country in national currency by its respective purchasing power parities. Purchasing power parities are obtained by comparing price levels for a basket of comparable goods and services that are selected to be representative of consumption patterns in the various countries (this includes housing, based on actual and imputed rents. as well as childcare).
15
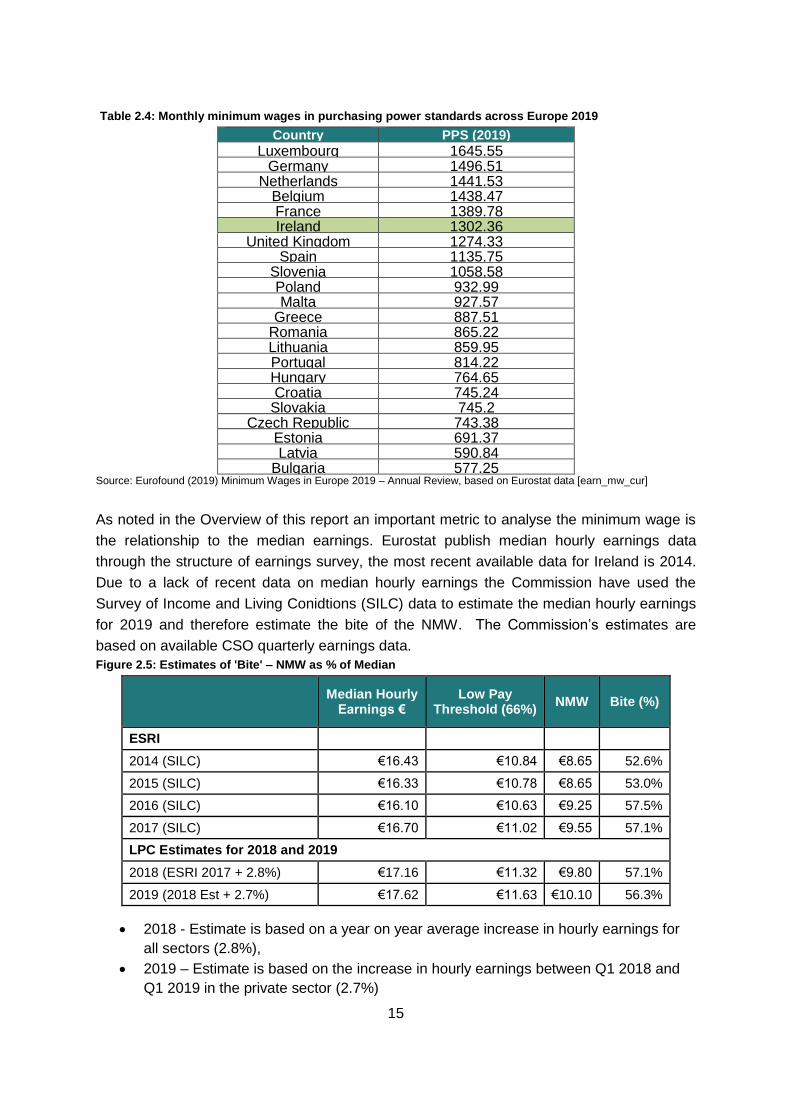
Table 2.4: Monthly minimum wages in purchasing power standards across Europe 2019
Country PPS (2019)
Luxembourg 1645.55 Germany 1496.51
Netherlands 1441.53 Belgium 1438.47 France 1389.78 Ireland 1302.36
United Kingdom 1274.33 Spain 1135.75
Slovenia 1058.58 Poland 932.99 Malta 927.57
Greece 887.51 Romania 865.22 Lithuania 859.95 Portugal 814.22 Hungary 764.65 Croatia 745.24
Slovakia 745.2 Czech Republic 743.38
Estonia 691.37 Latvia 590.84
Bulgaria 577.25 Source: Eurofound (2019) Minimum Wages in Europe 2019 – Annual Review, based on Eurostat data [earn_mw_cur]
As noted in the Overview of this report an important metric to analyse the minimum wage is
the relationship to the median earnings. Eurostat publish median hourly earnings data
through the structure of earnings survey, the most recent available data for Ireland is 2014.
Due to a lack of recent data on median hourly earnings the Commission have used the
Survey of Income and Living Conidtions (SILC) data to estimate the median hourly earnings
for 2019 and therefore estimate the bite of the NMW. The Commission’s estimates are
based on available CSO quarterly earnings data.
Figure 2.5: Estimates of 'Bite' – NMW as % of Median
Median Hourly
Earnings € Low Pay
Threshold (66%) NMW Bite (%)
ESRI
2014 (SILC) €16.43 €10.84 €8.65 52.6%
2015 (SILC) €16.33 €10.78 €8.65 53.0%
2016 (SILC) €16.10 €10.63 €9.25 57.5%
2017 (SILC) €16.70 €11.02 €9.55 57.1%
LPC Estimates for 2018 and 2019
2018 (ESRI 2017 + 2.8%) €17.16 €11.32 €9.80 57.1%
2019 (2018 Est + 2.7%) €17.62 €11.63 €10.10 56.3%
2018 - Estimate is based on a year on year average increase in hourly earnings for
all sectors (2.8%),
2019 – Estimate is based on the increase in hourly earnings between Q1 2018 and
Q1 2019 in the private sector (2.7%)
16
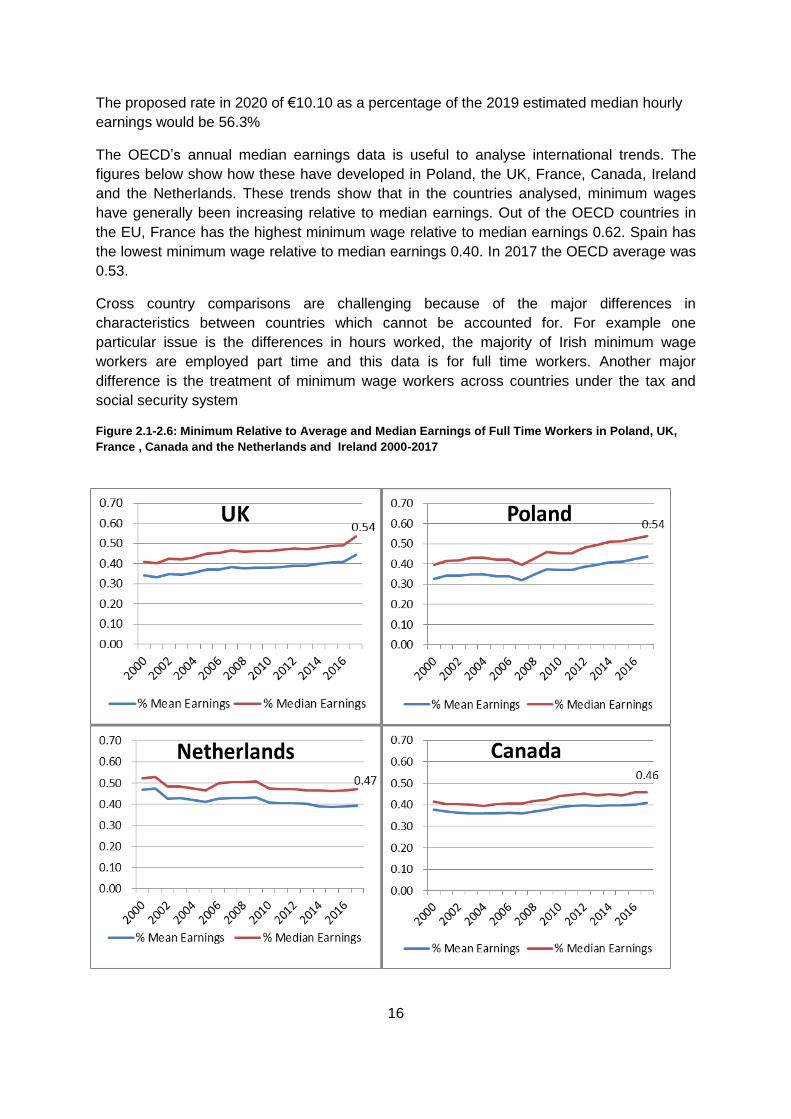
The proposed rate in 2020 of €10.10 as a percentage of the 2019 estimated median hourly
earnings would be 56.3%
The OECD’s annual median earnings data is useful to analyse international trends. The
figures below show how these have developed in Poland, the UK, France, Canada, Ireland
and the Netherlands. These trends show that in the countries analysed, minimum wages
have generally been increasing relative to median earnings. Out of the OECD countries in
the EU, France has the highest minimum wage relative to median earnings 0.62. Spain has
the lowest minimum wage relative to median earnings 0.40. In 2017 the OECD average was
0.53.
Cross country comparisons are challenging because of the major differences in
characteristics between countries which cannot be accounted for. For example one
particular issue is the differences in hours worked, the majority of Irish minimum wage
workers are employed part time and this data is for full time workers. Another major
difference is the treatment of minimum wage workers across countries under the tax and
social security system
Figure 2.1-2.6: Minimum Relative to Average and Median Earnings of Full Time Workers in Poland, UK,
France , Canada and the Netherlands and Ireland 2000-2017

17
Source: OECD iLibrary Database on Earnings
2.8 Setting the National Minimum Wage
Across the EU a number of different systems are used when setting the rate of the National
Minimum Wage. In Ireland, the UK7, Germany, France and Malta expert committees are
used to recommend the rate, albeit the systems which they use may vary (for instance,
indexation is used in France, Germany and Malta). The recommended rate is based on
tripartite agreement in a number of countries (such as Spain and Croatia) while others are
reached by agreement among social partners (such as Luxembourg and Estonia) or
occasionally via a unilateral government decision (e.g. Greece). In many countries some
combination of these methods is used to reach the recommended rate. Appendix 8 contains
a table outlining the various setting mechanisms across the EU.
2.10 Conclusions
While cross national comparisons of minimum wage rates can be difficult it can be said that
Ireland continues to pay one of the higher minimum wage rates in the EU. However, when
compared to median wage rates Ireland ranks lower due to the fact that Ireland has the
second highest median wage rates in Europe.
For minimum wage workers this means that while their hourly rate is high compared to other
EU member states, their overall income remains relatively low when compared to the wages
earned by others across the labour market.
7 The National Living Wage was introduced by the UK Chancellor in July 2015 for workers aged 25 and over.
Since then, the UK LPC has been tasked with recommending a path for the Living Wage to reach 60% of the UK median wage by 2020. For the other rates, which cover workers aged under 25 and apprentices, the UK LPC are asked to recommend rates which ‘help as many low-paid workers as possible without damaging their employment prospects’.

18
Chapter 3 National Minimum Wage Statistics
Since its establishment in 2015 the Low Pay Commission has identified a number of gaps in
data relating to the National Minimum Wage that would ideally be available on which to base
its conclusions and recommendations. In this context, the Commission reached agreement
with the Central Statistics Office (CSO) in 2016 to include a question on the NMW in its
Quarterly National Household Survey (QNHS), now called the Labour Force Survey (LFS).
This question commenced in Q2 2016 and, while the LFS is not designed to be an earnings
survey, the data collected gives us the first glimpse at quarterly NMW data across a wide-
range of criteria (a full breakdown of CSO NMW statistics can be found in Appendix 2).
As the question has now been asked over a number of quarters, the Commission is able to
gauge increases and decreases in the number of NMW workers by particular characteristics
and analyse trends on a regional and sectoral level.
3.1 National Minimum Wage Trends
Since the minimum wage question was added to the Labour Force Survey, it has greatly
improved the data available on the National Minimum Wage. Therefore, it is important to
analyse the trends since 2016. Figure 3.1 shows that the share of minimum wage workers
has reduced from 8.0% in Q4 2016 to 6.2% in Q4 2018. The average number of individuals
earning the national minimum wage or less in 2018 as a percentage of the total labour force
is 8.5%.
Figure 3.1: Share of Employees Classified by National Minimum Wage Earnings Status
Source: Labour Force Survey
19
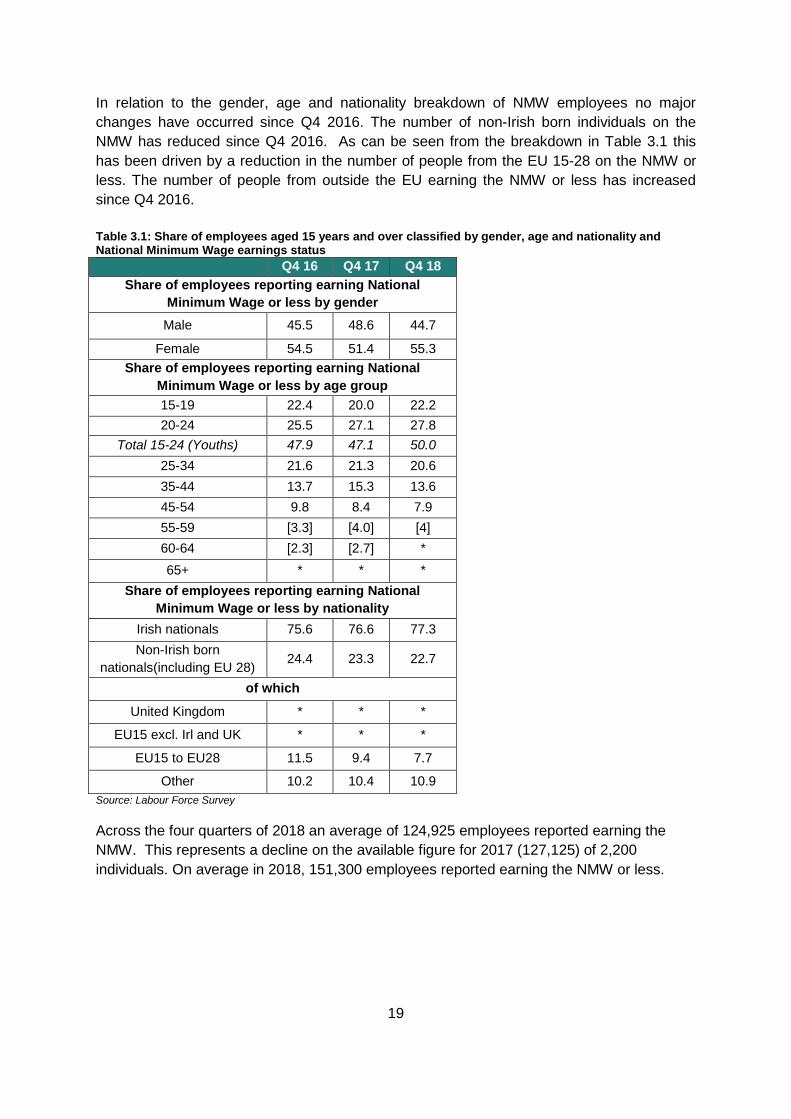
In relation to the gender, age and nationality breakdown of NMW employees no major
changes have occurred since Q4 2016. The number of non-Irish born individuals on the
NMW has reduced since Q4 2016. As can be seen from the breakdown in Table 3.1 this
has been driven by a reduction in the number of people from the EU 15-28 on the NMW or
less. The number of people from outside the EU earning the NMW or less has increased
since Q4 2016.
Table 3.1: Share of employees aged 15 years and over classified by gender, age and nationality and National Minimum Wage earnings status
Q4 16 Q4 17 Q4 18
Share of employees reporting earning National
Minimum Wage or less by gender
Male 45.5 48.6 44.7
Female 54.5 51.4 55.3
Share of employees reporting earning National
Minimum Wage or less by age group
15-19 22.4 20.0 22.2
20-24 25.5 27.1 27.8
Total 15-24 (Youths) 47.9 47.1 50.0
25-34 21.6 21.3 20.6
35-44 13.7 15.3 13.6
45-54 9.8 8.4 7.9
55-59 [3.3] [4.0] [4]
60-64 [2.3] [2.7] *
65+ * * *
Share of employees reporting earning National
Minimum Wage or less by nationality
Irish nationals 75.6 76.6 77.3
Non-Irish born
nationals(including EU 28) 24.4 23.3 22.7
of which
United Kingdom * * *
EU15 excl. Irl and UK * * *
EU15 to EU28 11.5 9.4 7.7
Other 10.2 10.4 10.9
Source: Labour Force Survey
Across the four quarters of 2018 an average of 124,925 employees reported earning the
NMW. This represents a decline on the available figure for 2017 (127,125) of 2,200
individuals. On average in 2018, 151,300 employees reported earning the NMW or less.

20
Table 3.2: Employees reporting earning the NMW
Indicator Q1 2018 Q2 2018 Q3 2018 Q4 2018 Average(2018)
Earning less than the NMW 28,600 23,400 29,000 24,500 26,375
Earning the NMW 146,100 118,300 122,600 112,700 124,925
Earning more than the NMW 1,559,800 1,613,800 1,648,900 1,679,600 1,625,525
Not Stated 133,100 157,600 141,400 133,300 141,350
Total 1,867,600 1,913,100 1,971,900 1,950,100 1,776,8258
Source: Derived from the CSO Labour Force Survey Q4 2018 by the LPC Secretariat
On average over the four quarters of 2018, NMW employees accounted for 7.0% of all
employees. Similar to previous years the number of NMW employees varied significantly
across quarters in 2018. Between the first and second quarter, NMW workers decreased by
27,800 (-19%) before increasing slightly in quarter three and then reducing again by 9,900 (-
8.1%) in the fourth quarter. Some of these variations may be due to seasonal factors.
In terms of gender, the table below shows that on average, females (54.6%) were more
likely to be in receipt of the NMW than males (45.4%). While there has been some variation
in the gender breakdown of the NMW employees from different data sources, this finding is
in line with research carried out by the Commission in 2016 which indicates women are more
likely to earn the NMW or less than men.
Table 3.3: Gender breakdown of employees earning the NMW or less (2018)
Period
Male Female
Number Proportion Number Proportion
Average 2018 68,825 45.4% 82,675 54.6%
Source: Derived from the CSO Labour Force Survey Q4 2018 by the LPC Secretariat
3.2 Sectors of Employment
Table 3.4 below provides the average number of NMW employees by certain sectors as well
as the proportion of NMW workers in these sectors. These sectors have sufficient numbers
of employees with stated earnings of the NMW or less for the CSO to report on. It is not
possible to separately report the number of NMW workers in the Agriculture, Forestry and
Fishing sector because this data is not collected by the CSO.
Table 3.4: Employees earning the NMW or less by Sector (2018)
Sector Average Number of employees
earning the NMW or less
Proportion of employees within each
sector earning the NMW or less
Accommodation & Food 43,275 29.8%
Wholesale & Retail 40,250 16.2%
Administrative & Support Services 9,400 12.2%
Construction 7,400 9.0%
Industry 13,875 5.7%
8 Respondents identified as ‘Not stated’ are excluded from the denominator in calculating the share or proportion
of all respondents on the NMW.
21
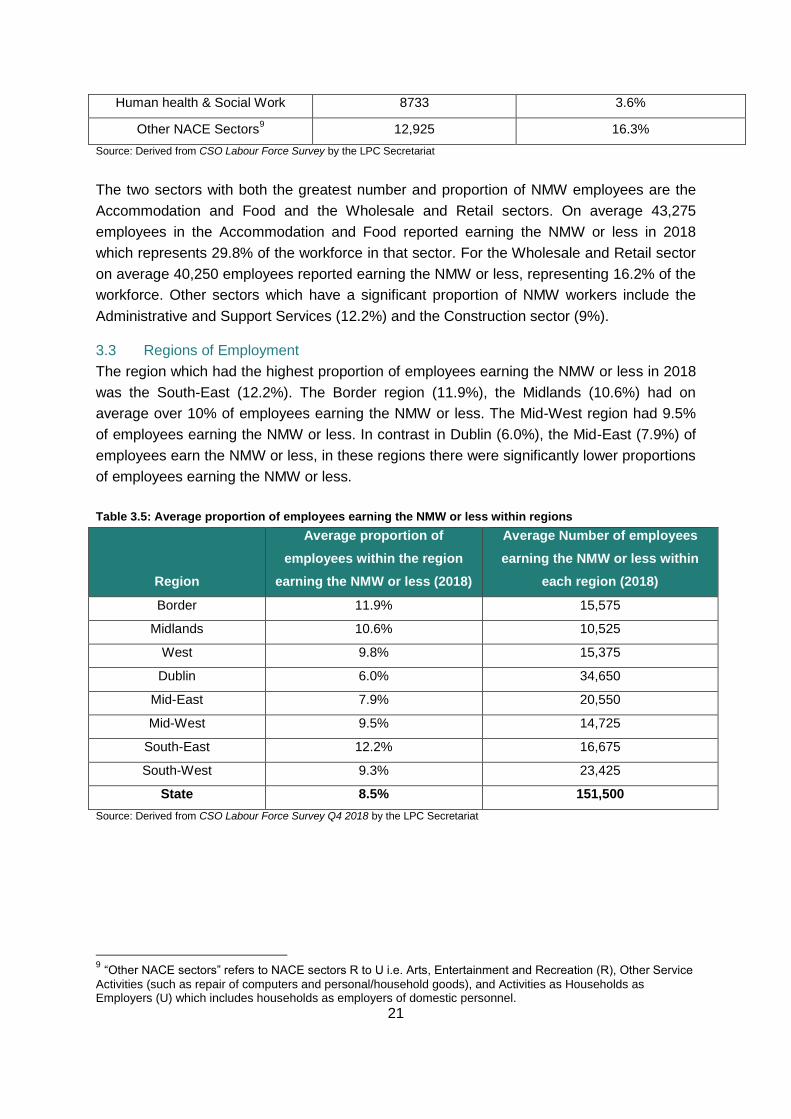
Human health & Social Work 8733 3.6%
Other NACE Sectors9 12,925 16.3%
Source: Derived from CSO Labour Force Survey by the LPC Secretariat
The two sectors with both the greatest number and proportion of NMW employees are the
Accommodation and Food and the Wholesale and Retail sectors. On average 43,275
employees in the Accommodation and Food reported earning the NMW or less in 2018
which represents 29.8% of the workforce in that sector. For the Wholesale and Retail sector
on average 40,250 employees reported earning the NMW or less, representing 16.2% of the
workforce. Other sectors which have a significant proportion of NMW workers include the
Administrative and Support Services (12.2%) and the Construction sector (9%).
3.3 Regions of Employment
The region which had the highest proportion of employees earning the NMW or less in 2018
was the South-East (12.2%). The Border region (11.9%), the Midlands (10.6%) had on
average over 10% of employees earning the NMW or less. The Mid-West region had 9.5%
of employees earning the NMW or less. In contrast in Dublin (6.0%), the Mid-East (7.9%) of
employees earn the NMW or less, in these regions there were significantly lower proportions
of employees earning the NMW or less.
Table 3.5: Average proportion of employees earning the NMW or less within regions
Region
Average proportion of
employees within the region
earning the NMW or less (2018)
Average Number of employees
earning the NMW or less within
each region (2018)
Border 11.9% 15,575
Midlands 10.6% 10,525
West 9.8% 15,375
Dublin 6.0% 34,650
Mid-East 7.9% 20,550
Mid-West 9.5% 14,725
South-East 12.2% 16,675
South-West 9.3% 23,425
State 8.5% 151,500
Source: Derived from CSO Labour Force Survey Q4 2018 by the LPC Secretariat
9 “Other NACE sectors” refers to NACE sectors R to U i.e. Arts, Entertainment and Recreation (R), Other Service
Activities (such as repair of computers and personal/household goods), and Activities as Households as Employers (U) which includes households as employers of domestic personnel.
22
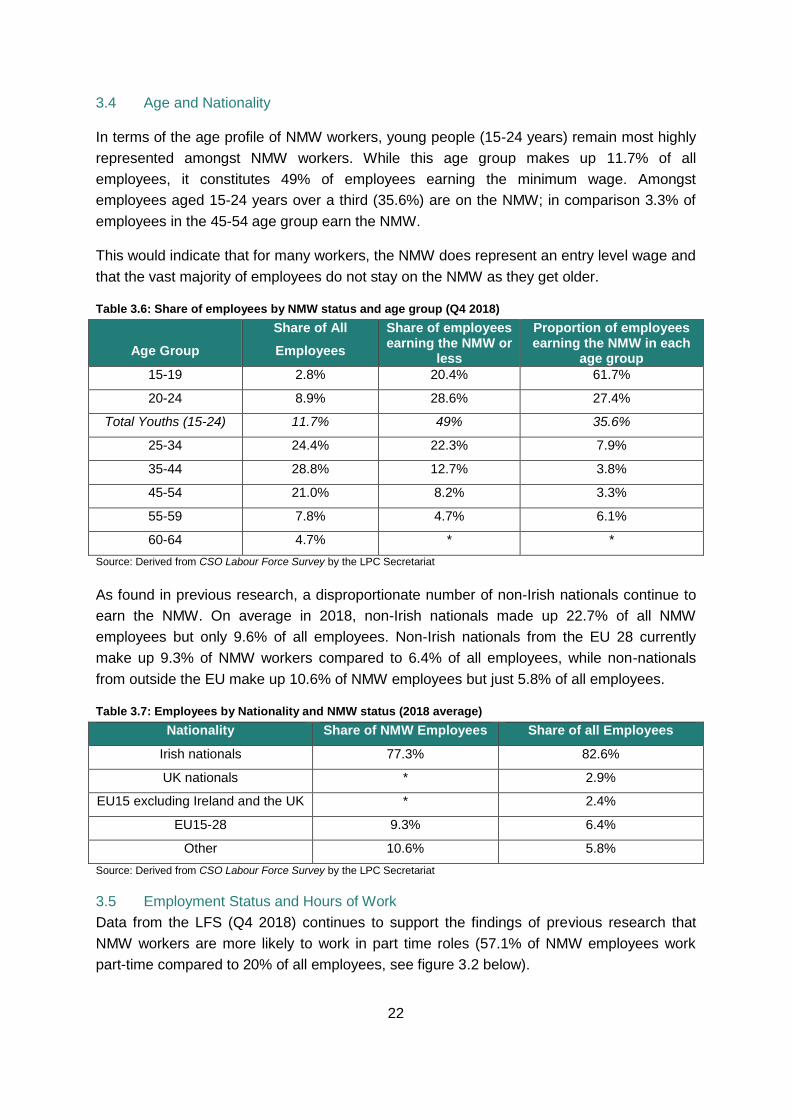
3.4 Age and Nationality
In terms of the age profile of NMW workers, young people (15-24 years) remain most highly
represented amongst NMW workers. While this age group makes up 11.7% of all
employees, it constitutes 49% of employees earning the minimum wage. Amongst
employees aged 15-24 years over a third (35.6%) are on the NMW; in comparison 3.3% of
employees in the 45-54 age group earn the NMW.
This would indicate that for many workers, the NMW does represent an entry level wage and
that the vast majority of employees do not stay on the NMW as they get older.
Table 3.6: Share of employees by NMW status and age group (Q4 2018)
Age Group
Share of All
Employees
Share of employees earning the NMW or
less
Proportion of employees earning the NMW in each
age group
15-19 2.8% 20.4% 61.7%
20-24 8.9% 28.6% 27.4%
Total Youths (15-24) 11.7% 49% 35.6%
25-34 24.4% 22.3% 7.9%
35-44 28.8% 12.7% 3.8%
45-54 21.0% 8.2% 3.3%
55-59 7.8% 4.7% 6.1%
60-64 4.7% * *
Source: Derived from CSO Labour Force Survey by the LPC Secretariat
As found in previous research, a disproportionate number of non-Irish nationals continue to
earn the NMW. On average in 2018, non-Irish nationals made up 22.7% of all NMW
employees but only 9.6% of all employees. Non-Irish nationals from the EU 28 currently
make up 9.3% of NMW workers compared to 6.4% of all employees, while non-nationals
from outside the EU make up 10.6% of NMW employees but just 5.8% of all employees.
Table 3.7: Employees by Nationality and NMW status (2018 average)
Nationality Share of NMW Employees Share of all Employees
Irish nationals 77.3% 82.6%
UK nationals * 2.9%
EU15 excluding Ireland and the UK * 2.4%
EU15-28 9.3% 6.4%
Other 10.6% 5.8%
Source: Derived from CSO Labour Force Survey by the LPC Secretariat
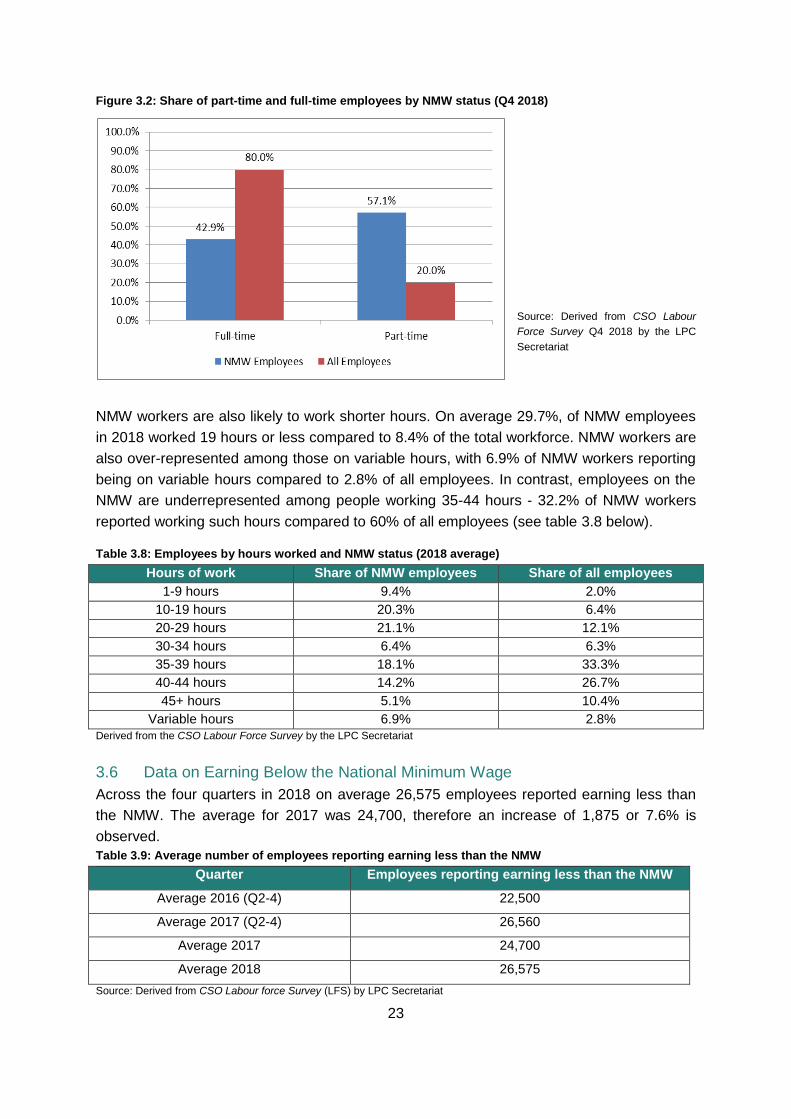
3.5 Employment Status and Hours of Work
Data from the LFS (Q4 2018) continues to support the findings of previous research that
NMW workers are more likely to work in part time roles (57.1% of NMW employees work
part-time compared to 20% of all employees, see figure 3.2 below).
23
Figure 3.2: Share of part-time and full-time employees by NMW status (Q4 2018)
Source: Derived from CSO Labour
Force Survey Q4 2018 by the LPC
Secretariat
NMW workers are also likely to work shorter hours. On average 29.7%, of NMW employees
in 2018 worked 19 hours or less compared to 8.4% of the total workforce. NMW workers are
also over-represented among those on variable hours, with 6.9% of NMW workers reporting
being on variable hours compared to 2.8% of all employees. In contrast, employees on the
NMW are underrepresented among people working 35-44 hours - 32.2% of NMW workers
reported working such hours compared to 60% of all employees (see table 3.8 below).
Table 3.8: Employees by hours worked and NMW status (2018 average)
Hours of work Share of NMW employees Share of all employees
1-9 hours 9.4% 2.0%
10-19 hours 20.3% 6.4%
20-29 hours 21.1% 12.1%
30-34 hours 6.4% 6.3%
35-39 hours 18.1% 33.3%
40-44 hours 14.2% 26.7%
45+ hours 5.1% 10.4%
Variable hours 6.9% 2.8%
Derived from the CSO Labour Force Survey by the LPC Secretariat
3.6 Data on Earning Below the National Minimum Wage
Across the four quarters in 2018 on average 26,575 employees reported earning less than
the NMW. The average for 2017 was 24,700, therefore an increase of 1,875 or 7.6% is
observed.
Table 3.9: Average number of employees reporting earning less than the NMW
Quarter Employees reporting earning less than the NMW
Average 2016 (Q2-4) 22,500
Average 2017 (Q2-4) 26,560
Average 2017 24,700
Average 2018 26,575
Source: Derived from CSO Labour force Survey (LFS) by LPC Secretariat
24
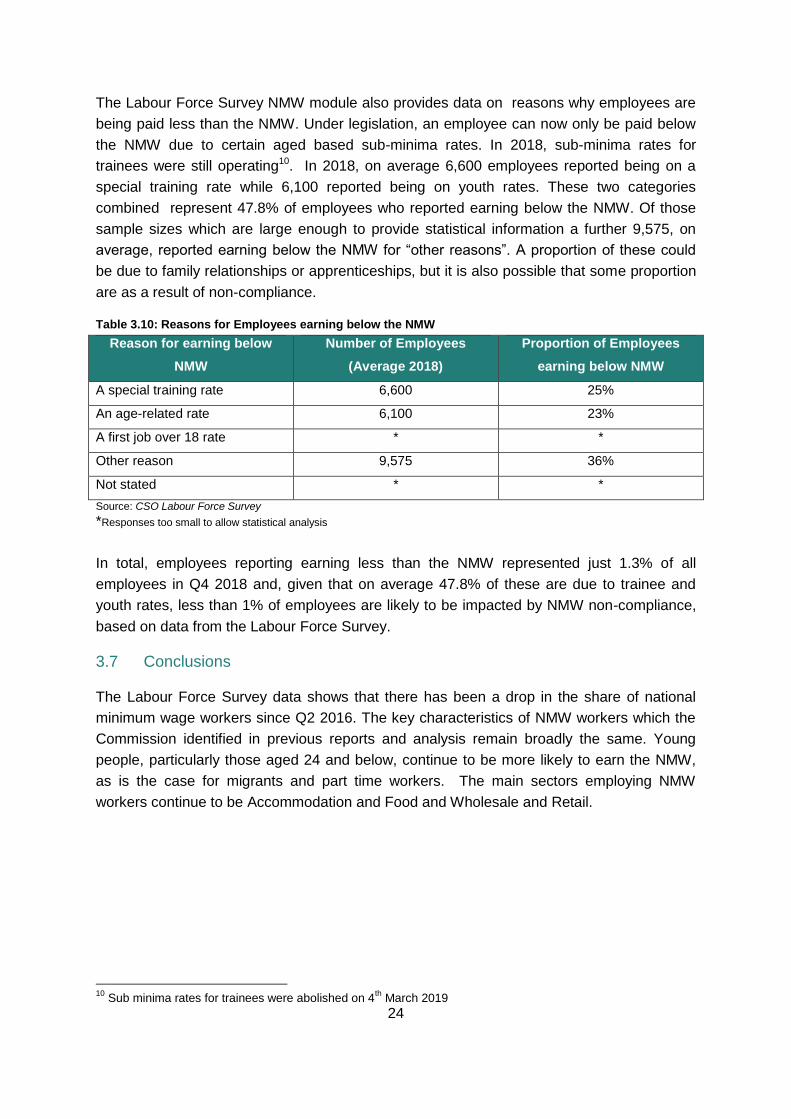
The Labour Force Survey NMW module also provides data on reasons why employees are
being paid less than the NMW. Under legislation, an employee can now only be paid below
the NMW due to certain aged based sub-minima rates. In 2018, sub-minima rates for
trainees were still operating10. In 2018, on average 6,600 employees reported being on a
special training rate while 6,100 reported being on youth rates. These two categories
combined represent 47.8% of employees who reported earning below the NMW. Of those
sample sizes which are large enough to provide statistical information a further 9,575, on
average, reported earning below the NMW for “other reasons”. A proportion of these could
be due to family relationships or apprenticeships, but it is also possible that some proportion
are as a result of non-compliance.
Table 3.10: Reasons for Employees earning below the NMW
Reason for earning below
NMW
Number of Employees
(Average 2018)
Proportion of Employees
earning below NMW
A special training rate 6,600 25%
An age-related rate 6,100 23%
A first job over 18 rate * *
Other reason 9,575 36%
Not stated * *
Source: CSO Labour Force Survey
*Responses too small to allow statistical analysis
In total, employees reporting earning less than the NMW represented just 1.3% of all
employees in Q4 2018 and, given that on average 47.8% of these are due to trainee and
youth rates, less than 1% of employees are likely to be impacted by NMW non-compliance,
based on data from the Labour Force Survey.
3.7 Conclusions
The Labour Force Survey data shows that there has been a drop in the share of national
minimum wage workers since Q2 2016. The key characteristics of NMW workers which the
Commission identified in previous reports and analysis remain broadly the same. Young
people, particularly those aged 24 and below, continue to be more likely to earn the NMW,
as is the case for migrants and part time workers. The main sectors employing NMW
workers continue to be Accommodation and Food and Wholesale and Retail.
10
Sub minima rates for trainees were abolished on 4th
March 2019
25
Chapter 4 The Economic Context
4.1. The Economic Context
This chapter examines trends and developments in a range of factors which provide an
overview of how the Irish economy is performing, and which have been considered in
facilitating our analysis on the National Minimum Wage.
4.2. An Overview of the Global Economy
The IMF11 notes that global growth is set to slow from 3.6 percent in 2018 to 3.3 percent in
2019, before returning to 3.6 percent in 2020. The euro area has lost some growth
momentum due to business and consumer sentiment weakening and German car production
reducing. Outside of Europe, trade tensions have increased which has weakened business
confidence and as a result financial conditions have become tighter for emerging economies
and later for advanced economies. Although the IMF points out that if the major trade
tensions could be resolved global growth could rise surprisingly, they add this is unlikely.
The European Commission’s analysis is that the external trading environment and
uncertainty about Brexit are causing certain disruptions and slowed growth but internally in
most member states domestic demand is remaining relatively strong due to employment
growth. The European Commission12 notes that a combination of ‘rising wages, muted
inflation and supportive fiscal measures in some Member states’ will shape how consumer
spending unfolds going forward.
4.3. An Overview of Irish Economic Performance
Due to the small, open nature of the economy and the strong presence of multinational
companies, the Economic Statistical Review Group have recommended that a Modified
Gross National Income (GNI*) indictor is used to analyse the Irish economy.
The CSO note that GNI* is “designed to exclude globalisation effects that are
disproportionately impacting the measurement of the size of the Irish economy”13.
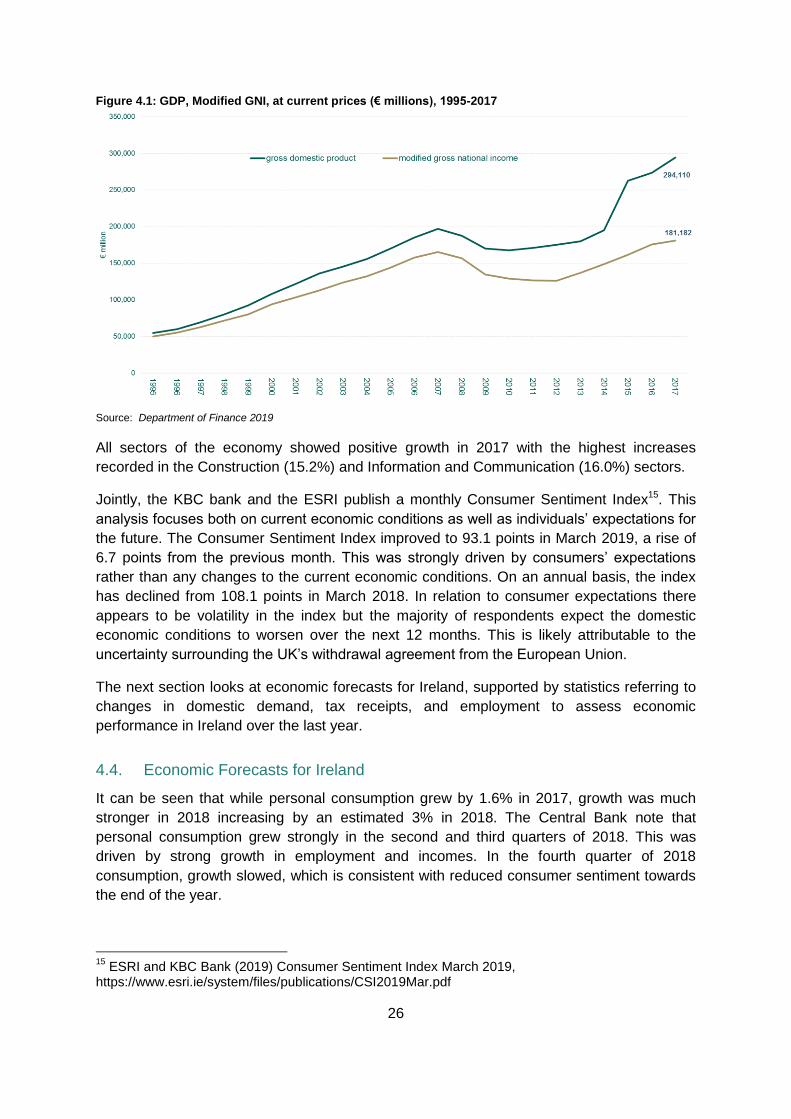
Figure 4.1 below displays the values of GDP and Modified GNI (GNI*), at current market
prices for the period from 1995-2017. An upward trajectory can be seen in the each of these
measures of the economy in recent years.
Although overall the Irish economy appears to be performing well since the economic
recession it is important to observe how different the growth rate of the economy is when
GNI* is used compared to GDP.14
11 International Monetary Fund World Economic Outlook, April 2019 12 European Economic Forecast. Spring 2019, https://ec.europa.eu/info/sites/info/files/economy-finance/ip102_en.pdf 13 CSO (2017) National Income and Expenditure 2017 https://www.cso.ie/en/releasesandpublications/ep/p-nie/nie2017/mgni/ 14 The Low Pay Commission uses GNI* for their analysis as it reflects the Ireland’s economic performance more accurately than GDP.
26
Figure 4.1: GDP, Modified GNI, at current prices (€ millions), 1995-2017
Source: Department of Finance 2019
All sectors of the economy showed positive growth in 2017 with the highest increases
recorded in the Construction (15.2%) and Information and Communication (16.0%) sectors.
Jointly, the KBC bank and the ESRI publish a monthly Consumer Sentiment Index15. This
analysis focuses both on current economic conditions as well as individuals’ expectations for
the future. The Consumer Sentiment Index improved to 93.1 points in March 2019, a rise of
6.7 points from the previous month. This was strongly driven by consumers’ expectations
rather than any changes to the current economic conditions. On an annual basis, the index
has declined from 108.1 points in March 2018. In relation to consumer expectations there
appears to be volatility in the index but the majority of respondents expect the domestic
economic conditions to worsen over the next 12 months. This is likely attributable to the
uncertainty surrounding the UK’s withdrawal agreement from the European Union.
The next section looks at economic forecasts for Ireland, supported by statistics referring to
changes in domestic demand, tax receipts, and employment to assess economic
performance in Ireland over the last year.
4.4. Economic Forecasts for Ireland
It can be seen that while personal consumption grew by 1.6% in 2017, growth was much
stronger in 2018 increasing by an estimated 3% in 2018. The Central Bank note that
personal consumption grew strongly in the second and third quarters of 2018. This was
driven by strong growth in employment and incomes. In the fourth quarter of 2018
consumption, growth slowed, which is consistent with reduced consumer sentiment towards
the end of the year.
15
ESRI and KBC Bank (2019) Consumer Sentiment Index March 2019, https://www.esri.ie/system/files/publications/CSI2019Mar.pdf
27
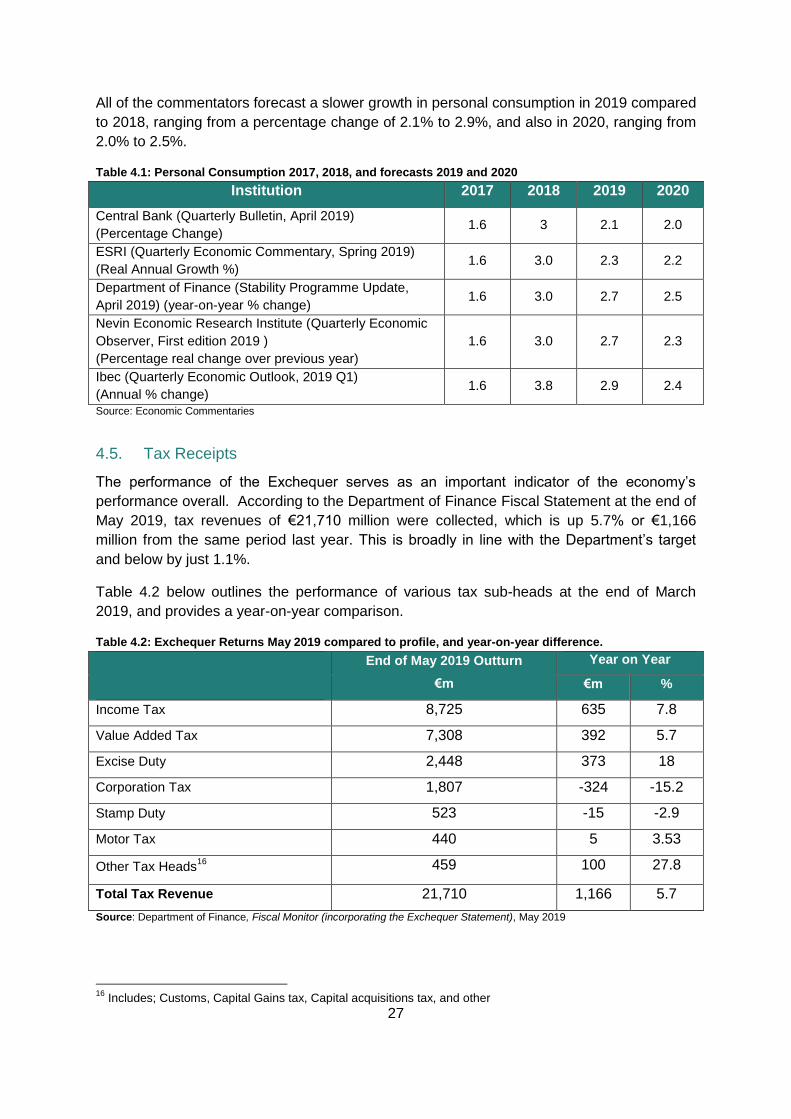
All of the commentators forecast a slower growth in personal consumption in 2019 compared
to 2018, ranging from a percentage change of 2.1% to 2.9%, and also in 2020, ranging from
2.0% to 2.5%.
Table 4.1: Personal Consumption 2017, 2018, and forecasts 2019 and 2020
Institution 2017 2018 2019 2020
Central Bank (Quarterly Bulletin, April 2019)
(Percentage Change) 1.6 3 2.1 2.0
ESRI (Quarterly Economic Commentary, Spring 2019)
(Real Annual Growth %) 1.6 3.0 2.3 2.2
Department of Finance (Stability Programme Update,
April 2019) (year-on-year % change) 1.6 3.0 2.7 2.5
Nevin Economic Research Institute (Quarterly Economic
Observer, First edition 2019 )
(Percentage real change over previous year)
1.6 3.0 2.7 2.3
Ibec (Quarterly Economic Outlook, 2019 Q1)
(Annual % change) 1.6 3.8 2.9 2.4
Source: Economic Commentaries
4.5. Tax Receipts
The performance of the Exchequer serves as an important indicator of the economy’s
performance overall. According to the Department of Finance Fiscal Statement at the end of
May 2019, tax revenues of €21,710 million were collected, which is up 5.7% or €1,166
million from the same period last year. This is broadly in line with the Department’s target
and below by just 1.1%.
Table 4.2 below outlines the performance of various tax sub-heads at the end of March
2019, and provides a year-on-year comparison.
Table 4.2: Exchequer Returns May 2019 compared to profile, and year-on-year difference.
End of May 2019 Outturn
€m
Year on Year
€m %
Income Tax 8,725 635 7.8
Value Added Tax 7,308 392 5.7
Excise Duty 2,448 373 18
Corporation Tax 1,807 -324 -15.2
Stamp Duty 523 -15 -2.9
Motor Tax 440 5 3.53
Other Tax Heads16
459 100 27.8
Total Tax Revenue 21,710 1,166 5.7
Source: Department of Finance, Fiscal Monitor (incorporating the Exchequer Statement), May 2019
16
Includes; Customs, Capital Gains tax, Capital acquisitions tax, and other
28
4.6. Insolvencies
Deloitte17 publish quarterly insolvency data, which shows that the total number of corporate
insolvencies during 2018 was 767, down 12% compared to 2017 (874 recorded).
4.7. Exchange Rates
The possible negative impact on the Irish economy of fluctuating exchange rates, in
particular in light of Brexit is of continued concern. Compared to June 2018, the Euro has
strengthened slightly against the sterling (+1.3%). The ESRI note that much of the
uncertainty surrounding Brexit is about exchange rate fluctuations which are difficult to
forecast. The Euro has weakened against the Dollar compared to June 2018 (-1.8%).
Table 4.3: Euro exchanges rates
€ vs. US $ € vs. ST £
28/06/2018 1.1583 0.8852
28/06/2019 1.138 0.89655
% Change -1.8% 1.3%
Source: ECB Euro Foreign Exchange Rates
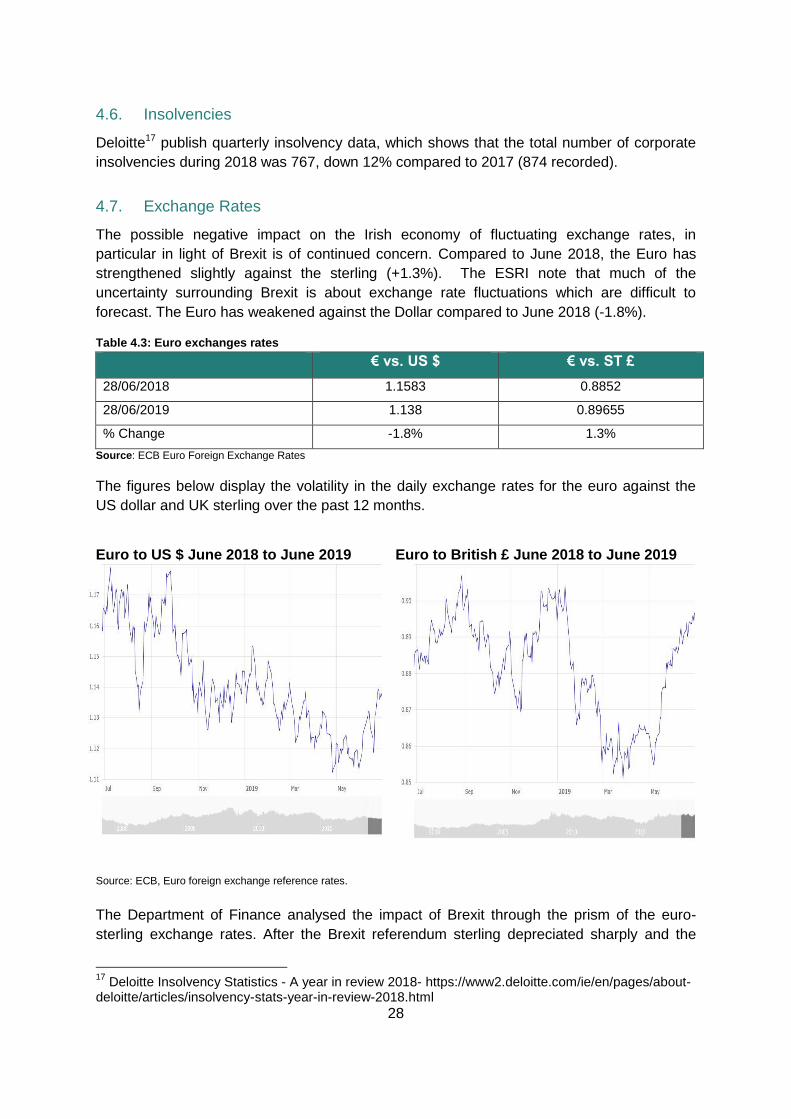
The figures below display the volatility in the daily exchange rates for the euro against the
US dollar and UK sterling over the past 12 months.
Euro to US $ June 2018 to June 2019 Euro to British £ June 2018 to June 2019
Source: ECB, Euro foreign exchange reference rates.
The Department of Finance analysed the impact of Brexit through the prism of the euro-
sterling exchange rates. After the Brexit referendum sterling depreciated sharply and the
17
Deloitte Insolvency Statistics - A year in review 2018- https://www2.deloitte.com/ie/en/pages/about-deloitte/articles/insolvency-stats-year-in-review-2018.html
29
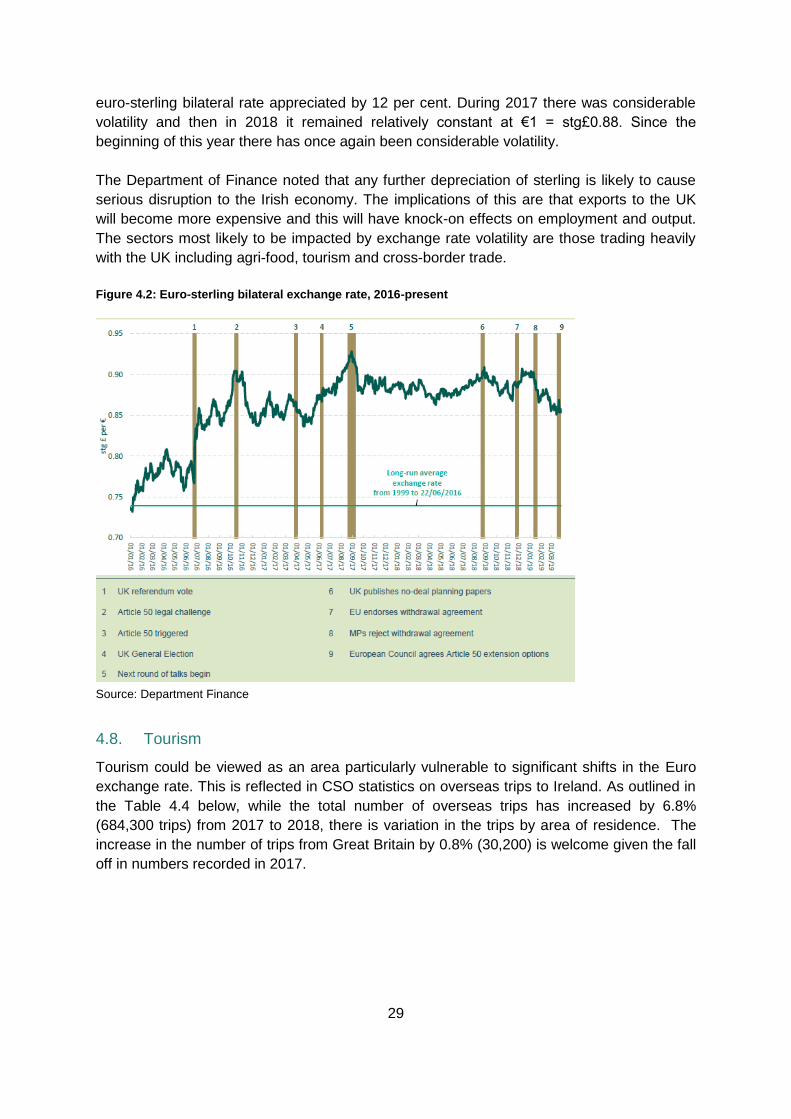
euro-sterling bilateral rate appreciated by 12 per cent. During 2017 there was considerable
volatility and then in 2018 it remained relatively constant at €1 = stg£0.88. Since the
beginning of this year there has once again been considerable volatility.
The Department of Finance noted that any further depreciation of sterling is likely to cause
serious disruption to the Irish economy. The implications of this are that exports to the UK
will become more expensive and this will have knock-on effects on employment and output.
The sectors most likely to be impacted by exchange rate volatility are those trading heavily
with the UK including agri-food, tourism and cross-border trade.
Figure 4.2: Euro-sterling bilateral exchange rate, 2016-present
Source: Department Finance
4.8. Tourism
Tourism could be viewed as an area particularly vulnerable to significant shifts in the Euro
exchange rate. This is reflected in CSO statistics on overseas trips to Ireland. As outlined in
the Table 4.4 below, while the total number of overseas trips has increased by 6.8%
(684,300 trips) from 2017 to 2018, there is variation in the trips by area of residence. The
increase in the number of trips from Great Britain by 0.8% (30,200) is welcome given the fall
off in numbers recorded in 2017.
30
Table 4.4: Overseas Trips to Ireland by Area of Residence and Year
Trips by area of residence (‘000s)
2017
2018
Y-on-Y %
Change
Total Overseas Trips 9932 10616 6.8%
Other Europe 3,482 3,812 9%
Great Britain 3,728 3,759 0.8%
USA & Canada 2,101 2,383 13%
All other areas 619 660 6%
Source: CSO
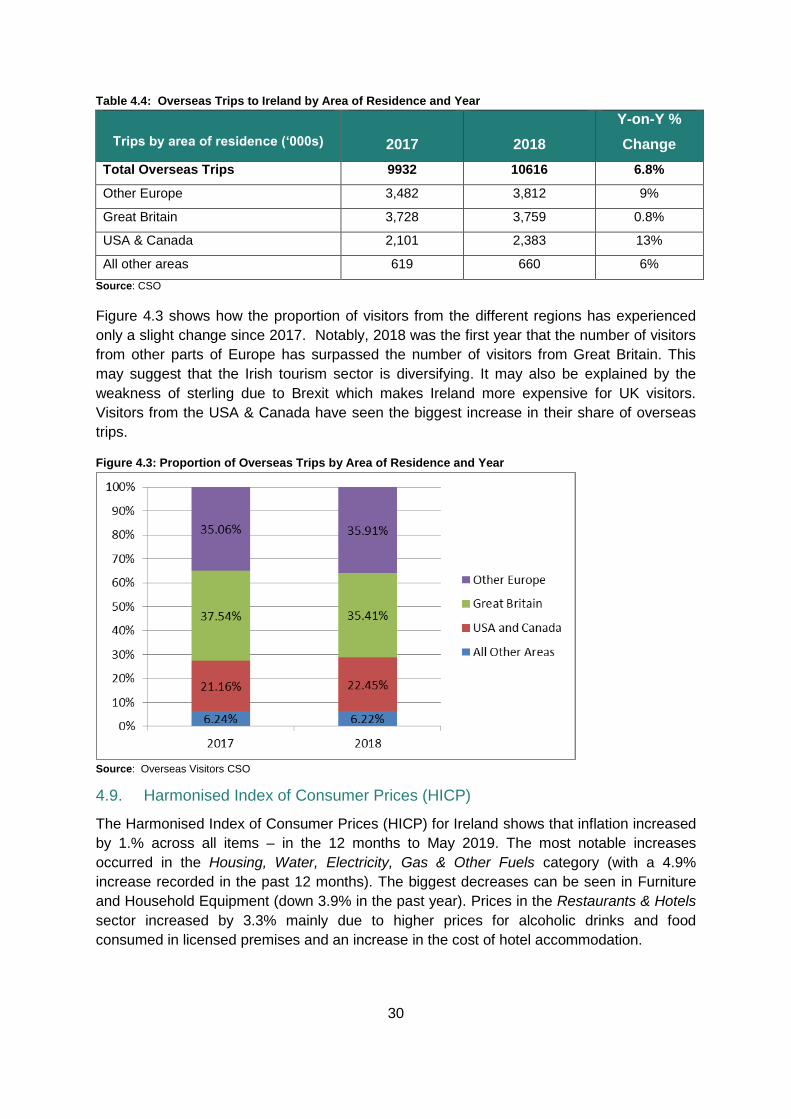
Figure 4.3 shows how the proportion of visitors from the different regions has experienced
only a slight change since 2017. Notably, 2018 was the first year that the number of visitors
from other parts of Europe has surpassed the number of visitors from Great Britain. This
may suggest that the Irish tourism sector is diversifying. It may also be explained by the
weakness of sterling due to Brexit which makes Ireland more expensive for UK visitors.
Visitors from the USA & Canada have seen the biggest increase in their share of overseas
trips.
Figure 4.3: Proportion of Overseas Trips by Area of Residence and Year
Source: Overseas Visitors CSO
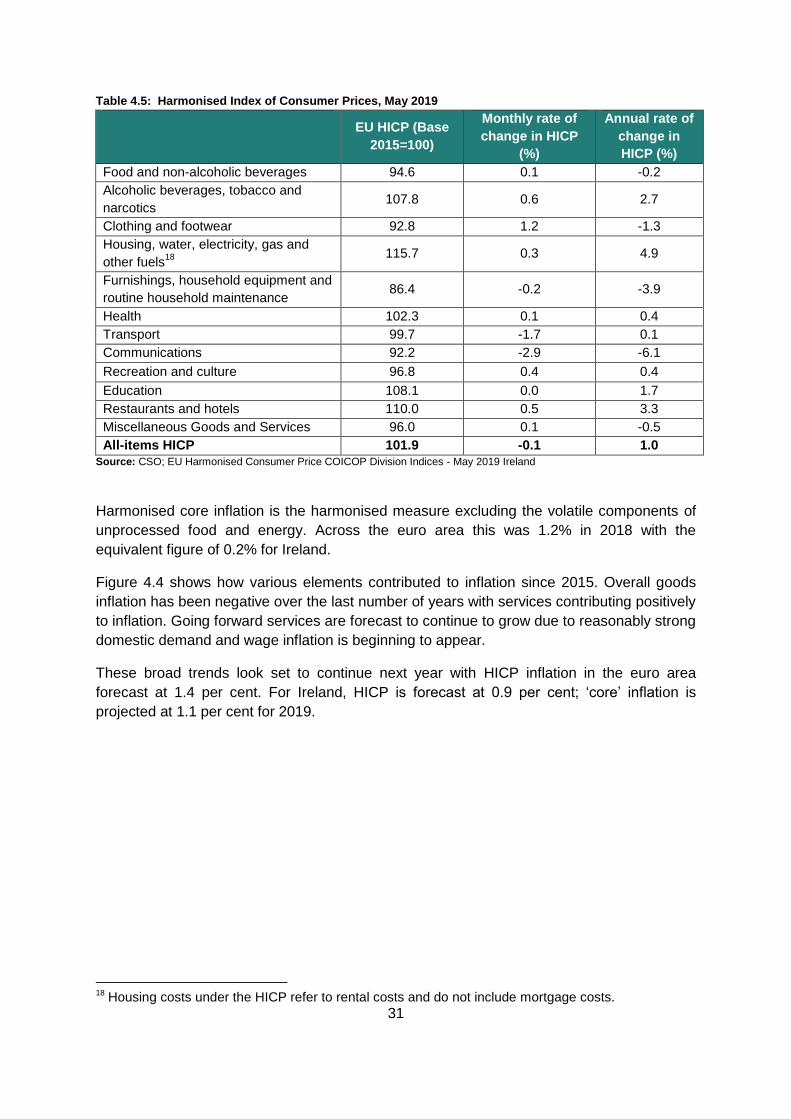
4.9. Harmonised Index of Consumer Prices (HICP)
The Harmonised Index of Consumer Prices (HICP) for Ireland shows that inflation increased
by 1.% across all items – in the 12 months to May 2019. The most notable increases
occurred in the Housing, Water, Electricity, Gas & Other Fuels category (with a 4.9%
increase recorded in the past 12 months). The biggest decreases can be seen in Furniture
and Household Equipment (down 3.9% in the past year). Prices in the Restaurants & Hotels
sector increased by 3.3% mainly due to higher prices for alcoholic drinks and food
consumed in licensed premises and an increase in the cost of hotel accommodation.
31
Table 4.5: Harmonised Index of Consumer Prices, May 2019
EU HICP (Base
2015=100)
Monthly rate of
change in HICP
(%)
Annual rate of
change in
HICP (%)
Food and non-alcoholic beverages 94.6 0.1 -0.2
Alcoholic beverages, tobacco and
narcotics 107.8 0.6 2.7
Clothing and footwear 92.8 1.2 -1.3
Housing, water, electricity, gas and
other fuels18
115.7 0.3 4.9
Furnishings, household equipment and
routine household maintenance 86.4 -0.2 -3.9
Health 102.3 0.1 0.4
Transport 99.7 -1.7 0.1
Communications 92.2 -2.9 -6.1
Recreation and culture 96.8 0.4 0.4
Education 108.1 0.0 1.7
Restaurants and hotels 110.0 0.5 3.3
Miscellaneous Goods and Services 96.0 0.1 -0.5
All-items HICP 101.9 -0.1 1.0
Source: CSO; EU Harmonised Consumer Price COICOP Division Indices - May 2019 Ireland
Harmonised core inflation is the harmonised measure excluding the volatile components of
unprocessed food and energy. Across the euro area this was 1.2% in 2018 with the
equivalent figure of 0.2% for Ireland.
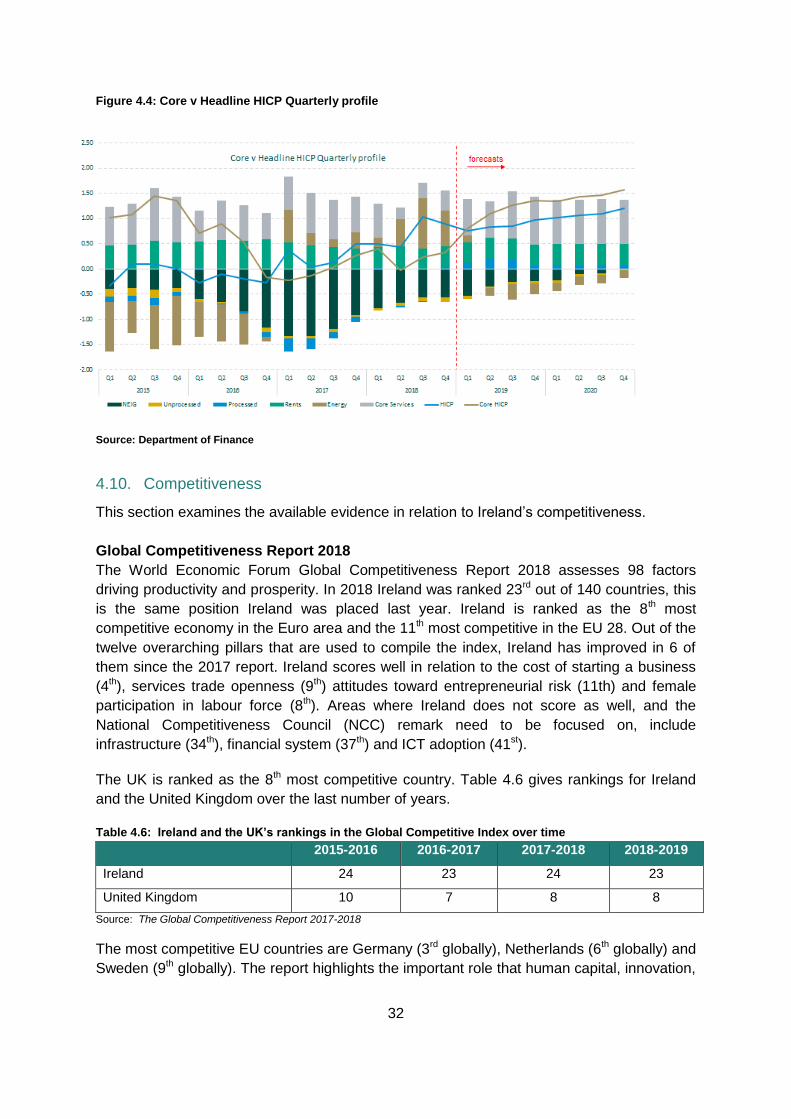
Figure 4.4 shows how various elements contributed to inflation since 2015. Overall goods
inflation has been negative over the last number of years with services contributing positively
to inflation. Going forward services are forecast to continue to grow due to reasonably strong
domestic demand and wage inflation is beginning to appear.
These broad trends look set to continue next year with HICP inflation in the euro area
forecast at 1.4 per cent. For Ireland, HICP is forecast at 0.9 per cent; ‘core’ inflation is
projected at 1.1 per cent for 2019.
18
Housing costs under the HICP refer to rental costs and do not include mortgage costs.
32
Figure 4.4: Core v Headline HICP Quarterly profile
Source: Department of Finance
4.10. Competitiveness
This section examines the available evidence in relation to Ireland’s competitiveness.
Global Competitiveness Report 2018
The World Economic Forum Global Competitiveness Report 2018 assesses 98 factors
driving productivity and prosperity. In 2018 Ireland was ranked 23rd out of 140 countries, this
is the same position Ireland was placed last year. Ireland is ranked as the 8th most
competitive economy in the Euro area and the 11th most competitive in the EU 28. Out of the
twelve overarching pillars that are used to compile the index, Ireland has improved in 6 of
them since the 2017 report. Ireland scores well in relation to the cost of starting a business
(4th), services trade openness (9th) attitudes toward entrepreneurial risk (11th) and female
participation in labour force (8th). Areas where Ireland does not score as well, and the
National Competitiveness Council (NCC) remark need to be focused on, include
infrastructure (34th), financial system (37th) and ICT adoption (41st).
The UK is ranked as the 8th most competitive country. Table 4.6 gives rankings for Ireland
and the United Kingdom over the last number of years.
Table 4.6: Ireland and the UK’s rankings in the Global Competitive Index over time
2015-2016 2016-2017 2017-2018 2018-2019
Ireland 24 23 24 23
United Kingdom 10 7 8 8
Source: The Global Competitiveness Report 2017-2018
The most competitive EU countries are Germany (3rd globally), Netherlands (6th globally) and
Sweden (9th globally). The report highlights the important role that human capital, innovation,
33
resilience and agility play as drivers of competitiveness. The NCC note that policies that
build economic resilience are essential in light of Brexit.
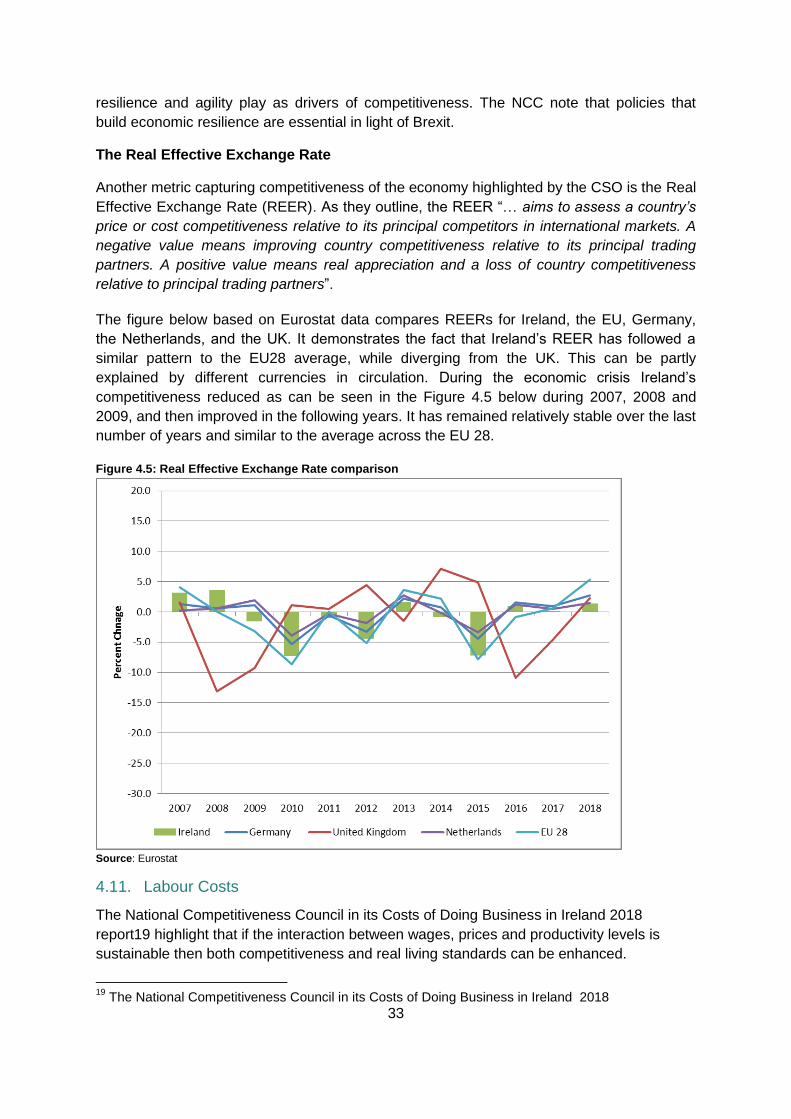
The Real Effective Exchange Rate
Another metric capturing competitiveness of the economy highlighted by the CSO is the Real
Effective Exchange Rate (REER). As they outline, the REER “… aims to assess a country’s
price or cost competitiveness relative to its principal competitors in international markets. A
negative value means improving country competitiveness relative to its principal trading
partners. A positive value means real appreciation and a loss of country competitiveness
relative to principal trading partners”.
The figure below based on Eurostat data compares REERs for Ireland, the EU, Germany,
the Netherlands, and the UK. It demonstrates the fact that Ireland’s REER has followed a
similar pattern to the EU28 average, while diverging from the UK. This can be partly
explained by different currencies in circulation. During the economic crisis Ireland’s
competitiveness reduced as can be seen in the Figure 4.5 below during 2007, 2008 and
2009, and then improved in the following years. It has remained relatively stable over the last
number of years and similar to the average across the EU 28.
Figure 4.5: Real Effective Exchange Rate comparison
Source: Eurostat
4.11. Labour Costs
The National Competitiveness Council in its Costs of Doing Business in Ireland 2018
report19 highlight that if the interaction between wages, prices and productivity levels is
sustainable then both competitiveness and real living standards can be enhanced.
19
The National Competitiveness Council in its Costs of Doing Business in Ireland 2018
34
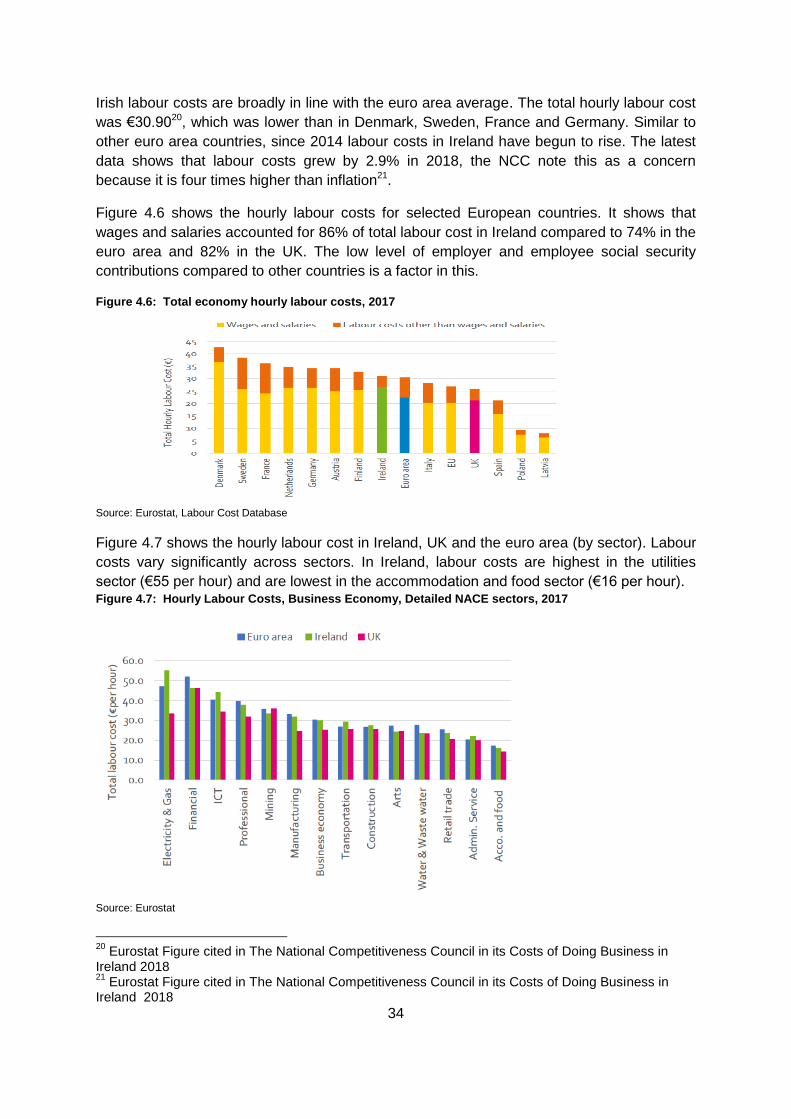
Irish labour costs are broadly in line with the euro area average. The total hourly labour cost
was €30.9020, which was lower than in Denmark, Sweden, France and Germany. Similar to
other euro area countries, since 2014 labour costs in Ireland have begun to rise. The latest
data shows that labour costs grew by 2.9% in 2018, the NCC note this as a concern
because it is four times higher than inflation21.
Figure 4.6 shows the hourly labour costs for selected European countries. It shows that
wages and salaries accounted for 86% of total labour cost in Ireland compared to 74% in the
euro area and 82% in the UK. The low level of employer and employee social security
contributions compared to other countries is a factor in this.
Figure 4.6: Total economy hourly labour costs, 2017
Source: Eurostat, Labour Cost Database
Figure 4.7 shows the hourly labour cost in Ireland, UK and the euro area (by sector). Labour
costs vary significantly across sectors. In Ireland, labour costs are highest in the utilities
sector (€55 per hour) and are lowest in the accommodation and food sector (€16 per hour). Figure 4.7: Hourly Labour Costs, Business Economy, Detailed NACE sectors, 2017
Source: Eurostat
20
Eurostat Figure cited in The National Competitiveness Council in its Costs of Doing Business in Ireland 2018 21
Eurostat Figure cited in The National Competitiveness Council in its Costs of Doing Business in Ireland 2018
35
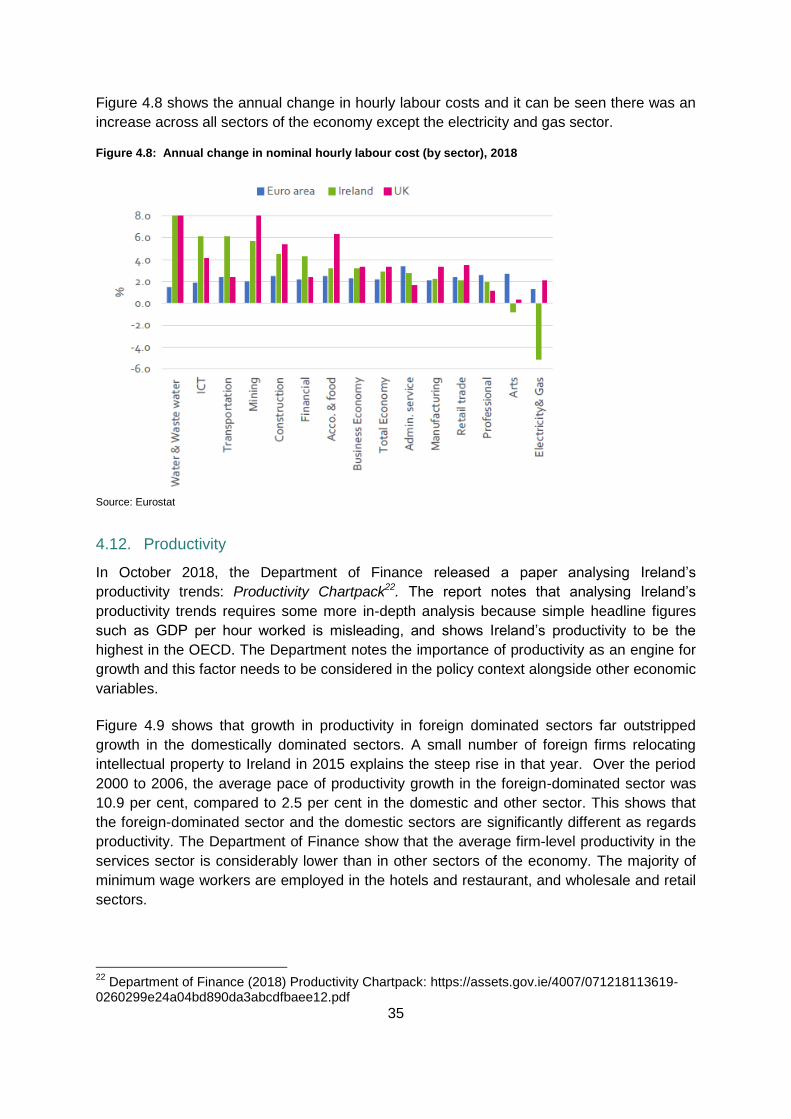
Figure 4.8 shows the annual change in hourly labour costs and it can be seen there was an
increase across all sectors of the economy except the electricity and gas sector.
Figure 4.8: Annual change in nominal hourly labour cost (by sector), 2018
Source: Eurostat
4.12. Productivity
In October 2018, the Department of Finance released a paper analysing Ireland’s
productivity trends: Productivity Chartpack22. The report notes that analysing Ireland’s
productivity trends requires some more in-depth analysis because simple headline figures
such as GDP per hour worked is misleading, and shows Ireland’s productivity to be the
highest in the OECD. The Department notes the importance of productivity as an engine for
growth and this factor needs to be considered in the policy context alongside other economic
variables.
Figure 4.9 shows that growth in productivity in foreign dominated sectors far outstripped
growth in the domestically dominated sectors. A small number of foreign firms relocating
intellectual property to Ireland in 2015 explains the steep rise in that year. Over the period
2000 to 2006, the average pace of productivity growth in the foreign-dominated sector was
10.9 per cent, compared to 2.5 per cent in the domestic and other sector. This shows that
the foreign-dominated sector and the domestic sectors are significantly different as regards
productivity. The Department of Finance show that the average firm-level productivity in the
services sector is considerably lower than in other sectors of the economy. The majority of
minimum wage workers are employed in the hotels and restaurant, and wholesale and retail
sectors.
22
Department of Finance (2018) Productivity Chartpack: https://assets.gov.ie/4007/071218113619-0260299e24a04bd890da3abcdfbaee12.pdf

36
Figure 4.9 Productivity levels: foreign-dominated vs. domestic and other sectors per cent
Note: ‘Foreign-dominated’ are those sectors where multinational enterprise turnover exceeds 85 per cent of total turnover
Source: Gross Value Added for foreign-owned multinational enterprises and other sectors, CSO.
The Department of Finance highlight that a reliance on a small number of sectors and firms
is a risk to the sustainability of the Irish economy in the long term. It also disguises
underperforming firms, where productivity is stagnant or falling. Therefore, the Department of
Finance intend to focus on productivity across different sectors and types of firms in the Irish
economy.
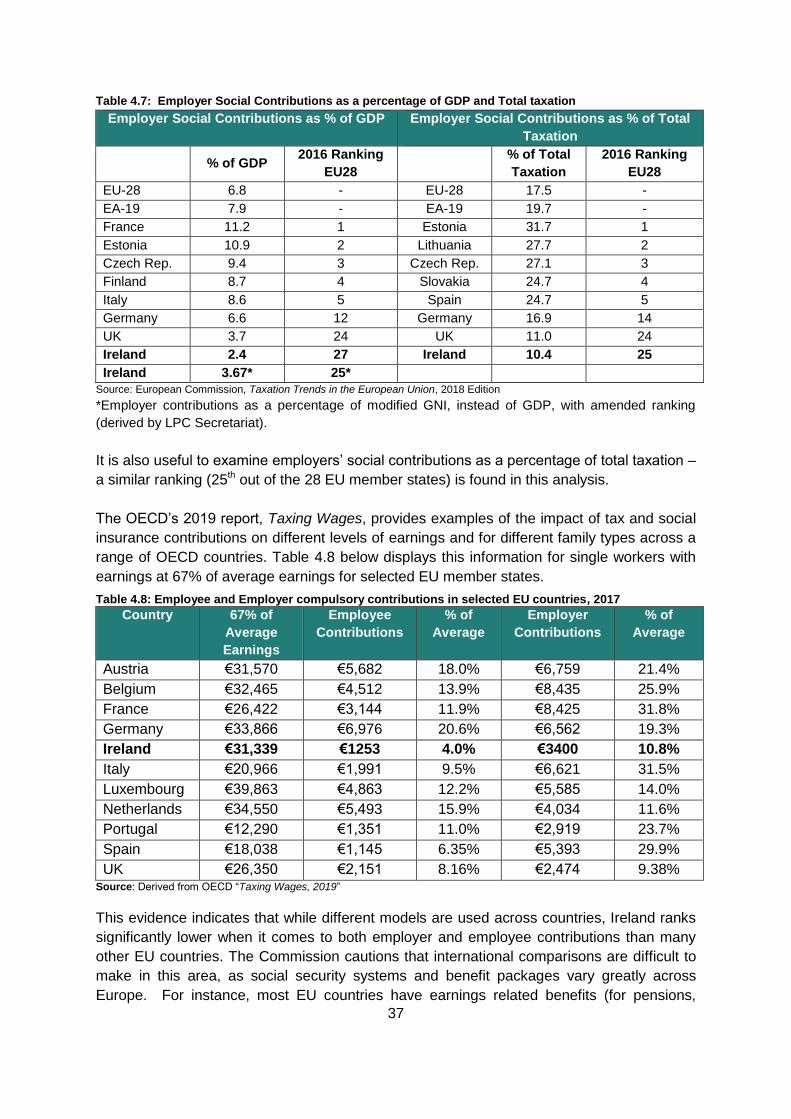
4.13. Employer Social Security Contributions Comparison
The European Commission’s 2018 publication, Taxation Trends in the European Union,
includes information on employers’ social contributions as a percentage of GDP and as a
percentage of total taxation.
Ireland ranks 27th out of 28 EU member states when considering social security contributions
as a percentage of GDP. This shows that employers pay low social security contributions
compared to other EU countries. Given the limitations of GDP as an indicator for Ireland, the
percentage change in modified GNI* is also estimated.
37
Table 4.7: Employer Social Contributions as a percentage of GDP and Total taxation
Employer Social Contributions as % of GDP Employer Social Contributions as % of Total
Taxation
% of GDP 2016 Ranking
EU28
% of Total
Taxation
2016 Ranking
EU28
EU-28 6.8 - EU-28 17.5 -
EA-19 7.9 - EA-19 19.7 -
France 11.2 1 Estonia 31.7 1
Estonia 10.9 2 Lithuania 27.7 2
Czech Rep. 9.4 3 Czech Rep. 27.1 3
Finland 8.7 4 Slovakia 24.7 4
Italy 8.6 5 Spain 24.7 5
Germany 6.6 12 Germany 16.9 14
UK 3.7 24 UK 11.0 24
Ireland 2.4 27 Ireland 10.4 25
Ireland 3.67* 25*
Source: European Commission, Taxation Trends in the European Union, 2018 Edition
*Employer contributions as a percentage of modified GNI, instead of GDP, with amended ranking
(derived by LPC Secretariat).
It is also useful to examine employers’ social contributions as a percentage of total taxation –
a similar ranking (25th out of the 28 EU member states) is found in this analysis.
The OECD’s 2019 report, Taxing Wages, provides examples of the impact of tax and social
insurance contributions on different levels of earnings and for different family types across a
range of OECD countries. Table 4.8 below displays this information for single workers with
earnings at 67% of average earnings for selected EU member states.
Table 4.8: Employee and Employer compulsory contributions in selected EU countries, 2017
Country 67% of
Average
Earnings
Employee
Contributions
% of
Average
Employer
Contributions
% of
Average
Austria €31,570 €5,682 18.0% €6,759 21.4%
Belgium €32,465 €4,512 13.9% €8,435 25.9%
France €26,422 €3,144 11.9% €8,425 31.8%
Germany €33,866 €6,976 20.6% €6,562 19.3%
Ireland €31,339 €1253 4.0% €3400 10.8%
Italy €20,966 €1,991 9.5% €6,621 31.5%
Luxembourg €39,863 €4,863 12.2% €5,585 14.0%
Netherlands €34,550 €5,493 15.9% €4,034 11.6%
Portugal €12,290 €1,351 11.0% €2,919 23.7%
Spain €18,038 €1,145 6.35% €5,393 29.9%
UK €26,350 €2,151 8.16% €2,474 9.38% Source: Derived from OECD “Taxing Wages, 2019”
This evidence indicates that while different models are used across countries, Ireland ranks
significantly lower when it comes to both employer and employee contributions than many
other EU countries. The Commission cautions that international comparisons are difficult to
make in this area, as social security systems and benefit packages vary greatly across
Europe. For instance, most EU countries have earnings related benefits (for pensions,
38
unemployment, etc.) compared to the flat-rate benefits that are prevalent in the Irish social
security system. Irish workers and employers therefore have to pay additional amounts
outside the social security system to obtain such benefits.
4.14. Conclusions
In conclusion, the Irish economy is in a relatively good position. The Department of
Finance23 note that there is strengthening domestic demand, strong employment, and a
reducing budget deficit. International developments such as Brexit are casting uncertainty
about the future. Export growth was strong over the last year; this was driven by
pharmaceutical exports. On the domestic side, investment increased by an estimated 9.8%.
The Department of Finance noted that ‘the surge in aircraft investment in the second half of
the year was particularly noteworthy, but it must be stressed that the impact of these
transactions on the domestic economy is limited, given that these investments were mainly
acquisitions by the aircraft leasing sector, with limited implications for the actual (as opposed
to the measured) domestic capital stock’. Disposable income grew last year and this
combined with modest inflation and growing consumer confidence, lead to personal
consumer spending growth of 3 per cent last year. In terms of the labour market, 63,000
(net) jobs were created over the course of last year, so that the level of employment was 2.9
per cent higher than a year earlier. The European Commission note that Ireland is
particularly exposed to changes in the international taxation and trade environment. The
huge significance of the activities of multinational corporations could drive headline growth
either up or down going forward.
23
Department of Finance (2019) Stability Programme Update 2019 https://assets.gov.ie/8305/88ffede238074f2cb88fc996854a12b3.pdf

39
Chapter 5 The Irish Labour Market
The Irish labour market continues to improve with increases in the employment rate, and
decreases in unemployment. The participation rate has not changed considerably over
recent years. This section looks at employment and unemployment forecasts, and labour
market indicators by sector and region. It also looks at changes in earnings and the income
distribution, including income inequality.
5.1 Employment and Unemployment Forecasts
The number of people in employment in Ireland grew by 3.7% in the year to Q1 2019 this
brings the total number of employed people up to 2,301,900. The overall unadjusted
unemployment rate decreased from 5.7% to 4.8% over the year to Q1 2019.
Labour market forecasts for 2019 and 2020 are provided in table 5.1 below. This table
shows that a cautious optimism remains about the Irish labour market. All quoted forecasts
predicting continued yet small, growth in total employment rates. Forecasts predict further
falls in the unemployment rate for 2019.
Table 5.1: Employment and Unemployment Forecasts
Total Employment Unemployment Rate
% Change %
Institution 2018 2019 2020 2018 2019 2020
Central Bank (Quarterly Bulletin, April 2019) 3.0 2.1 1.7 5.7 5.4 5.0
ESRI (Quarterly Economic Commentary,
Spring 2019) 2.5 2.5 2.1 5.7 5.2 4.8
Department of Finance (Summer Economic
Statement, June 2019 ) 2.9 2.2 2.1 5.7 5.4 5.2
Nevin Economic Research Institute (Quarterly
Economic Observer, 1st Edition 2019 )
2.9 2.5 1.9 5.7 5.0 4.7
Ibec (Ibec Quarterly Economic Outlook, 2019
Q1) 3.0 2.5 1.9 5.6 5.1 5.0
Source: Economic Commentaries
5.2 Employment by Sector
Table 5.2 below provides employment by sector in the past three years, using annual
average numbers in employment from the CSO’s Labour Force Survey. The highlighted
rows correspond to sectors identified by the CSO data as either having higher levels of
minimum wage employees, or as having employees with lower earnings.
On average, employment increased across all sectors by 2.3% over 2018 compared to
2017. The sectors that experienced higher levels of employment growth include
Administrative and support services (11.6%), Construction (11.4%), Public administration
and defence (8.1%) and Accommodation and food service activities (7.3%). There was a

40
reduction in employment in Agriculture, forestry and fishing (-2.8%), certain Industrial sectors
(-1.2%) and financial, insurance and real estate activities (-1.0%).
Table 5.2: Employment by Sector (Persons over 15 years of age)
Sector 2016 2017 2018 Year-on-year
‘000s ‘000s %
Agriculture, forestry and fishing (A) 112.4 110.4 107.4 -3.1 -2.8%
Industry (B to E) 275.6 283.3 279.9 -3.4 -1.2%
Construction (F) 118.6 128.8 143.4 14.6 11.4%
Wholesale and retail trade, repair of motor
vehicles and motorcycles (G)
296.8 302.6 301.4 -1.2 -0.4%
Transportation and storage (H) 93.0 93.4 98.7 5.3 5.7%
Accommodation and food service activities (I) 156.4 163.7 175.7 12.0 7.3%
Information and communication (J) 108.2 115.5 117.6 2.2 1.9%
Financial, insurance and real estate
activities(K,L)
108.4 107.1 106.0 -1.0 -1.0%
Professional, scientific and technical activities
(M)
133.2 133.2 136.9 3.6 2.7%
Administrative and support service activities (N) 86.2 93.2 104.0 10.8 11.6%
Public administration and defence, compulsory
social security (O)
93.9 97.5 105.4 7.9 8.1%
Education (P) 151.4 160.7 170.7 10.0 6.2%
Human health and social work activities (Q) 273.1 279.8 283.5 3.7 1.3%
Other NACE activities (R to U) 118.3 117.6 119.4 1.9 1.6%
All NACE economic sectors 2132.3 2194.2 2257.6 63.4 2.9% Source: Labour Force Survey
Table 5.3 provides the number of people employed in the wholesale and retail sector in each
region. Dublin accounts for the majority of workers in this sector and saw a large increase of
7.7% in the number of workers in 2018. Unfortunately, the Mid-East, South-West, Mid-West
and Border regions all experienced reductions in employment in the wholesale and retail
trade. Overall, at the State level there was a reduction of 0.4% in employment in the
wholesale and retail sector in 2018. Table 5.3: Employment in wholesale and retail trade, repair of vehicles and motorcycles Sector by Region
Wholesale and retail trade, repair of motor
vehicles and motorcycles 2016 2017 2018 Year-on-year
‘000s ‘000s %
Border 25.3 22.3 21.6 -0.7 -3.0%
West 27.4 27.9 28.2 0.4 1.3%
Mid-West 29.0 30.4 26.3 -4.2 -13.7%
South-East 26.7 25.7 24.7 -1.1 -4.1%
South-West 46.5 46.3 45.9 -0.5 -1.0%
Dublin 81.0 85.4 91.9 6.6 7.7%
Mid-East 14.7 47.1 44.7 -2.4 -5.1%
Midland 16.9 17.7 18.3 0.6 3.4%
State 296.95 302.7 301.5 -1.2 -0.4%
Source: CSO Labour Force Survey
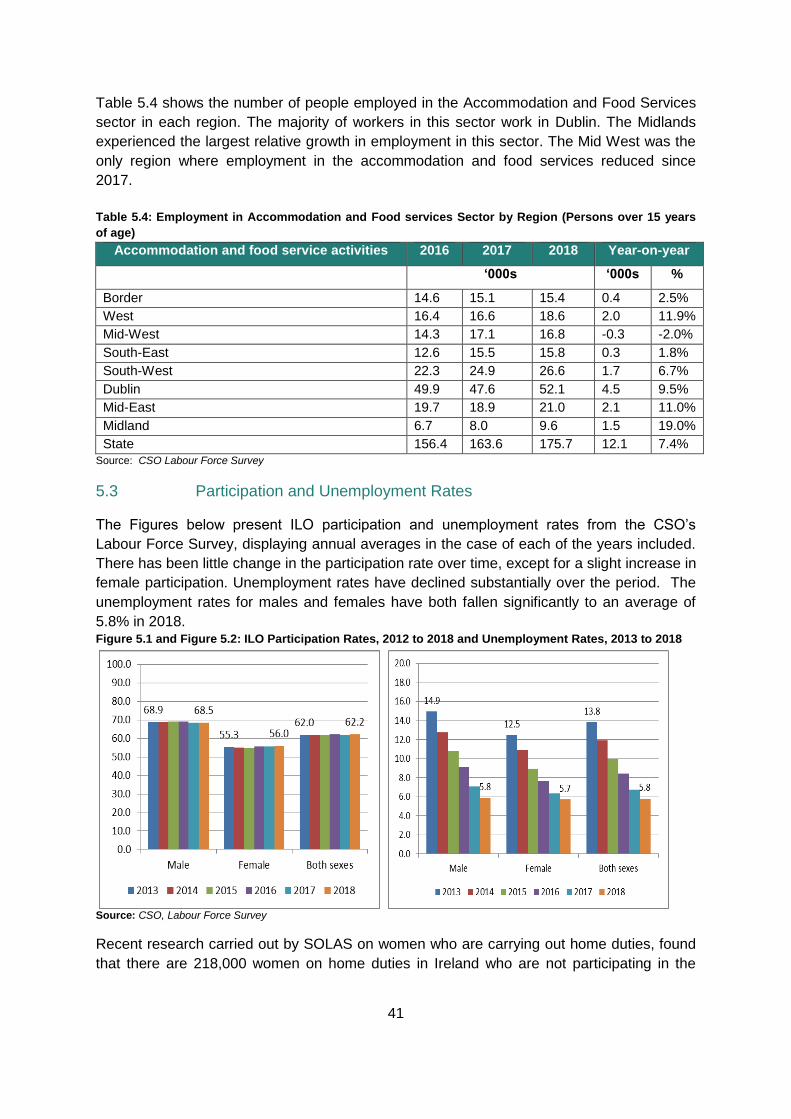
41
Table 5.4 shows the number of people employed in the Accommodation and Food Services
sector in each region. The majority of workers in this sector work in Dublin. The Midlands
experienced the largest relative growth in employment in this sector. The Mid West was the
only region where employment in the accommodation and food services reduced since
2017.
Table 5.4: Employment in Accommodation and Food services Sector by Region (Persons over 15 years
of age)
Accommodation and food service activities 2016 2017 2018 Year-on-year
‘000s ‘000s %
Border 14.6 15.1 15.4 0.4 2.5%
West 16.4 16.6 18.6 2.0 11.9%
Mid-West 14.3 17.1 16.8 -0.3 -2.0%
South-East 12.6 15.5 15.8 0.3 1.8%
South-West 22.3 24.9 26.6 1.7 6.7%
Dublin 49.9 47.6 52.1 4.5 9.5%
Mid-East 19.7 18.9 21.0 2.1 11.0%
Midland 6.7 8.0 9.6 1.5 19.0%
State 156.4 163.6 175.7 12.1 7.4%
Source: CSO Labour Force Survey
5.3 Participation and Unemployment Rates
The Figures below present ILO participation and unemployment rates from the CSO’s
Labour Force Survey, displaying annual averages in the case of each of the years included.
There has been little change in the participation rate over time, except for a slight increase in
female participation. Unemployment rates have declined substantially over the period. The
unemployment rates for males and females have both fallen significantly to an average of
5.8% in 2018. Figure 5.1 and Figure 5.2: ILO Participation Rates, 2012 to 2018 and Unemployment Rates, 2013 to 2018
Source: CSO, Labour Force Survey
Recent research carried out by SOLAS on women who are carrying out home duties, found
that there are 218,000 women on home duties in Ireland who are not participating in the

42
labour force, aged 20-6424. These women’s educational backgrounds vary considerably.
About 57,000 of these women have a third level qualification and they are more likely to be
looking after children and have a partner in employment. Approximately 122,500 of the
women on home duties have an upper secondary or less qualification. These women are
less likely to be looking after children or have a partner in employment and may require more
support to enter the labour market. About three quarters of this group of women had either
never been in employment or had not worked since prior to 2010. In relation to willingness to
work the majority of women of all educational backgrounds who are on home duties do not
want a job. SOLAS note further exploration is needed to understand the underlying reasons
for this and whether structural changes such as more affordable and accessible childcare
would change this.
In 2017, Ireland ranked 11th amongst EU countries, in terms of the number of females who
are not in the labour force as a percentage of the working age population (aged 15-64
years).
Table 5.5 below outlines the number of people employed by region, and displays the year on
year change from 2017 to 2018, and the percentage change that this represents.
All regions except the Border and the Mid-West saw an increase in employment in 2018.
The average employment growth across the State was 2.9%. Among the regions reported
on by the CSO, the strongest increases in employment were in the Dublin (34,850 people or
5.3%) and the Midlands regions (6,325 people or 5.3%), while the biggest reduction in
absolute terms was in the Border (-1800 people or -1.0%) and in the Mid-West (1,700 or -
0.8%). In the other regions, the numbers employed in all regions, with the exception of the
South East, Border and Midlands are now higher than previous peak employment levels.
Table 5.5: Employment by Region
Region 2017 2018 Year on year
Change Year on year change (%)
Northern and Western 379.0 385.1 6.1 1.6%
Border 178.6 176.8 -1.8 -1.0%
West 200.5 208.4 7.8 3.9%
Southern 716.9 725.2 8.3 1.2%
Mid-West 214.9 213.2 -1.7 -0.8%
South-East 184.4 186.6 2.2 1.2%
South-West 317.6 325.4 7.8 2.5%
Eastern Midland 1098.2 1147.3 49.1 4.5%
Dublin 659.3 694.2 34.9 5.3%
Mid-East 319.6 327.5 8.0 2.5%
Midland 119.3 125.6 6.3 5.3%
State 2194.2 2257.6 63.4 2.9%
Source: Labour Force Survey, CSO
24
Quarterly Skills Bulletin Q1 2019-Women on Home Duties http://www.solas.ie/SolasPdfLibrary/Women%20Home%20Duties%20Report.pdf
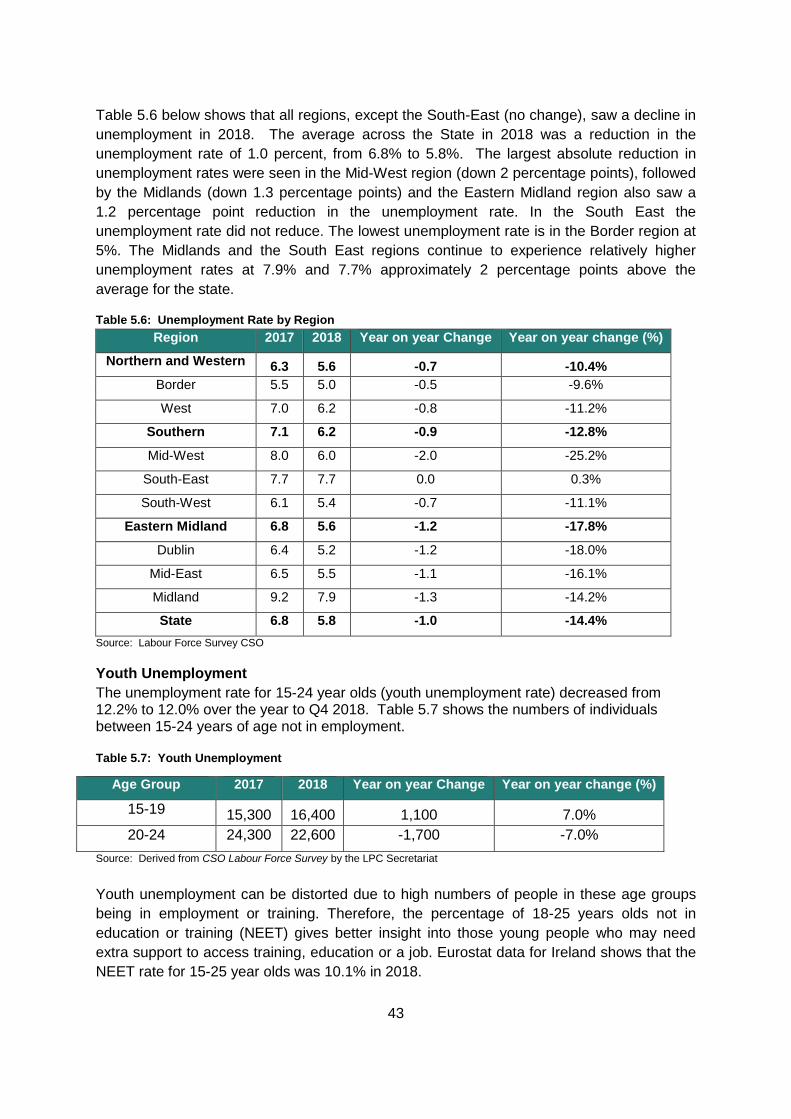
43
Table 5.6 below shows that all regions, except the South-East (no change), saw a decline in
unemployment in 2018. The average across the State in 2018 was a reduction in the
unemployment rate of 1.0 percent, from 6.8% to 5.8%. The largest absolute reduction in
unemployment rates were seen in the Mid-West region (down 2 percentage points), followed
by the Midlands (down 1.3 percentage points) and the Eastern Midland region also saw a
1.2 percentage point reduction in the unemployment rate. In the South East the
unemployment rate did not reduce. The lowest unemployment rate is in the Border region at
5%. The Midlands and the South East regions continue to experience relatively higher
unemployment rates at 7.9% and 7.7% approximately 2 percentage points above the
average for the state.
Table 5.6: Unemployment Rate by Region
Region 2017 2018 Year on year Change Year on year change (%)
Northern and Western 6.3 5.6 -0.7 -10.4%
Border 5.5 5.0 -0.5 -9.6%
West 7.0 6.2 -0.8 -11.2%
Southern 7.1 6.2 -0.9 -12.8%
Mid-West 8.0 6.0 -2.0 -25.2%
South-East 7.7 7.7 0.0 0.3%
South-West 6.1 5.4 -0.7 -11.1%
Eastern Midland 6.8 5.6 -1.2 -17.8%
Dublin 6.4 5.2 -1.2 -18.0%
Mid-East 6.5 5.5 -1.1 -16.1%
Midland 9.2 7.9 -1.3 -14.2%
State 6.8 5.8 -1.0 -14.4%
Source: Labour Force Survey CSO
Youth Unemployment
The unemployment rate for 15-24 year olds (youth unemployment rate) decreased from 12.2% to 12.0% over the year to Q4 2018. Table 5.7 shows the numbers of individuals between 15-24 years of age not in employment. Table 5.7: Youth Unemployment
Source: Derived from CSO Labour Force Survey by the LPC Secretariat
Youth unemployment can be distorted due to high numbers of people in these age groups
being in employment or training. Therefore, the percentage of 18-25 years olds not in
education or training (NEET) gives better insight into those young people who may need
extra support to access training, education or a job. Eurostat data for Ireland shows that the
NEET rate for 15-25 year olds was 10.1% in 2018.
Age Group 2017 2018 Year on year Change Year on year change (%)
15-19 15,300 16,400 1,100 7.0%
20-24 24,300 22,600 -1,700 -7.0%
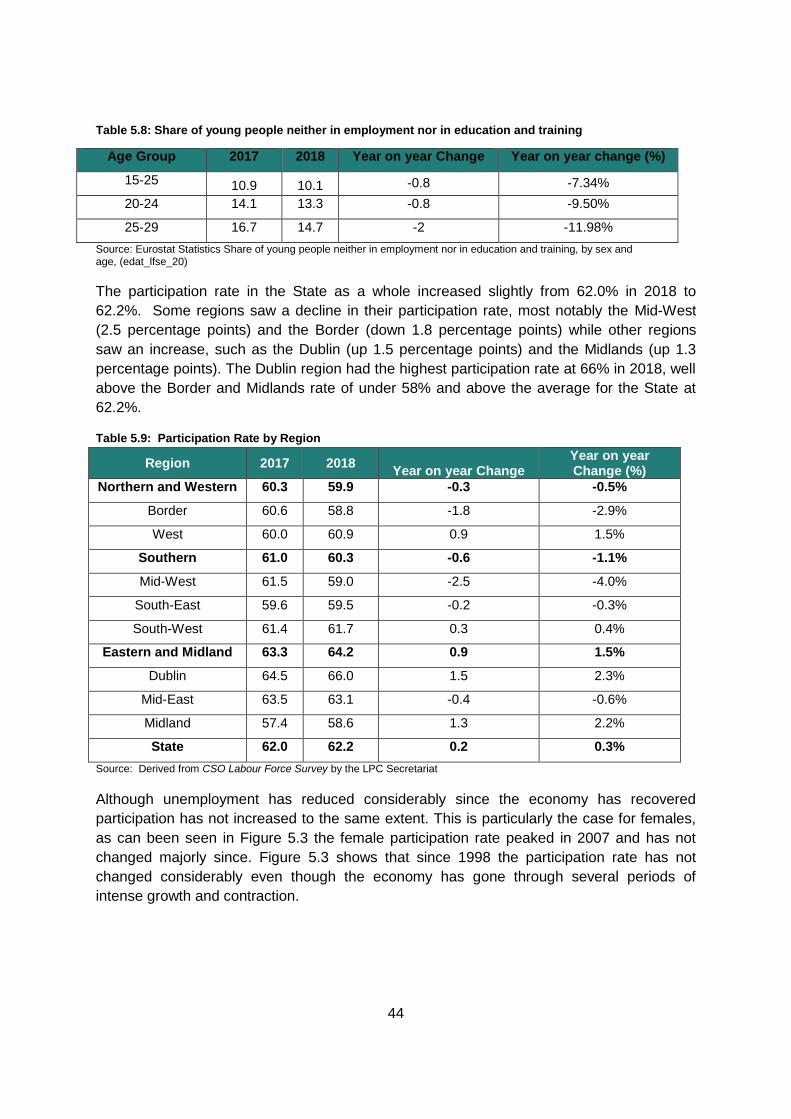
44
Table 5.8: Share of young people neither in employment nor in education and training
Source: Eurostat Statistics Share of young people neither in employment nor in education and training, by sex and age, (edat_lfse_20)
The participation rate in the State as a whole increased slightly from 62.0% in 2018 to
62.2%. Some regions saw a decline in their participation rate, most notably the Mid-West
(2.5 percentage points) and the Border (down 1.8 percentage points) while other regions
saw an increase, such as the Dublin (up 1.5 percentage points) and the Midlands (up 1.3
percentage points). The Dublin region had the highest participation rate at 66% in 2018, well
above the Border and Midlands rate of under 58% and above the average for the State at
62.2%.
Table 5.9: Participation Rate by Region
Region 2017 2018 Year on year Change
Year on year Change (%)
Northern and Western 60.3 59.9 -0.3 -0.5%
Border 60.6 58.8 -1.8 -2.9%
West 60.0 60.9 0.9 1.5%
Southern 61.0 60.3 -0.6 -1.1%
Mid-West 61.5 59.0 -2.5 -4.0%
South-East 59.6 59.5 -0.2 -0.3%
South-West 61.4 61.7 0.3 0.4%
Eastern and Midland 63.3 64.2 0.9 1.5%
Dublin 64.5 66.0 1.5 2.3%
Mid-East 63.5 63.1 -0.4 -0.6%
Midland 57.4 58.6 1.3 2.2%
State 62.0 62.2 0.2 0.3%
Source: Derived from CSO Labour Force Survey by the LPC Secretariat
Although unemployment has reduced considerably since the economy has recovered
participation has not increased to the same extent. This is particularly the case for females,
as can been seen in Figure 5.3 the female participation rate peaked in 2007 and has not
changed majorly since. Figure 5.3 shows that since 1998 the participation rate has not
changed considerably even though the economy has gone through several periods of
intense growth and contraction.
Age Group 2017 2018 Year on year Change Year on year change (%)
15-25 10.9 10.1 -0.8 -7.34%
20-24 14.1 13.3 -0.8 -9.50%
25-29 16.7 14.7 -2 -11.98%
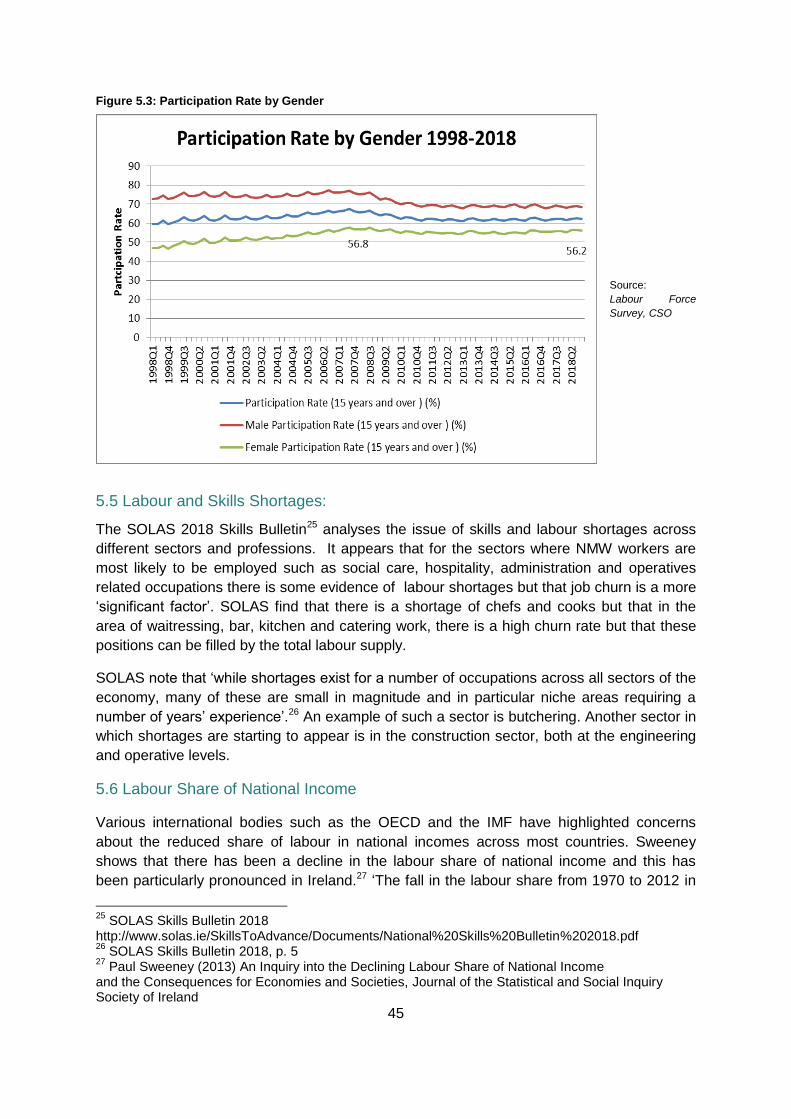
45
Figure 5.3: Participation Rate by Gender
Source:
Labour Force
Survey, CSO
5.5 Labour and Skills Shortages:
The SOLAS 2018 Skills Bulletin25 analyses the issue of skills and labour shortages across
different sectors and professions. It appears that for the sectors where NMW workers are
most likely to be employed such as social care, hospitality, administration and operatives
related occupations there is some evidence of labour shortages but that job churn is a more
‘significant factor’. SOLAS find that there is a shortage of chefs and cooks but that in the
area of waitressing, bar, kitchen and catering work, there is a high churn rate but that these
positions can be filled by the total labour supply.
SOLAS note that ‘while shortages exist for a number of occupations across all sectors of the
economy, many of these are small in magnitude and in particular niche areas requiring a
number of years’ experience’.26 An example of such a sector is butchering. Another sector in
which shortages are starting to appear is in the construction sector, both at the engineering
and operative levels.
5.6 Labour Share of National Income
Various international bodies such as the OECD and the IMF have highlighted concerns
about the reduced share of labour in national incomes across most countries. Sweeney
shows that there has been a decline in the labour share of national income and this has
been particularly pronounced in Ireland.27 ‘The fall in the labour share from 1970 to 2012 in
25
SOLAS Skills Bulletin 2018 http://www.solas.ie/SkillsToAdvance/Documents/National%20Skills%20Bulletin%202018.pdf 26
SOLAS Skills Bulletin 2018, p. 5 27
Paul Sweeney (2013) An Inquiry into the Declining Labour Share of National Income and the Consequences for Economies and Societies, Journal of the Statistical and Social Inquiry Society of Ireland
46
Ireland was very large from 89 per cent to 60 per cent of national income (peaking at 92 per
cent in 1975 and 1976)’.28 Sweeney gives ten reasons for the decline of labour in the
national income and highlights four main factors (a) globalisation; (b) the reduction in
labour’s bargaining power (through de-regulation, sectoral employment change, migration,
offshoring and weakened institutions); (c) financialisation; and, (d) technological change.
Ireland’s particularly low labour share is influenced by the presence of large multinational
companies and the use of transfer pricing means that companies based in Ireland often
record very high profits.
5.7 Changes in Earnings
Changes in earnings from Q1 2018 to Q1 2019(preliminary) are provided in table 5.10
below for all sectors, excluding agriculture. The table also contains earnings broken down
for public and private sector, and by firm size.
The table highlights the extent to which average hourly and weekly earnings have varied
across several sectors.
Across all sectors, average weekly earnings increased by 3.4% while average hourly
earnings increased by 2.3%. The highest increase in average weekly earnings was in the
Arts, Entertainment and recreation sector, with a 10.2% increase. For average hourly
earnings the largest increase was in the Transport and Storage sector (7.8%). The sector
with the largest increase in average weekly paid hours was the Accommodation and Food
sector with a 7.7% increase.
Average hourly earnings increased in both the private and public sectors (2.7% and 1.3%
respectively) for the year to Q1, 2019. Average weekly earnings also increased in both the
private and public sectors (4.2% for Private sector, and 1.2% for Public sector).
Weekly and hourly earnings increased more in medium sized enterprises, growing 5.1% and
3.6% respectively compared to small or large sized enterprises. Larger enterprises
experienced the smallest increases in both weekly earnings compared to medium and small
businesses, with an increase of 2.1% in average weekly earnings.
28
Paul Sweeney (2013) An Inquiry into the Declining Labour Share of National Income and the Consequences for Economies and Societies, Journal of the Statistical and Social Inquiry Society of Ireland
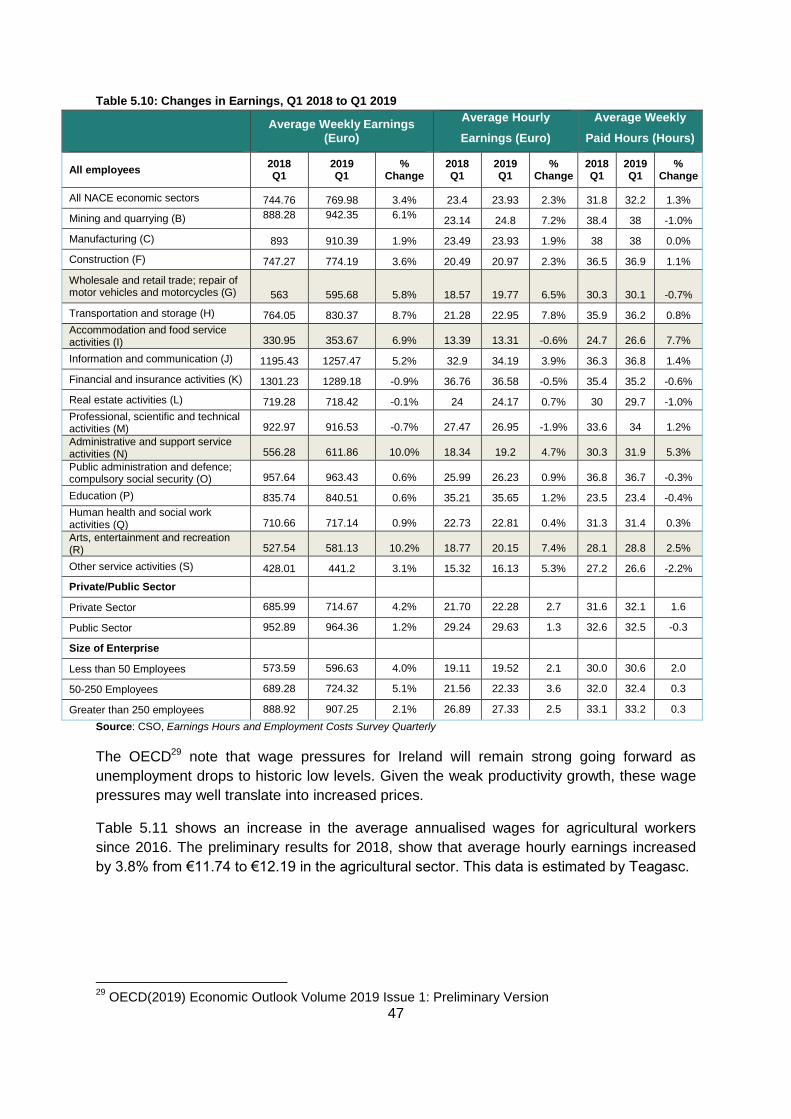
47
Table 5.10: Changes in Earnings, Q1 2018 to Q1 2019
Average Weekly Earnings
(Euro)
Average Hourly
Earnings (Euro)
Average Weekly
Paid Hours (Hours)
All employees 2018 Q1
2019 Q1
% Change
2018 Q1
2019 Q1
% Change
2018 Q1
2019 Q1
% Change
All NACE economic sectors 744.76 769.98 3.4% 23.4 23.93 2.3% 31.8 32.2 1.3%
Mining and quarrying (B) 888.28 942.35 6.1% 23.14 24.8 7.2% 38.4 38 -1.0%
Manufacturing (C) 893 910.39 1.9% 23.49 23.93 1.9% 38 38 0.0%
Construction (F) 747.27 774.19 3.6% 20.49 20.97 2.3% 36.5 36.9 1.1%
Wholesale and retail trade; repair of motor vehicles and motorcycles (G) 563 595.68 5.8% 18.57 19.77 6.5% 30.3 30.1 -0.7%
Transportation and storage (H) 764.05 830.37 8.7% 21.28 22.95 7.8% 35.9 36.2 0.8%
Accommodation and food service activities (I) 330.95 353.67 6.9% 13.39 13.31 -0.6% 24.7 26.6 7.7%
Information and communication (J) 1195.43 1257.47 5.2% 32.9 34.19 3.9% 36.3 36.8 1.4%
Financial and insurance activities (K) 1301.23 1289.18 -0.9% 36.76 36.58 -0.5% 35.4 35.2 -0.6%
Real estate activities (L) 719.28 718.42 -0.1% 24 24.17 0.7% 30 29.7 -1.0%
Professional, scientific and technical activities (M) 922.97 916.53 -0.7% 27.47 26.95 -1.9% 33.6 34 1.2%
Administrative and support service activities (N) 556.28 611.86 10.0% 18.34 19.2 4.7% 30.3 31.9 5.3%
Public administration and defence; compulsory social security (O) 957.64 963.43 0.6% 25.99 26.23 0.9% 36.8 36.7 -0.3%
Education (P) 835.74 840.51 0.6% 35.21 35.65 1.2% 23.5 23.4 -0.4%
Human health and social work activities (Q) 710.66 717.14 0.9% 22.73 22.81 0.4% 31.3 31.4 0.3%
Arts, entertainment and recreation (R) 527.54 581.13 10.2% 18.77 20.15 7.4% 28.1 28.8 2.5%
Other service activities (S) 428.01 441.2 3.1% 15.32 16.13 5.3% 27.2 26.6 -2.2%
Private/Public Sector
Private Sector 685.99 714.67 4.2% 21.70 22.28 2.7 31.6 32.1 1.6
Public Sector 952.89 964.36 1.2% 29.24 29.63 1.3 32.6 32.5 -0.3
Size of Enterprise
Less than 50 Employees 573.59 596.63 4.0% 19.11 19.52 2.1 30.0 30.6 2.0
50-250 Employees 689.28 724.32 5.1% 21.56 22.33 3.6 32.0 32.4 0.3
Greater than 250 employees 888.92 907.25 2.1% 26.89 27.33 2.5 33.1 33.2 0.3
Source: CSO, Earnings Hours and Employment Costs Survey Quarterly
The OECD29 note that wage pressures for Ireland will remain strong going forward as
unemployment drops to historic low levels. Given the weak productivity growth, these wage
pressures may well translate into increased prices.
Table 5.11 shows an increase in the average annualised wages for agricultural workers
since 2016. The preliminary results for 2018, show that average hourly earnings increased
by 3.8% from €11.74 to €12.19 in the agricultural sector. This data is estimated by Teagasc.
29
OECD(2019) Economic Outlook Volume 2019 Issue 1: Preliminary Version
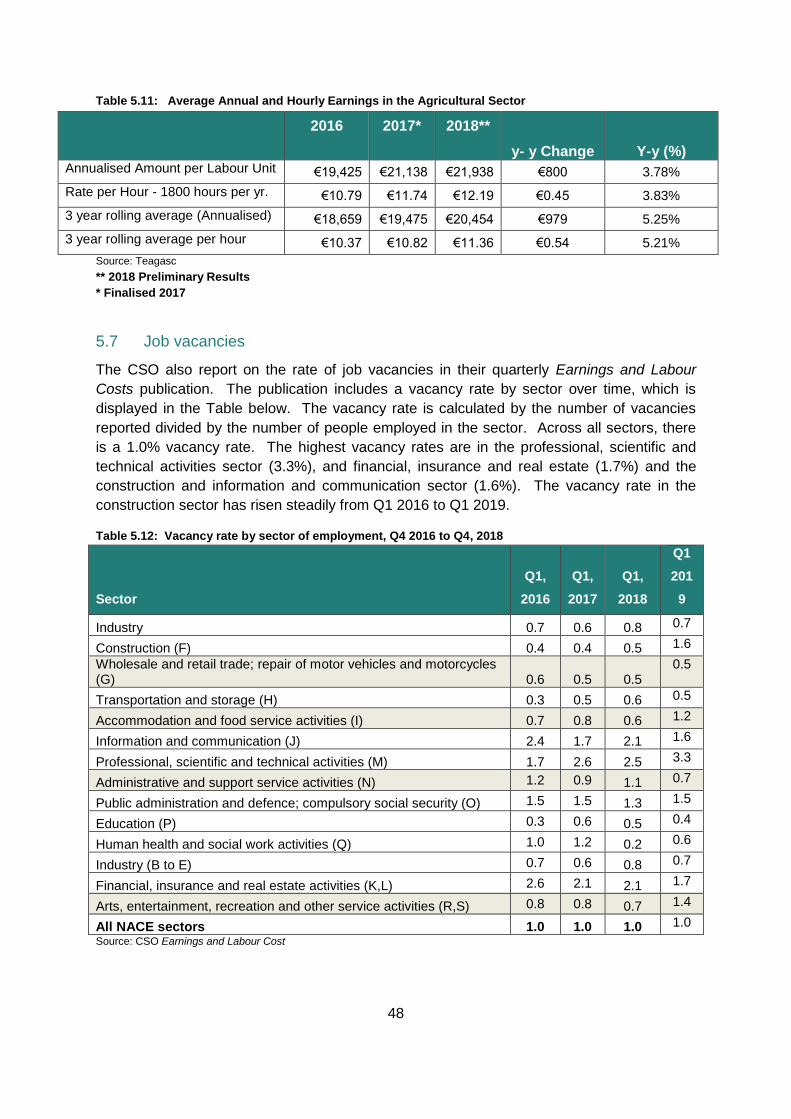
48
Table 5.11: Average Annual and Hourly Earnings in the Agricultural Sector
2016 2017* 2018**
y- y Change Y-y (%) Annualised Amount per Labour Unit €19,425 €21,138 €21,938 €800 3.78%
Rate per Hour - 1800 hours per yr. €10.79 €11.74 €12.19 €0.45 3.83%
3 year rolling average (Annualised) €18,659 €19,475 €20,454 €979 5.25%
3 year rolling average per hour €10.37 €10.82 €11.36 €0.54 5.21%
Source: Teagasc ** 2018 Preliminary Results
* Finalised 2017
5.7 Job vacancies
The CSO also report on the rate of job vacancies in their quarterly Earnings and Labour
Costs publication. The publication includes a vacancy rate by sector over time, which is
displayed in the Table below. The vacancy rate is calculated by the number of vacancies
reported divided by the number of people employed in the sector. Across all sectors, there
is a 1.0% vacancy rate. The highest vacancy rates are in the professional, scientific and
technical activities sector (3.3%), and financial, insurance and real estate (1.7%) and the
construction and information and communication sector (1.6%). The vacancy rate in the
construction sector has risen steadily from Q1 2016 to Q1 2019.
Table 5.12: Vacancy rate by sector of employment, Q4 2016 to Q4, 2018
Sector
Q1,
2016
Q1,
2017
Q1,
2018
Q1
201
9
Industry 0.7 0.6 0.8 0.7
Construction (F) 0.4 0.4 0.5 1.6
Wholesale and retail trade; repair of motor vehicles and motorcycles (G) 0.6 0.5 0.5
0.5
Transportation and storage (H) 0.3 0.5 0.6 0.5
Accommodation and food service activities (I) 0.7 0.8 0.6 1.2
Information and communication (J) 2.4 1.7 2.1 1.6
Professional, scientific and technical activities (M) 1.7 2.6 2.5 3.3
Administrative and support service activities (N) 1.2 0.9 1.1 0.7
Public administration and defence; compulsory social security (O) 1.5 1.5 1.3 1.5
Education (P) 0.3 0.6 0.5 0.4
Human health and social work activities (Q) 1.0 1.2 0.2 0.6
Industry (B to E) 0.7 0.6 0.8 0.7
Financial, insurance and real estate activities (K,L) 2.6 2.1 2.1 1.7
Arts, entertainment, recreation and other service activities (R,S) 0.8 0.8 0.7 1.4
All NACE sectors 1.0 1.0 1.0 1.0
Source: CSO Earnings and Labour Cost
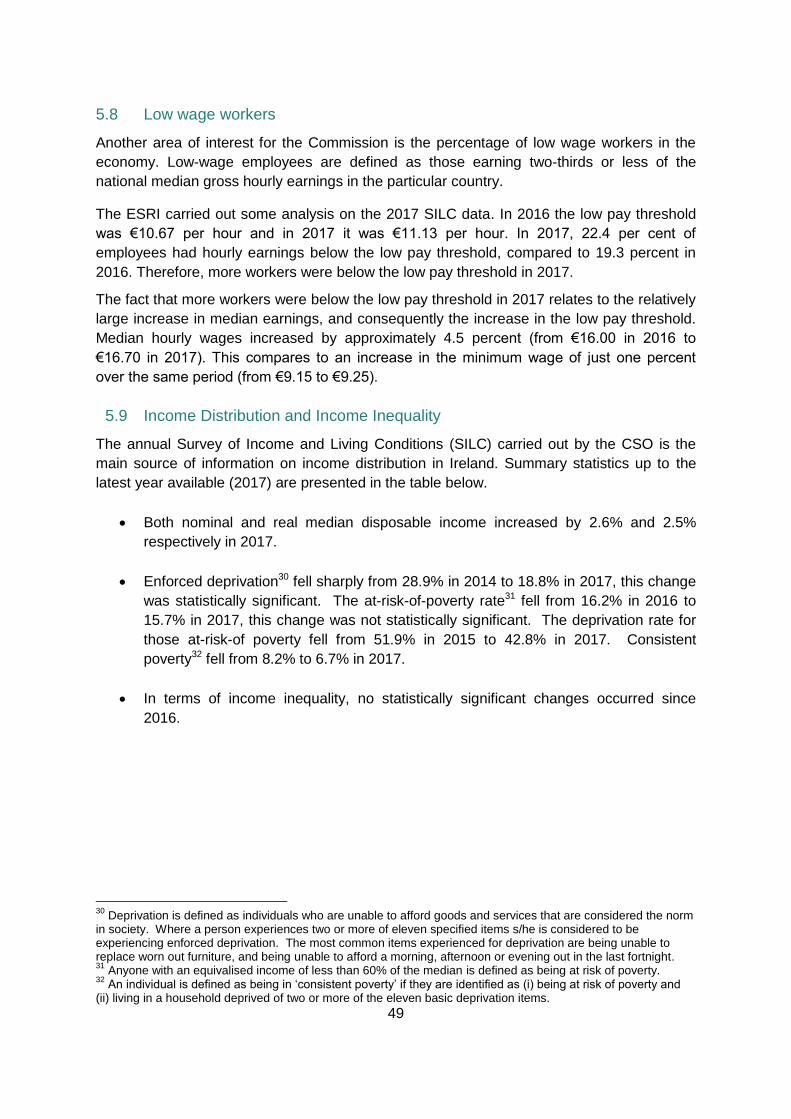
49
5.8 Low wage workers
Another area of interest for the Commission is the percentage of low wage workers in the
economy. Low-wage employees are defined as those earning two-thirds or less of the
national median gross hourly earnings in the particular country.
The ESRI carried out some analysis on the 2017 SILC data. In 2016 the low pay threshold
was €10.67 per hour and in 2017 it was €11.13 per hour. In 2017, 22.4 per cent of
employees had hourly earnings below the low pay threshold, compared to 19.3 percent in
2016. Therefore, more workers were below the low pay threshold in 2017.
The fact that more workers were below the low pay threshold in 2017 relates to the relatively
large increase in median earnings, and consequently the increase in the low pay threshold.
Median hourly wages increased by approximately 4.5 percent (from €16.00 in 2016 to
€16.70 in 2017). This compares to an increase in the minimum wage of just one percent
over the same period (from €9.15 to €9.25).
5.9 Income Distribution and Income Inequality
The annual Survey of Income and Living Conditions (SILC) carried out by the CSO is the
main source of information on income distribution in Ireland. Summary statistics up to the
latest year available (2017) are presented in the table below.
Both nominal and real median disposable income increased by 2.6% and 2.5%
respectively in 2017.
Enforced deprivation30 fell sharply from 28.9% in 2014 to 18.8% in 2017, this change
was statistically significant. The at-risk-of-poverty rate31 fell from 16.2% in 2016 to
15.7% in 2017, this change was not statistically significant. The deprivation rate for
those at-risk-of poverty fell from 51.9% in 2015 to 42.8% in 2017. Consistent
poverty32 fell from 8.2% to 6.7% in 2017.
In terms of income inequality, no statistically significant changes occurred since
2016.
30
Deprivation is defined as individuals who are unable to afford goods and services that are considered the norm in society. Where a person experiences two or more of eleven specified items s/he is considered to be experiencing enforced deprivation. The most common items experienced for deprivation are being unable to replace worn out furniture, and being unable to afford a morning, afternoon or evening out in the last fortnight. 31
Anyone with an equivalised income of less than 60% of the median is defined as being at risk of poverty. 32
An individual is defined as being in ‘consistent poverty’ if they are identified as (i) being at risk of poverty and (ii) living in a household deprived of two or more of the eleven basic deprivation items.
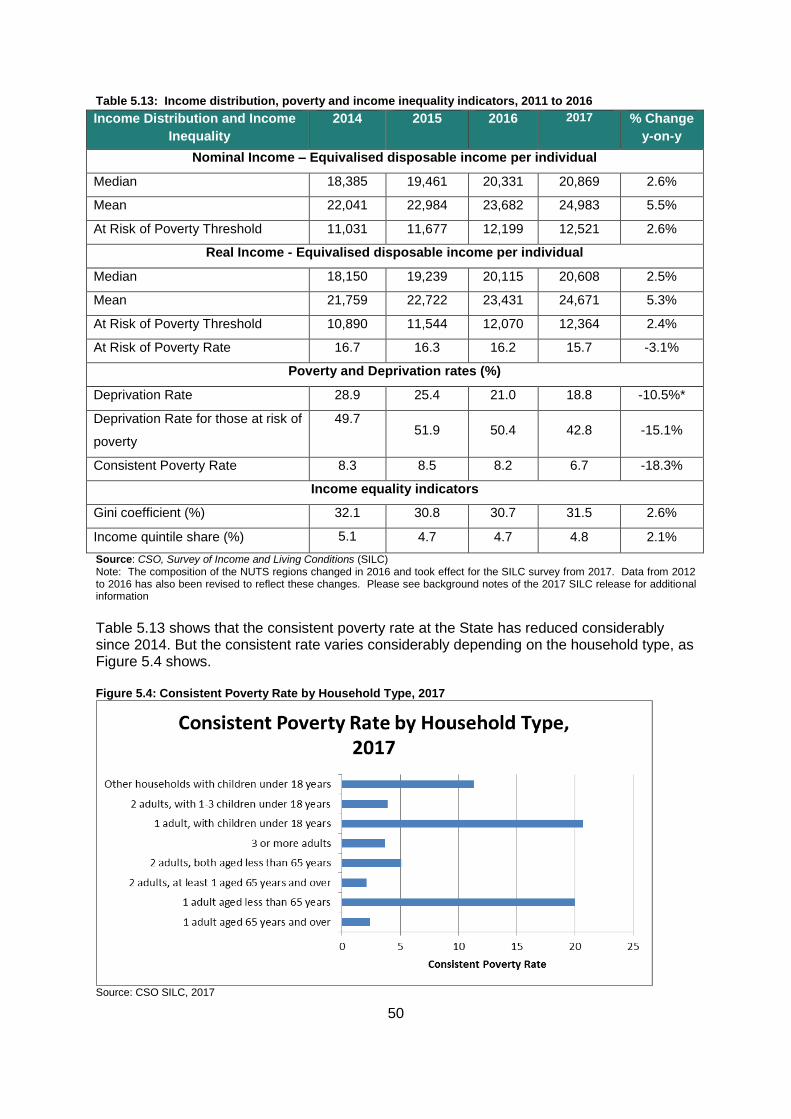
50
Table 5.13: Income distribution, poverty and income inequality indicators, 2011 to 2016
Income Distribution and Income
Inequality
2014 2015 2016 2017 % Change
y-on-y
Nominal Income – Equivalised disposable income per individual
Median 18,385 19,461 20,331 20,869 2.6%
Mean 22,041 22,984 23,682 24,983 5.5%
At Risk of Poverty Threshold 11,031 11,677 12,199 12,521 2.6%
Real Income - Equivalised disposable income per individual
Median 18,150 19,239 20,115 20,608 2.5%
Mean 21,759 22,722 23,431 24,671 5.3%
At Risk of Poverty Threshold 10,890 11,544 12,070 12,364 2.4%
At Risk of Poverty Rate 16.7 16.3 16.2 15.7 -3.1%
Poverty and Deprivation rates (%)
Deprivation Rate 28.9 25.4 21.0 18.8 -10.5%*
Deprivation Rate for those at risk of
poverty
49.7 51.9 50.4 42.8 -15.1%
Consistent Poverty Rate 8.3 8.5 8.2 6.7 -18.3%
Income equality indicators
Gini coefficient (%) 32.1 30.8 30.7 31.5 2.6%
Income quintile share (%) 5.1 4.7 4.7 4.8 2.1%
Source: CSO, Survey of Income and Living Conditions (SILC) Note: The composition of the NUTS regions changed in 2016 and took effect for the SILC survey from 2017. Data from 2012 to 2016 has also been revised to reflect these changes. Please see background notes of the 2017 SILC release for additional information
Table 5.13 shows that the consistent poverty rate at the State has reduced considerably since 2014. But the consistent rate varies considerably depending on the household type, as Figure 5.4 shows. Figure 5.4: Consistent Poverty Rate by Household Type, 2017
Source: CSO SILC, 2017

51
5.10 Poverty and Employment Status
Data from the most recent CSO Survey of Income and Living Conditions (SILC) gives an
indication of the importance of work in tackling poverty and deprivation. Table 5.14 below
gives a breakdown of poverty and deprivation by work status i.e. for those who are at work
and those who are unemployed.
Table 5.14: Poverty Indicators by Work Status, 2016 and 2017
At Risk of Poverty 2016 2017
At work 5.8% 5.4%
Unemployed 39.2% 42.0%
Multiple 6.6 7.7
Deprivation Rate 2016 2017
At Work 12.7% 11.9%
Unemployed 42.5% 41.0%
Multiple 3.4 3.4
Consistent Poverty 2016 2017
At work 2.1% 1.4%
Unemployed 23.4% 24.1%
Multiple 11.1 17.2
Source: CSO Survey of Income and Living Conditions
The importance of work in tackling poverty and deprivation is shown by the fact that people
who are unemployed are almost 8 times more likely to be at risk of poverty, over three times
more likely to suffer deprivation and over 17 times more likely to experience consistent
poverty than people who are in work.
The distribution of market income in Ireland is one of the most unequal in the OECD. Our tax
and transfer system, on the other hand, is progressive33, resulting in a distribution of income
post-tax and transfers at around the OECD average. Appendix 5 outlines the various in-
work supports that are available through the Department of Employment Affairs and Social
Protection (such as the Working Family Payment and the Back to Work Family Dividend)
which contribute to the low levels of in-work poverty experienced in Ireland, compared to the
EU.
5.11 Impact of Previous Recommendations
Since its establishment, the Low Pay Commission recommended increases in the NMW of
50 cent (2016), 10 cent (2017), 30 cent (2018) and 25 cent (2019). Each of these
recommendations was accepted by Government, and as a result, the NMW has increased
by over 13.3 per cent in nominal terms between 2016 and 2019. A key consideration for the
Commission when making these recommendations is to assess the impact these changes
may have on the distribution of wages, and on employment and hours worked of minimum
33
A progressive tax is one which takes a larger percentage of higher incomes than it does of lower incomes.

52
wage employees. In partnership with the ESRI, the Low Pay Commission has published
various pieces of research evaluating the impacts of NMW increases since 2016. The results
are outlined below.
The Impact of the 2016 increase in the NMW:
Using data from the Quarterly National Household Survey (QNHS) for the years 2015 and
2016, the ESRI estimated the effect of the increase in the minimum wage on the hours
worked and the likelihood of job loss among low paid workers. The ESRI’s research found
no consistent evidence that the increase in NMW rate in 2016 caused an increase in the
number of low paid workers being unemployed or inactive.34
This research found a statistically significant reduction in hours worked by NMW workers.
The ESRI note ‘this was primarily driven by minimum wage workers on temporary contracts,
who experienced an average reduction of approximately 3.5 hours per week’.35 The ESRI
found that there was a large decrease in ‘involuntary part time work in 2015 and 2016
among minimum wage workers’.36 Therefore, it cannot be ruled out that this observed
reduction in hours worked came from individuals choosing to work part-time.
The ESRI also investigated the effect of the 2016 minimum wage increase on the distribution
of hourly wages and gross household income.37 This research indicates that ‘the minimum
wage was effective in increasing the wages of low-paid workers and in reducing hourly wage
inequality’.38 The ESRI showed that in the absence of a minimum wage change,
approximately 10% of workers in 2016 would have earned €9.15 per hour (the 2016 NMW)
or below. However, following the minimum wage change, approximately 6% of workers had
an hourly wage in this range. Therefore, the minimum wage change is associated with a 4
percentage point reduction in the number of workers earning €9.15 or below.
The ESRI found that ‘there may be spillover effects resulting in wage increases in the lowest
25% of the wage distribution’.39 The ESRI note ‘there are statistically significant wage effects
as far up the wage distribution as €11.50 per hour’.40 The ESRI found no effect of the 2016
minimum wage increase on the gross household income distribution.
The Impact of the 2017 increase in the NMW:
The ESRI analysis of SILC data showed that the incidence of the NMW in 2017 was once
again higher among females, non-nationals, young people, non-graduates, part-time
employees and persons employed in Sales occupations and in sectors such as
Accommodation & food and Wholesale & retail.41 While non-nationals continue to be over-
represented among minimum wage workers, their share of minimum wage employment fell
34
ESRI (2018) ‘Estimating the effect of an increase in the minimum wage on hours worked and employment in Ireland’, p. 31 https://www.esri.ie/system/files/media/file-uploads/2018-04/BKMNEXT354.pdf 35
ESRI (2018) 36
ESRI (2018), p32. 37
ESRI (2019) ‘The impact of a change in the National Minimum Wage on the distribution of hourly wages and household income in Ireland’ 38
ESRI (2019) p. 21 39
ESRI (2019) ‘p. 21 40
ESRI (2019) p. 21 41
ESRI (2019) ‘A Note on the National Minimum Wage’ (unpublished)
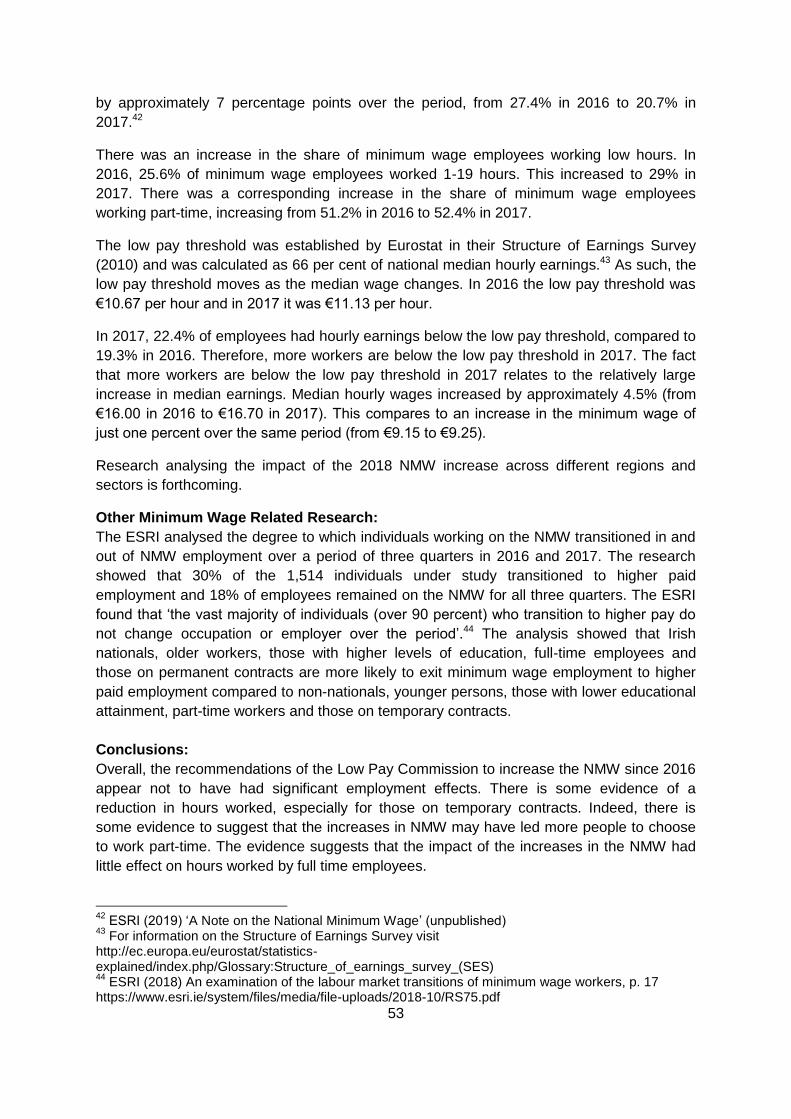
53
by approximately 7 percentage points over the period, from 27.4% in 2016 to 20.7% in
2017.42
There was an increase in the share of minimum wage employees working low hours. In
2016, 25.6% of minimum wage employees worked 1-19 hours. This increased to 29% in
2017. There was a corresponding increase in the share of minimum wage employees
working part-time, increasing from 51.2% in 2016 to 52.4% in 2017.
The low pay threshold was established by Eurostat in their Structure of Earnings Survey
(2010) and was calculated as 66 per cent of national median hourly earnings.43 As such, the
low pay threshold moves as the median wage changes. In 2016 the low pay threshold was
€10.67 per hour and in 2017 it was €11.13 per hour.
In 2017, 22.4% of employees had hourly earnings below the low pay threshold, compared to
19.3% in 2016. Therefore, more workers are below the low pay threshold in 2017. The fact
that more workers are below the low pay threshold in 2017 relates to the relatively large
increase in median earnings. Median hourly wages increased by approximately 4.5% (from
€16.00 in 2016 to €16.70 in 2017). This compares to an increase in the minimum wage of
just one percent over the same period (from €9.15 to €9.25).
Research analysing the impact of the 2018 NMW increase across different regions and
sectors is forthcoming.
Other Minimum Wage Related Research:
The ESRI analysed the degree to which individuals working on the NMW transitioned in and
out of NMW employment over a period of three quarters in 2016 and 2017. The research
showed that 30% of the 1,514 individuals under study transitioned to higher paid
employment and 18% of employees remained on the NMW for all three quarters. The ESRI
found that ‘the vast majority of individuals (over 90 percent) who transition to higher pay do
not change occupation or employer over the period’.44 The analysis showed that Irish
nationals, older workers, those with higher levels of education, full-time employees and
those on permanent contracts are more likely to exit minimum wage employment to higher
paid employment compared to non-nationals, younger persons, those with lower educational
attainment, part-time workers and those on temporary contracts.
Conclusions:
Overall, the recommendations of the Low Pay Commission to increase the NMW since 2016
appear not to have had significant employment effects. There is some evidence of a
reduction in hours worked, especially for those on temporary contracts. Indeed, there is
some evidence to suggest that the increases in NMW may have led more people to choose
to work part-time. The evidence suggests that the impact of the increases in the NMW had
little effect on hours worked by full time employees.
42
ESRI (2019) ‘A Note on the National Minimum Wage’ (unpublished) 43
For information on the Structure of Earnings Survey visit http://ec.europa.eu/eurostat/statistics-explained/index.php/Glossary:Structure_of_earnings_survey_(SES) 44
ESRI (2018) An examination of the labour market transitions of minimum wage workers, p. 17 https://www.esri.ie/system/files/media/file-uploads/2018-10/RS75.pdf
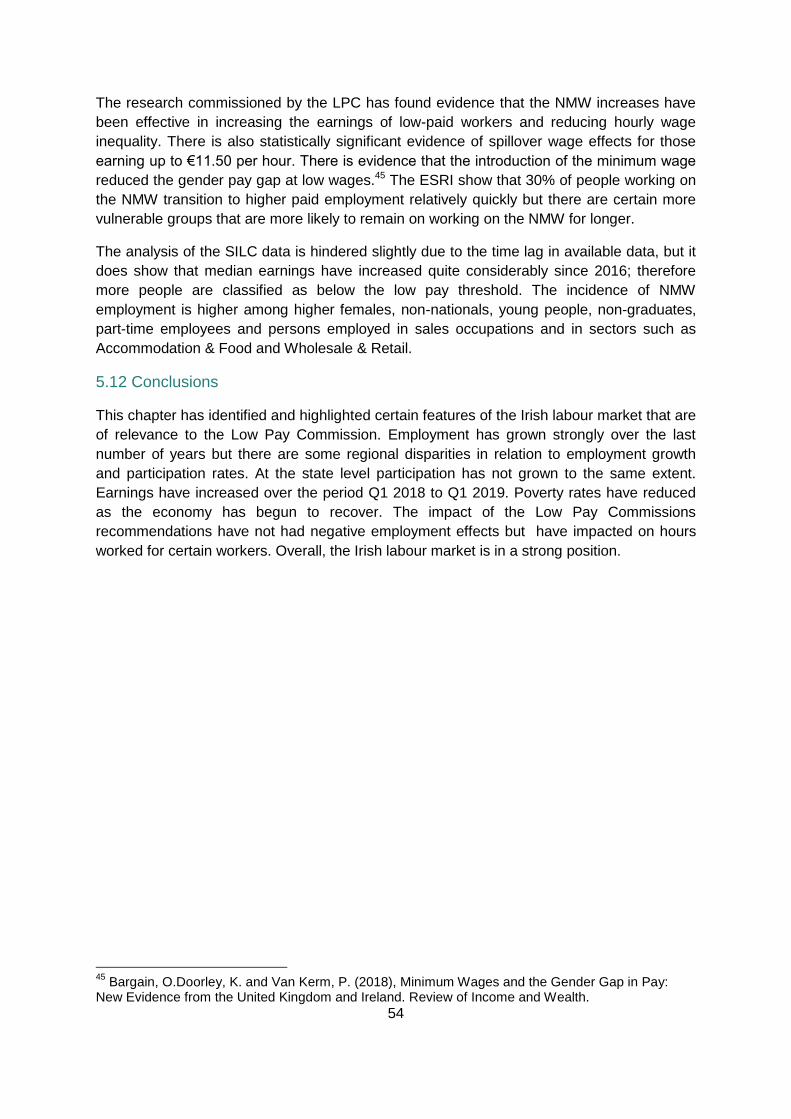
54
The research commissioned by the LPC has found evidence that the NMW increases have
been effective in increasing the earnings of low-paid workers and reducing hourly wage
inequality. There is also statistically significant evidence of spillover wage effects for those
earning up to €11.50 per hour. There is evidence that the introduction of the minimum wage
reduced the gender pay gap at low wages.45 The ESRI show that 30% of people working on
the NMW transition to higher paid employment relatively quickly but there are certain more
vulnerable groups that are more likely to remain on working on the NMW for longer.
The analysis of the SILC data is hindered slightly due to the time lag in available data, but it
does show that median earnings have increased quite considerably since 2016; therefore
more people are classified as below the low pay threshold. The incidence of NMW
employment is higher among higher females, non-nationals, young people, non-graduates,
part-time employees and persons employed in sales occupations and in sectors such as
Accommodation & Food and Wholesale & Retail.
5.12 Conclusions
This chapter has identified and highlighted certain features of the Irish labour market that are
of relevance to the Low Pay Commission. Employment has grown strongly over the last
number of years but there are some regional disparities in relation to employment growth
and participation rates. At the state level participation has not grown to the same extent.
Earnings have increased over the period Q1 2018 to Q1 2019. Poverty rates have reduced
as the economy has begun to recover. The impact of the Low Pay Commissions
recommendations have not had negative employment effects but have impacted on hours
worked for certain workers. Overall, the Irish labour market is in a strong position.
45
Bargain, O.Doorley, K. and Van Kerm, P. (2018), Minimum Wages and the Gender Gap in Pay: New Evidence from the United Kingdom and Ireland. Review of Income and Wealth.
55
Chapter 6 Compliance
6.1 Compliance and the National Minimum Wage
Compliance with the National Minimum Wage is a topic of particular concern to the
Commission. Evidence heard by the Commission during oral hearings over sucessive years
suggests that compliance and enforcement are real issues regarding the National Minimum
Wage in Ireland. The anecdotal evidence provided to the Commission indicates that
compliance is more likely to be an issue among vulnerable sections of society. The
Commission has heard evidence that undocumented workers, who tend to be non-Irish born,
are particularly vulnerable to exploitation in this regard. In addition, the Commission has
heard repeated evidence from undocumented workers who are being exploited and have
fear of seeking help and thus have little or no recourse to legal remedies or permission to
apply for work permits to regularlise their situation. The Commission is concerned that non-
compliant employers are undermining compliant employers, and are gaining an unfair
advantage over their competitors by not paying the NMW and other statutory entitlements.
Due to the nature of non-compliance, accurate data as to the numbers affected is difficult to
obtain. Addressing this, and the wider challenges around undocumented workers, goes
beyond the remit of the Commission and requires a more coordinated response by
Government. Despite this, the main data which the Commission can use to gain a measure
of the scale of the problem are statistics from the Workplace Relations Commission (WRC)
on the number of national minimum wage breaches recorded during inspections and data
from the CSO’s Labour Force Survey (LFS) as to the number of people currently being paid
less than the national minimum wage. Both of these sources have limitations but they do
provide some measure of the number of employees paid below the NMW.
6.2 Workplace Relations Commission
The Workplace Relations Commission is responsible for enforcing national minimum wage
legislation in Ireland. Its 2019 annual report provides statistics on the number of inspections
carried out and the number which resulted in NMW breaches. The WRC maintain that
awareness of the NMW is high and as such the levels of enquiry regarding the NMW are at a
low level. Given the central role of the WRC in providing information, and carrying out
inspections with regard to compliance in relation to the minimum wage and related matters,
the LPC met with that organisation in May 2019 to to discuss these issues. It was agreed to
set up a joint working group between the LPC and the WRC to share information, address
practical concerns and to examine potential solutions in this regard.
In 2018 there were 503 NMW breaches recorded out of a total of 2,548 legislative breaches
detected. NMW breaches therefore represented 19.7% of the total. In 2017, out of a total of
3,039 breaches, 409 were related to the NMW, representing 13.4% of all legislative
breaches.
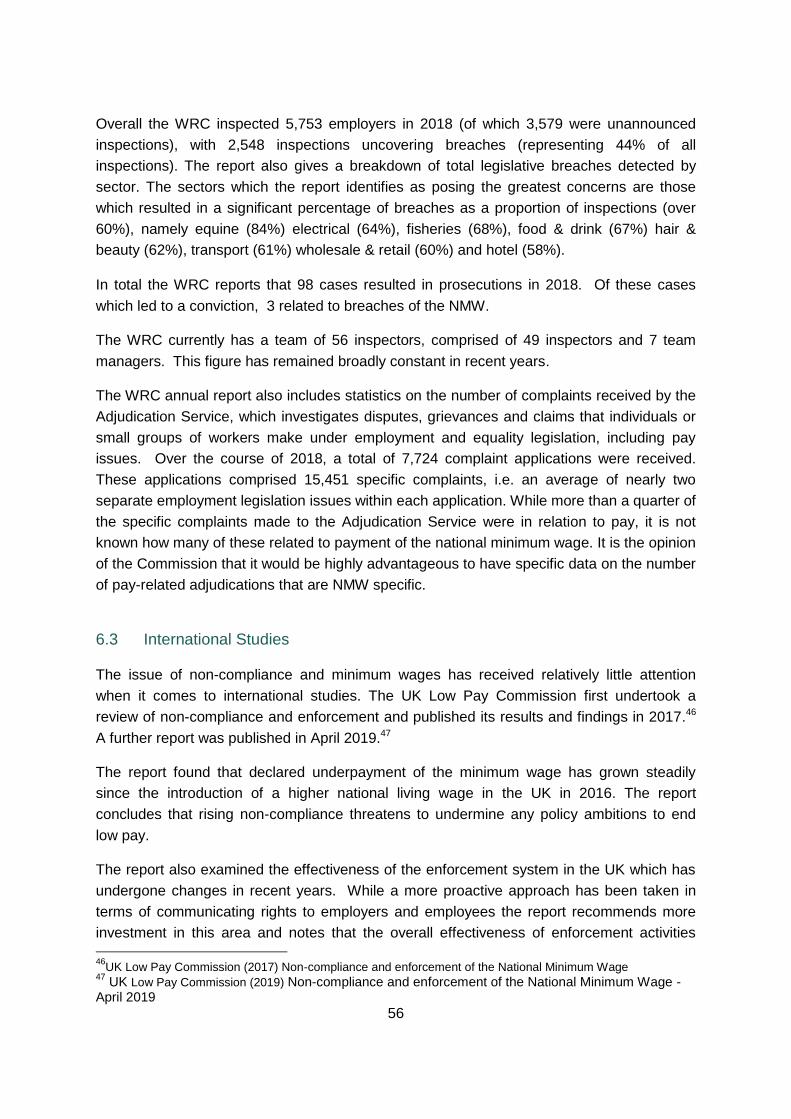
56
Overall the WRC inspected 5,753 employers in 2018 (of which 3,579 were unannounced
inspections), with 2,548 inspections uncovering breaches (representing 44% of all
inspections). The report also gives a breakdown of total legislative breaches detected by
sector. The sectors which the report identifies as posing the greatest concerns are those
which resulted in a significant percentage of breaches as a proportion of inspections (over
60%), namely equine (84%) electrical (64%), fisheries (68%), food & drink (67%) hair &
beauty (62%), transport (61%) wholesale & retail (60%) and hotel (58%).
In total the WRC reports that 98 cases resulted in prosecutions in 2018. Of these cases
which led to a conviction, 3 related to breaches of the NMW.
The WRC currently has a team of 56 inspectors, comprised of 49 inspectors and 7 team
managers. This figure has remained broadly constant in recent years.
The WRC annual report also includes statistics on the number of complaints received by the
Adjudication Service, which investigates disputes, grievances and claims that individuals or
small groups of workers make under employment and equality legislation, including pay
issues. Over the course of 2018, a total of 7,724 complaint applications were received.
These applications comprised 15,451 specific complaints, i.e. an average of nearly two
separate employment legislation issues within each application. While more than a quarter of
the specific complaints made to the Adjudication Service were in relation to pay, it is not
known how many of these related to payment of the national minimum wage. It is the opinion
of the Commission that it would be highly advantageous to have specific data on the number
of pay-related adjudications that are NMW specific.
6.3 International Studies
The issue of non-compliance and minimum wages has received relatively little attention
when it comes to international studies. The UK Low Pay Commission first undertook a
review of non-compliance and enforcement and published its results and findings in 2017.46
A further report was published in April 2019.47
The report found that declared underpayment of the minimum wage has grown steadily
since the introduction of a higher national living wage in the UK in 2016. The report
concludes that rising non-compliance threatens to undermine any policy ambitions to end
low pay.
The report also examined the effectiveness of the enforcement system in the UK which has
undergone changes in recent years. While a more proactive approach has been taken in
terms of communicating rights to employers and employees the report recommends more
investment in this area and notes that the overall effectiveness of enforcement activities
46
UK Low Pay Commission (2017) Non-compliance and enforcement of the National Minimum Wage 47
UK Low Pay Commission (2019) Non-compliance and enforcement of the National Minimum Wage - April 2019
57
remains difficult to judge. The report also recommends that the UK Government considers
how to build confidence in the complaints process by working with trade unions and gaining
further understanding of the barriers to reporting.
6.4 Low Pay Commission Recommendations and Points of Action
In its 2017 and 2018 reports and recommendations on the National Minimum Wage the
Commission stressed the importance of compliance when it comes to the NMW. The
Commission unanimously recommended that:
1. “Provision should be made for the display of basic entitlements in all places of
employment where the minimum wage is in operation.”
The Commission remains strongly of the view that such a notice would help to create and
foster a culture of compliance with regard to the NMW, and improve awareness of minimum
wage, and employment rights entitlements more generally. Anecdotal evidence of non-
compliance which the Commission has heard in oral hearings would suggest that in many
cases employees are not aware of their rights and entitlements under existing legislation and
as such are more open to exploitation. Furthermore, the evidence presented to the
Commission highlighted that this issue is of particular concern as it relates to migrant
workers.
The Commission strongly recommends, on a unanimous basis, that this issue be addressed
as a matter of priority and urgency. The Commission notes that it has previously made this
recommendation to the Minister. Creating greater awareness of the NMW and workers
entitlements will help to prevent violations of national minimum wage legislation and is more
cost-effective than setting up extensive monitoring and sanctioning mechanisms.
Furthermore, it would assist the WRC in carrying out its inspectorate functions.
2. The Commission and the Workplace Relations Commission have agreed to set up a
working group on the issue of compliance. This group will share information, address
practical concerns and to examine potential solutions in this regard.
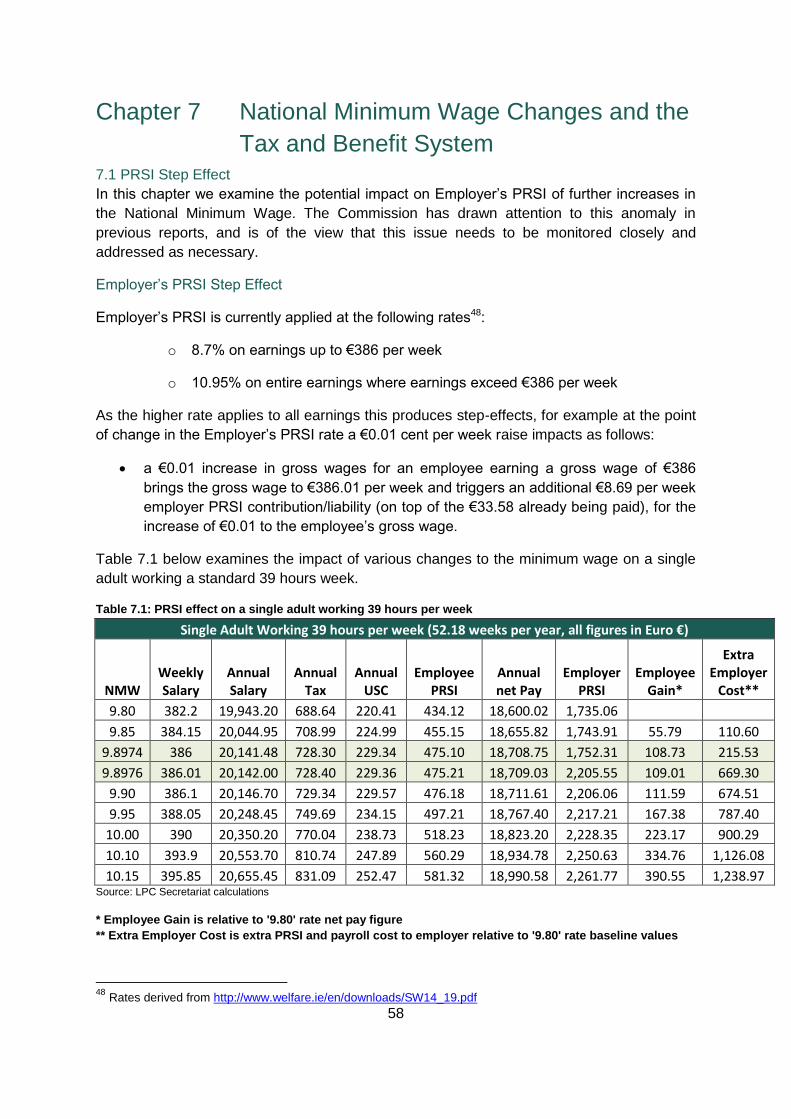
58
Chapter 7 National Minimum Wage Changes and the
Tax and Benefit System 7.1 PRSI Step Effect
In this chapter we examine the potential impact on Employer’s PRSI of further increases in
the National Minimum Wage. The Commission has drawn attention to this anomaly in
previous reports, and is of the view that this issue needs to be monitored closely and
addressed as necessary.
Employer’s PRSI Step Effect
Employer’s PRSI is currently applied at the following rates48:
o 8.7% on earnings up to €386 per week
o 10.95% on entire earnings where earnings exceed €386 per week
As the higher rate applies to all earnings this produces step-effects, for example at the point
of change in the Employer’s PRSI rate a €0.01 cent per week raise impacts as follows:
a €0.01 increase in gross wages for an employee earning a gross wage of €386
brings the gross wage to €386.01 per week and triggers an additional €8.69 per week
employer PRSI contribution/liability (on top of the €33.58 already being paid), for the
increase of €0.01 to the employee’s gross wage.
Table 7.1 below examines the impact of various changes to the minimum wage on a single
adult working a standard 39 hours week.
Table 7.1: PRSI effect on a single adult working 39 hours per week
Single Adult Working 39 hours per week (52.18 weeks per year, all figures in Euro €)
NMW Weekly Salary
Annual Salary
Annual Tax
Annual USC
Employee PRSI
Annual net Pay
Employer PRSI
Employee Gain*
Extra Employer
Cost**
9.80 382.2 19,943.20 688.64 220.41 434.12 18,600.02 1,735.06
9.85 384.15 20,044.95 708.99 224.99 455.15 18,655.82 1,743.91 55.79 110.60
9.8974 386 20,141.48 728.30 229.34 475.10 18,708.75 1,752.31 108.73 215.53
9.8976 386.01 20,142.00 728.40 229.36 475.21 18,709.03 2,205.55 109.01 669.30
9.90 386.1 20,146.70 729.34 229.57 476.18 18,711.61 2,206.06 111.59 674.51
9.95 388.05 20,248.45 749.69 234.15 497.21 18,767.40 2,217.21 167.38 787.40
10.00 390 20,350.20 770.04 238.73 518.23 18,823.20 2,228.35 223.17 900.29
10.10 393.9 20,553.70 810.74 247.89 560.29 18,934.78 2,250.63 334.76 1,126.08
10.15 395.85 20,655.45 831.09 252.47 581.32 18,990.58 2,261.77 390.55 1,238.97 Source: LPC Secretariat calculations
* Employee Gain is relative to '9.80' rate net pay figure
** Extra Employer Cost is extra PRSI and payroll cost to employer relative to '9.80' rate baseline values
48
Rates derived from http://www.welfare.ie/en/downloads/SW14_19.pdf

59
An increase of, for example, €0.10 in the hourly NMW, to bring the rate to €9.90 per hour
would generate a net gain to the employee of €111.59 per annum, while costing the
employer an additional €674.51. The cost to the employer in this example is six times the
benefit to the employee.
7.2 Social Welfare Implications:
The Commission has heard evidence of the disincentives or perceived disincentives of work
for some people who are receiving support through the social protection system.
Some of the major concerns expressed were the withdrawal of secondary benefits when an
individual takes up employment, and the steep withdrawal of social welfare support when a
person starts or increases their hours of employment.
A key part of making the transition into the labour market smoother is to ensure that these
individuals receive tailored information relevant to their particular circumstances i.e. Working
Family Payment, Back to Work Family Dividend, JobsPlus and information on retention of
Medical Card and impact on rent supplement / Housing Assistance Payment.
The OECD highlight that ‘a good coordination between minimum wages and the tax and
benefits system is key to mutually reinforce their impact. As discussed above, such
coordination helps to make minimum wages more effective in ensuring that work pays and
addressing poverty, without significant employment losses’.49 The Commission wants to
highlight the importance of coordinating the design of social protection schemes with how
the NMW changes and develops. The Low Pay Commission has asked the OECD to carry
out an analysis of the how the tax and benefit system interacts with the NMW for different
types of workers and families and hope that this will contribute to a better understanding of
how to design social welfare schemes to account for work incentives and poverty reduction.
One parent families are one of the groups that are most vulnerable in society and it would
appear that their marginal effective tax rate to return to work is high and that the benefits of
national minimum wage increases do not benefit this family type as much as coupled family
types. Preliminary results from this OECD research suggest that increases in the NMW do
not result in large net gains for particularly vulnerable individuals such as lone parents. As
Figure 7.2 shows lone parents in Ireland have the fifth lowest net gain from a 5% increase in
the NMW in the OECD. This is driven primarily by the large reduction in benefits that lone
parents experience as their earnings increase.
49
OECD (2018) The OECD Jobs Strategy: Chapter 8. Promoting fair wages and labour taxes
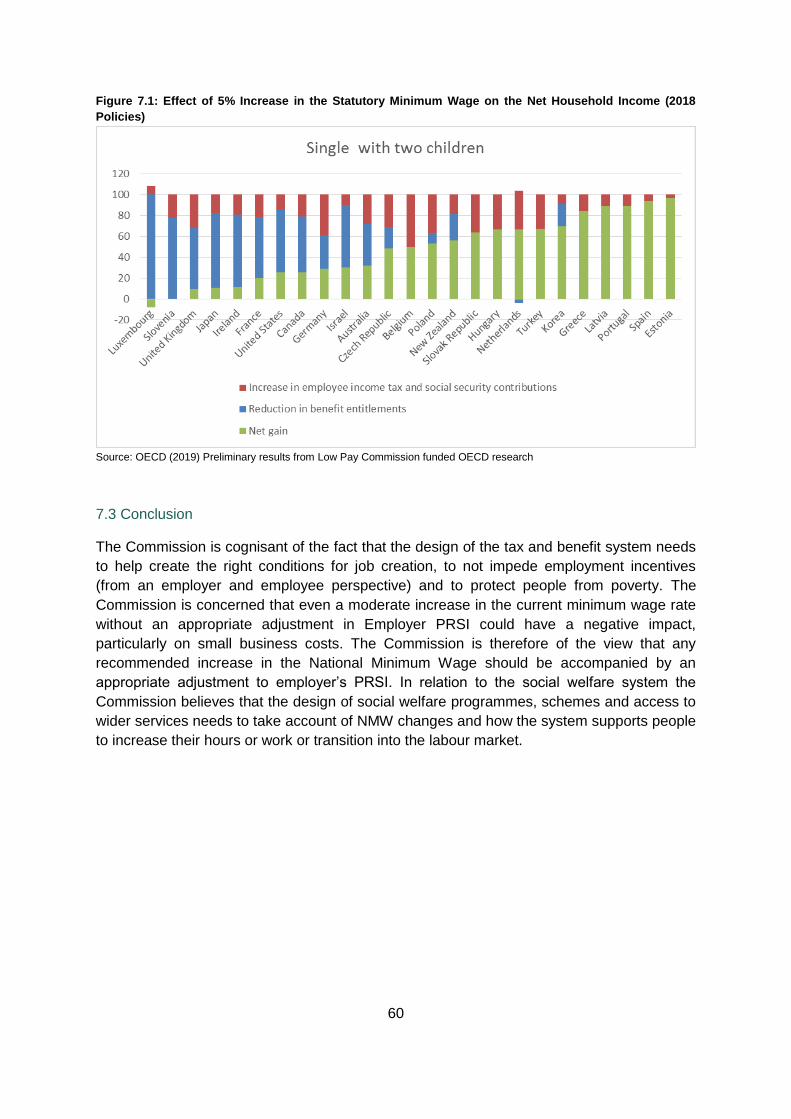
60
Figure 7.1: Effect of 5% Increase in the Statutory Minimum Wage on the Net Household Income (2018
Policies)
Source: OECD (2019) Preliminary results from Low Pay Commission funded OECD research
7.3 Conclusion
The Commission is cognisant of the fact that the design of the tax and benefit system needs
to help create the right conditions for job creation, to not impede employment incentives
(from an employer and employee perspective) and to protect people from poverty. The
Commission is concerned that even a moderate increase in the current minimum wage rate
without an appropriate adjustment in Employer PRSI could have a negative impact,
particularly on small business costs. The Commission is therefore of the view that any
recommended increase in the National Minimum Wage should be accompanied by an
appropriate adjustment to employer’s PRSI. In relation to the social welfare system the
Commission believes that the design of social welfare programmes, schemes and access to
wider services needs to take account of NMW changes and how the system supports people
to increase their hours or work or transition into the labour market.
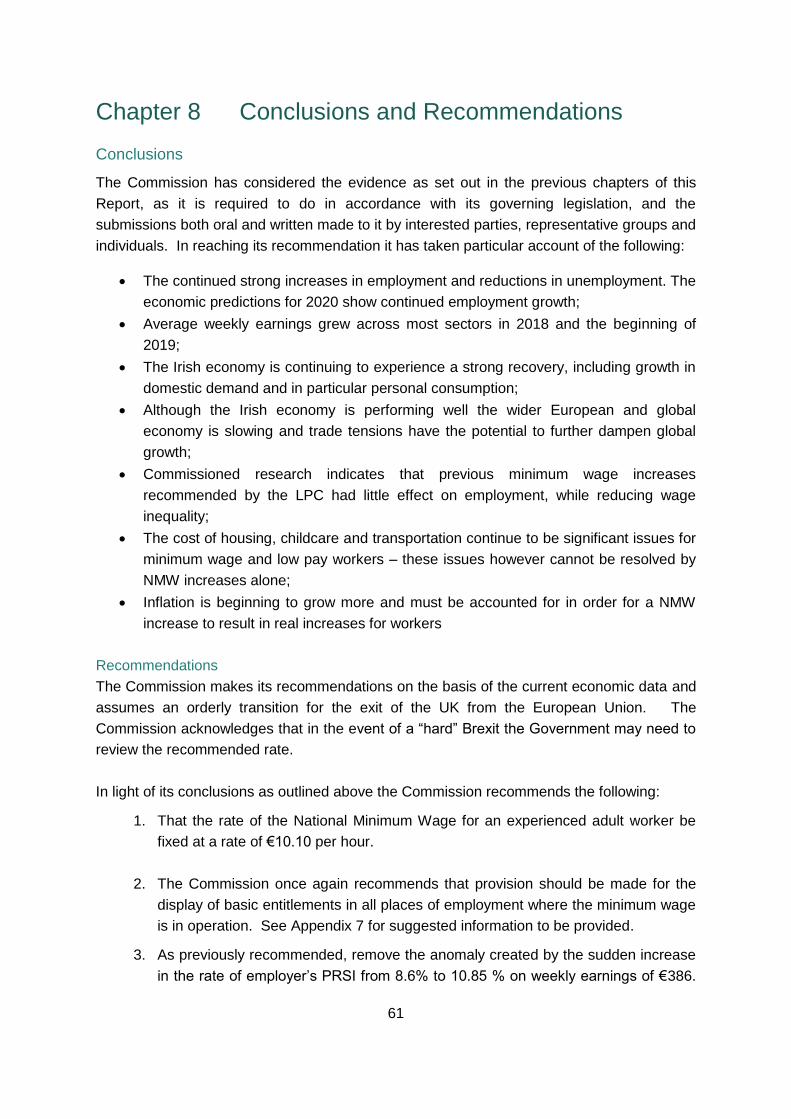
61
Chapter 8 Conclusions and Recommendations
Conclusions
The Commission has considered the evidence as set out in the previous chapters of this
Report, as it is required to do in accordance with its governing legislation, and the
submissions both oral and written made to it by interested parties, representative groups and
individuals. In reaching its recommendation it has taken particular account of the following:
The continued strong increases in employment and reductions in unemployment. The
economic predictions for 2020 show continued employment growth;
Average weekly earnings grew across most sectors in 2018 and the beginning of
2019;
The Irish economy is continuing to experience a strong recovery, including growth in
domestic demand and in particular personal consumption;
Although the Irish economy is performing well the wider European and global
economy is slowing and trade tensions have the potential to further dampen global
growth;
Commissioned research indicates that previous minimum wage increases
recommended by the LPC had little effect on employment, while reducing wage
inequality;
The cost of housing, childcare and transportation continue to be significant issues for
minimum wage and low pay workers – these issues however cannot be resolved by
NMW increases alone;
Inflation is beginning to grow more and must be accounted for in order for a NMW
increase to result in real increases for workers
Recommendations
The Commission makes its recommendations on the basis of the current economic data and
assumes an orderly transition for the exit of the UK from the European Union. The
Commission acknowledges that in the event of a “hard” Brexit the Government may need to
review the recommended rate.
In light of its conclusions as outlined above the Commission recommends the following:
1. That the rate of the National Minimum Wage for an experienced adult worker be
fixed at a rate of €10.10 per hour.
2. The Commission once again recommends that provision should be made for the
display of basic entitlements in all places of employment where the minimum wage
is in operation. See Appendix 7 for suggested information to be provided.
3. As previously recommended, remove the anomaly created by the sudden increase
in the rate of employer’s PRSI from 8.6% to 10.85 % on weekly earnings of €386.

62
The Commission is of the view that this issue has reached a critical juncture given
the recommended increase in the NMW, and stresses the need for the
Government to address this issue.
The recommendation on the hourly rate is supported by six of the nine members of the
Commission. The recommendation is not supported by three members of the Commission.
Those members have written a minority statement, which follows the main body of the
Report.
Recommendations 2 and 3 are supported unanimously by all 9 members of the Commission.
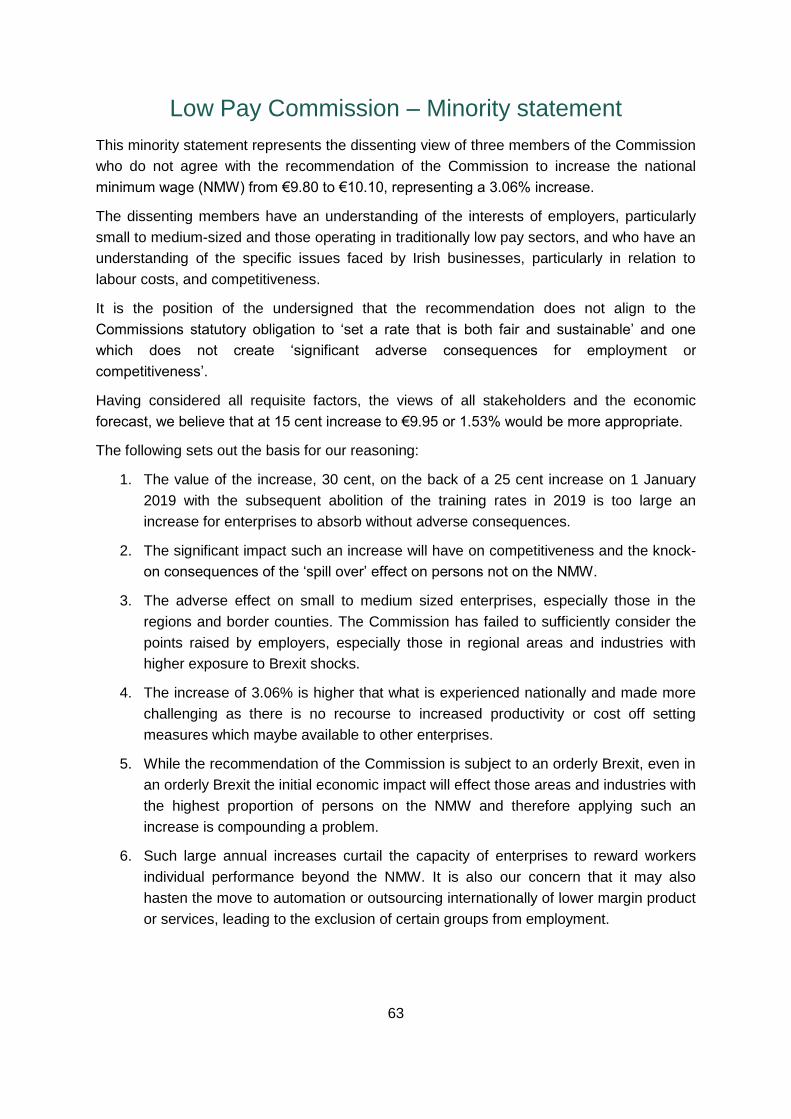
63
Low Pay Commission – Minority statement
This minority statement represents the dissenting view of three members of the Commission
who do not agree with the recommendation of the Commission to increase the national
minimum wage (NMW) from €9.80 to €10.10, representing a 3.06% increase.
The dissenting members have an understanding of the interests of employers, particularly
small to medium-sized and those operating in traditionally low pay sectors, and who have an
understanding of the specific issues faced by Irish businesses, particularly in relation to
labour costs, and competitiveness.
It is the position of the undersigned that the recommendation does not align to the
Commissions statutory obligation to ‘set a rate that is both fair and sustainable’ and one
which does not create ‘significant adverse consequences for employment or
competitiveness’.
Having considered all requisite factors, the views of all stakeholders and the economic
forecast, we believe that at 15 cent increase to €9.95 or 1.53% would be more appropriate.
The following sets out the basis for our reasoning:
1. The value of the increase, 30 cent, on the back of a 25 cent increase on 1 January
2019 with the subsequent abolition of the training rates in 2019 is too large an
increase for enterprises to absorb without adverse consequences.
2. The significant impact such an increase will have on competitiveness and the knock-
on consequences of the ‘spill over’ effect on persons not on the NMW.
3. The adverse effect on small to medium sized enterprises, especially those in the
regions and border counties. The Commission has failed to sufficiently consider the
points raised by employers, especially those in regional areas and industries with
higher exposure to Brexit shocks.
4. The increase of 3.06% is higher that what is experienced nationally and made more
challenging as there is no recourse to increased productivity or cost off setting
measures which maybe available to other enterprises.
5. While the recommendation of the Commission is subject to an orderly Brexit, even in
an orderly Brexit the initial economic impact will effect those areas and industries with
the highest proportion of persons on the NMW and therefore applying such an
increase is compounding a problem.
6. Such large annual increases curtail the capacity of enterprises to reward workers
individual performance beyond the NMW. It is also our concern that it may also
hasten the move to automation or outsourcing internationally of lower margin product
or services, leading to the exclusion of certain groups from employment.

64
Competitiveness
As set out in the main body of the report, Ireland’s current NMW is already amongst the
highest in the EU in absolute terms, and a negative impact on competitiveness could
undermine the growth that has been achieved in recent years. Ireland’s NMW is currently the
third highest behind Luxemburg (€11.97) and France (€10.03), this proposed increase will
move it to second behind Luxemburg.
In 2018, labour costs grew by 2.9%, four times higher than inflation. In Ireland wages and
salaries accounted for 86% of total labour cost compared to 74% in the euro area and 82%
in the UK. This is of serious concern to us as we experience slowing growth levels and the
impact on Ireland’s ability to continue to attract and maintain investment and compete with
the UK in a post Brexit environment.
The NMW increased by 50 cent (2016), 10 cent (2017) and 30 cent (2018) 25 cent (2019) or
13.3% in nominal terms during the same period. If the recommendation for a 30 cent
increase is applied, there will have been a nominal increase of 9.2% from 2017- 2020. Such
increases are not sustainable in the regions and industries where the NMW is more
prevalent and is greater than the levels of wage increases seen nationally for the same
period.
The ESRI has found ‘there are statistically significant wage effects as far up the wage
distribution as €11.50 per hour’, when the NMW is increased. We heard from employers
during the public consultation that they had experienced such ‘spill-overs’ effect and it was
causing significant pressure in an already high cost operating environment.
Economic Environment
It is the position of the dissenting members that such an increase is too high, given slowing
growth levels and the economic impact of those sectors most exposed to Brexit even in an
orderly context. The slow growth rate is reflective of Irish and global economies reaching the
mature stage of the business cycle, thereby reducing enterprises ability to absorb further
increases.
As identified by the Department of Finance any further depreciation of sterling is likely to
cause serious disruption to the Irish economy. The implications of this are that exports to the
UK will become more expensive and this will have knock-on effects on employment and
output. The sectors most likely to be impacted by exchange rate volatility are those trading
heavily with the UK including agri-food, tourism and cross-border trade, all of which have a
high proportion of NMW workers.
The proposed increase of 3.06% is well ahead of inflation for the 12 months to April 2019
and projected ‘core’ inflation which 1.1% for 2019. This decade remains on track to have
experienced the lowest price inflation of any since independence.
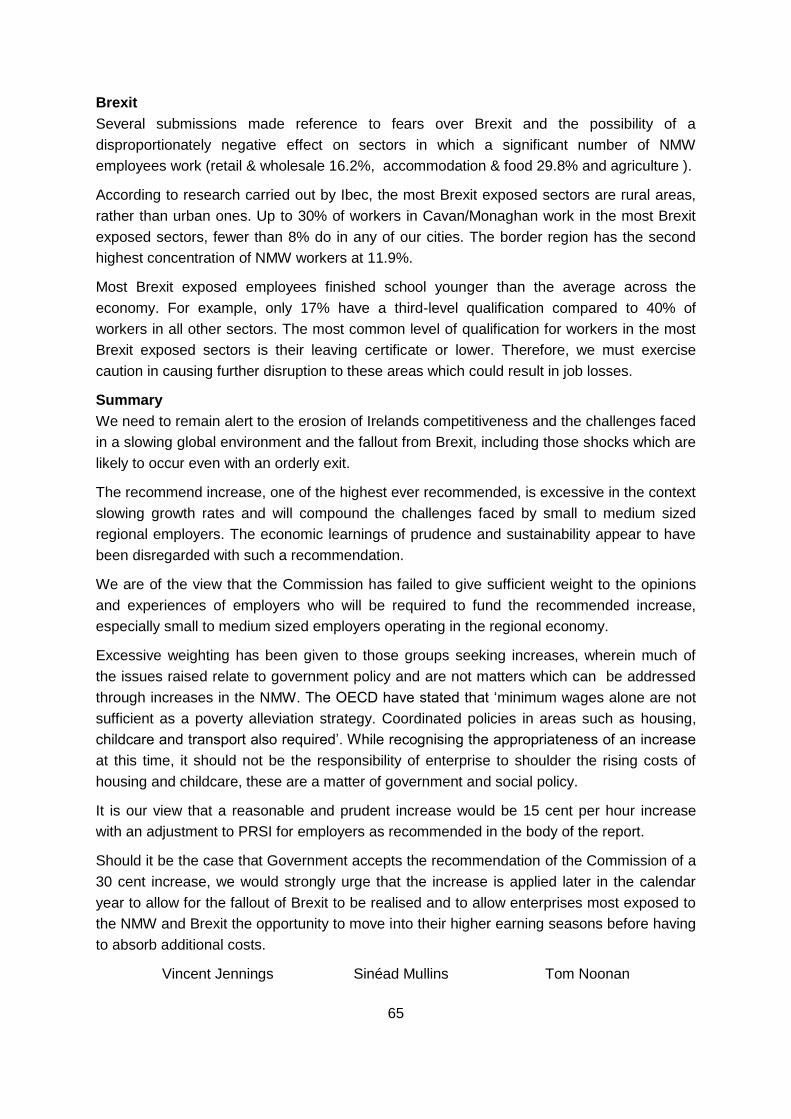
65
Brexit
Several submissions made reference to fears over Brexit and the possibility of a
disproportionately negative effect on sectors in which a significant number of NMW
employees work (retail & wholesale 16.2%, accommodation & food 29.8% and agriculture ).
According to research carried out by Ibec, the most Brexit exposed sectors are rural areas,
rather than urban ones. Up to 30% of workers in Cavan/Monaghan work in the most Brexit
exposed sectors, fewer than 8% do in any of our cities. The border region has the second
highest concentration of NMW workers at 11.9%.
Most Brexit exposed employees finished school younger than the average across the
economy. For example, only 17% have a third-level qualification compared to 40% of
workers in all other sectors. The most common level of qualification for workers in the most
Brexit exposed sectors is their leaving certificate or lower. Therefore, we must exercise
caution in causing further disruption to these areas which could result in job losses.
Summary
We need to remain alert to the erosion of Irelands competitiveness and the challenges faced
in a slowing global environment and the fallout from Brexit, including those shocks which are
likely to occur even with an orderly exit.
The recommend increase, one of the highest ever recommended, is excessive in the context
slowing growth rates and will compound the challenges faced by small to medium sized
regional employers. The economic learnings of prudence and sustainability appear to have
been disregarded with such a recommendation.
We are of the view that the Commission has failed to give sufficient weight to the opinions
and experiences of employers who will be required to fund the recommended increase,
especially small to medium sized employers operating in the regional economy.
Excessive weighting has been given to those groups seeking increases, wherein much of
the issues raised relate to government policy and are not matters which can be addressed
through increases in the NMW. The OECD have stated that ‘minimum wages alone are not
sufficient as a poverty alleviation strategy. Coordinated policies in areas such as housing,
childcare and transport also required’. While recognising the appropriateness of an increase
at this time, it should not be the responsibility of enterprise to shoulder the rising costs of
housing and childcare, these are a matter of government and social policy.
It is our view that a reasonable and prudent increase would be 15 cent per hour increase
with an adjustment to PRSI for employers as recommended in the body of the report.
Should it be the case that Government accepts the recommendation of the Commission of a
30 cent increase, we would strongly urge that the increase is applied later in the calendar
year to allow for the fallout of Brexit to be realised and to allow enterprises most exposed to
the NMW and Brexit the opportunity to move into their higher earning seasons before having
to absorb additional costs.
Vincent Jennings Sinéad Mullins Tom Noonan

i
APPENDICES
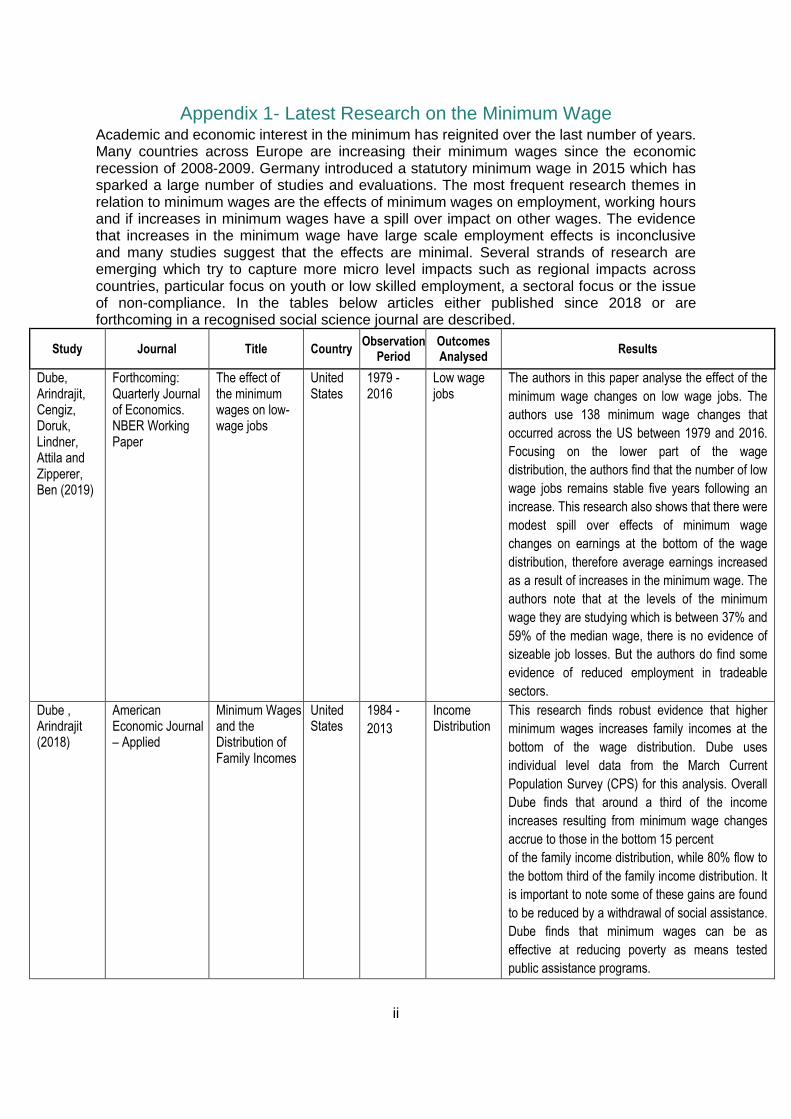
ii
Appendix 1- Latest Research on the Minimum Wage Academic and economic interest in the minimum has reignited over the last number of years. Many countries across Europe are increasing their minimum wages since the economic recession of 2008-2009. Germany introduced a statutory minimum wage in 2015 which has sparked a large number of studies and evaluations. The most frequent research themes in relation to minimum wages are the effects of minimum wages on employment, working hours and if increases in minimum wages have a spill over impact on other wages. The evidence that increases in the minimum wage have large scale employment effects is inconclusive and many studies suggest that the effects are minimal. Several strands of research are emerging which try to capture more micro level impacts such as regional impacts across countries, particular focus on youth or low skilled employment, a sectoral focus or the issue of non-compliance. In the tables below articles either published since 2018 or are forthcoming in a recognised social science journal are described.
Study Journal Title Country Observation
Period Outcomes Analysed
Results
Dube, Arindrajit, Cengiz, Doruk, Lindner, Attila and Zipperer, Ben (2019)
Forthcoming: Quarterly Journal of Economics. NBER Working Paper
The effect of the minimum wages on low-wage jobs
United States
1979 -2016
Low wage jobs
The authors in this paper analyse the effect of the
minimum wage changes on low wage jobs. The
authors use 138 minimum wage changes that
occurred across the US between 1979 and 2016.
Focusing on the lower part of the wage
distribution, the authors find that the number of low
wage jobs remains stable five years following an
increase. This research also shows that there were
modest spill over effects of minimum wage
changes on earnings at the bottom of the wage
distribution, therefore average earnings increased
as a result of increases in the minimum wage. The
authors note that at the levels of the minimum
wage they are studying which is between 37% and
59% of the median wage, there is no evidence of
sizeable job losses. But the authors do find some
evidence of reduced employment in tradeable
sectors.
Dube , Arindrajit (2018)
American Economic Journal – Applied
Minimum Wages and the Distribution of Family Incomes
United States
1984 -
2013
Income Distribution
This research finds robust evidence that higher
minimum wages increases family incomes at the
bottom of the wage distribution. Dube uses
individual level data from the March Current
Population Survey (CPS) for this analysis. Overall
Dube finds that around a third of the income
increases resulting from minimum wage changes
accrue to those in the bottom 15 percent
of the family income distribution, while 80% flow to
the bottom third of the family income distribution. It
is important to note some of these gains are found
to be reduced by a withdrawal of social assistance.
Dube finds that minimum wages can be as
effective at reducing poverty as means tested
public assistance programs.
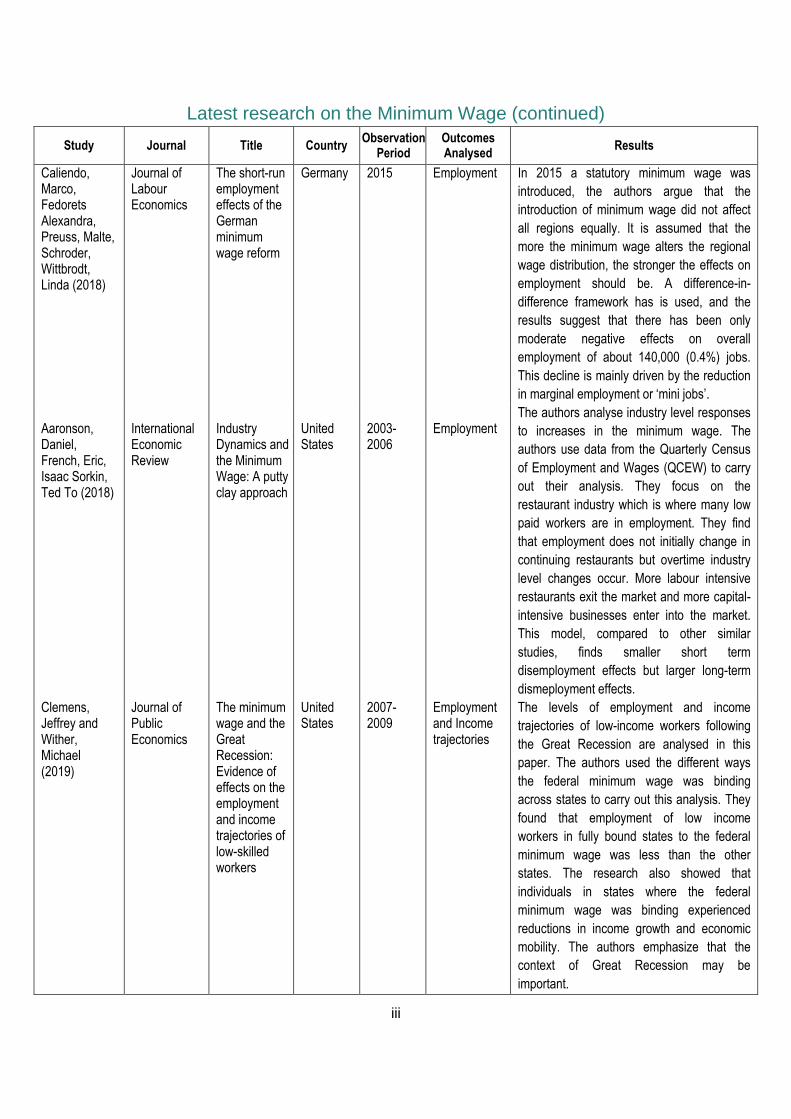
iii
Latest research on the Minimum Wage (continued)
Study Journal Title Country Observation
Period Outcomes Analysed
Results
Caliendo, Marco, Fedorets Alexandra, Preuss, Malte, Schroder, Wittbrodt, Linda (2018)
Journal of Labour Economics
The short-run employment effects of the German minimum wage reform
Germany 2015 Employment In 2015 a statutory minimum wage was
introduced, the authors argue that the
introduction of minimum wage did not affect
all regions equally. It is assumed that the
more the minimum wage alters the regional
wage distribution, the stronger the effects on
employment should be. A difference-in-
difference framework has is used, and the
results suggest that there has been only
moderate negative effects on overall
employment of about 140,000 (0.4%) jobs.
This decline is mainly driven by the reduction
in marginal employment or ‘mini jobs’.
Aaronson, Daniel, French, Eric, Isaac Sorkin, Ted To (2018)
International Economic Review
Industry Dynamics and the Minimum Wage: A putty clay approach
United States
2003-2006
Employment
The authors analyse industry level responses
to increases in the minimum wage. The
authors use data from the Quarterly Census
of Employment and Wages (QCEW) to carry
out their analysis. They focus on the
restaurant industry which is where many low
paid workers are in employment. They find
that employment does not initially change in
continuing restaurants but overtime industry
level changes occur. More labour intensive
restaurants exit the market and more capital-
intensive businesses enter into the market.
This model, compared to other similar
studies, finds smaller short term
disemployment effects but larger long-term
dismeployment effects.
Clemens, Jeffrey and Wither, Michael (2019)
Journal of Public Economics
The minimum wage and the Great Recession: Evidence of effects on the employment and income trajectories of low-skilled workers
United States
2007-2009
Employment and Income trajectories
The levels of employment and income
trajectories of low-income workers following
the Great Recession are analysed in this
paper. The authors used the different ways
the federal minimum wage was binding
across states to carry out this analysis. They
found that employment of low income
workers in fully bound states to the federal
minimum wage was less than the other
states. The research also showed that
individuals in states where the federal
minimum wage was binding experienced
reductions in income growth and economic
mobility. The authors emphasize that the
context of Great Recession may be
important.
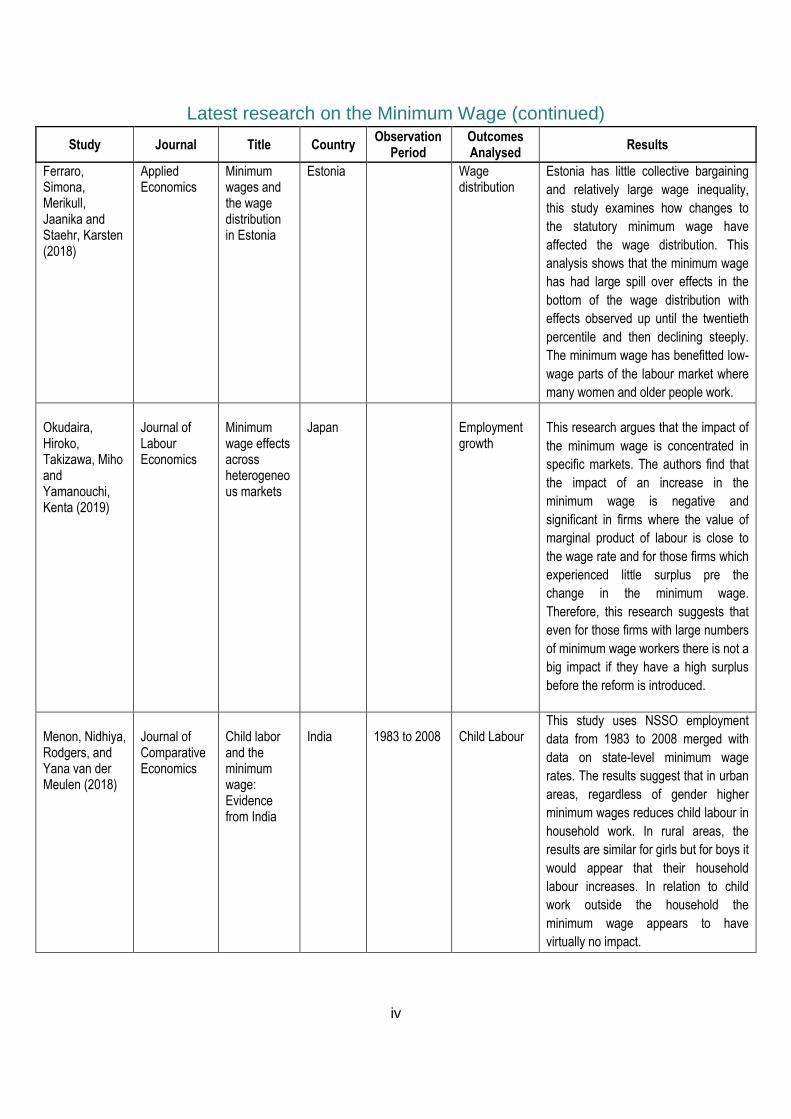
iv
Latest research on the Minimum Wage (continued)
Study Journal Title Country Observation
Period Outcomes Analysed
Results
Ferraro, Simona, Merikull, Jaanika and Staehr, Karsten (2018)
Applied Economics
Minimum wages and the wage distribution in Estonia
Estonia Wage distribution
Estonia has little collective bargaining
and relatively large wage inequality,
this study examines how changes to
the statutory minimum wage have
affected the wage distribution. This
analysis shows that the minimum wage
has had large spill over effects in the
bottom of the wage distribution with
effects observed up until the twentieth
percentile and then declining steeply.
The minimum wage has benefitted low-
wage parts of the labour market where
many women and older people work.
Okudaira, Hiroko, Takizawa, Miho and Yamanouchi, Kenta (2019)
Journal of Labour Economics
Minimum wage effects across heterogeneous markets
Japan
Employment growth
This research argues that the impact of
the minimum wage is concentrated in
specific markets. The authors find that
the impact of an increase in the
minimum wage is negative and
significant in firms where the value of
marginal product of labour is close to
the wage rate and for those firms which
experienced little surplus pre the
change in the minimum wage.
Therefore, this research suggests that
even for those firms with large numbers
of minimum wage workers there is not a
big impact if they have a high surplus
before the reform is introduced.
Menon, Nidhiya, Rodgers, and Yana van der Meulen (2018)
Journal of Comparative Economics
Child labor and the minimum wage: Evidence from India
India
1983 to 2008
Child Labour
This study uses NSSO employment
data from 1983 to 2008 merged with
data on state-level minimum wage
rates. The results suggest that in urban
areas, regardless of gender higher
minimum wages reduces child labour in
household work. In rural areas, the
results are similar for girls but for boys it
would appear that their household
labour increases. In relation to child
work outside the household the
minimum wage appears to have
virtually no impact.
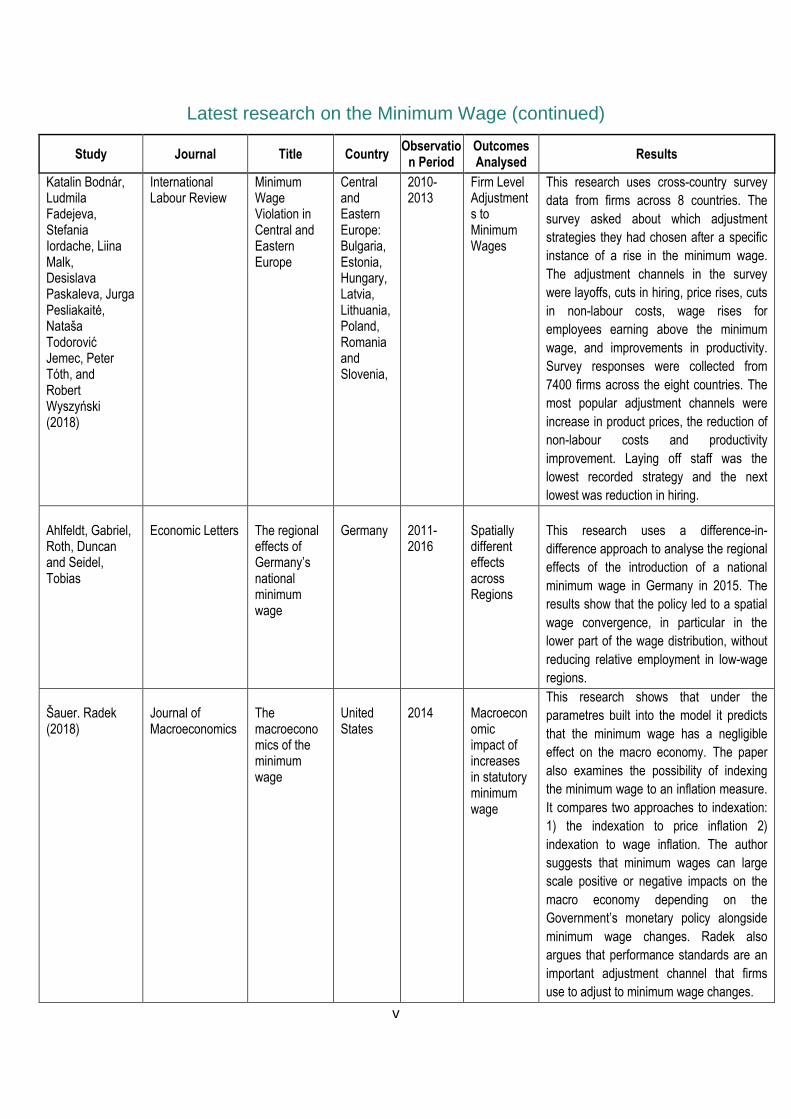
v
Latest research on the Minimum Wage (continued)
Study Journal Title Country Observatio
n Period Outcomes Analysed
Results
Katalin Bodnár, Ludmila Fadejeva, Stefania Iordache, Liina Malk, Desislava Paskaleva, Jurga Pesliakaitė, Nataša Todorović Jemec, Peter Tóth, and Robert Wyszyński (2018)
International Labour Review
Minimum Wage Violation in Central and Eastern Europe
Central and Eastern Europe: Bulgaria, Estonia, Hungary, Latvia, Lithuania, Poland, Romania and Slovenia,
2010-2013
Firm Level Adjustments to Minimum Wages
This research uses cross-country survey
data from firms across 8 countries. The
survey asked about which adjustment
strategies they had chosen after a specific
instance of a rise in the minimum wage.
The adjustment channels in the survey
were layoffs, cuts in hiring, price rises, cuts
in non-labour costs, wage rises for
employees earning above the minimum
wage, and improvements in productivity.
Survey responses were collected from
7400 firms across the eight countries. The
most popular adjustment channels were
increase in product prices, the reduction of
non-labour costs and productivity
improvement. Laying off staff was the
lowest recorded strategy and the next
lowest was reduction in hiring.
Ahlfeldt, Gabriel, Roth, Duncan and Seidel, Tobias
Economic Letters
The regional effects of Germany’s national minimum wage
Germany
2011-2016
Spatially different effects across Regions
This research uses a difference-in-
difference approach to analyse the regional
effects of the introduction of a national
minimum wage in Germany in 2015. The
results show that the policy led to a spatial
wage convergence, in particular in the
lower part of the wage distribution, without
reducing relative employment in low-wage
regions.
Šauer. Radek (2018)
Journal of Macroeconomics
The macroeconomics of the minimum wage
United States
2014
Macroeconomic impact of increases in statutory minimum wage
This research shows that under the
parametres built into the model it predicts
that the minimum wage has a negligible
effect on the macro economy. The paper
also examines the possibility of indexing
the minimum wage to an inflation measure.
It compares two approaches to indexation:
1) the indexation to price inflation 2)
indexation to wage inflation. The author
suggests that minimum wages can large
scale positive or negative impacts on the
macro economy depending on the
Government’s monetary policy alongside
minimum wage changes. Radek also
argues that performance standards are an
important adjustment channel that firms
use to adjust to minimum wage changes.
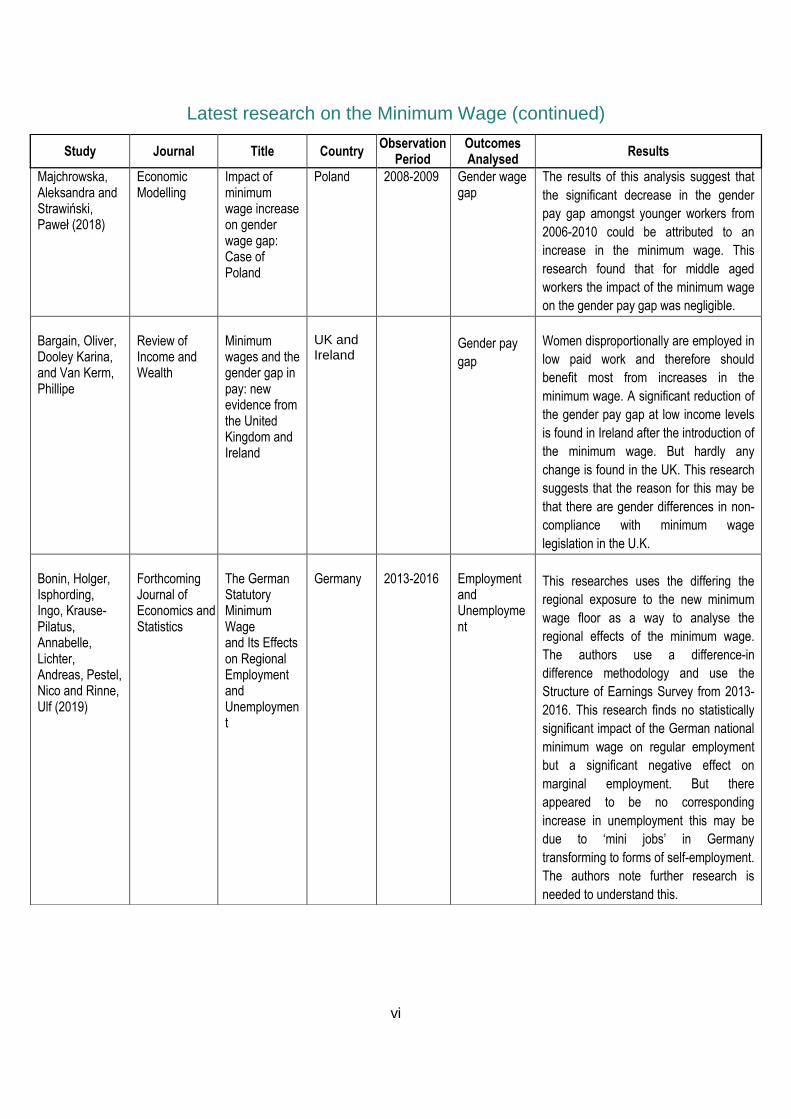
vi
Latest research on the Minimum Wage (continued)
Study Journal Title Country Observation
Period Outcomes Analysed
Results
Majchrowska, Aleksandra and Strawiński, Paweł (2018)
Economic Modelling
Impact of minimum wage increase on gender wage gap: Case of Poland
Poland 2008-2009 Gender wage gap
The results of this analysis suggest that
the significant decrease in the gender
pay gap amongst younger workers from
2006-2010 could be attributed to an
increase in the minimum wage. This
research found that for middle aged
workers the impact of the minimum wage
on the gender pay gap was negligible.
Bargain, Oliver, Dooley Karina, and Van Kerm, Phillipe
Review of Income and Wealth
Minimum wages and the gender gap in pay: new evidence from the United Kingdom and Ireland
UK and Ireland
Gender pay
gap
Women disproportionally are employed in
low paid work and therefore should
benefit most from increases in the
minimum wage. A significant reduction of
the gender pay gap at low income levels
is found in Ireland after the introduction of
the minimum wage. But hardly any
change is found in the UK. This research
suggests that the reason for this may be
that there are gender differences in non-
compliance with minimum wage
legislation in the U.K.
Bonin, Holger, Isphording, Ingo, Krause-Pilatus, Annabelle, Lichter, Andreas, Pestel, Nico and Rinne, Ulf (2019)
Forthcoming Journal of Economics and Statistics
The German Statutory Minimum Wage and Its Effects on Regional Employment and Unemployment
Germany
2013-2016
Employment and Unemployment
This researches uses the differing the
regional exposure to the new minimum
wage floor as a way to analyse the
regional effects of the minimum wage.
The authors use a difference-in
difference methodology and use the
Structure of Earnings Survey from 2013-
2016. This research finds no statistically
significant impact of the German national
minimum wage on regular employment
but a significant negative effect on
marginal employment. But there
appeared to be no corresponding
increase in unemployment this may be
due to ‘mini jobs’ in Germany
transforming to forms of self-employment.
The authors note further research is
needed to understand this.
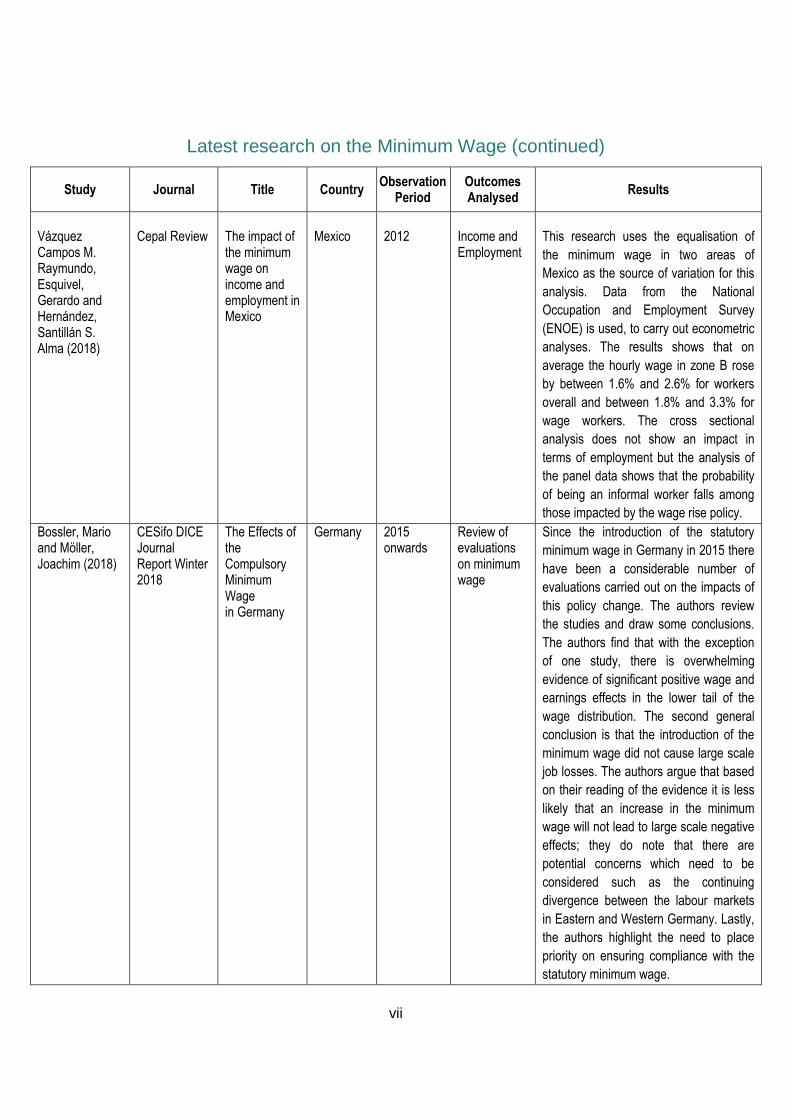
vii
Latest research on the Minimum Wage (continued)
Study Journal Title Country Observation
Period Outcomes Analysed
Results
Vázquez Campos M. Raymundo, Esquivel, Gerardo and Hernández, Santillán S. Alma (2018)
Cepal Review
The impact of the minimum wage on income and employment in Mexico
Mexico
2012
Income and Employment
This research uses the equalisation of
the minimum wage in two areas of
Mexico as the source of variation for this
analysis. Data from the National
Occupation and Employment Survey
(ENOE) is used, to carry out econometric
analyses. The results shows that on
average the hourly wage in zone B rose
by between 1.6% and 2.6% for workers
overall and between 1.8% and 3.3% for
wage workers. The cross sectional
analysis does not show an impact in
terms of employment but the analysis of
the panel data shows that the probability
of being an informal worker falls among
those impacted by the wage rise policy.
Bossler, Mario and Möller, Joachim (2018)
CESifo DICE Journal Report Winter 2018
The Effects of the Compulsory Minimum Wage in Germany
Germany 2015 onwards
Review of evaluations on minimum wage
Since the introduction of the statutory
minimum wage in Germany in 2015 there
have been a considerable number of
evaluations carried out on the impacts of
this policy change. The authors review
the studies and draw some conclusions.
The authors find that with the exception
of one study, there is overwhelming
evidence of significant positive wage and
earnings effects in the lower tail of the
wage distribution. The second general
conclusion is that the introduction of the
minimum wage did not cause large scale
job losses. The authors argue that based
on their reading of the evidence it is less
likely that an increase in the minimum
wage will not lead to large scale negative
effects; they do note that there are
potential concerns which need to be
considered such as the continuing
divergence between the labour markets
in Eastern and Western Germany. Lastly,
the authors highlight the need to place
priority on ensuring compliance with the
statutory minimum wage.
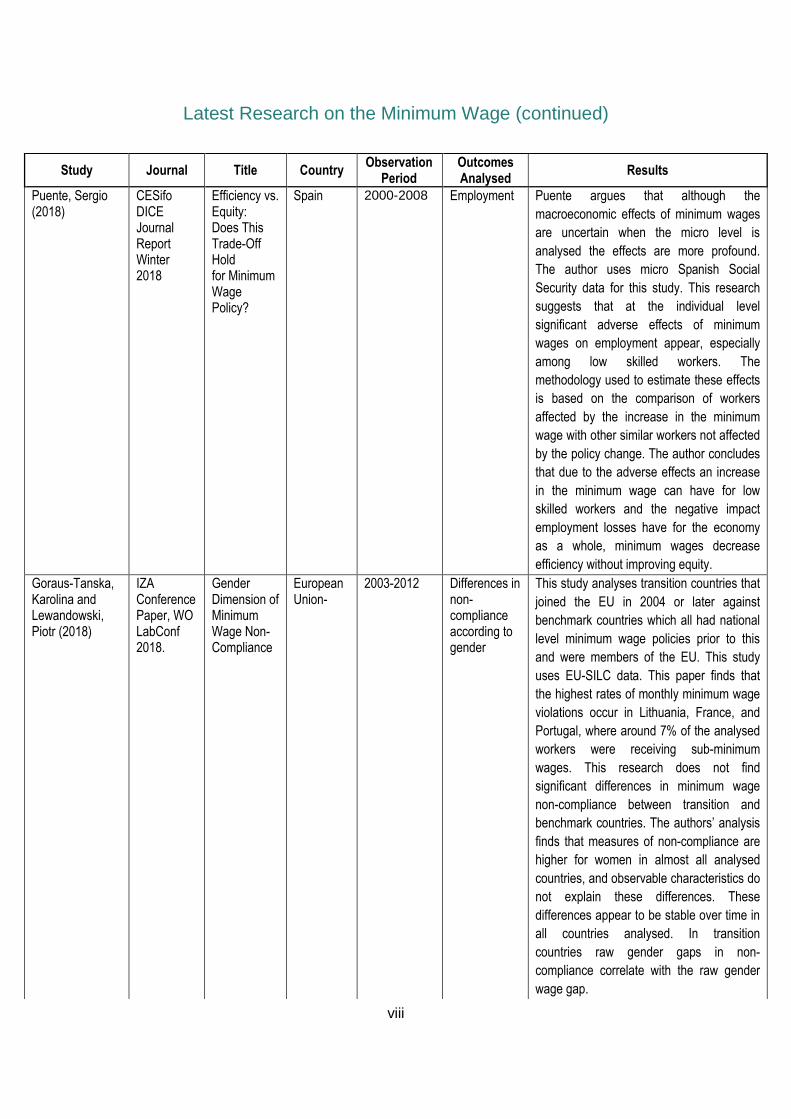
viii
Latest Research on the Minimum Wage (continued)
Study Journal Title Country Observation
Period Outcomes Analysed
Results
Puente, Sergio (2018)
CESifo DICE Journal Report Winter 2018
Efficiency vs. Equity: Does This Trade-Off Hold for Minimum Wage Policy?
Spain 2000-2008 Employment Puente argues that although the
macroeconomic effects of minimum wages
are uncertain when the micro level is
analysed the effects are more profound.
The author uses micro Spanish Social
Security data for this study. This research
suggests that at the individual level
significant adverse effects of minimum
wages on employment appear, especially
among low skilled workers. The
methodology used to estimate these effects
is based on the comparison of workers
affected by the increase in the minimum
wage with other similar workers not affected
by the policy change. The author concludes
that due to the adverse effects an increase
in the minimum wage can have for low
skilled workers and the negative impact
employment losses have for the economy
as a whole, minimum wages decrease
efficiency without improving equity.
Goraus-Tanska, Karolina and Lewandowski, Piotr (2018)
IZA Conference Paper, WO LabConf 2018.
Gender Dimension of Minimum Wage Non-Compliance
European Union-
2003-2012 Differences in non-compliance according to gender
This study analyses transition countries that
joined the EU in 2004 or later against
benchmark countries which all had national
level minimum wage policies prior to this
and were members of the EU. This study
uses EU-SILC data. This paper finds that
the highest rates of monthly minimum wage
violations occur in Lithuania, France, and
Portugal, where around 7% of the analysed
workers were receiving sub-minimum
wages. This research does not find
significant differences in minimum wage
non-compliance between transition and
benchmark countries. The authors’ analysis
finds that measures of non-compliance are
higher for women in almost all analysed
countries, and observable characteristics do
not explain these differences. These
differences appear to be stable over time in
all countries analysed. In transition
countries raw gender gaps in non-
compliance correlate with the raw gender
wage gap.
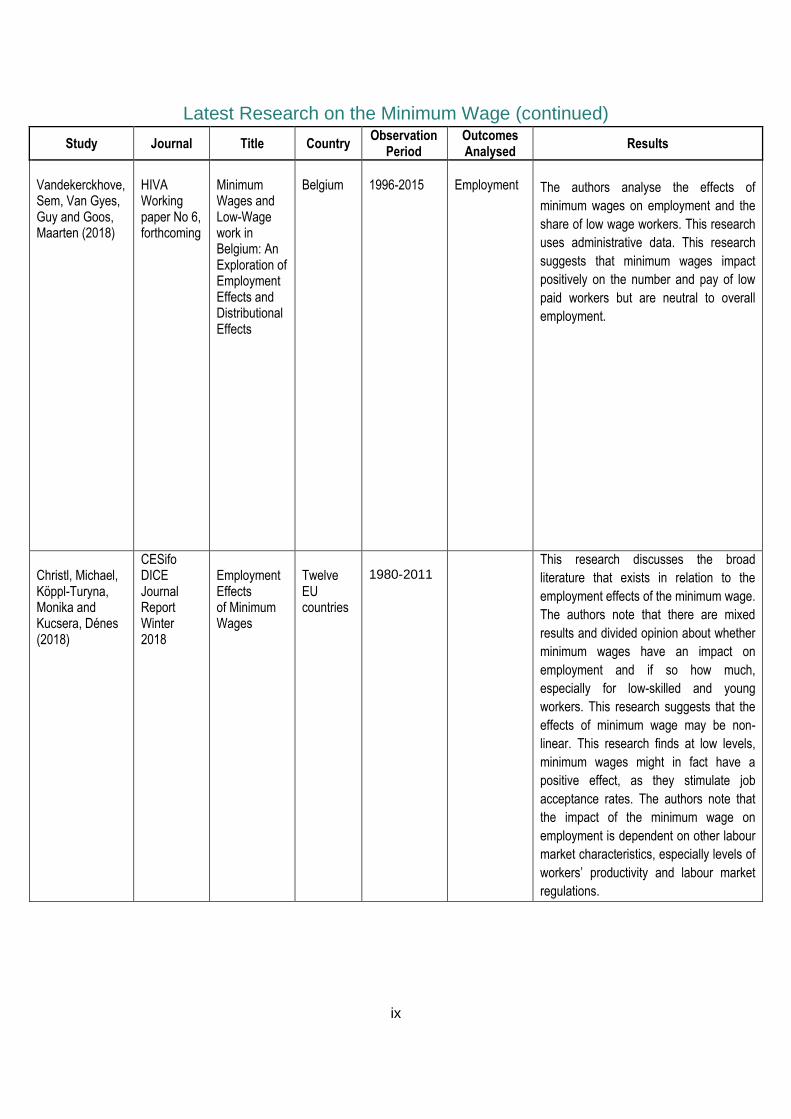
ix
Latest Research on the Minimum Wage (continued)
Study Journal Title Country Observation
Period Outcomes Analysed
Results
Vandekerckhove, Sem, Van Gyes, Guy and Goos, Maarten (2018)
HIVA Working paper No 6, forthcoming
Minimum Wages and Low-Wage work in Belgium: An Exploration of Employment Effects and Distributional Effects
Belgium
1996-2015
Employment
The authors analyse the effects of
minimum wages on employment and the
share of low wage workers. This research
uses administrative data. This research
suggests that minimum wages impact
positively on the number and pay of low
paid workers but are neutral to overall
employment.
Christl, Michael, Köppl-Turyna, Monika and Kucsera, Dénes (2018)
CESifo DICE Journal Report Winter 2018
Employment Effects of Minimum Wages
Twelve EU countries
1980-2011
This research discusses the broad
literature that exists in relation to the
employment effects of the minimum wage.
The authors note that there are mixed
results and divided opinion about whether
minimum wages have an impact on
employment and if so how much,
especially for low-skilled and young
workers. This research suggests that the
effects of minimum wage may be non-
linear. This research finds at low levels,
minimum wages might in fact have a
positive effect, as they stimulate job
acceptance rates. The authors note that
the impact of the minimum wage on
employment is dependent on other labour
market characteristics, especially levels of
workers’ productivity and labour market
regulations.
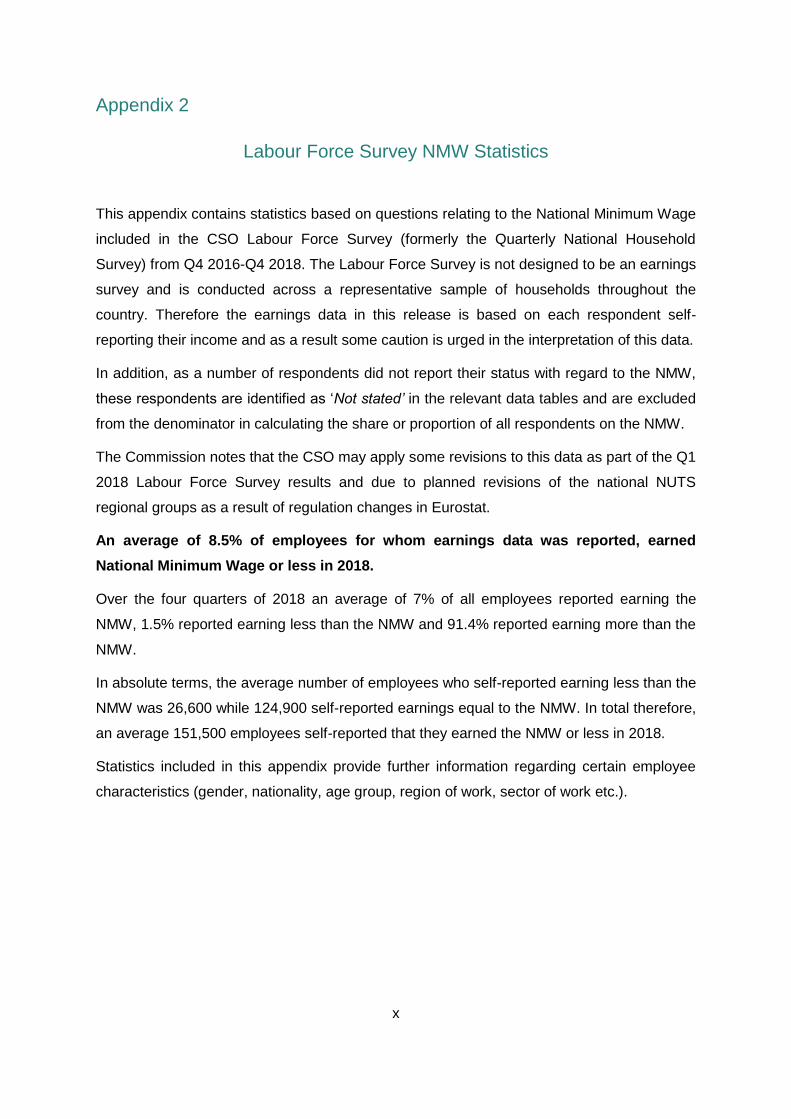
x
Appendix 2
Labour Force Survey NMW Statistics
This appendix contains statistics based on questions relating to the National Minimum Wage
included in the CSO Labour Force Survey (formerly the Quarterly National Household
Survey) from Q4 2016-Q4 2018. The Labour Force Survey is not designed to be an earnings
survey and is conducted across a representative sample of households throughout the
country. Therefore the earnings data in this release is based on each respondent self-
reporting their income and as a result some caution is urged in the interpretation of this data.
In addition, as a number of respondents did not report their status with regard to the NMW,
these respondents are identified as ‘Not stated’ in the relevant data tables and are excluded
from the denominator in calculating the share or proportion of all respondents on the NMW.
The Commission notes that the CSO may apply some revisions to this data as part of the Q1
2018 Labour Force Survey results and due to planned revisions of the national NUTS
regional groups as a result of regulation changes in Eurostat.
An average of 8.5% of employees for whom earnings data was reported, earned
National Minimum Wage or less in 2018.
Over the four quarters of 2018 an average of 7% of all employees reported earning the
NMW, 1.5% reported earning less than the NMW and 91.4% reported earning more than the
NMW.
In absolute terms, the average number of employees who self-reported earning less than the
NMW was 26,600 while 124,900 self-reported earnings equal to the NMW. In total therefore,
an average 151,500 employees self-reported that they earned the NMW or less in 2018.
Statistics included in this appendix provide further information regarding certain employee
characteristics (gender, nationality, age group, region of work, sector of work etc.).
xi
List of Tables in this Appendix
Employees aged 15 years and over. Tables A, refer to ‘000, tables B refer to %:
Table 1: Classified by detailed National Minimum Wage earnings status
Table 2: Reporting earning less than the National Minimum Wage by reason why
Table 3: Classified by gender and National Minimum Wage earnings status
Table 4: Classified by NACE Rev.2 economic sector and National Minimum Wage earnings status
Table 5: Classified by occupation and National Minimum Wage earnings status
Table 6: Classified by age group and National Minimum Wage earnings status
Table 7: Classified by NUTS2 and NUTS3 regions and National Minimum Wage earnings status
Table 8: Classified by usual hours of work per week and National Minimum Wage earnings status
Table 9: Classified by full time/part time status and National Minimum Wage earnings status
Table 10: Classified by permanency of employment and National Minimum Wage earnings status
Table 11: Classified by supervisory duties and National Minimum Wage earnings status
Table 12: Classified by duration of employment and National Minimum Wage earnings status
Table 13: Classified by Nationality and National Minimum Wage earnings status
Table 14: Classified by highest level of education attained and National Minimum Wage earnings status
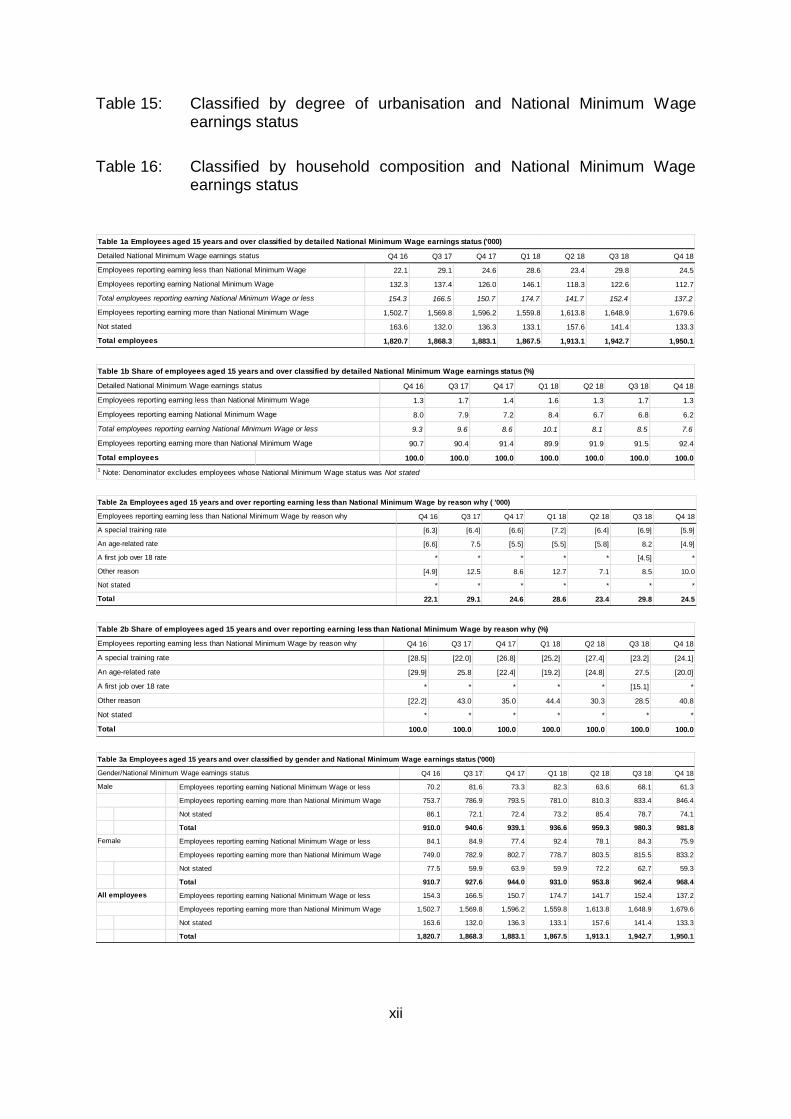
xii
Table 15: Classified by degree of urbanisation and National Minimum Wage earnings status
Table 16: Classified by household composition and National Minimum Wage earnings status
Q4 16 Q3 17 Q4 17 Q1 18 Q2 18 Q3 18 Q4 18
22.1 29.1 24.6 28.6 23.4 29.8 24.5
132.3 137.4 126.0 146.1 118.3 122.6 112.7
154.3 166.5 150.7 174.7 141.7 152.4 137.2
1,502.7 1,569.8 1,596.2 1,559.8 1,613.8 1,648.9 1,679.6
163.6 132.0 136.3 133.1 157.6 141.4 133.3
1,820.7 1,868.3 1,883.1 1,867.5 1,913.1 1,942.7 1,950.1
Employees reporting earning more than National Minimum Wage
Not stated
Total employees
Table 1a Employees aged 15 years and over classified by detailed National Minimum Wage earnings status ('000)
Detailed National Minimum Wage earnings status
Employees reporting earning less than National Minimum Wage
Employees reporting earning National Minimum Wage
Total employees reporting earning National Minimum Wage or less
Q4 16 Q3 17 Q4 17 Q1 18 Q2 18 Q3 18 Q4 18
1.3 1.7 1.4 1.6 1.3 1.7 1.3
8.0 7.9 7.2 8.4 6.7 6.8 6.2
9.3 9.6 8.6 10.1 8.1 8.5 7.6
90.7 90.4 91.4 89.9 91.9 91.5 92.4
100.0 100.0 100.0 100.0 100.0 100.0 100.0
Table 1b Share of employees aged 15 years and over classified by detailed National Minimum Wage earnings status (%)
1 Note: Denominator excludes employees whose National Minimum Wage status was Not stated
Employees reporting earning National Minimum Wage
Detailed National Minimum Wage earnings status
Employees reporting earning less than National Minimum Wage
Total employees reporting earning National Minimum Wage or less
Total employees
Employees reporting earning more than National Minimum Wage
Q4 16 Q3 17 Q4 17 Q1 18 Q2 18 Q3 18 Q4 18
[6.3] [6.4] [6.6] [7.2] [6.4] [6.9] [5.9]
[6.6] 7.5 [5.5] [5.5] [5.8] 8.2 [4.9]
* * * * * [4.5] *
[4.9] 12.5 8.6 12.7 7.1 8.5 10.0
* * * * * * *
22.1 29.1 24.6 28.6 23.4 29.8 24.5
Other reason
Not stated
Total
A special training rate
Table 2a Employees aged 15 years and over reporting earning less than National Minimum Wage by reason why ( '000)
Employees reporting earning less than National Minimum Wage by reason why
An age-related rate
A first job over 18 rate
Q4 16 Q3 17 Q4 17 Q1 18 Q2 18 Q3 18 Q4 18
[28.5] [22.0] [26.8] [25.2] [27.4] [23.2] [24.1]
[29.9] 25.8 [22.4] [19.2] [24.8] 27.5 [20.0]
* * * * * [15.1] *
[22.2] 43.0 35.0 44.4 30.3 28.5 40.8
* * * * * * *
100.0 100.0 100.0 100.0 100.0 100.0 100.0
A first job over 18 rate
Other reason
Not stated
Total
Table 2b Share of employees aged 15 years and over reporting earning less than National Minimum Wage by reason why (%)
Employees reporting earning less than National Minimum Wage by reason why
A special training rate
An age-related rate
Q4 16 Q3 17 Q4 17 Q1 18 Q2 18 Q3 18 Q4 18
Employees reporting earning National Minimum Wage or less 70.2 81.6 73.3 82.3 63.6 68.1 61.3
Employees reporting earning more than National Minimum Wage 753.7 786.9 793.5 781.0 810.3 833.4 846.4
Not stated 86.1 72.1 72.4 73.2 85.4 78.7 74.1
Total 910.0 940.6 939.1 936.6 959.3 980.3 981.8
Employees reporting earning National Minimum Wage or less 84.1 84.9 77.4 92.4 78.1 84.3 75.9
Employees reporting earning more than National Minimum Wage 749.0 782.9 802.7 778.7 803.5 815.5 833.2
Not stated 77.5 59.9 63.9 59.9 72.2 62.7 59.3
Total 910.7 927.6 944.0 931.0 953.8 962.4 968.4
Employees reporting earning National Minimum Wage or less 154.3 166.5 150.7 174.7 141.7 152.4 137.2
Employees reporting earning more than National Minimum Wage 1,502.7 1,569.8 1,596.2 1,559.8 1,613.8 1,648.9 1,679.6
Not stated 163.6 132.0 136.3 133.1 157.6 141.4 133.3
Total 1,820.7 1,868.3 1,883.1 1,867.5 1,913.1 1,942.7 1,950.1
All employees
Gender/National Minimum Wage earnings status
Table 3a Employees aged 15 years and over classified by gender and National Minimum Wage earnings status ('000)
Male
Female
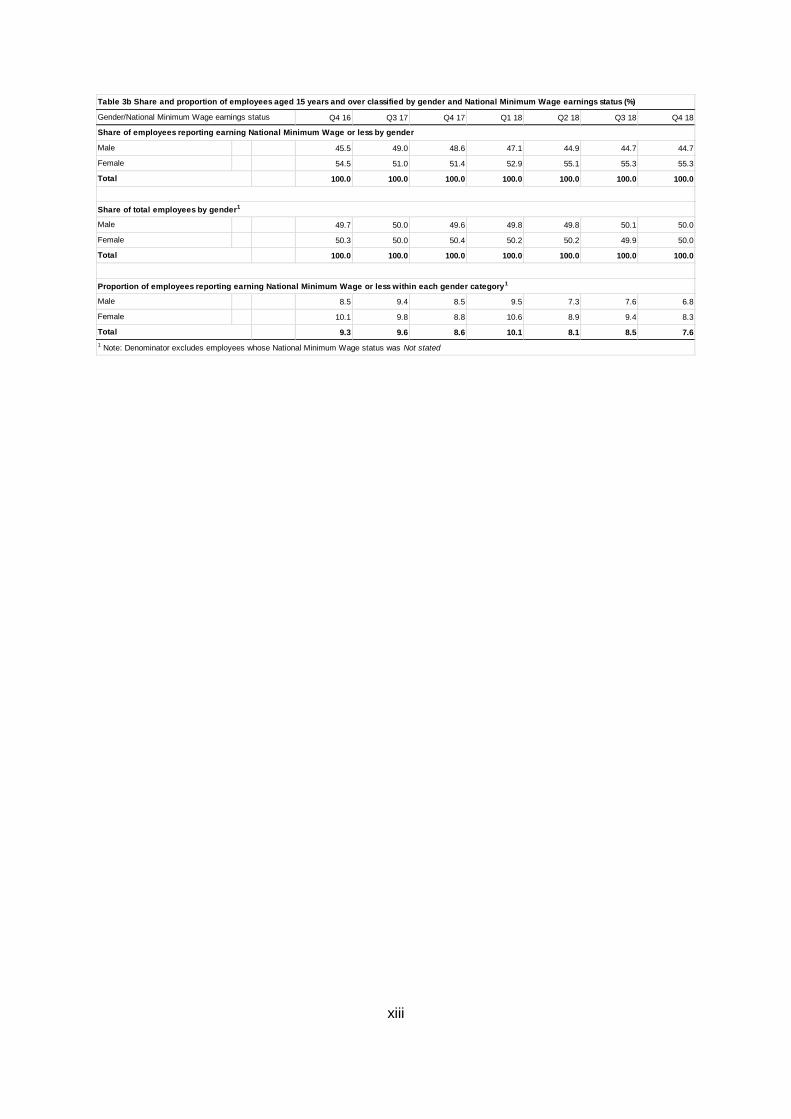
xiii
Q4 16 Q3 17 Q4 17 Q1 18 Q2 18 Q3 18 Q4 18
45.5 49.0 48.6 47.1 44.9 44.7 44.7
54.5 51.0 51.4 52.9 55.1 55.3 55.3
100.0 100.0 100.0 100.0 100.0 100.0 100.0
49.7 50.0 49.6 49.8 49.8 50.1 50.0
50.3 50.0 50.4 50.2 50.2 49.9 50.0
100.0 100.0 100.0 100.0 100.0 100.0 100.0
8.5 9.4 8.5 9.5 7.3 7.6 6.8
10.1 9.8 8.8 10.6 8.9 9.4 8.3
9.3 9.6 8.6 10.1 8.1 8.5 7.6
1 Note: Denominator excludes employees whose National Minimum Wage status was Not stated
Total
Proportion of employees reporting earning National Minimum Wage or less within each gender category1
Male
Female
Total
Male
Female
Share of total employees by gender1
Female
Gender/National Minimum Wage earnings status
Total
Table 3b Share and proportion of employees aged 15 years and over classified by gender and National Minimum Wage earnings status (%)
Male
Share of employees reporting earning National Minimum Wage or less by gender

xiv
Q4 16 Q3 17 Q4 17 Q1 18 Q2 18 Q3 18 Q4 18
A Employees reporting earning National Minimum Wage or less [3.9] [5.0] * [4.2] [4.5] [7.2] [5.7]
Employees reporting earning more than National Minimum Wage 17.6 19.4 18.3 16.9 20.0 17.6 18.5
Not stated [4.6] * * * * * *
Total 26.1 27.0 25.9 24.6 28.2 27.0 26.9
B-F Employees reporting earning National Minimum Wage or less 22.5 25.1 21.9 24.9 16.8 19.2 16.7
Employees reporting earning more than National Minimum Wage 288.4 304.3 303.4 301.1 303.6 321.9 316.7
Not stated 25.7 22.1 24.2 23.1 29.5 26.1 25.3
Total 336.6 351.5 349.5 349.1 349.9 367.2 358.7
B-E Employees reporting earning National Minimum Wage or less 16.9 17.5 14.8 17.5 10.7 13.3 14.0
Employees reporting earning more than National Minimum Wage 222.0 236.3 231.4 226.3 223.5 237.6 232.6
Not stated 15.7 14.9 16.3 15.6 19.6 16.6 15.4
Total 254.6 268.7 262.5 259.4 253.8 267.5 261.9
F Employees reporting earning National Minimum Wage or less 5.6 [7.6] [7.1] 7.4 [6.1] [5.9] *
Employees reporting earning more than National Minimum Wage 66.4 68.0 71.9 74.8 80.1 84.3 84.2
Not stated 10.0 [7.2] 7.9 7.5 9.9 9.5 9.9
Total 82.0 82.8 87.0 89.7 96.1 99.7 96.8
G-U Employees reporting earning National Minimum Wage or less 127.7 136.2 124.0 145.2 120.0 125.9 114.6
Employees reporting earning more than National Minimum Wage 1,193.3 1,242.6 1,270.1 1,237.3 1,283.8 1,305.5 1,340.5
Not stated 130.5 103.6 105.7 105.1 122.3 109.6 103.2
Total 1,451.5 1,482.3 1,499.8 1,487.7 1,526.1 1,541.0 1,558.4
G Employees reporting earning National Minimum Wage or less 42.7 46.4 40.8 46.7 37.2 38.4 38.7
Employees reporting earning more than National Minimum Wage 196.8 207.8 213.8 194.5 207.2 210.9 220.8
Not stated 30.6 17.7 19.7 20.7 23.3 19.7 18.2
Total 270.1 272.0 274.3 261.9 267.8 268.9 277.7
H Employees reporting earning National Minimum Wage or less * * * * [4.8] * *
Employees reporting earning more than National Minimum Wage 64.0 63.5 65.1 63.6 69.0 72.2 76.2
Not stated 7.5 * * [4.2] [5.4] * *
Total 74.5 71.6 73.7 72.0 79.1 80.9 83.9
I Employees reporting earning National Minimum Wage or less 38.7 43.0 43.1 48.6 42.0 44.4 38.1
Employees reporting earning more than National Minimum Wage 82.2 98.0 98.8 95.6 100.7 105.1 105.4
Not stated 19.3 11.4 16.2 15.3 16.7 15.8 14.3
Total 140.3 152.4 158.1 159.5 159.5 165.3 157.8
J Employees reporting earning National Minimum Wage or less * * * * * * *
Employees reporting earning more than National Minimum Wage 88.1 96.5 94.8 91.4 94.1 101.8 95.5
Not stated [6.7] * * [5.7] [6.3] [5.4] [5.4]
Total 97.8 103.2 101.7 99.5 101.8 109.2 102.8
K-L Employees reporting earning National Minimum Wage or less * * * * * * *
Employees reporting earning more than National Minimum Wage 94.8 95.6 91.7 91.6 93.8 88.6 92.2
Not stated [4.8] * [5.1] * [6] [4.5] [5.5]
Total 100.9 100.7 97.3 96.6 100.9 94.5 98.2
M Employees reporting earning National Minimum Wage or less * * * * * * *
Employees reporting earning more than National Minimum Wage 94.8 93.5 91.8 91.7 95.9 94.0 95.3
Not stated 6.9 [4.5] [5.3] [4.5] [6.7] [5.5] [4]
Total 104.3 100.7 99.6 99.2 105.5 102.5 102.1
N Employees reporting earning National Minimum Wage or less 10.2 9.5 [6.5] 9.4 [6.2] [5.8] [6.7]
Employees reporting earning more than National Minimum Wage 52.4 61.7 64.3 67.9 74.5 76.3 78.5
Not stated 9.8 9.5 8.1 9.0 10.3 9.1 10.0
Total 72.4 80.7 78.8 86.3 91.0 91.2 95.2
O Employees reporting earning National Minimum Wage or less * * * * * * *
Employees reporting earning more than National Minimum Wage 87.1 88.5 95.2 94.8 98.2 95.8 101.5
Not stated [4] [5.2] [4.6] [4.6] [5] [4.7] [4.5]
Total 92.1 94.8 100.6 102.1 104.4 103.1 107.0
P Employees reporting earning National Minimum Wage or less [3] * * * * * *
Employees reporting earning more than National Minimum Wage 137.6 141.8 148.6 148.2 147.3 154.6 162.3
Not stated 9.0 [6.6] 7.4 7.2 8.0 [6.6] 6.8
Total 149.7 151.8 158.0 158.2 158.9 163.8 170.4
Q Employees reporting earning National Minimum Wage or less 10.0 10.7 9.7 10.2 7.4 8.6 [7.1]
Employees reporting earning more than National Minimum Wage 229.5 236.9 240.6 231.6 239.9 235.8 247.2
Not stated 22.3 17.9 15.0 17.3 20.8 20.9 19.6
Total 261.8 265.5 265.2 259.1 268.1 265.3 273.8
R-U Employees reporting earning National Minimum Wage or less 12.3 13.6 11.8 14.1 12.3 12.9 12.4
Employees reporting earning more than National Minimum Wage 65.9 58.7 65.5 66.4 63.1 70.2 65.6
Not stated 9.6 16.8 15.2 12.6 13.6 13.1 11.4
Total 87.8 89.0 92.4 93.1 89.0 96.1 89.4
Employees reporting earning National Minimum Wage or less * * * * * * *
Employees reporting earning more than National Minimum Wage * * * * [6.4] * *
Not stated * * * * * * *
Total 6.5 [7.4] 7.9 [6.1] 8.9 [7.5] [6.1]
Employees reporting earning National Minimum Wage or less 154.3 166.5 150.7 174.7 141.7 152.4 137.2
Employees reporting earning more than National Minimum Wage 1,502.7 1,569.8 1,596.2 1,559.8 1,613.8 1,648.9 1,679.6
Not stated 163.6 132.0 136.3 133.1 157.6 141.4 133.3
Total 1,820.7 1,868.3 1,883.1 1,867.5 1,913.1 1,942.7 1,950.1
Not stated
All employees
Education
Human health and social work activities
Other NACE activities
Administrative and support service activities
Public administration and defence; compulsory social security
Information and communication
Financial, insurance and real estate activities
Professional, scientific and technical activities
Transportation and storage
Accommodation and food service activities
Construction
Total Services
Wholesale and retail trade; repair of motor vehicles and motorcycles
Total Industry
Industry
Table 4a Employees aged 15 years and over classified by NACE Rev.2 Economic Sector and National Minimum Wage earnings status ('000)
Economic sector (NACE Rev.2)/National Minimum Wage status
Agriculture, forestry and fishing
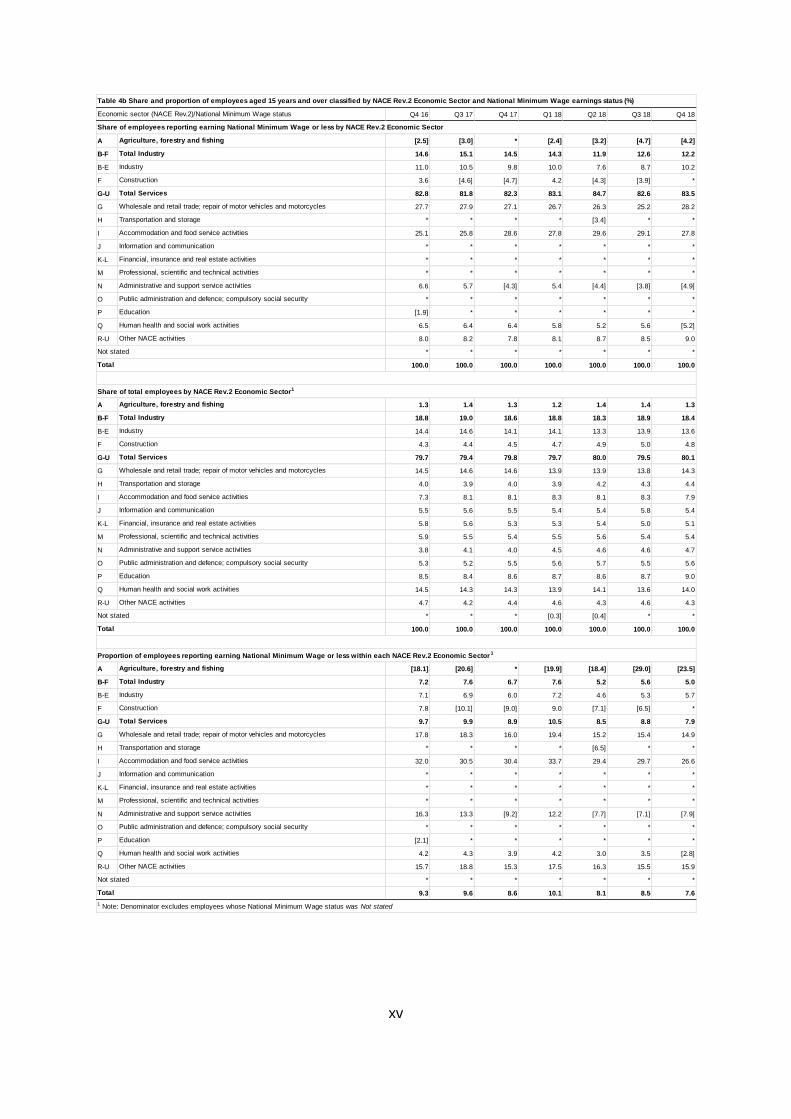
xv
Q4 16 Q3 17 Q4 17 Q1 18 Q2 18 Q3 18 Q4 18
A [2.5] [3.0] * [2.4] [3.2] [4.7] [4.2]
B-F 14.6 15.1 14.5 14.3 11.9 12.6 12.2
B-E 11.0 10.5 9.8 10.0 7.6 8.7 10.2
F 3.6 [4.6] [4.7] 4.2 [4.3] [3.9] *
G-U 82.8 81.8 82.3 83.1 84.7 82.6 83.5
G 27.7 27.9 27.1 26.7 26.3 25.2 28.2
H * * * * [3.4] * *
I 25.1 25.8 28.6 27.8 29.6 29.1 27.8
J * * * * * * *
K-L * * * * * * *
M * * * * * * *
N 6.6 5.7 [4.3] 5.4 [4.4] [3.8] [4.9]
O * * * * * * *
P [1.9] * * * * * *
Q 6.5 6.4 6.4 5.8 5.2 5.6 [5.2]
R-U 8.0 8.2 7.8 8.1 8.7 8.5 9.0
* * * * * * *
100.0 100.0 100.0 100.0 100.0 100.0 100.0
A 1.3 1.4 1.3 1.2 1.4 1.4 1.3
B-F 18.8 19.0 18.6 18.8 18.3 18.9 18.4
B-E 14.4 14.6 14.1 14.1 13.3 13.9 13.6
F 4.3 4.4 4.5 4.7 4.9 5.0 4.8
G-U 79.7 79.4 79.8 79.7 80.0 79.5 80.1
G 14.5 14.6 14.6 13.9 13.9 13.8 14.3
H 4.0 3.9 4.0 3.9 4.2 4.3 4.4
I 7.3 8.1 8.1 8.3 8.1 8.3 7.9
J 5.5 5.6 5.5 5.4 5.4 5.8 5.4
K-L 5.8 5.6 5.3 5.3 5.4 5.0 5.1
M 5.9 5.5 5.4 5.5 5.6 5.4 5.4
N 3.8 4.1 4.0 4.5 4.6 4.6 4.7
O 5.3 5.2 5.5 5.6 5.7 5.5 5.6
P 8.5 8.4 8.6 8.7 8.6 8.7 9.0
Q 14.5 14.3 14.3 13.9 14.1 13.6 14.0
R-U 4.7 4.2 4.4 4.6 4.3 4.6 4.3
* * * [0.3] [0.4] * *
100.0 100.0 100.0 100.0 100.0 100.0 100.0
A [18.1] [20.6] * [19.9] [18.4] [29.0] [23.5]
B-F 7.2 7.6 6.7 7.6 5.2 5.6 5.0
B-E 7.1 6.9 6.0 7.2 4.6 5.3 5.7
F 7.8 [10.1] [9.0] 9.0 [7.1] [6.5] *
G-U 9.7 9.9 8.9 10.5 8.5 8.8 7.9
G 17.8 18.3 16.0 19.4 15.2 15.4 14.9
H * * * * [6.5] * *
I 32.0 30.5 30.4 33.7 29.4 29.7 26.6
J * * * * * * *
K-L * * * * * * *
M * * * * * * *
N 16.3 13.3 [9.2] 12.2 [7.7] [7.1] [7.9]
O * * * * * * *
P [2.1] * * * * * *
Q 4.2 4.3 3.9 4.2 3.0 3.5 [2.8]
R-U 15.7 18.8 15.3 17.5 16.3 15.5 15.9
* * * * * * *
9.3 9.6 8.6 10.1 8.1 8.5 7.6
1 Note: Denominator excludes employees whose National Minimum Wage status was Not stated
Public administration and defence; compulsory social security
Education
Human health and social work activities
Other NACE activities
Not stated
Total
Administrative and support service activities
Agriculture, forestry and fishing
Total Industry
Industry
Construction
Total Services
Wholesale and retail trade; repair of motor vehicles and motorcycles
Transportation and storage
Accommodation and food service activities
Information and communication
Financial, insurance and real estate activities
Professional, scientific and technical activities
Proportion of employees reporting earning National Minimum Wage or less within each NACE Rev.2 Economic Sector 1
Information and communication
Financial, insurance and real estate activities
Professional, scientific and technical activities
Administrative and support service activities
Public administration and defence; compulsory social security
Education
Human health and social work activities
Other NACE activities
Not stated
Total
Accommodation and food service activities
Not stated
Total
Share of total employees by NACE Rev.2 Economic Sector1
Agriculture, forestry and fishing
Total Industry
Industry
Construction
Total Services
Wholesale and retail trade; repair of motor vehicles and motorcycles
Transportation and storage
Industry
Construction
Other NACE activities
Total Services
Wholesale and retail trade; repair of motor vehicles and motorcycles
Transportation and storage
Accommodation and food service activities
Information and communication
Financial, insurance and real estate activities
Professional, scientific and technical activities
Administrative and support service activities
Public administration and defence; compulsory social security
Education
Human health and social work activities
Table 4b Share and proportion of employees aged 15 years and over classified by NACE Rev.2 Economic Sector and National Minimum Wage earnings status (%)
Economic sector (NACE Rev.2)/National Minimum Wage status
Share of employees reporting earning National Minimum Wage or less by NACE Rev.2 Economic Sector
Agriculture, forestry and fishing
Total Industry
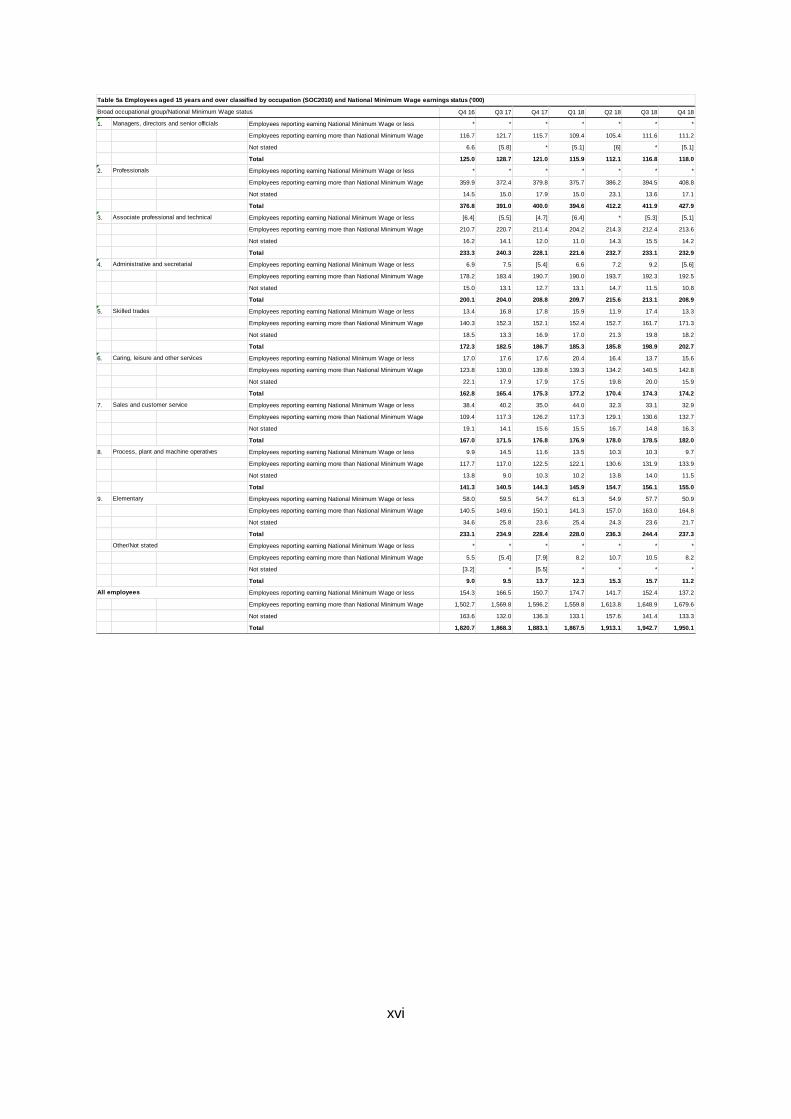
xvi
Q4 16 Q3 17 Q4 17 Q1 18 Q2 18 Q3 18 Q4 18
1. Employees reporting earning National Minimum Wage or less * * * * * * *
Employees reporting earning more than National Minimum Wage 116.7 121.7 115.7 109.4 105.4 111.6 111.2
Not stated 6.6 [5.8] * [5.1] [6] * [5.1]
Total 125.0 128.7 121.0 115.9 112.1 116.8 118.0
2. Employees reporting earning National Minimum Wage or less * * * * * * *
Employees reporting earning more than National Minimum Wage 359.9 372.4 379.8 375.7 386.2 394.5 408.8
Not stated 14.5 15.0 17.9 15.0 23.1 13.6 17.1
Total 376.8 391.0 400.0 394.6 412.2 411.9 427.9
3. Employees reporting earning National Minimum Wage or less [6.4] [5.5] [4.7] [6.4] * [5.3] [5.1]
Employees reporting earning more than National Minimum Wage 210.7 220.7 211.4 204.2 214.3 212.4 213.6
Not stated 16.2 14.1 12.0 11.0 14.3 15.5 14.2
Total 233.3 240.3 228.1 221.6 232.7 233.1 232.9
4. Employees reporting earning National Minimum Wage or less 6.9 7.5 [5.4] 6.6 7.2 9.2 [5.6]
Employees reporting earning more than National Minimum Wage 178.2 183.4 190.7 190.0 193.7 192.3 192.5
Not stated 15.0 13.1 12.7 13.1 14.7 11.5 10.8
Total 200.1 204.0 208.8 209.7 215.6 213.1 208.9
5. Employees reporting earning National Minimum Wage or less 13.4 16.8 17.8 15.9 11.9 17.4 13.3
Employees reporting earning more than National Minimum Wage 140.3 152.3 152.1 152.4 152.7 161.7 171.3
Not stated 18.5 13.3 16.9 17.0 21.3 19.8 18.2
Total 172.3 182.5 186.7 185.3 185.8 198.9 202.7
6. Employees reporting earning National Minimum Wage or less 17.0 17.6 17.6 20.4 16.4 13.7 15.6
Employees reporting earning more than National Minimum Wage 123.8 130.0 139.8 139.3 134.2 140.5 142.8
Not stated 22.1 17.9 17.9 17.5 19.8 20.0 15.9
Total 162.8 165.4 175.3 177.2 170.4 174.3 174.2
7. Employees reporting earning National Minimum Wage or less 38.4 40.2 35.0 44.0 32.3 33.1 32.9
Employees reporting earning more than National Minimum Wage 109.4 117.3 126.2 117.3 129.1 130.6 132.7
Not stated 19.1 14.1 15.6 15.5 16.7 14.8 16.3
Total 167.0 171.5 176.8 176.9 178.0 178.5 182.0
8. Employees reporting earning National Minimum Wage or less 9.9 14.5 11.6 13.5 10.3 10.3 9.7
Employees reporting earning more than National Minimum Wage 117.7 117.0 122.5 122.1 130.6 131.9 133.9
Not stated 13.8 9.0 10.3 10.2 13.8 14.0 11.5
Total 141.3 140.5 144.3 145.9 154.7 156.1 155.0
9. Employees reporting earning National Minimum Wage or less 58.0 59.5 54.7 61.3 54.9 57.7 50.9
Employees reporting earning more than National Minimum Wage 140.5 149.6 150.1 141.3 157.0 163.0 164.8
Not stated 34.6 25.8 23.6 25.4 24.3 23.6 21.7
Total 233.1 234.9 228.4 228.0 236.3 244.4 237.3
Employees reporting earning National Minimum Wage or less * * * * * * *
Employees reporting earning more than National Minimum Wage 5.5 [5.4] [7.9] 8.2 10.7 10.5 8.2
Not stated [3.2] * [5.5] * * * *
Total 9.0 9.5 13.7 12.3 15.3 15.7 11.2
Employees reporting earning National Minimum Wage or less 154.3 166.5 150.7 174.7 141.7 152.4 137.2
Employees reporting earning more than National Minimum Wage 1,502.7 1,569.8 1,596.2 1,559.8 1,613.8 1,648.9 1,679.6
Not stated 163.6 132.0 136.3 133.1 157.6 141.4 133.3
Total 1,820.7 1,868.3 1,883.1 1,867.5 1,913.1 1,942.7 1,950.1
Table 5a Employees aged 15 years and over classified by occupation (SOC2010) and National Minimum Wage earnings status ('000)
Broad occupational group/National Minimum Wage status
Managers, directors and senior officials
Professionals
All employees
Process, plant and machine operatives
Elementary
Other/Not stated
Associate professional and technical
Administrative and secretarial
Skilled trades
Caring, leisure and other services
Sales and customer service
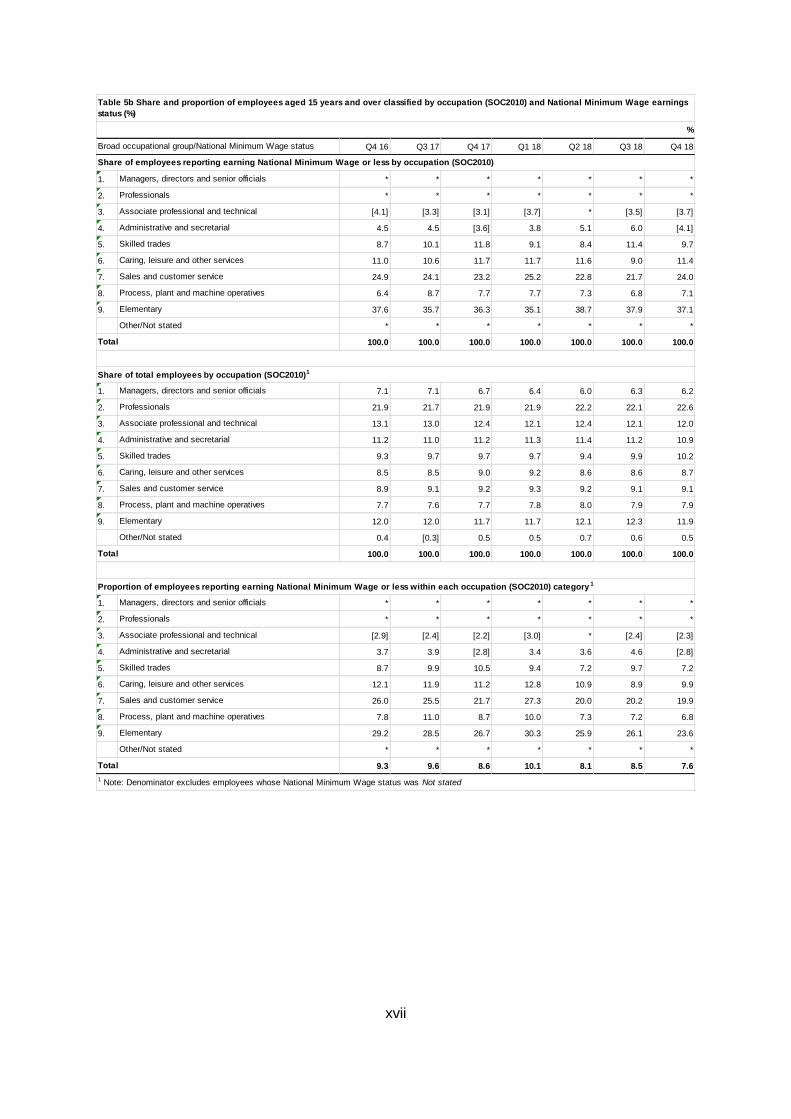
xvii
Q4 16 Q3 17 Q4 17 Q1 18 Q2 18 Q3 18 Q4 18
1. * * * * * * *
2. * * * * * * *
3. [4.1] [3.3] [3.1] [3.7] * [3.5] [3.7]
4. 4.5 4.5 [3.6] 3.8 5.1 6.0 [4.1]
5. 8.7 10.1 11.8 9.1 8.4 11.4 9.7
6. 11.0 10.6 11.7 11.7 11.6 9.0 11.4
7. 24.9 24.1 23.2 25.2 22.8 21.7 24.0
8. 6.4 8.7 7.7 7.7 7.3 6.8 7.1
9. 37.6 35.7 36.3 35.1 38.7 37.9 37.1
* * * * * * *
100.0 100.0 100.0 100.0 100.0 100.0 100.0
1. 7.1 7.1 6.7 6.4 6.0 6.3 6.2
2. 21.9 21.7 21.9 21.9 22.2 22.1 22.6
3. 13.1 13.0 12.4 12.1 12.4 12.1 12.0
4. 11.2 11.0 11.2 11.3 11.4 11.2 10.9
5. 9.3 9.7 9.7 9.7 9.4 9.9 10.2
6. 8.5 8.5 9.0 9.2 8.6 8.6 8.7
7. 8.9 9.1 9.2 9.3 9.2 9.1 9.1
8. 7.7 7.6 7.7 7.8 8.0 7.9 7.9
9. 12.0 12.0 11.7 11.7 12.1 12.3 11.9
0.4 [0.3] 0.5 0.5 0.7 0.6 0.5
100.0 100.0 100.0 100.0 100.0 100.0 100.0
1. * * * * * * *
2. * * * * * * *
3. [2.9] [2.4] [2.2] [3.0] * [2.4] [2.3]
4. 3.7 3.9 [2.8] 3.4 3.6 4.6 [2.8]
5. 8.7 9.9 10.5 9.4 7.2 9.7 7.2
6. 12.1 11.9 11.2 12.8 10.9 8.9 9.9
7. 26.0 25.5 21.7 27.3 20.0 20.2 19.9
8. 7.8 11.0 8.7 10.0 7.3 7.2 6.8
9. 29.2 28.5 26.7 30.3 25.9 26.1 23.6
* * * * * * *
9.3 9.6 8.6 10.1 8.1 8.5 7.6
Share of employees reporting earning National Minimum Wage or less by occupation (SOC2010)
Table 5b Share and proportion of employees aged 15 years and over classified by occupation (SOC2010) and National Minimum Wage earnings
status (%)
Share of total employees by occupation (SOC2010)1
Broad occupational group/National Minimum Wage status
Elementary
Managers, directors and senior officials
Professionals
Associate professional and technical
Administrative and secretarial
Skilled trades
Caring, leisure and other services
Sales and customer service
Process, plant and machine operatives
%
Elementary
Other/Not stated
Total
Managers, directors and senior officials
Professionals
Associate professional and technical
Administrative and secretarial
Skilled trades
Caring, leisure and other services
Sales and customer service
Process, plant and machine operatives
Other/Not stated
Total
1 Note: Denominator excludes employees whose National Minimum Wage status was Not stated
Elementary
Other/Not stated
Total
Managers, directors and senior officials
Professionals
Associate professional and technical
Proportion of employees reporting earning National Minimum Wage or less within each occupation (SOC2010) category 1
Administrative and secretarial
Skilled trades
Caring, leisure and other services
Sales and customer service
Process, plant and machine operatives

xviii
Q4 16 Q3 17 Q4 17 Q1 18 Q2 18 Q3 18 Q4 18
Employees reporting earning National Minimum Wage or less 34.6 33.1 30.2 29.2 28.4 34.5 30.5
Employees reporting earning more than National Minimum Wage 15.8 18.2 19.2 13.9 20.8 22.3 19.7
Not stated 8.7 [5.9] [6.7] [5.2] 8.4 7.8 7.7
Total 59.0 57.2 56.1 48.3 57.7 64.6 57.8
Employees reporting earning National Minimum Wage or less 39.3 41.1 40.8 46.1 41.4 46.9 38.2
Employees reporting earning more than National Minimum Wage 113.2 110.6 112.6 99.4 112.2 123.4 125.8
Not stated 25.0 16.7 18.8 19.7 24.7 22.2 20.7
Total 177.5 168.4 172.2 165.1 178.3 192.6 184.7
Employees reporting earning National Minimum Wage or less 73.9 74.2 71.0 75.3 69.9 81.5 68.6
Employees reporting earning more than National Minimum Wage 128.9 128.8 131.7 113.3 133.0 145.7 145.5
Not stated 33.6 22.6 25.5 24.9 33.1 30.0 28.4
Total 236.5 225.6 228.3 213.5 236.0 257.2 242.5
Employees reporting earning National Minimum Wage or less 33.4 38.0 32.1 45.3 31.7 31.0 28.3
Employees reporting earning more than National Minimum Wage 390.4 394.4 405.4 387.1 400.7 402.6 409.9
Not stated 46.9 35.6 39.1 36.1 39.3 37.0 33.8
Total 470.7 467.9 476.6 468.5 471.7 470.5 472.0
Employees reporting earning National Minimum Wage or less 21.2 24.2 23.1 23.4 16.0 18.8 18.7
Employees reporting earning more than National Minimum Wage 451.8 483.7 480.5 485.3 493.7 492.8 500.9
Not stated 33.8 27.3 29.5 29.3 32.7 30.5 29.4
Total 506.8 535.2 533.2 538.1 542.4 542.1 549.1
Employees reporting earning National Minimum Wage or less 15.1 17.2 12.6 15.6 11.4 11.8 10.9
Employees reporting earning more than National Minimum Wage 323.5 347.8 352.5 349.4 356.1 365.3 373.8
Not stated 29.3 24.9 22.4 22.0 29.5 24.6 25.0
Total 367.8 389.9 387.4 386.9 397.0 401.6 409.7
Employees reporting earning National Minimum Wage or less [5.1] [6.3] [6.0] 8.2 [6.5] [3.8] [5.5]
Employees reporting earning more than National Minimum Wage 119.5 122.6 127.6 126.5 127.8 139.0 139.5
Not stated 8.7 9.1 9.7 8.6 11.1 10.0 8.6
Total 133.3 137.9 143.3 143.3 145.5 152.7 153.6
Employees reporting earning National Minimum Wage or less [3.6] [4.4] [4.1] [4.1] [4.1] [3.5] *
Employees reporting earning more than National Minimum Wage 69.0 74.1 74.9 75.1 78.9 80.0 84.6
Not stated 8.0 9.0 7.0 8.7 8.3 6.3 6.1
Total 80.6 87.5 86.0 87.9 91.3 89.7 93.6
Employees reporting earning National Minimum Wage or less * * * * * * *
Employees reporting earning more than National Minimum Wage 19.6 18.6 23.4 23.2 23.5 23.6 25.3
Not stated [3.2] [3.4] * [3.5] [3.5] * *
Total 24.9 24.2 28.2 29.5 29.3 28.8 29.6
Employees reporting earning National Minimum Wage or less 154.3 166.5 150.7 174.7 141.7 152.4 137.2
Employees reporting earning more than National Minimum Wage 1,502.7 1,569.8 1,596.2 1,559.8 1,613.8 1,648.9 1,679.6
Not stated 163.6 132.0 136.3 133.1 157.6 141.4 133.3
Total 1,820.7 1,868.3 1,883.1 1,867.5 1,913.1 1,942.7 1,950.1
All employees
25-34
35-44
45-54
55-59
60-64
65+
Age group/National Minimum Wage status
Table 6a Employees aged 15 years and over classified by age group and National Minimum Wage earnings status ('000)
15-19
20-24
15-24 (Youths)
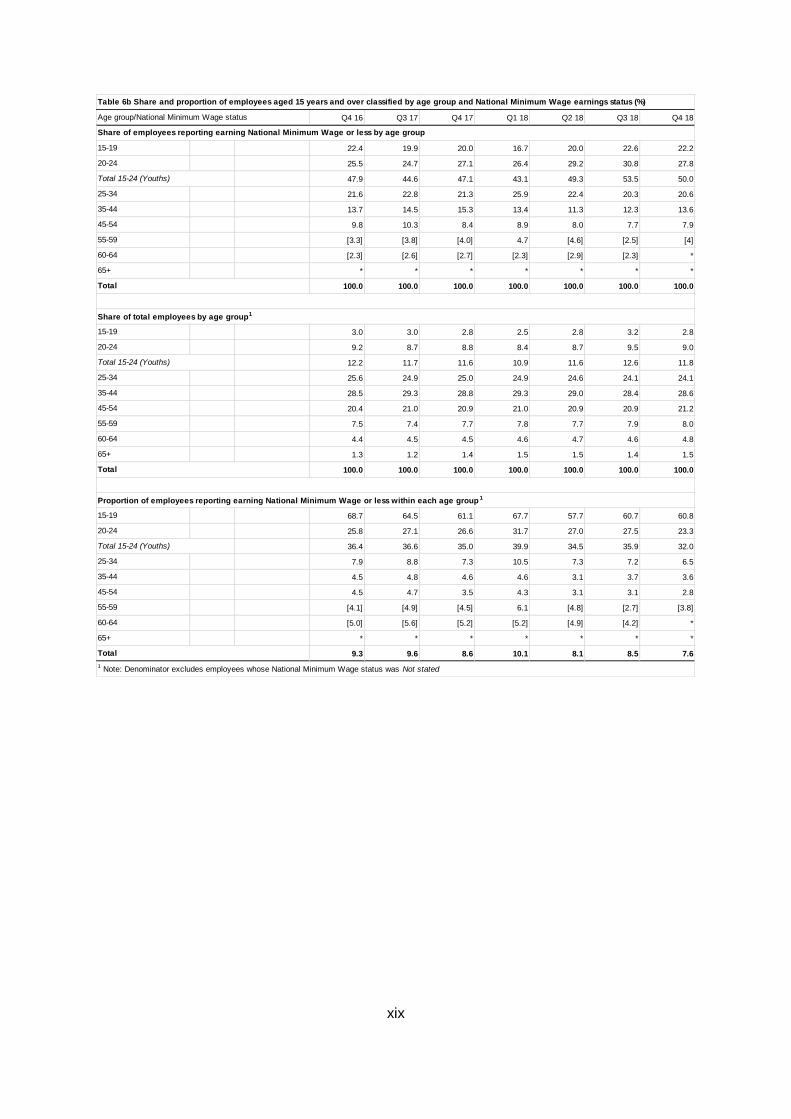
xix
Q4 16 Q3 17 Q4 17 Q1 18 Q2 18 Q3 18 Q4 18
22.4 19.9 20.0 16.7 20.0 22.6 22.2
25.5 24.7 27.1 26.4 29.2 30.8 27.8
47.9 44.6 47.1 43.1 49.3 53.5 50.0
21.6 22.8 21.3 25.9 22.4 20.3 20.6
13.7 14.5 15.3 13.4 11.3 12.3 13.6
9.8 10.3 8.4 8.9 8.0 7.7 7.9
[3.3] [3.8] [4.0] 4.7 [4.6] [2.5] [4]
[2.3] [2.6] [2.7] [2.3] [2.9] [2.3] *
* * * * * * *
100.0 100.0 100.0 100.0 100.0 100.0 100.0
3.0 3.0 2.8 2.5 2.8 3.2 2.8
9.2 8.7 8.8 8.4 8.7 9.5 9.0
12.2 11.7 11.6 10.9 11.6 12.6 11.8
25.6 24.9 25.0 24.9 24.6 24.1 24.1
28.5 29.3 28.8 29.3 29.0 28.4 28.6
20.4 21.0 20.9 21.0 20.9 20.9 21.2
7.5 7.4 7.7 7.8 7.7 7.9 8.0
4.4 4.5 4.5 4.6 4.7 4.6 4.8
1.3 1.2 1.4 1.5 1.5 1.4 1.5
100.0 100.0 100.0 100.0 100.0 100.0 100.0
68.7 64.5 61.1 67.7 57.7 60.7 60.8
25.8 27.1 26.6 31.7 27.0 27.5 23.3
36.4 36.6 35.0 39.9 34.5 35.9 32.0
7.9 8.8 7.3 10.5 7.3 7.2 6.5
4.5 4.8 4.6 4.6 3.1 3.7 3.6
4.5 4.7 3.5 4.3 3.1 3.1 2.8
[4.1] [4.9] [4.5] 6.1 [4.8] [2.7] [3.8]
[5.0] [5.6] [5.2] [5.2] [4.9] [4.2] *
* * * * * * *
9.3 9.6 8.6 10.1 8.1 8.5 7.6
Table 6b Share and proportion of employees aged 15 years and over classified by age group and National Minimum Wage earnings status (%)
35-44
45-54
20-24
Total 15-24 (Youths)
25-34
Share of total employees by age group1
25-34
35-44
45-54
55-59
60-64
15-19
Share of employees reporting earning National Minimum Wage or less by age group
Total
1 Note: Denominator excludes employees whose National Minimum Wage status was Not stated
20-24
Total 15-24 (Youths)
25-34
35-44
45-54
55-59
60-64
65+
Total
Total
Proportion of employees reporting earning National Minimum Wage or less within each age group 1
65+
15-19
55-59
60-64
65+
15-19
Age group/National Minimum Wage status
20-24
Total 15-24 (Youths)

xx
Q4 16 Q3 17 Q4 17 Q1 18 Q2 18 Q3 18 Q4 18
Employees reporting earning National Minimum Wage or less 35.1 37.0 28.2 39.7 28.3 29.2 26.5
Employees reporting earning more than National Minimum Wage 245.3 251.0 255.5 251.3 250.6 257.7 267.8
Not stated 22.1 23.5 25.7 23.0 24.1 25.7 21.6
Total 302.6 311.5 309.4 314.1 302.9 312.6 316.0
Border Employees reporting earning National Minimum Wage or less 20.6 17.0 15.6 17.8 15.4 16.1 13.0
Employees reporting earning more than National Minimum Wage 110.8 115.0 116.5 115.3 113.1 112.9 117.7
Not stated 11.9 14.1 12.9 10.6 10.7 11.0 10.4
Total 143.3 146.1 145.0 143.6 139.2 140.0 141.1
Employees reporting earning National Minimum Wage or less 14.5 20.0 12.6 21.9 12.9 13.1 13.6
Employees reporting earning more than National Minimum Wage 134.6 136.0 139.0 136.1 137.4 144.8 150.1
Not stated 10.2 9.4 12.8 12.5 13.4 14.7 11.3
Total 159.3 165.4 164.5 170.4 163.7 172.6 175.0
Employees reporting earning National Minimum Wage or less 53.9 64.1 55.7 62.0 53.1 56.9 47.3
Employees reporting earning more than National Minimum Wage 461.1 481.7 485.7 469.7 490.5 499.7 499.3
Not stated 69.3 48.4 51.3 48.6 64.9 58.5 59.6
Total 584.3 594.2 592.7 580.3 608.5 615.1 606.1
Mid-West Employees reporting earning National Minimum Wage or less 16.5 20.1 18.2 19.2 13.5 15.5 10.7
Employees reporting earning more than National Minimum Wage 144.0 137.8 137.3 133.5 136.6 144.8 143.6
Not stated 17.4 17.2 23.1 19.3 27.4 19.7 21.0
Total 177.9 175.1 178.6 172.0 177.5 180.0 175.2
Employees reporting earning National Minimum Wage or less 16.1 15.5 15.5 17.3 16.8 15.1 17.5
Employees reporting earning more than National Minimum Wage 124.7 128.1 130.9 121.0 122.8 119.0 118.0
Not stated 9.3 11.3 7.5 10.6 16.8 18.9 21.4
Total 150.1 155.0 153.8 148.9 156.3 153.0 157.0
Employees reporting earning National Minimum Wage or less 21.3 28.4 22.0 25.5 22.8 26.3 19.1
Employees reporting earning more than National Minimum Wage 192.4 215.8 217.6 215.2 231.1 235.9 237.7
Not stated 42.7 19.9 20.7 18.7 20.8 19.9 17.2
Total 256.3 264.2 260.3 259.4 274.7 282.1 273.9
Employees reporting earning National Minimum Wage or less 65.3 65.4 66.7 73.0 60.3 66.3 63.4
Employees reporting earning more than National Minimum Wage 796.2 837.1 854.9 838.7 872.8 891.5 912.5
Not stated 72.2 60.1 59.3 61.4 68.6 57.2 52.1
Total 933.8 962.6 980.9 973.1 1,001.7 1,015.0 1,028.0
Employees reporting earning National Minimum Wage or less 41.8 35.7 33.2 40.0 30.8 34.7 33.1
Employees reporting earning more than National Minimum Wage 495.9 519.1 531.2 522.6 547.3 553.8 569.1
Not stated 43.4 32.9 36.2 38.4 44.2 36.8 28.8
Total 581.2 587.7 600.7 601.1 622.3 625.3 631.1
Employees reporting earning National Minimum Wage or less 17.9 18.5 21.8 22.4 20.6 20.9 18.3
Employees reporting earning more than National Minimum Wage 219.8 235.3 236.7 228.5 238.8 246.2 253.1
Not stated 20.5 20.2 17.0 17.1 19.7 16.1 20.4
Total 258.2 274.0 275.5 268.0 279.1 283.2 291.8
Midland Employees reporting earning National Minimum Wage or less [5.6] 11.2 11.7 10.6 8.9 10.7 11.9
Employees reporting earning more than National Minimum Wage 80.6 82.8 87.0 87.5 86.7 91.6 90.2
Not stated 8.2 [7.0] [6.0] [5.8] [4.6] * *
Total 94.4 100.9 104.7 104.0 100.2 106.5 105.0
Employees reporting earning National Minimum Wage or less 154.3 166.5 150.7 174.7 141.7 152.4 137.2
Employees reporting earning more than National Minimum Wage 1,502.7 1,569.8 1,596.2 1,559.8 1,613.8 1,648.9 1,679.6
Not stated 163.6 132.0 136.3 133.1 157.6 141.4 133.3
Total 1,820.7 1,868.3 1,883.1 1,867.5 1,913.1 1,942.7 1,950.1
Region/National Minimum Wage status
Table 7a Employees aged 15 years and over classified by NUTS2 and NUTS3 regions and National Minimum Wage earnings status ('000)
Northern and Western
All employees
Dublin
Mid-East
Midland
Southern
Eastern and Midland
South-East
South-East
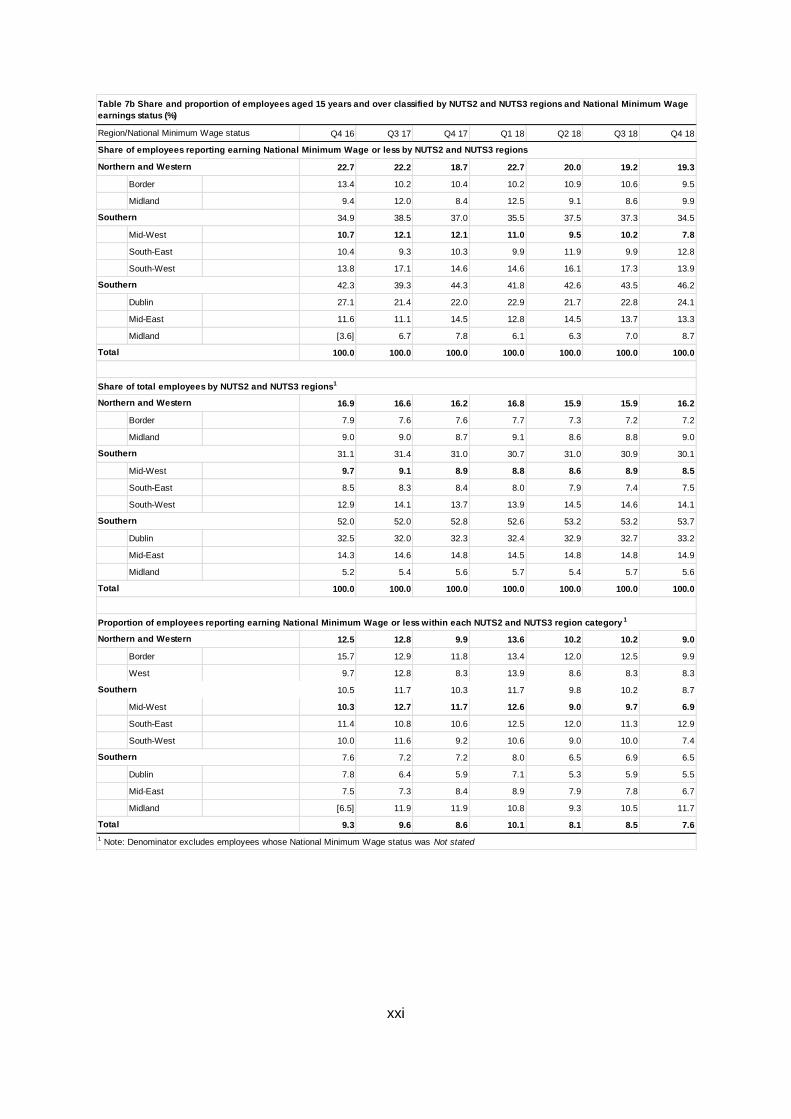
xxi
Q4 16 Q3 17 Q4 17 Q1 18 Q2 18 Q3 18 Q4 18
22.7 22.2 18.7 22.7 20.0 19.2 19.3
Border 13.4 10.2 10.4 10.2 10.9 10.6 9.5
Midland 9.4 12.0 8.4 12.5 9.1 8.6 9.9
34.9 38.5 37.0 35.5 37.5 37.3 34.5
Mid-West 10.7 12.1 12.1 11.0 9.5 10.2 7.8
South-East 10.4 9.3 10.3 9.9 11.9 9.9 12.8
South-West 13.8 17.1 14.6 14.6 16.1 17.3 13.9
42.3 39.3 44.3 41.8 42.6 43.5 46.2
Dublin 27.1 21.4 22.0 22.9 21.7 22.8 24.1
Mid-East 11.6 11.1 14.5 12.8 14.5 13.7 13.3
Midland [3.6] 6.7 7.8 6.1 6.3 7.0 8.7
100.0 100.0 100.0 100.0 100.0 100.0 100.0
16.9 16.6 16.2 16.8 15.9 15.9 16.2
Border 7.9 7.6 7.6 7.7 7.3 7.2 7.2
Midland 9.0 9.0 8.7 9.1 8.6 8.8 9.0
31.1 31.4 31.0 30.7 31.0 30.9 30.1
Mid-West 9.7 9.1 8.9 8.8 8.6 8.9 8.5
South-East 8.5 8.3 8.4 8.0 7.9 7.4 7.5
South-West 12.9 14.1 13.7 13.9 14.5 14.6 14.1
52.0 52.0 52.8 52.6 53.2 53.2 53.7
Dublin 32.5 32.0 32.3 32.4 32.9 32.7 33.2
Mid-East 14.3 14.6 14.8 14.5 14.8 14.8 14.9
Midland 5.2 5.4 5.6 5.7 5.4 5.7 5.6
100.0 100.0 100.0 100.0 100.0 100.0 100.0
12.5 12.8 9.9 13.6 10.2 10.2 9.0
Border 15.7 12.9 11.8 13.4 12.0 12.5 9.9
West 9.7 12.8 8.3 13.9 8.6 8.3 8.3
10.5 11.7 10.3 11.7 9.8 10.2 8.7
Mid-West 10.3 12.7 11.7 12.6 9.0 9.7 6.9
South-East 11.4 10.8 10.6 12.5 12.0 11.3 12.9
South-West 10.0 11.6 9.2 10.6 9.0 10.0 7.4
7.6 7.2 7.2 8.0 6.5 6.9 6.5
Dublin 7.8 6.4 5.9 7.1 5.3 5.9 5.5
Mid-East 7.5 7.3 8.4 8.9 7.9 7.8 6.7
Midland [6.5] 11.9 11.9 10.8 9.3 10.5 11.7
9.3 9.6 8.6 10.1 8.1 8.5 7.6
Region/National Minimum Wage status
Table 7b Share and proportion of employees aged 15 years and over classified by NUTS2 and NUTS3 regions and National Minimum Wage
earnings status (%)
Total
Share of total employees by NUTS2 and NUTS3 regions1
Share of employees reporting earning National Minimum Wage or less by NUTS2 and NUTS3 regions
Northern and Western
Southern
Southern
Northern and Western
Northern and Western
1 Note: Denominator excludes employees whose National Minimum Wage status was Not stated
Total
Total
Proportion of employees reporting earning National Minimum Wage or less within each NUTS2 and NUTS3 region category 1
Southern
Southern
Southern
Southern
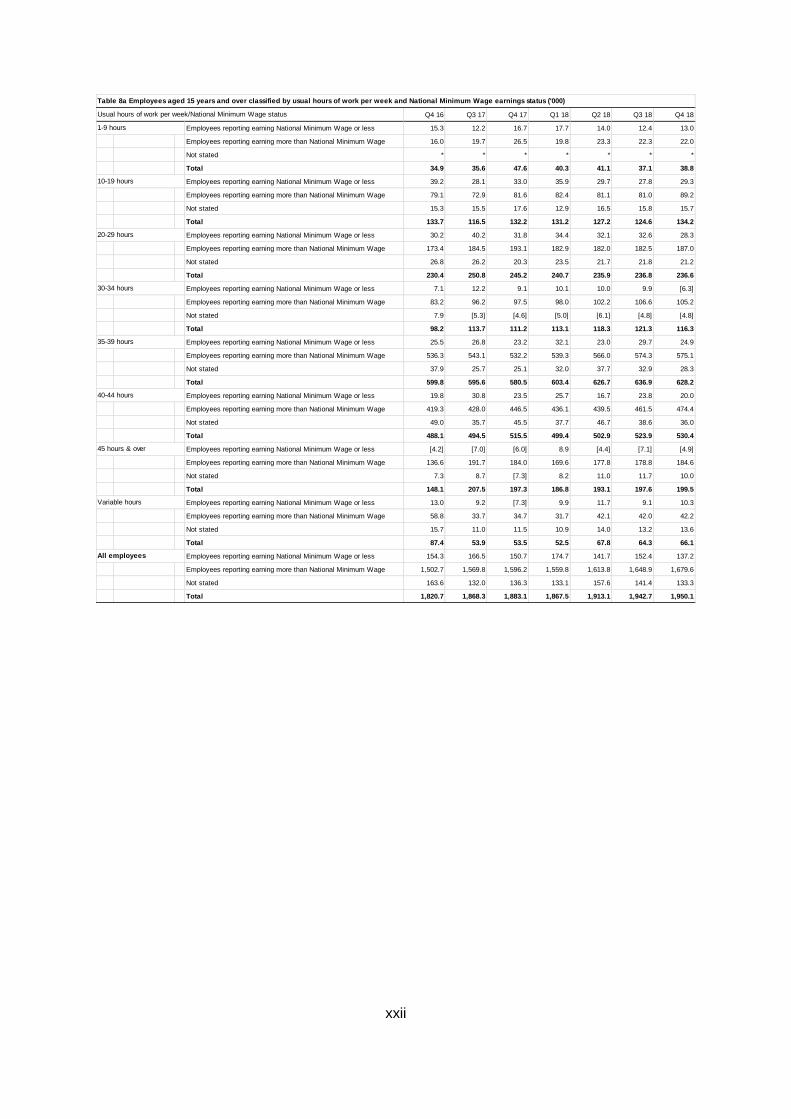
xxii
Q4 16 Q3 17 Q4 17 Q1 18 Q2 18 Q3 18 Q4 18
Employees reporting earning National Minimum Wage or less 15.3 12.2 16.7 17.7 14.0 12.4 13.0
Employees reporting earning more than National Minimum Wage 16.0 19.7 26.5 19.8 23.3 22.3 22.0
Not stated * * * * * * *
Total 34.9 35.6 47.6 40.3 41.1 37.1 38.8
Employees reporting earning National Minimum Wage or less 39.2 28.1 33.0 35.9 29.7 27.8 29.3
Employees reporting earning more than National Minimum Wage 79.1 72.9 81.6 82.4 81.1 81.0 89.2
Not stated 15.3 15.5 17.6 12.9 16.5 15.8 15.7
Total 133.7 116.5 132.2 131.2 127.2 124.6 134.2
Employees reporting earning National Minimum Wage or less 30.2 40.2 31.8 34.4 32.1 32.6 28.3
Employees reporting earning more than National Minimum Wage 173.4 184.5 193.1 182.9 182.0 182.5 187.0
Not stated 26.8 26.2 20.3 23.5 21.7 21.8 21.2
Total 230.4 250.8 245.2 240.7 235.9 236.8 236.6
Employees reporting earning National Minimum Wage or less 7.1 12.2 9.1 10.1 10.0 9.9 [6.3]
Employees reporting earning more than National Minimum Wage 83.2 96.2 97.5 98.0 102.2 106.6 105.2
Not stated 7.9 [5.3] [4.6] [5.0] [6.1] [4.8] [4.8]
Total 98.2 113.7 111.2 113.1 118.3 121.3 116.3
Employees reporting earning National Minimum Wage or less 25.5 26.8 23.2 32.1 23.0 29.7 24.9
Employees reporting earning more than National Minimum Wage 536.3 543.1 532.2 539.3 566.0 574.3 575.1
Not stated 37.9 25.7 25.1 32.0 37.7 32.9 28.3
Total 599.8 595.6 580.5 603.4 626.7 636.9 628.2
Employees reporting earning National Minimum Wage or less 19.8 30.8 23.5 25.7 16.7 23.8 20.0
Employees reporting earning more than National Minimum Wage 419.3 428.0 446.5 436.1 439.5 461.5 474.4
Not stated 49.0 35.7 45.5 37.7 46.7 38.6 36.0
Total 488.1 494.5 515.5 499.4 502.9 523.9 530.4
Employees reporting earning National Minimum Wage or less [4.2] [7.0] [6.0] 8.9 [4.4] [7.1] [4.9]
Employees reporting earning more than National Minimum Wage 136.6 191.7 184.0 169.6 177.8 178.8 184.6
Not stated 7.3 8.7 [7.3] 8.2 11.0 11.7 10.0
Total 148.1 207.5 197.3 186.8 193.1 197.6 199.5
Employees reporting earning National Minimum Wage or less 13.0 9.2 [7.3] 9.9 11.7 9.1 10.3
Employees reporting earning more than National Minimum Wage 58.8 33.7 34.7 31.7 42.1 42.0 42.2
Not stated 15.7 11.0 11.5 10.9 14.0 13.2 13.6
Total 87.4 53.9 53.5 52.5 67.8 64.3 66.1
Employees reporting earning National Minimum Wage or less 154.3 166.5 150.7 174.7 141.7 152.4 137.2
Employees reporting earning more than National Minimum Wage 1,502.7 1,569.8 1,596.2 1,559.8 1,613.8 1,648.9 1,679.6
Not stated 163.6 132.0 136.3 133.1 157.6 141.4 133.3
Total 1,820.7 1,868.3 1,883.1 1,867.5 1,913.1 1,942.7 1,950.1
All employees
Variable hours
Table 8a Employees aged 15 years and over classified by usual hours of work per week and National Minimum Wage earnings status ('000)
1-9 hours
Usual hours of work per week/National Minimum Wage status
10-19 hours
20-29 hours
30-34 hours
35-39 hours
40-44 hours
45 hours & over
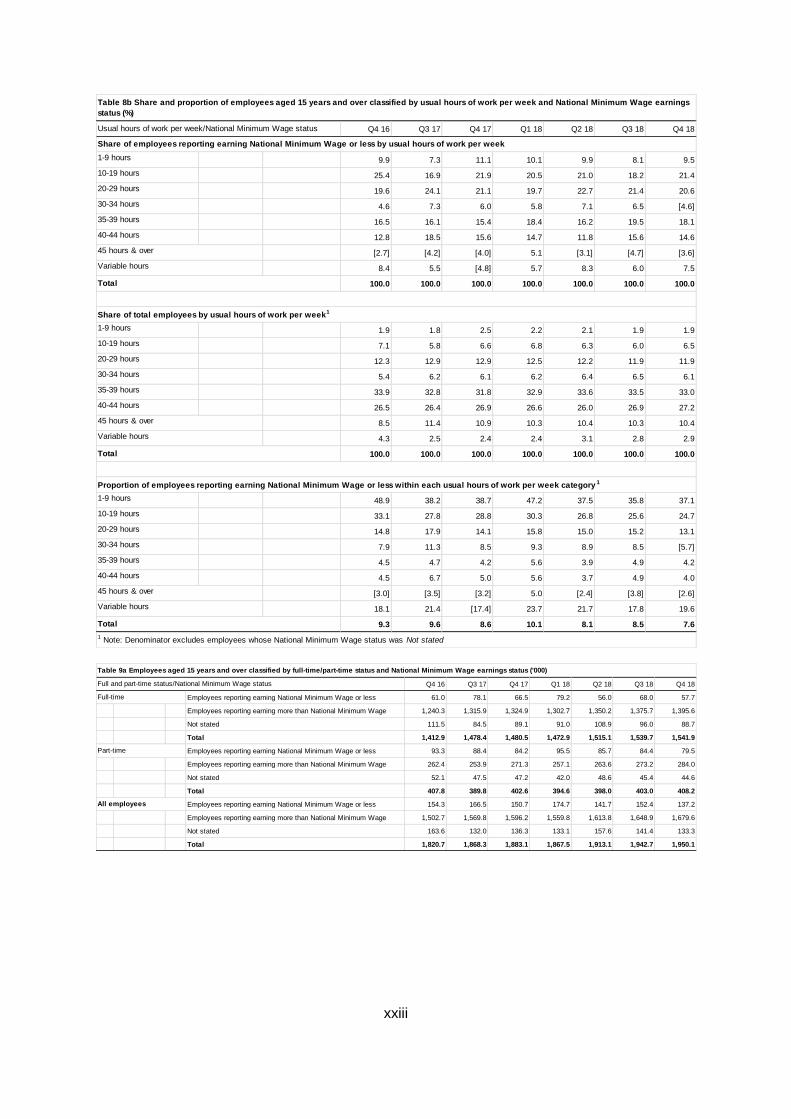
xxiii
Q4 16 Q3 17 Q4 17 Q1 18 Q2 18 Q3 18 Q4 18
9.9 7.3 11.1 10.1 9.9 8.1 9.5
25.4 16.9 21.9 20.5 21.0 18.2 21.4
19.6 24.1 21.1 19.7 22.7 21.4 20.6
4.6 7.3 6.0 5.8 7.1 6.5 [4.6]
16.5 16.1 15.4 18.4 16.2 19.5 18.1
12.8 18.5 15.6 14.7 11.8 15.6 14.6
[2.7] [4.2] [4.0] 5.1 [3.1] [4.7] [3.6]
8.4 5.5 [4.8] 5.7 8.3 6.0 7.5
100.0 100.0 100.0 100.0 100.0 100.0 100.0
1.9 1.8 2.5 2.2 2.1 1.9 1.9
7.1 5.8 6.6 6.8 6.3 6.0 6.5
12.3 12.9 12.9 12.5 12.2 11.9 11.9
5.4 6.2 6.1 6.2 6.4 6.5 6.1
33.9 32.8 31.8 32.9 33.6 33.5 33.0
26.5 26.4 26.9 26.6 26.0 26.9 27.2
8.5 11.4 10.9 10.3 10.4 10.3 10.4
4.3 2.5 2.4 2.4 3.1 2.8 2.9
100.0 100.0 100.0 100.0 100.0 100.0 100.0
48.9 38.2 38.7 47.2 37.5 35.8 37.1
33.1 27.8 28.8 30.3 26.8 25.6 24.7
14.8 17.9 14.1 15.8 15.0 15.2 13.1
7.9 11.3 8.5 9.3 8.9 8.5 [5.7]
4.5 4.7 4.2 5.6 3.9 4.9 4.2
4.5 6.7 5.0 5.6 3.7 4.9 4.0
[3.0] [3.5] [3.2] 5.0 [2.4] [3.8] [2.6]
18.1 21.4 [17.4] 23.7 21.7 17.8 19.6
9.3 9.6 8.6 10.1 8.1 8.5 7.6
Total
Proportion of employees reporting earning National Minimum Wage or less within each usual hours of work per week category 1
30-34 hours
35-39 hours
40-44 hours
45 hours & over
Variable hours
Share of total employees by usual hours of work per week1
1 Note: Denominator excludes employees whose National Minimum Wage status was Not stated
Total
35-39 hours
40-44 hours
45 hours & over
Variable hours
1-9 hours
10-19 hours
20-29 hours
30-34 hours
1-9 hours
10-19 hours
20-29 hours
Total
1-9 hours
10-19 hours
20-29 hours
Table 8b Share and proportion of employees aged 15 years and over classified by usual hours of work per week and National Minimum Wage earnings
status (%)
Usual hours of work per week/National Minimum Wage status
Share of employees reporting earning National Minimum Wage or less by usual hours of work per week
40-44 hours
45 hours & over
Variable hours
30-34 hours
35-39 hours
Q4 16 Q3 17 Q4 17 Q1 18 Q2 18 Q3 18 Q4 18
Employees reporting earning National Minimum Wage or less 61.0 78.1 66.5 79.2 56.0 68.0 57.7
Employees reporting earning more than National Minimum Wage 1,240.3 1,315.9 1,324.9 1,302.7 1,350.2 1,375.7 1,395.6
Not stated 111.5 84.5 89.1 91.0 108.9 96.0 88.7
Total 1,412.9 1,478.4 1,480.5 1,472.9 1,515.1 1,539.7 1,541.9
Employees reporting earning National Minimum Wage or less 93.3 88.4 84.2 95.5 85.7 84.4 79.5
Employees reporting earning more than National Minimum Wage 262.4 253.9 271.3 257.1 263.6 273.2 284.0
Not stated 52.1 47.5 47.2 42.0 48.6 45.4 44.6
Total 407.8 389.8 402.6 394.6 398.0 403.0 408.2
Employees reporting earning National Minimum Wage or less 154.3 166.5 150.7 174.7 141.7 152.4 137.2
Employees reporting earning more than National Minimum Wage 1,502.7 1,569.8 1,596.2 1,559.8 1,613.8 1,648.9 1,679.6
Not stated 163.6 132.0 136.3 133.1 157.6 141.4 133.3
Total 1,820.7 1,868.3 1,883.1 1,867.5 1,913.1 1,942.7 1,950.1
Full and part-time status/National Minimum Wage status
Table 9a Employees aged 15 years and over classified by full-time/part-time status and National Minimum Wage earnings status ('000)
Full-time
Part-time
All employees
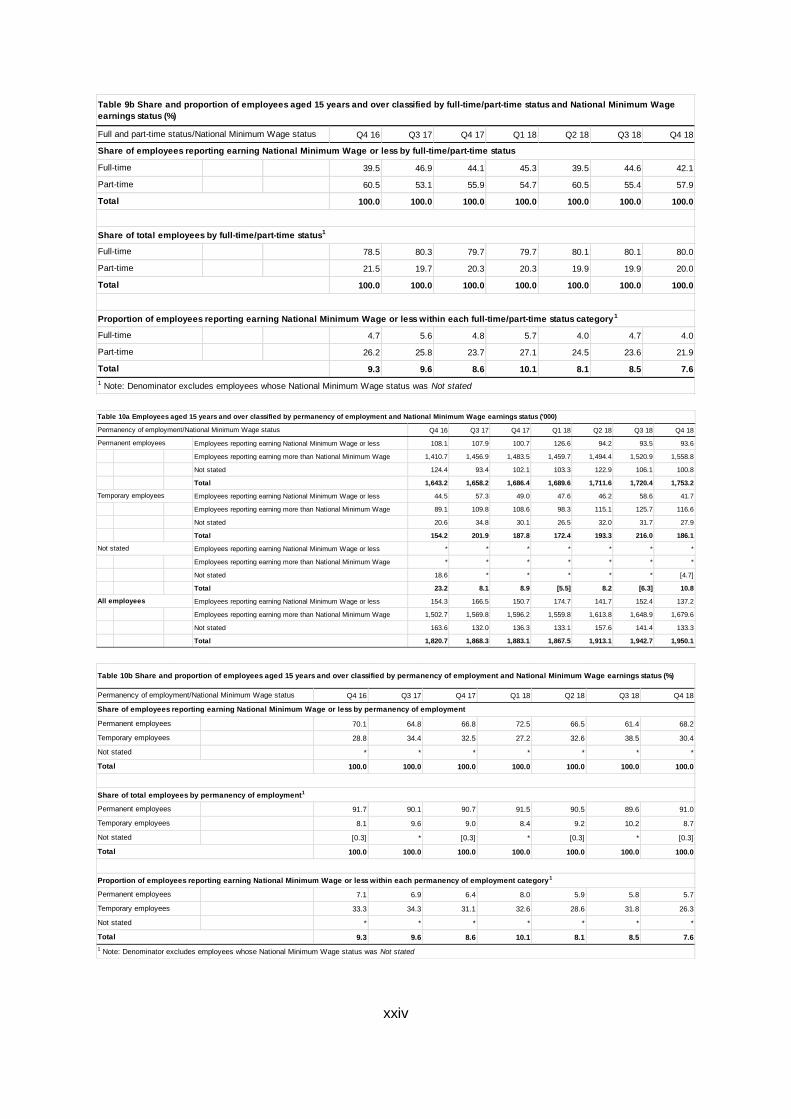
xxiv
Q4 16 Q3 17 Q4 17 Q1 18 Q2 18 Q3 18 Q4 18
39.5 46.9 44.1 45.3 39.5 44.6 42.1
60.5 53.1 55.9 54.7 60.5 55.4 57.9
100.0 100.0 100.0 100.0 100.0 100.0 100.0
78.5 80.3 79.7 79.7 80.1 80.1 80.0
21.5 19.7 20.3 20.3 19.9 19.9 20.0
100.0 100.0 100.0 100.0 100.0 100.0 100.0
4.7 5.6 4.8 5.7 4.0 4.7 4.0
26.2 25.8 23.7 27.1 24.5 23.6 21.9
9.3 9.6 8.6 10.1 8.1 8.5 7.6
1 Note: Denominator excludes employees whose National Minimum Wage status was Not stated
Total
Total
Proportion of employees reporting earning National Minimum Wage or less within each full-time/part-time status category1
Full-time
Part-time
Full and part-time status/National Minimum Wage status
Table 9b Share and proportion of employees aged 15 years and over classified by full-time/part-time status and National Minimum Wage
earnings status (%)
Full-time
Part-time
Share of employees reporting earning National Minimum Wage or less by full-time/part-time status
Full-time
Part-time
Total
Share of total employees by full-time/part-time status1
Q4 16 Q3 17 Q4 17 Q1 18 Q2 18 Q3 18 Q4 18
Employees reporting earning National Minimum Wage or less 108.1 107.9 100.7 126.6 94.2 93.5 93.6
Employees reporting earning more than National Minimum Wage 1,410.7 1,456.9 1,483.5 1,459.7 1,494.4 1,520.9 1,558.8
Not stated 124.4 93.4 102.1 103.3 122.9 106.1 100.8
Total 1,643.2 1,658.2 1,686.4 1,689.6 1,711.6 1,720.4 1,753.2
Employees reporting earning National Minimum Wage or less 44.5 57.3 49.0 47.6 46.2 58.6 41.7
Employees reporting earning more than National Minimum Wage 89.1 109.8 108.6 98.3 115.1 125.7 116.6
Not stated 20.6 34.8 30.1 26.5 32.0 31.7 27.9
Total 154.2 201.9 187.8 172.4 193.3 216.0 186.1
Employees reporting earning National Minimum Wage or less * * * * * * *
Employees reporting earning more than National Minimum Wage * * * * * * *
Not stated 18.6 * * * * * [4.7]
Total 23.2 8.1 8.9 [5.5] 8.2 [6.3] 10.8
Employees reporting earning National Minimum Wage or less 154.3 166.5 150.7 174.7 141.7 152.4 137.2
Employees reporting earning more than National Minimum Wage 1,502.7 1,569.8 1,596.2 1,559.8 1,613.8 1,648.9 1,679.6
Not stated 163.6 132.0 136.3 133.1 157.6 141.4 133.3
Total 1,820.7 1,868.3 1,883.1 1,867.5 1,913.1 1,942.7 1,950.1
All employees
Not stated
Temporary employees
Table 10a Employees aged 15 years and over classified by permanency of employment and National Minimum Wage earnings status ('000)
Permanent employees
Permanency of employment/National Minimum Wage status
Q4 16 Q3 17 Q4 17 Q1 18 Q2 18 Q3 18 Q4 18
70.1 64.8 66.8 72.5 66.5 61.4 68.2
28.8 34.4 32.5 27.2 32.6 38.5 30.4
* * * * * * *
100.0 100.0 100.0 100.0 100.0 100.0 100.0
91.7 90.1 90.7 91.5 90.5 89.6 91.0
8.1 9.6 9.0 8.4 9.2 10.2 8.7
[0.3] * [0.3] * [0.3] * [0.3]
100.0 100.0 100.0 100.0 100.0 100.0 100.0
7.1 6.9 6.4 8.0 5.9 5.8 5.7
33.3 34.3 31.1 32.6 28.6 31.8 26.3
* * * * * * *
9.3 9.6 8.6 10.1 8.1 8.5 7.6
Share of employees reporting earning National Minimum Wage or less by permanency of employment
Not stated
Permanent employees
Temporary employees
Table 10b Share and proportion of employees aged 15 years and over classified by permanency of employment and National Minimum Wage earnings status (%)
Permanency of employment/National Minimum Wage status
Permanent employees
Temporary employees
Not stated
Permanent employees
Share of total employees by permanency of employment1
Temporary employees
Total
1 Note: Denominator excludes employees whose National Minimum Wage status was Not stated
Total
Total
Proportion of employees reporting earning National Minimum Wage or less within each permanency of employment category1
Not stated

xxv
Q4 16 Q3 17 Q4 17 Q1 18 Q2 18 Q3 18 Q4 18
Employees reporting earning National Minimum Wage or less 7.2 13.8 10.6 11.8 [7.6] 9.3 8.3
Employees reporting earning more than National Minimum Wage 479.7 535.8 544.0 519.9 528.1 533.8 550.8
Not stated 19.9 18.9 21.3 21.3 26.6 19.4 21.6
Total 506.8 568.5 575.9 553.0 562.3 562.4 580.8
Employees reporting earning National Minimum Wage or less 147.1 151.0 139.4 161.5 132.6 142.7 128.7
Employees reporting earning more than National Minimum Wage 1,020.6 1,012.2 1,042.7 1,030.9 1,078.5 1,109.5 1,121.5
Not stated 122.9 107.0 109.4 107.8 125.9 115.4 107.8
Total 1,290.6 1,270.2 1,291.6 1,300.3 1,337.0 1,367.6 1,358.0
Employees reporting earning National Minimum Wage or less * * * * * * *
Employees reporting earning more than National Minimum Wage * 21.8 9.5 8.9 [7.3] [5.7] [7.3]
Not stated 20.8 [6.1] * * [5.0] [6.7] *
Total 23.2 29.6 15.6 14.3 13.8 12.7 11.3
Employees reporting earning National Minimum Wage or less 154.3 166.5 150.7 174.7 141.7 152.4 137.2
Employees reporting earning more than National Minimum Wage 1,502.7 1,569.8 1,596.2 1,559.8 1,613.8 1,648.9 1,679.6
Not stated 163.6 132.0 136.3 133.1 157.6 141.4 133.3
Total 1,820.7 1,868.3 1,883.1 1,867.5 1,913.1 1,942.7 1,950.1
Not stated
All employees
Table 11a Employees aged 15 years and over classified by supervisory duties and National Minimum Wage earnings status ('000)
Employees classified by supervisory duties and National Minimum Wage status
Person is a supervisor
Supervisory duties/National Minimum Wage status
Person is not a supervisor
Q4 16 Q3 17 Q4 17 Q1 18 Q2 18 Q3 18 Q4 18
4.7 8.3 7.0 6.8 [5.4] 6.1 6.0
95.3 90.7 92.5 92.4 93.6 93.6 93.8
* * * * * * *
100.0 100.0 100.0 100.0 100.0 100.0 100.0
29.4 31.7 31.7 30.7 30.5 30.1 30.8
70.5 67.0 67.7 68.7 69.0 69.5 68.8
* 1.4 0.6 0.6 0.5 [0.3] [0.4]
100.0 100.0 100.0 100.0 100.0 100.0 100.0
1.5 2.5 1.9 2.2 [1.4] 1.7 1.5
12.6 13.0 11.8 13.5 10.9 11.4 10.3
* * * * * * *
9.3 9.6 8.6 10.1 8.1 8.5 7.6
1 Note: Denominator excludes employees whose National Minimum Wage status was Not stated
Total
Total
Proportion of employees reporting earning National Minimum Wage or less within each supervisory duties category1
Person is a supervisor
Person is not a supervisor
Not stated
Share of employees reporting earning National Minimum Wage or less by supervisory duties
Total
Table 11b Share and proportion of mployees aged 15 years and over classified by supervisory duties and National Minimum Wage
earnings status (%)
Supervisory duties/National Minimum Wage status
Not stated
Person is a supervisor
Person is not a supervisor
Not stated
Person is a supervisor
Share of total employees by supervisory duties1
Person is not a supervisor

xxvi
Q4 16 Q3 17 Q4 17 Q1 18 Q2 18 Q3 18 Q4 18
Employees reporting earning National Minimum Wage or less 20.8 26.4 22.4 14.6 22.1 32.3 21.7
Employees reporting earning more than National Minimum Wage 59.3 81.5 71.9 65.7 65.2 78.6 82.3
Not stated 10.9 15.6 10.7 [7] 10.7 12.4 13.0
Total 91.1 123.6 105.0 87.4 98.0 123.3 116.9
Employees reporting earning National Minimum Wage or less 21.1 19.3 15.6 22.1 12.4 19.0 18.1
Employees reporting earning more than National Minimum Wage 64.7 64.3 69.6 69.2 67.8 67.3 72.5
Not stated 10.5 8.4 8.1 8.1 9.8 9.6 [7.5]
Total 96.2 92.0 93.3 99.4 90.0 95.9 98.1
Employees reporting earning National Minimum Wage or less 24.4 23.3 19.8 31.2 24.0 21.7 17.2
Employees reporting earning more than National Minimum Wage 98.6 103.9 89.4 99.7 125.5 116.6 114.9
Not stated 16.5 15.3 13.1 10.1 16.8 16.7 11.1
Total 139.5 142.5 122.3 141.0 166.3 155.1 143.2
Employees reporting earning National Minimum Wage or less 66.2 69.1 57.8 68.0 58.5 73.0 57.0
Employees reporting earning more than National Minimum Wage 222.6 249.7 230.8 234.6 258.5 262.6 269.8
Not stated 37.9 39.4 31.9 25.3 37.3 38.8 31.5
Total 326.7 358.1 320.6 327.9 354.3 374.3 358.3
Employees reporting earning National Minimum Wage or less 17.6 16.8 20.0 16.3 14.6 16.8 13.1
Employees reporting earning more than National Minimum Wage 87.6 81.9 95.2 88.9 90.3 93.5 96.1
Not stated 13.6 [7.7] 9.4 14.1 11.3 9.0 [6.8]
Total 118.7 106.4 124.6 119.3 116.3 119.2 116.0
Employees reporting earning National Minimum Wage or less 10.9 11.9 9.8 13.2 10.5 8.3 9.0
Employees reporting earning more than National Minimum Wage 66.1 77.6 72.9 67.0 69.8 81.6 70.7
Not stated 10.1 [6.7] [6.6] * [5.7] 7.6 [7]
Total 87.1 96.3 89.3 84.0 85.9 97.5 86.7
Employees reporting earning National Minimum Wage or less 23.5 22.6 24.9 26.2 21.5 21.5 25.3
Employees reporting earning more than National Minimum Wage 165.8 201.4 210.3 159.8 202.6 230.3 231.9
Not stated 17.5 16.9 17.6 19.7 18.8 20.1 19.6
Total 206.7 240.9 252.8 205.7 242.9 272.0 276.8
Employees reporting earning National Minimum Wage or less 32.2 36.6 33.2 44.7 30.9 26.4 28.9
Employees reporting earning more than National Minimum Wage 923.8 883.4 916.6 940.4 927.0 912.6 953.2
Not stated 57.5 39.2 39.8 47.1 49.5 38.5 42.8
Total 1,013.5 959.1 989.7 1,032.2 1,007.4 977.6 1,025.0
Employees reporting earning National Minimum Wage or less 84.1 87.9 87.9 100.4 77.5 73.1 76.3
Employees reporting earning more than National Minimum Wage 1,243.3 1,244.3 1,295.1 1,256.1 1,289.7 1,318.1 1,351.9
Not stated 98.6 70.5 73.4 84.8 85.3 75.2 76.3
Total 1,426.1 1,402.7 1,456.4 1,441.2 1,452.5 1,466.4 1,504.5
Employees reporting earning National Minimum Wage or less * 9.5 [4.9] [6.3] [5.7] [6.3] *
Employees reporting earning more than National Minimum Wage 36.9 75.8 70.3 69.1 65.6 68.3 57.9
Not stated 27.1 22.1 30.9 23.0 35.0 27.3 25.5
Total 67.9 107.4 106.1 98.4 106.3 102.0 87.3
Employees reporting earning National Minimum Wage or less 154.3 166.5 150.7 174.7 141.7 152.4 137.2
Employees reporting earning more than National Minimum Wage 1,502.7 1,569.8 1,596.2 1,559.8 1,613.8 1,648.9 1,679.6
Not stated 163.6 132.0 136.3 133.1 157.6 141.4 133.3
Total 1,820.7 1,868.3 1,883.1 1,867.5 1,913.1 1,942.7 1,950.1
3-5 months
Table 12a Employees aged 15 years and over classified by duration of employment and National Minimum Wage earnings status ('000)
Employees classified by duration of employment and National Minimum Wage status
Less than 3 months
Duration of employment/National Minimum Wage status
48 months and greater
Total 1 year and over
Not stated
All employees
6-11 months
Total less than 1 year
12-17 months
18-23 months
24-47 months
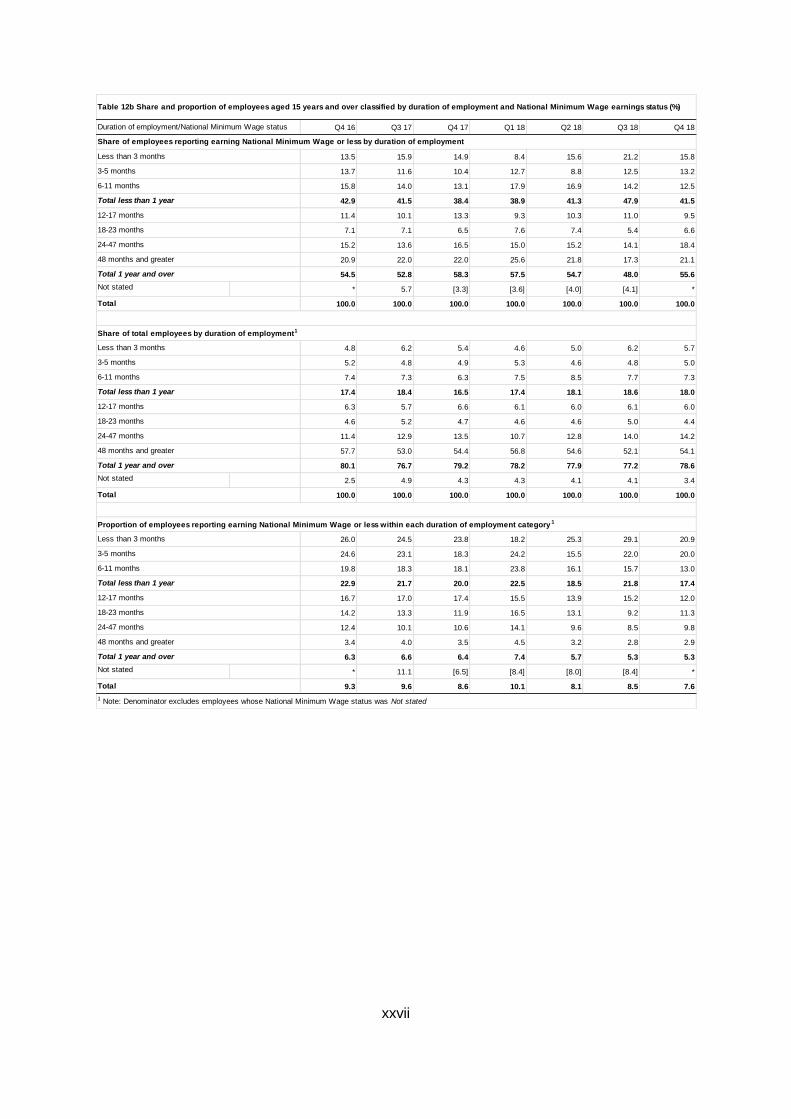
xxvii
Q4 16 Q3 17 Q4 17 Q1 18 Q2 18 Q3 18 Q4 18
13.5 15.9 14.9 8.4 15.6 21.2 15.8
13.7 11.6 10.4 12.7 8.8 12.5 13.2
15.8 14.0 13.1 17.9 16.9 14.2 12.5
42.9 41.5 38.4 38.9 41.3 47.9 41.5
11.4 10.1 13.3 9.3 10.3 11.0 9.5
7.1 7.1 6.5 7.6 7.4 5.4 6.6
15.2 13.6 16.5 15.0 15.2 14.1 18.4
20.9 22.0 22.0 25.6 21.8 17.3 21.1
54.5 52.8 58.3 57.5 54.7 48.0 55.6
* 5.7 [3.3] [3.6] [4.0] [4.1] *
100.0 100.0 100.0 100.0 100.0 100.0 100.0
4.8 6.2 5.4 4.6 5.0 6.2 5.7
5.2 4.8 4.9 5.3 4.6 4.8 5.0
7.4 7.3 6.3 7.5 8.5 7.7 7.3
17.4 18.4 16.5 17.4 18.1 18.6 18.0
6.3 5.7 6.6 6.1 6.0 6.1 6.0
4.6 5.2 4.7 4.6 4.6 5.0 4.4
11.4 12.9 13.5 10.7 12.8 14.0 14.2
57.7 53.0 54.4 56.8 54.6 52.1 54.1
80.1 76.7 79.2 78.2 77.9 77.2 78.6
2.5 4.9 4.3 4.3 4.1 4.1 3.4
100.0 100.0 100.0 100.0 100.0 100.0 100.0
26.0 24.5 23.8 18.2 25.3 29.1 20.9
24.6 23.1 18.3 24.2 15.5 22.0 20.0
19.8 18.3 18.1 23.8 16.1 15.7 13.0
22.9 21.7 20.0 22.5 18.5 21.8 17.4
16.7 17.0 17.4 15.5 13.9 15.2 12.0
14.2 13.3 11.9 16.5 13.1 9.2 11.3
12.4 10.1 10.6 14.1 9.6 8.5 9.8
3.4 4.0 3.5 4.5 3.2 2.8 2.9
6.3 6.6 6.4 7.4 5.7 5.3 5.3
* 11.1 [6.5] [8.4] [8.0] [8.4] *
9.3 9.6 8.6 10.1 8.1 8.5 7.6
Share of employees reporting earning National Minimum Wage or less by duration of employment
Less than 3 months
3-5 months
Table 12b Share and proportion of employees aged 15 years and over classified by duration of employment and National Minimum Wage earnings status (%)
Duration of employment/National Minimum Wage status
3-5 months
6-11 months
Total less than 1 year
12-17 months
18-23 months
24-47 months
48 months and greater
Total 1 year and over
Not stated
Share of total employees by duration of employment1
Less than 3 months
3-5 months
6-11 months
Total less than 1 year
12-17 months
18-23 months
1 Note: Denominator excludes employees whose National Minimum Wage status was Not stated
Total
6-11 months
Total less than 1 year
12-17 months
18-23 months
24-47 months
48 months and greater
Total 1 year and over
Not stated
Total
Proportion of employees reporting earning National Minimum Wage or less within each duration of employment category 1
Less than 3 months
24-47 months
48 months and greater
Total 1 year and over
Not stated
Total
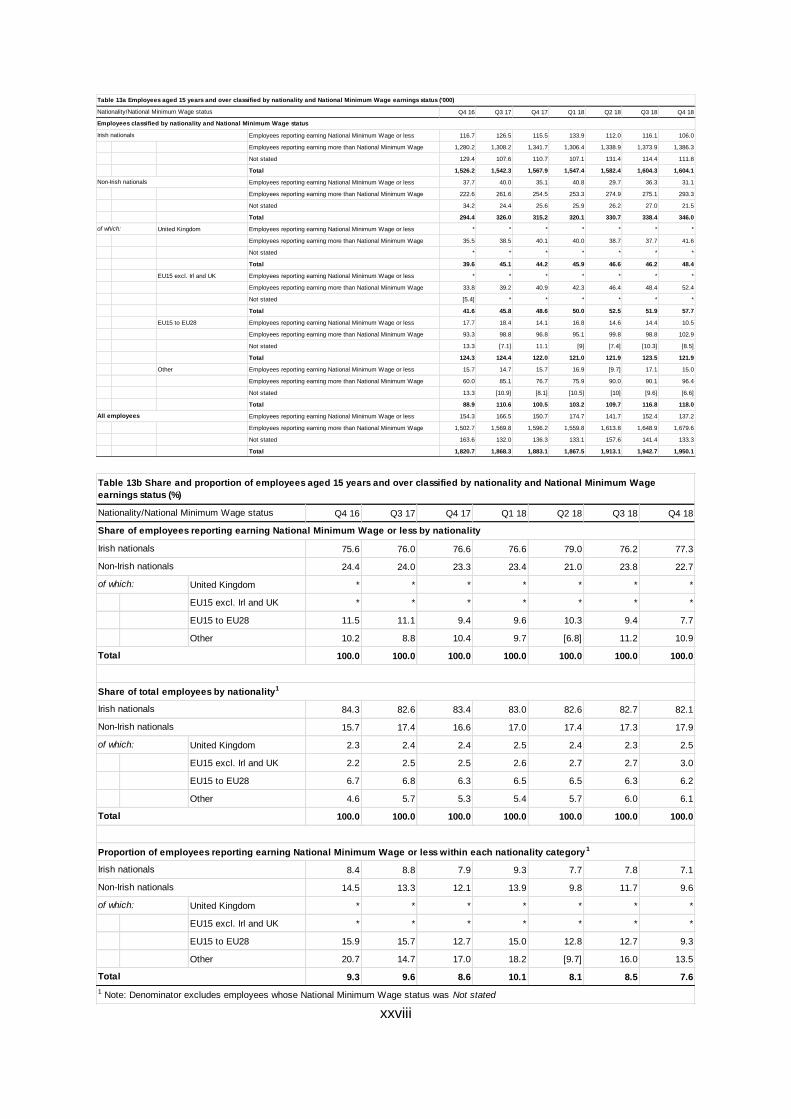
xxviii
Q4 16 Q3 17 Q4 17 Q1 18 Q2 18 Q3 18 Q4 18
Employees reporting earning National Minimum Wage or less 116.7 126.5 115.5 133.9 112.0 116.1 106.0
Employees reporting earning more than National Minimum Wage 1,280.2 1,308.2 1,341.7 1,306.4 1,338.9 1,373.9 1,386.3
Not stated 129.4 107.6 110.7 107.1 131.4 114.4 111.8
Total 1,526.2 1,542.3 1,567.9 1,547.4 1,582.4 1,604.3 1,604.1
Employees reporting earning National Minimum Wage or less 37.7 40.0 35.1 40.8 29.7 36.3 31.1
Employees reporting earning more than National Minimum Wage 222.6 261.6 254.5 253.3 274.9 275.1 293.3
Not stated 34.2 24.4 25.6 25.9 26.2 27.0 21.5
Total 294.4 326.0 315.2 320.1 330.7 338.4 346.0
United Kingdom Employees reporting earning National Minimum Wage or less * * * * * * *
Employees reporting earning more than National Minimum Wage 35.5 38.5 40.1 40.0 38.7 37.7 41.6
Not stated * * * * * * *
Total 39.6 45.1 44.2 45.9 46.6 46.2 48.4
EU15 excl. Irl and UK Employees reporting earning National Minimum Wage or less * * * * * * *
Employees reporting earning more than National Minimum Wage 33.8 39.2 40.9 42.3 46.4 48.4 52.4
Not stated [5.4] * * * * * *
Total 41.6 45.8 48.6 50.0 52.5 51.9 57.7
EU15 to EU28 Employees reporting earning National Minimum Wage or less 17.7 18.4 14.1 16.8 14.6 14.4 10.5
Employees reporting earning more than National Minimum Wage 93.3 98.8 96.8 95.1 99.8 98.8 102.9
Not stated 13.3 [7.1] 11.1 [9] [7.4] [10.3] [8.5]
Total 124.3 124.4 122.0 121.0 121.9 123.5 121.9
Other Employees reporting earning National Minimum Wage or less 15.7 14.7 15.7 16.9 [9.7] 17.1 15.0
Employees reporting earning more than National Minimum Wage 60.0 85.1 76.7 75.9 90.0 90.1 96.4
Not stated 13.3 [10.9] [8.1] [10.5] [10] [9.6] [6.6]
Total 88.9 110.6 100.5 103.2 109.7 116.8 118.0
Employees reporting earning National Minimum Wage or less 154.3 166.5 150.7 174.7 141.7 152.4 137.2
Employees reporting earning more than National Minimum Wage 1,502.7 1,569.8 1,596.2 1,559.8 1,613.8 1,648.9 1,679.6
Not stated 163.6 132.0 136.3 133.1 157.6 141.4 133.3
Total 1,820.7 1,868.3 1,883.1 1,867.5 1,913.1 1,942.7 1,950.1
Non-Irish nationals
of which:
All employees
Nationality/National Minimum Wage status
Table 13a Employees aged 15 years and over classified by nationality and National Minimum Wage earnings status ('000)
Employees classified by nationality and National Minimum Wage status
Irish nationals
Q4 16 Q3 17 Q4 17 Q1 18 Q2 18 Q3 18 Q4 18
75.6 76.0 76.6 76.6 79.0 76.2 77.3
24.4 24.0 23.3 23.4 21.0 23.8 22.7
United Kingdom * * * * * * *
EU15 excl. Irl and UK * * * * * * *
EU15 to EU28 11.5 11.1 9.4 9.6 10.3 9.4 7.7
Other 10.2 8.8 10.4 9.7 [6.8] 11.2 10.9
100.0 100.0 100.0 100.0 100.0 100.0 100.0
84.3 82.6 83.4 83.0 82.6 82.7 82.1
15.7 17.4 16.6 17.0 17.4 17.3 17.9
United Kingdom 2.3 2.4 2.4 2.5 2.4 2.3 2.5
EU15 excl. Irl and UK 2.2 2.5 2.5 2.6 2.7 2.7 3.0
EU15 to EU28 6.7 6.8 6.3 6.5 6.5 6.3 6.2
Other 4.6 5.7 5.3 5.4 5.7 6.0 6.1
100.0 100.0 100.0 100.0 100.0 100.0 100.0
8.4 8.8 7.9 9.3 7.7 7.8 7.1
14.5 13.3 12.1 13.9 9.8 11.7 9.6
United Kingdom * * * * * * *
EU15 excl. Irl and UK * * * * * * *
EU15 to EU28 15.9 15.7 12.7 15.0 12.8 12.7 9.3
Other 20.7 14.7 17.0 18.2 [9.7] 16.0 13.5
9.3 9.6 8.6 10.1 8.1 8.5 7.6
Irish nationals
Non-Irish nationals
Irish nationals
of which:
Share of employees reporting earning National Minimum Wage or less by nationality
Irish nationals
Non-Irish nationals
Non-Irish nationals
of which:
1 Note: Denominator excludes employees whose National Minimum Wage status was Not stated
Total
of which:
Total
Proportion of employees reporting earning National Minimum Wage or less within each nationality category 1
Nationality/National Minimum Wage status
Table 13b Share and proportion of employees aged 15 years and over classified by nationality and National Minimum Wage
earnings status (%)
Total
Share of total employees by nationality1
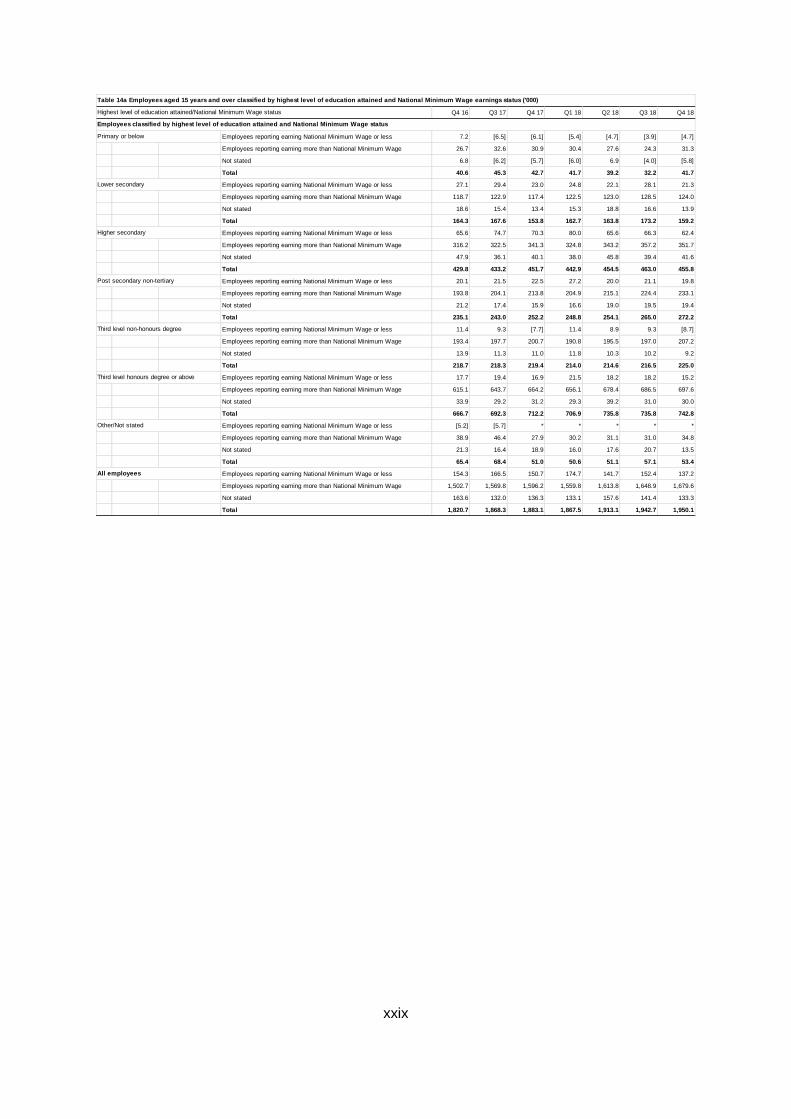
xxix
Q4 16 Q3 17 Q4 17 Q1 18 Q2 18 Q3 18 Q4 18
Employees reporting earning National Minimum Wage or less 7.2 [6.5] [6.1] [5.4] [4.7] [3.9] [4.7]
Employees reporting earning more than National Minimum Wage 26.7 32.6 30.9 30.4 27.6 24.3 31.3
Not stated 6.8 [6.2] [5.7] [6.0] 6.9 [4.0] [5.8]
Total 40.6 45.3 42.7 41.7 39.2 32.2 41.7
Employees reporting earning National Minimum Wage or less 27.1 29.4 23.0 24.8 22.1 28.1 21.3
Employees reporting earning more than National Minimum Wage 118.7 122.9 117.4 122.5 123.0 128.5 124.0
Not stated 18.6 15.4 13.4 15.3 18.8 16.6 13.9
Total 164.3 167.6 153.8 162.7 163.8 173.2 159.2
Employees reporting earning National Minimum Wage or less 65.6 74.7 70.3 80.0 65.6 66.3 62.4
Employees reporting earning more than National Minimum Wage 316.2 322.5 341.3 324.8 343.2 357.2 351.7
Not stated 47.9 36.1 40.1 38.0 45.8 39.4 41.6
Total 429.8 433.2 451.7 442.9 454.5 463.0 455.8
Employees reporting earning National Minimum Wage or less 20.1 21.5 22.5 27.2 20.0 21.1 19.8
Employees reporting earning more than National Minimum Wage 193.8 204.1 213.8 204.9 215.1 224.4 233.1
Not stated 21.2 17.4 15.9 16.6 19.0 19.5 19.4
Total 235.1 243.0 252.2 248.8 254.1 265.0 272.2
Employees reporting earning National Minimum Wage or less 11.4 9.3 [7.7] 11.4 8.9 9.3 [8.7]
Employees reporting earning more than National Minimum Wage 193.4 197.7 200.7 190.8 195.5 197.0 207.2
Not stated 13.9 11.3 11.0 11.8 10.3 10.2 9.2
Total 218.7 218.3 219.4 214.0 214.6 216.5 225.0
Employees reporting earning National Minimum Wage or less 17.7 19.4 16.9 21.5 18.2 18.2 15.2
Employees reporting earning more than National Minimum Wage 615.1 643.7 664.2 656.1 678.4 686.5 697.6
Not stated 33.9 29.2 31.2 29.3 39.2 31.0 30.0
Total 666.7 692.3 712.2 706.9 735.8 735.8 742.8
Employees reporting earning National Minimum Wage or less [5.2] [5.7] * * * * *
Employees reporting earning more than National Minimum Wage 38.9 46.4 27.9 30.2 31.1 31.0 34.8
Not stated 21.3 16.4 18.9 16.0 17.6 20.7 13.5
Total 65.4 68.4 51.0 50.6 51.1 57.1 53.4
Employees reporting earning National Minimum Wage or less 154.3 166.5 150.7 174.7 141.7 152.4 137.2
Employees reporting earning more than National Minimum Wage 1,502.7 1,569.8 1,596.2 1,559.8 1,613.8 1,648.9 1,679.6
Not stated 163.6 132.0 136.3 133.1 157.6 141.4 133.3
Total 1,820.7 1,868.3 1,883.1 1,867.5 1,913.1 1,942.7 1,950.1
Third level honours degree or above
Other/Not stated
All employees
Table 14a Employees aged 15 years and over classified by highest level of education attained and National Minimum Wage earnings status ('000)
Employees classified by highest level of education attained and National Minimum Wage status
Highest level of education attained/National Minimum Wage status
Primary or below
Lower secondary
Higher secondary
Post secondary non-tertiary
Third level non-honours degree
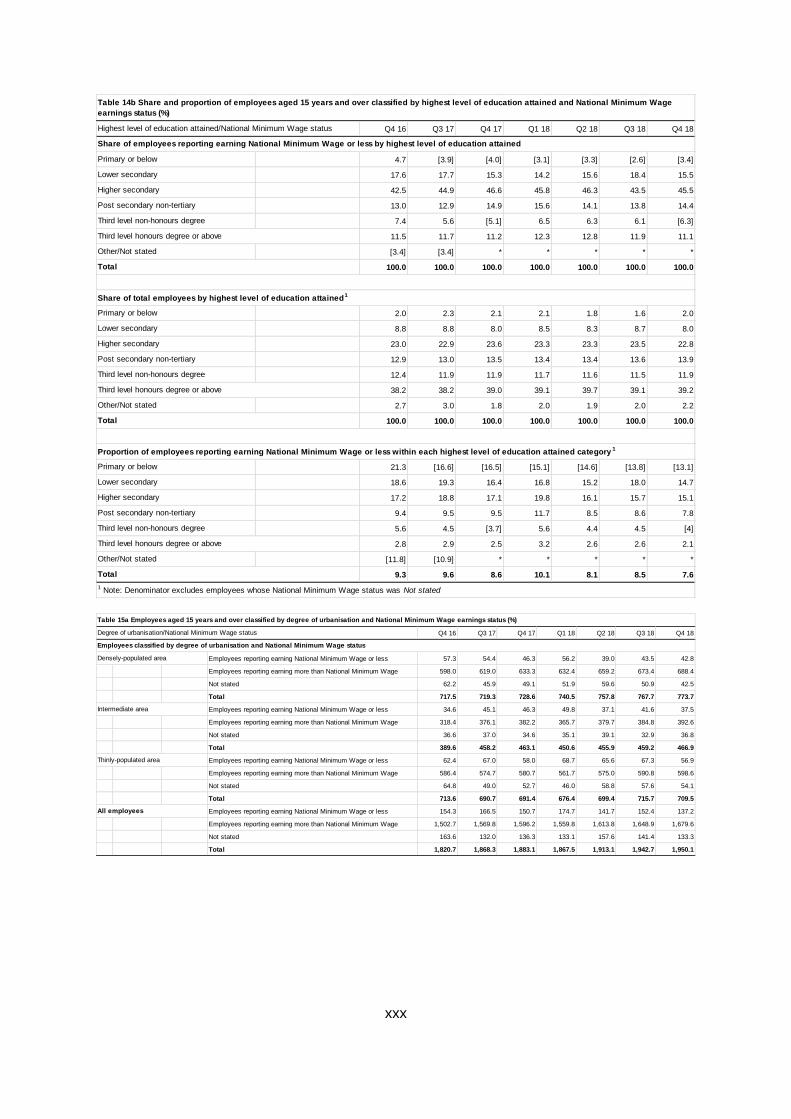
xxx
Q4 16 Q3 17 Q4 17 Q1 18 Q2 18 Q3 18 Q4 18
4.7 [3.9] [4.0] [3.1] [3.3] [2.6] [3.4]
17.6 17.7 15.3 14.2 15.6 18.4 15.5
42.5 44.9 46.6 45.8 46.3 43.5 45.5
13.0 12.9 14.9 15.6 14.1 13.8 14.4
7.4 5.6 [5.1] 6.5 6.3 6.1 [6.3]
11.5 11.7 11.2 12.3 12.8 11.9 11.1
[3.4] [3.4] * * * * *
100.0 100.0 100.0 100.0 100.0 100.0 100.0
2.0 2.3 2.1 2.1 1.8 1.6 2.0
8.8 8.8 8.0 8.5 8.3 8.7 8.0
23.0 22.9 23.6 23.3 23.3 23.5 22.8
12.9 13.0 13.5 13.4 13.4 13.6 13.9
12.4 11.9 11.9 11.7 11.6 11.5 11.9
38.2 38.2 39.0 39.1 39.7 39.1 39.2
2.7 3.0 1.8 2.0 1.9 2.0 2.2
100.0 100.0 100.0 100.0 100.0 100.0 100.0
21.3 [16.6] [16.5] [15.1] [14.6] [13.8] [13.1]
18.6 19.3 16.4 16.8 15.2 18.0 14.7
17.2 18.8 17.1 19.8 16.1 15.7 15.1
9.4 9.5 9.5 11.7 8.5 8.6 7.8
5.6 4.5 [3.7] 5.6 4.4 4.5 [4]
2.8 2.9 2.5 3.2 2.6 2.6 2.1
[11.8] [10.9] * * * * *
9.3 9.6 8.6 10.1 8.1 8.5 7.6
Total
Share of total employees by highest level of education attained1
Table 14b Share and proportion of employees aged 15 years and over classified by highest level of education attained and National Minimum Wage
earnings status (%)
Highest level of education attained/National Minimum Wage status
Third level non-honours degree
Third level honours degree or above
Other/Not stated
Share of employees reporting earning National Minimum Wage or less by highest level of education attained
Primary or below
Lower secondary
Higher secondary
Post secondary non-tertiary
Total
Proportion of employees reporting earning National Minimum Wage or less within each highest level of education attained category 1
Primary or below
Lower secondary
1 Note: Denominator excludes employees whose National Minimum Wage status was Not stated
Total
Higher secondary
Post secondary non-tertiary
Third level non-honours degree
Third level honours degree or above
Other/Not stated
Third level honours degree or above
Other/Not stated
Primary or below
Lower secondary
Higher secondary
Post secondary non-tertiary
Third level non-honours degree
Q4 16 Q3 17 Q4 17 Q1 18 Q2 18 Q3 18 Q4 18
Employees reporting earning National Minimum Wage or less 57.3 54.4 46.3 56.2 39.0 43.5 42.8
Employees reporting earning more than National Minimum Wage 598.0 619.0 633.3 632.4 659.2 673.4 688.4
Not stated 62.2 45.9 49.1 51.9 59.6 50.9 42.5
Total 717.5 719.3 728.6 740.5 757.8 767.7 773.7
Employees reporting earning National Minimum Wage or less 34.6 45.1 46.3 49.8 37.1 41.6 37.5
Employees reporting earning more than National Minimum Wage 318.4 376.1 382.2 365.7 379.7 384.8 392.6
Not stated 36.6 37.0 34.6 35.1 39.1 32.9 36.8
Total 389.6 458.2 463.1 450.6 455.9 459.2 466.9
Employees reporting earning National Minimum Wage or less 62.4 67.0 58.0 68.7 65.6 67.3 56.9
Employees reporting earning more than National Minimum Wage 586.4 574.7 580.7 561.7 575.0 590.8 598.6
Not stated 64.8 49.0 52.7 46.0 58.8 57.6 54.1
Total 713.6 690.7 691.4 676.4 699.4 715.7 709.5
Employees reporting earning National Minimum Wage or less 154.3 166.5 150.7 174.7 141.7 152.4 137.2
Employees reporting earning more than National Minimum Wage 1,502.7 1,569.8 1,596.2 1,559.8 1,613.8 1,648.9 1,679.6
Not stated 163.6 132.0 136.3 133.1 157.6 141.4 133.3
Total 1,820.7 1,868.3 1,883.1 1,867.5 1,913.1 1,942.7 1,950.1
Thinly-populated area
All employees
Table 15a Employees aged 15 years and over classified by degree of urbanisation and National Minimum Wage earnings status (%)
Employees classified by degree of urbanisation and National Minimum Wage status
Densely-populated area
Degree of urbanisation/National Minimum Wage status
Intermediate area
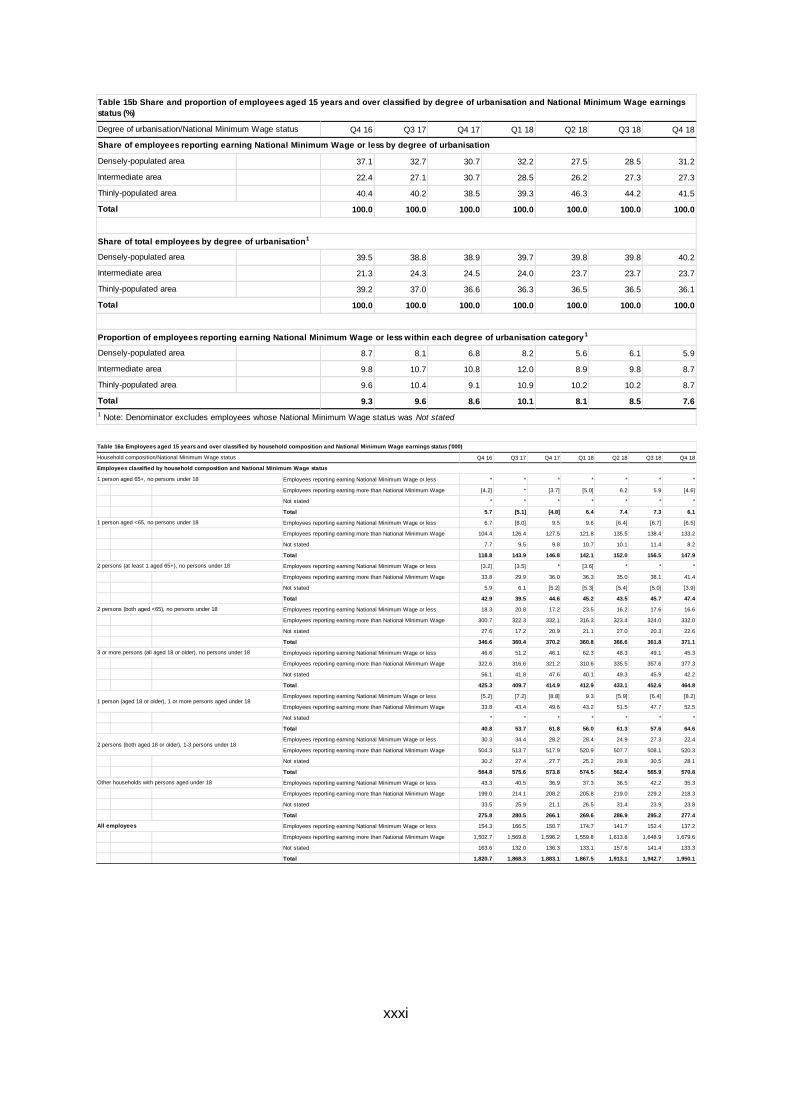
xxxi
Q4 16 Q3 17 Q4 17 Q1 18 Q2 18 Q3 18 Q4 18
37.1 32.7 30.7 32.2 27.5 28.5 31.2
22.4 27.1 30.7 28.5 26.2 27.3 27.3
40.4 40.2 38.5 39.3 46.3 44.2 41.5
100.0 100.0 100.0 100.0 100.0 100.0 100.0
39.5 38.8 38.9 39.7 39.8 39.8 40.2
21.3 24.3 24.5 24.0 23.7 23.7 23.7
39.2 37.0 36.6 36.3 36.5 36.5 36.1
100.0 100.0 100.0 100.0 100.0 100.0 100.0
8.7 8.1 6.8 8.2 5.6 6.1 5.9
9.8 10.7 10.8 12.0 8.9 9.8 8.7
9.6 10.4 9.1 10.9 10.2 10.2 8.7
9.3 9.6 8.6 10.1 8.1 8.5 7.6
1 Note: Denominator excludes employees whose National Minimum Wage status was Not stated
Total
Total
Proportion of employees reporting earning National Minimum Wage or less within each degree of urbanisation category1
Densely-populated area
Intermediate area
Thinly-populated area
Share of employees reporting earning National Minimum Wage or less by degree of urbanisation
Total
Table 15b Share and proportion of employees aged 15 years and over classified by degree of urbanisation and National Minimum Wage earnings
status (%)
Degree of urbanisation/National Minimum Wage status
Thinly-populated area
Densely-populated area
Intermediate area
Thinly-populated area
Densely-populated area
Share of total employees by degree of urbanisation1
Intermediate area
Q4 16 Q3 17 Q4 17 Q1 18 Q2 18 Q3 18 Q4 18
Employees reporting earning National Minimum Wage or less * * * * * * *
Employees reporting earning more than National Minimum Wage [4.2] * [3.7] [5.0] 6.2 5.9 [4.6]
Not stated * * * * * * *
Total 5.7 [5.1] [4.8] 6.4 7.4 7.3 6.1
Employees reporting earning National Minimum Wage or less 6.7 [8.0] 9.5 9.6 [6.4] [6.7] [6.5]
Employees reporting earning more than National Minimum Wage 104.4 126.4 127.5 121.8 135.5 138.4 133.2
Not stated 7.7 9.5 9.8 10.7 10.1 11.4 8.2
Total 118.8 143.9 146.8 142.1 152.0 156.5 147.9
Employees reporting earning National Minimum Wage or less [3.2] [3.5] * [3.6] * * *
Employees reporting earning more than National Minimum Wage 33.8 29.9 36.0 36.3 35.0 38.1 41.4
Not stated 5.9 6.1 [5.2] [5.3] [5.4] [5.0] [3.9]
Total 42.9 39.5 44.6 45.2 43.5 45.7 47.4
Employees reporting earning National Minimum Wage or less 18.3 20.8 17.2 23.5 16.2 17.6 16.6
Employees reporting earning more than National Minimum Wage 300.7 322.3 332.1 316.3 323.4 324.0 332.0
Not stated 27.6 17.2 20.9 21.1 27.0 20.3 22.6
Total 346.6 360.4 370.2 360.8 366.6 361.8 371.1
Employees reporting earning National Minimum Wage or less 46.6 51.2 46.1 62.3 48.3 49.1 45.3
Employees reporting earning more than National Minimum Wage 322.6 316.6 321.2 310.6 335.5 357.6 377.3
Not stated 56.1 41.8 47.6 40.1 49.3 45.9 42.2
Total 425.3 409.7 414.9 412.9 433.1 452.6 464.8
Employees reporting earning National Minimum Wage or less [5.2] [7.2] [8.8] 9.3 [5.9] [6.4] [8.2]
Employees reporting earning more than National Minimum Wage 33.8 43.4 49.6 43.2 51.5 47.7 52.5
Not stated * * * * * * *
Total 40.8 53.7 61.8 56.0 61.3 57.6 64.6
Employees reporting earning National Minimum Wage or less 30.3 34.4 28.2 28.4 24.9 27.3 22.4
Employees reporting earning more than National Minimum Wage 504.3 513.7 517.9 520.9 507.7 508.1 520.3
Not stated 30.2 27.4 27.7 25.2 29.8 30.5 28.1
Total 564.8 575.6 573.8 574.5 562.4 565.9 570.8
Employees reporting earning National Minimum Wage or less 43.3 40.5 36.9 37.3 36.5 42.2 35.3
Employees reporting earning more than National Minimum Wage 199.0 214.1 208.2 205.8 219.0 229.2 218.3
Not stated 33.5 25.9 21.1 26.5 31.4 23.9 23.8
Total 275.8 280.5 266.1 269.6 286.9 295.2 277.4
Employees reporting earning National Minimum Wage or less 154.3 166.5 150.7 174.7 141.7 152.4 137.2
Employees reporting earning more than National Minimum Wage 1,502.7 1,569.8 1,596.2 1,559.8 1,613.8 1,648.9 1,679.6
Not stated 163.6 132.0 136.3 133.1 157.6 141.4 133.3
Total 1,820.7 1,868.3 1,883.1 1,867.5 1,913.1 1,942.7 1,950.1
Household composition/National Minimum Wage status
Table 16a Employees aged 15 years and over classified by household composition and National Minimum Wage earnings status ('000)
Employees classified by household composition and National Minimum Wage status
1 person aged 65+, no persons under 18
1 person aged <65, no persons under 18
Other households with persons aged under 18
All employees
2 persons (at least 1 aged 65+), no persons under 18
3 or more persons (all aged 18 or older), no persons under 18
2 persons (both aged <65), no persons under 18
1 person (aged 18 or older), 1 or more persons aged under 18
2 persons (both aged 18 or older), 1-3 persons under 18
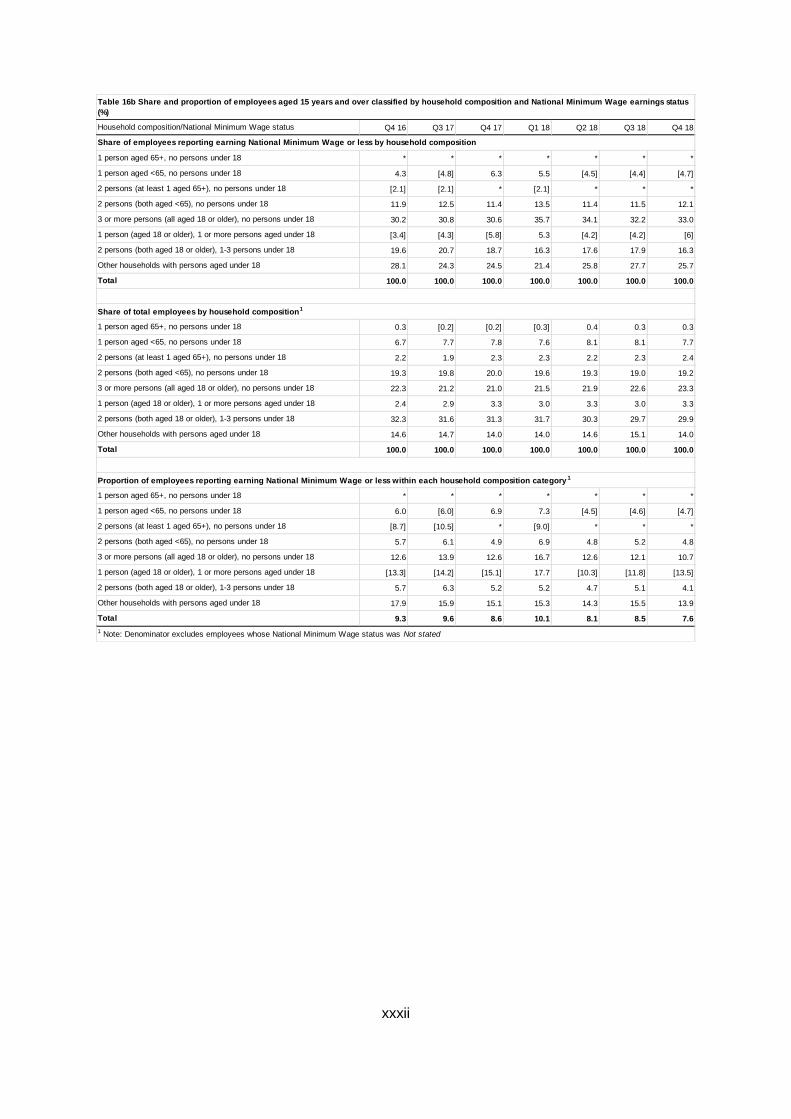
xxxii
Q4 16 Q3 17 Q4 17 Q1 18 Q2 18 Q3 18 Q4 18
* * * * * * *
4.3 [4.8] 6.3 5.5 [4.5] [4.4] [4.7]
[2.1] [2.1] * [2.1] * * *
11.9 12.5 11.4 13.5 11.4 11.5 12.1
30.2 30.8 30.6 35.7 34.1 32.2 33.0
[3.4] [4.3] [5.8] 5.3 [4.2] [4.2] [6]
19.6 20.7 18.7 16.3 17.6 17.9 16.3
28.1 24.3 24.5 21.4 25.8 27.7 25.7
100.0 100.0 100.0 100.0 100.0 100.0 100.0
0.3 [0.2] [0.2] [0.3] 0.4 0.3 0.3
6.7 7.7 7.8 7.6 8.1 8.1 7.7
2.2 1.9 2.3 2.3 2.2 2.3 2.4
19.3 19.8 20.0 19.6 19.3 19.0 19.2
22.3 21.2 21.0 21.5 21.9 22.6 23.3
2.4 2.9 3.3 3.0 3.3 3.0 3.3
32.3 31.6 31.3 31.7 30.3 29.7 29.9
14.6 14.7 14.0 14.0 14.6 15.1 14.0
100.0 100.0 100.0 100.0 100.0 100.0 100.0
* * * * * * *
6.0 [6.0] 6.9 7.3 [4.5] [4.6] [4.7]
[8.7] [10.5] * [9.0] * * *
5.7 6.1 4.9 6.9 4.8 5.2 4.8
12.6 13.9 12.6 16.7 12.6 12.1 10.7
[13.3] [14.2] [15.1] 17.7 [10.3] [11.8] [13.5]
5.7 6.3 5.2 5.2 4.7 5.1 4.1
17.9 15.9 15.1 15.3 14.3 15.5 13.9
9.3 9.6 8.6 10.1 8.1 8.5 7.6
1 person (aged 18 or older), 1 or more persons aged under 18
1 person aged 65+, no persons under 18
3 or more persons (all aged 18 or older), no persons under 18
Table 16b Share and proportion of employees aged 15 years and over classified by household composition and National Minimum Wage earnings status
(%)
Total
1 person aged 65+, no persons under 18
1 person aged <65, no persons under 18
2 persons (at least 1 aged 65+), no persons under 18
2 persons (both aged <65), no persons under 18
3 or more persons (all aged 18 or older), no persons under 18
1 person (aged 18 or older), 1 or more persons aged under 18
1 person aged <65, no persons under 18
2 persons (at least 1 aged 65+), no persons under 18
2 persons (both aged <65), no persons under 18
Household composition/National Minimum Wage status
1 Note: Denominator excludes employees whose National Minimum Wage status was Not stated
Total
2 persons (both aged 18 or older), 1-3 persons under 18
Other households with persons aged under 18
1 person (aged 18 or older), 1 or more persons aged under 18
2 persons (at least 1 aged 65+), no persons under 18
2 persons (both aged <65), no persons under 18
3 or more persons (all aged 18 or older), no persons under 18
Proportion of employees reporting earning National Minimum Wage or less within each household composition category 1
Total
1 person aged 65+, no persons under 18
1 person aged <65, no persons under 18
2 persons (both aged 18 or older), 1-3 persons under 18
Other households with persons aged under 18
Share of total employees by household composition1
Share of employees reporting earning National Minimum Wage or less by household composition
2 persons (both aged 18 or older), 1-3 persons under 18
Other households with persons aged under 18
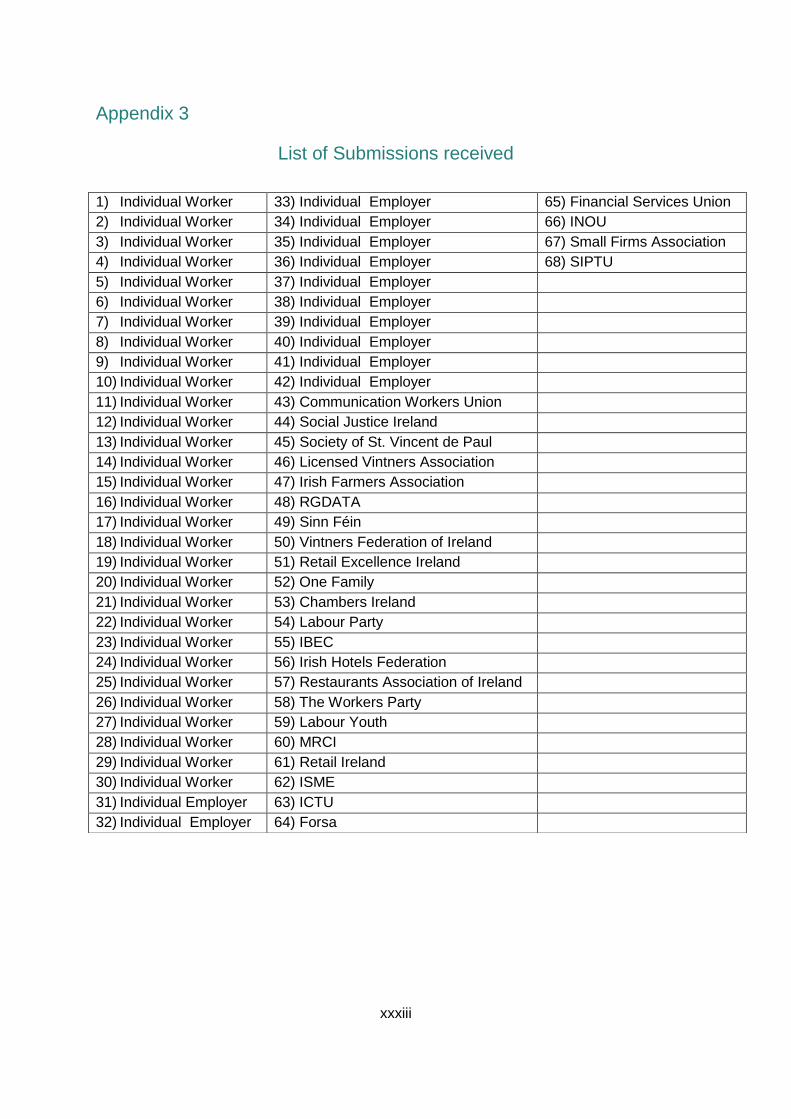
xxxiii
Appendix 3
List of Submissions received
1) Individual Worker 33) Individual Employer 65) Financial Services Union
2) Individual Worker 34) Individual Employer 66) INOU
3) Individual Worker 35) Individual Employer 67) Small Firms Association
4) Individual Worker 36) Individual Employer 68) SIPTU
5) Individual Worker 37) Individual Employer
6) Individual Worker 38) Individual Employer
7) Individual Worker 39) Individual Employer
8) Individual Worker 40) Individual Employer
9) Individual Worker 41) Individual Employer
10) Individual Worker 42) Individual Employer
11) Individual Worker 43) Communication Workers Union
12) Individual Worker 44) Social Justice Ireland
13) Individual Worker 45) Society of St. Vincent de Paul
14) Individual Worker 46) Licensed Vintners Association
15) Individual Worker 47) Irish Farmers Association
16) Individual Worker 48) RGDATA
17) Individual Worker 49) Sinn Féin
18) Individual Worker 50) Vintners Federation of Ireland
19) Individual Worker 51) Retail Excellence Ireland
20) Individual Worker 52) One Family
21) Individual Worker 53) Chambers Ireland
22) Individual Worker 54) Labour Party
23) Individual Worker 55) IBEC
24) Individual Worker 56) Irish Hotels Federation
25) Individual Worker 57) Restaurants Association of Ireland
26) Individual Worker 58) The Workers Party
27) Individual Worker 59) Labour Youth
28) Individual Worker 60) MRCI
29) Individual Worker 61) Retail Ireland
30) Individual Worker 62) ISME
31) Individual Employer 63) ICTU
32) Individual Employer 64) Forsa
xxxiv
Appendix 4
Calculation of Minimum Wage
Under Section 20 of the National Minimum Wage Act 2000 the basic method of calculation
for hourly pay is to divide the gross pay by the total number of hours worked.
There are a number of items that are not to be included in the minimum wage calculation,
such as overtime premium, call-out premium, service pay, unsocial hours premium, tips
(other than service charges distributed through the payroll which are reckonable as income),
premiums for working public holidays, Saturdays or Sundays, allowances for special or
additional duties, on-call or standby allowances, certain payments in relation to absences
from work, for example, sick pay, holiday pay or pay during health and safety leave, payment
connected with leaving the employment including retirement, contributions paid by the
employer into any occupational pension scheme, redundancy payments, payment in kind or
benefit in kind, other than board and/or lodgings, and compensation for injury or loss of tools.
For the purposes of the national minimum wage the gross wage includes the basic salary
and any shift premium, bonus or service charge. If one receives food (known as board)
and/or accommodation (known as lodgings) from an employer, this is taken into account in
the minimum wage calculation. The Commission recommended moving from weekly/daily
rates for board to an hourly rate as it is administratively simpler for employers and is of
benefit to some employees. Prior to the Commission’s recommendations the allowances
provided for board and lodgings had remained unchanged since their introduction in 2000.
The Government subsequently decided to increase the board and lodgings rates in line in
percentage terms with the increase in the NMW.
An individual’s working hours are whichever is the greater: the hours set out in any
document such as a contract of employment, collective agreement or statement of terms of
employment provided under the Terms of Employment (Information) Act 1994, or the actual
hours worked or available for work and paid. “Working hours” include: overtime, travel time
where this is part of the job, time spent on training authorised by the employer and during
normal working hours.
“Working hours” does not include: time spent on standby other than at the workplace, time
on leave, lay-off, strike or after payment in lieu of notice, time spent travelling to or from
work. The employer selects the period, known as the pay reference period, from which the
average hourly pay will be calculated. This might be, for example, on a weekly or fortnightly
basis, but cannot be for a period longer than a month.
xxxv
Appendix 5
Selected in-work income supports provided by the Department of Employment Affairs and Social Protection Jobseeker’s Allowance
Jobseeker’s Allowance (JA) is a social assistance scheme. To qualify, a claimant must be unemployed, capable of work, available for and genuinely seeking full-time work, satisfy the means test and meet the habitual residence condition. Reduced rates are generally payable to jobseekers under the age of 26.
Jobseeker’s Allowance is means-tested payment. The means test for earnings includes an incentive to take up work as there is a daily disregard (€20 per day for a maximum of three days) and a taper provided (whereby earnings above the disregard are assessed at 60%).
The budget allocation for the Jobseeker’s Allowance scheme is €1.837 billion in 2018.
Jobseeker’s Benefit
Jobseeker's Benefit (JB) is a weekly payment to insured people who are out of work. It is a non-means tested payment and it is paid at the same rate as the JA scheme. Reduced rates for those aged under 26 do not apply to the JB scheme.
To qualify a claimant must be unemployed, be available for and genuinely seeking work, and have had a substantial loss of employment.
Recipients can work up to three days a week and still qualify for the payment. In these cases, the weekly payment of Jobseeker’s Benefit is reduced by a daily rate (one-fifth of the weekly rate) for each day worked (up to a maximum of three days).
The budget allocation for the Jobseeker’s Benefit scheme is €331.7 million in 2018.
The CSO’s most recent Live Register publication (January 2018) reports that over 39,683 persons on the Live Register (i.e. in receipt of Jobseeker’s Allowance, Jobseeker’s Benefit or signing for credits) were working on a casual or part-time basis.
Back To Work Family Dividend
The Back to Work Family Dividend (BTWFD) scheme was introduced in January 2015. It allows JA/JB recipients who have been jobseekers for 12 months or recipients of the One-Parent Family Payment to retain their full Increase for Qualified Children (IQC) for the first year in employment, tapering to 50% in the second year. From March 2019. BTWFD is paid at the rate of €34.00 for a child aged under 12 or €37.00 for a child aged 12 and over. If you were getting a half-rate IQC with your

xxxvi
payment you will get a standard rate BTWFD. There is a ceiling of €148 per week (4 children).
The budget allocation for the BTFWD scheme is 20.7 million in 2018.
Working Family Payment (formerly Family Income Supplement)
Working Family Payment provides support for employees with families who have low earnings in relation to their family size. The payment is provided tax-free and is paid weekly.
Payment is calculated on the basis of 60% of the difference between the income limit for the family size and the weekly family income of the person(s) raising the children. Earnings are assessed net of tax, PRSI and superannuation payments. The income limits are outlined in the table below.
To qualify for payment, a person must be engaged in full-time paid employment as an employee which is expected to last for at least 3 months and be working for a minimum of 38 hours per fortnight or 19 hours per week. A couple may combine their hours of employment to meet the qualification criteria. The applicant must also have at least one qualified child.
An integral part of the scheme is that once the level of payment is determined, that rate continues to be payable for a period of 52 weeks, provided that the person remains in full-time employment. The exceptions to this rule are where there is an additional child born to the family during that period or following the termination of One-Parent Family Payment due to the age of the youngest child.
The estimated expenditure for the Working Family Payment scheme in 2018 is around €431.3 million. As of April 2019, WFP it is paid to over 53,327 families in respect of more than 120,142 children.
Table: Working Family Payment weekly family income thresholds, 2008 to 2019
2008 2009 2010 - 2015 2016 2017 2018 2019
1 Child €490 €500 €506 €511 €511 €521 €521
2 Children €570 €590 €602 €612 €612 €622 €622
3 Children €655 €685 €703 €713 €713 €723 €723
4 Children €760 €800 €824 €834 €834 €834 €834
5 Children €870 €920 €950 €960 €960 €960 €960
6 Children €970 €1,030 €,1066 €1,076 €1,076 €1,076 €1,076
7 Children €1,090 €1,160 €1,202 €1,212 €1,212 €1,212 €1,212
8 + Children €1,170 €1,250 €1,298 €1,308 €1,308 €1,308 €1,308

xxxvii
Appendix 6
Membership of Low Pay Commission/Economic and Social Research
Institute Research (ESRI) Partnership Steering Committee
Steering Group
Chair Mary Mosse (LPC)
Members Seamus McGuinness (ESRI)
Frank Walsh (LPC)
Edel Flannery (CSO)
Helen Russell (ESRI)
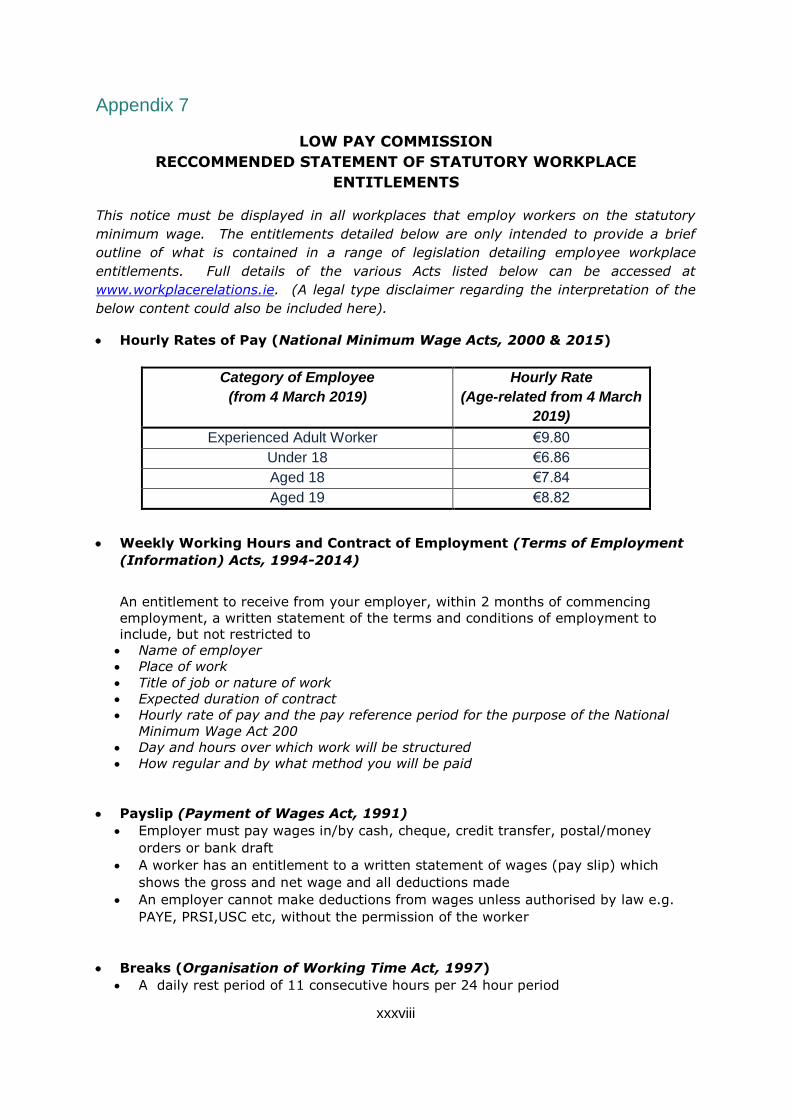
xxxviii
Appendix 7
LOW PAY COMMISSION
RECCOMMENDED STATEMENT OF STATUTORY WORKPLACE
ENTITLEMENTS
This notice must be displayed in all workplaces that employ workers on the statutory
minimum wage. The entitlements detailed below are only intended to provide a brief
outline of what is contained in a range of legislation detailing employee workplace
entitlements. Full details of the various Acts listed below can be accessed at
www.workplacerelations.ie. (A legal type disclaimer regarding the interpretation of the
below content could also be included here).
Hourly Rates of Pay (National Minimum Wage Acts, 2000 & 2015)
Category of Employee
(from 4 March 2019)
Hourly Rate
(Age-related from 4 March
2019)
Experienced Adult Worker €9.80
Under 18 €6.86
Aged 18 €7.84
Aged 19 €8.82
Weekly Working Hours and Contract of Employment (Terms of Employment
(Information) Acts, 1994-2014)
An entitlement to receive from your employer, within 2 months of commencing
employment, a written statement of the terms and conditions of employment to
include, but not restricted to
Name of employer
Place of work
Title of job or nature of work
Expected duration of contract
Hourly rate of pay and the pay reference period for the purpose of the National
Minimum Wage Act 200
Day and hours over which work will be structured
How regular and by what method you will be paid
Payslip (Payment of Wages Act, 1991)
Employer must pay wages in/by cash, cheque, credit transfer, postal/money
orders or bank draft
A worker has an entitlement to a written statement of wages (pay slip) which
shows the gross and net wage and all deductions made
An employer cannot make deductions from wages unless authorised by law e.g.
PAYE, PRSI,USC etc, without the permission of the worker
Breaks (Organisation of Working Time Act, 1997)
A daily rest period of 11 consecutive hours per 24 hour period

xxxix
One period of 24 hours rest per week preceded by the 11 hours daily period
Daily breaks of 15 mins where more than 4.5 hours have been worked, 30 mins
where more than 6 hours have been worked which may include the first break
Shop employees who work more than 6 hours daily that include the hours
between 11.30am and 2.30pm must be allowed a break of 1 hour which must
commence between the hours of 11am and 2.30pm
Annual Leave (Organisation of Working Time Act, 1997)
Holiday pay is earned against time worked in accordance with the following
calculations
4 working weeks in which the employee works at least 1,365 hours unless it is a
leave year in which the employee changes employment
One third of a working week per calendar month that the employee works at least
117 hours
8% of the hours an employee works in a leave year but subject to a maximum of
4 working weeks
Payment for annual leave must be made in advance of the leave been taken
Public Holiday Leave (Organisation of Working Time Act, 1997)
All employees are entitled to nine public holidays which are listed in the full Act
In respect of full time employees there is no service requirement
Part time employees must work at least 40 hours during the 5 weeks ending on
the day before a public holiday to qualify for the public holiday
In respect if each public holiday an employee is entitled to one of the following as
the employer may decide
A paid day off on the holiday
A paid day off within a month
An extra day’s annual leave
An extra days pay
If the public holiday falls on a day on which the employee normally works they
are entitled to one of the above entitlements
If the public holiday falls on a day on which the employee does not normally work
they are entitled to one fifth of the normal weekly wage for the day
Protection Against Zero Hours (Organisation of Working Time Act, 1997)
In the event of work not being made available employees are entitled to be paid 25% of
the time which they are required to be available.
Job Information e.g. Employer, Hours etc. (Employment Miscellaneous
Provisions Act 2018)
Bans zero-hour contracts in most situations and
Provides for minimum payments and banded hours
States that employers must provide employees with information on the 5 core
terms of employment within 5 days of them starting work
Additional statutory employment rights are contained in the following pieces of
legislation and more details of same can be accessed at
www.workplacerelations.ie.
Equal Treatment (Protection of Employees (Part-Time Work) Act, 2001)
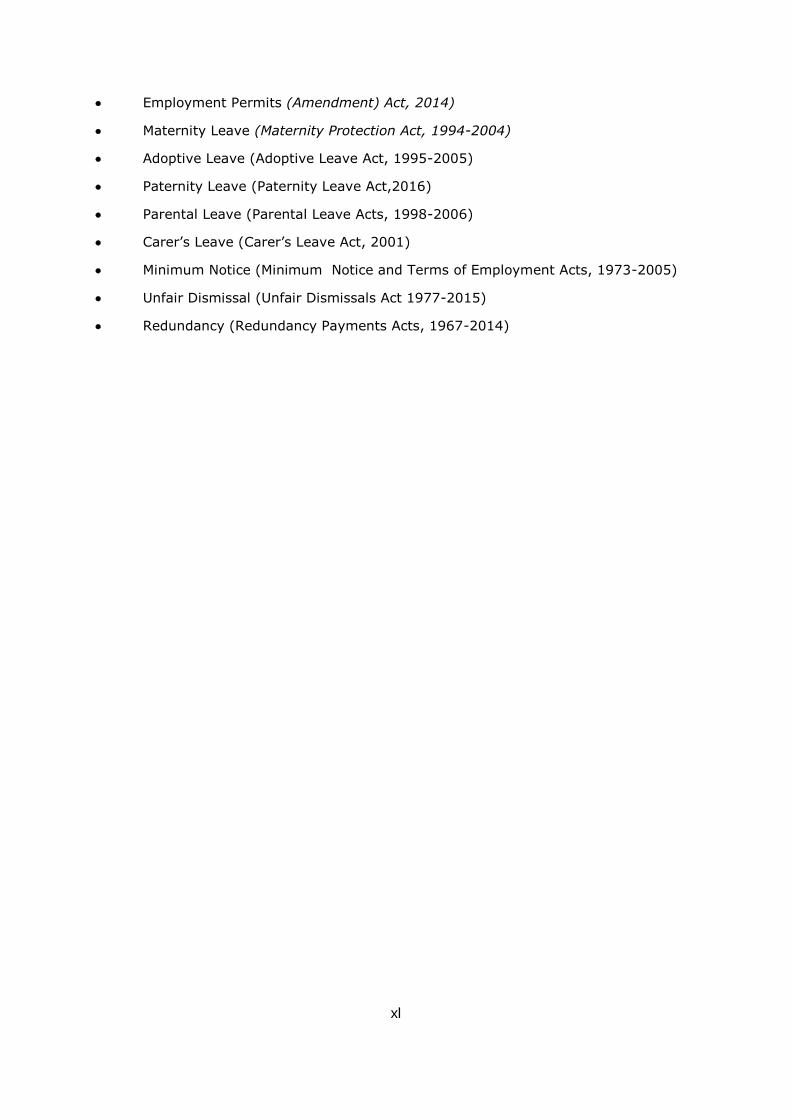
xl
Employment Permits (Amendment) Act, 2014)
Maternity Leave (Maternity Protection Act, 1994-2004)
Adoptive Leave (Adoptive Leave Act, 1995-2005)
Paternity Leave (Paternity Leave Act,2016)
Parental Leave (Parental Leave Acts, 1998-2006)
Carer’s Leave (Carer’s Leave Act, 2001)
Minimum Notice (Minimum Notice and Terms of Employment Acts, 1973-2005)
Unfair Dismissal (Unfair Dismissals Act 1977-2015)
Redundancy (Redundancy Payments Acts, 1967-2014)

xli
Appendix 8
How was the level of the minimum wage determined and brought into effect (1 Jan
2018)
Social
Partners
Only trade
union
Only
employers
Belgium R+I
France R+U I
Germany R V
Ireland R R
Luxembourg I+R
Netherlands I
United Kingdom R
Greece U
Malta R I
Portugal R+U
Slovenia R+U
Spain R V
Bulgaria R+U V V
Croatia R
Czech Republ ic R+U
Estonia R V
Hungary R V V V
Latvia R V
Li thuania R V
Poland R+U
Romania R+U
Slovakia R+U
I
R
U
V
Country
Provided a non-binding recommendation
Involvement of this actor was unusual
Appl ied indexation mechanism to determining minimum wage level
Decided the fina l level taking into account recommendations of other
players or mechanisms (e.g. indexation)
Decided the fina l level uni latera l ly
Reached consensus on the level of the minimum wage
Hig
hM
idLo
w
Was not involved at a l l in this respective year
Brought the fina l level into effect
Was consulted about the level
Outside Tripartite or Expert
Committee
Tripartite
Expert
CommitteeGovernment
xlii
Bibliography
Central Bank of Ireland (2019), Central Bank Quarterly Bulletin No.2, April 2019. Dublin.
Central Statistics Office (2017), Survey of Income and Living Conditions 2017, Dublin.
Central Statistics Office (2019), Earnings and Labour Costs Quarterly, Dublin.
Central Statistics Office (2019), Labour Force Survey, Dublin.
Central Statistics Office (2019), Overseas Travel, Dublin.
Central Statistics Office (2019), Consumer Price Index, Dublin.
Central Statistics Office (2017), LFS National Minimum Wage Estimates Q1-Q4 2018,
Dublin.
Central Statistics Office (2017) National Income and Expenditure 2017, Dublin
Bargain, O., Doorley, K. and Van Kerm, P. (2018), Minimum Wages and the Gender Gap in
Pay: New Evidence from the United Kingdom and Ireland. Review of Income and Wealth.
Eurofound (2019), Aumayr-Pintar, Christine;Rasche, Matthias; Vacas‑Soriano, Carlos,
Minimum Wages in 2019, Dublin
ESRI (2018) ‘Estimating the effect of an increase in the minimum wage on hours worked and
employment in Ireland’, Dublin
ESRI (2019) ‘The impact of a change in the National Minimum Wage on the distribution of
hourly wages and household income in Ireland’, Dublin.
ESRI (2018) An examination of the labour market transitions of minimum wage workers’, Dublin. Deloitte (2018) Insolvency Statistics Q4 2018. Dublin
Department of Finance (2019), Summer Economic Statement, Dublin
Department of Finance (2019), Stability Programme Update 2019 - April 2019 , Dublin.
Department of Finance (2019) Fiscal Monitor (incorporating the Exchequer Statement) May
2019, Dublin.
Department of Finance (2018) Productivity Chartpack 2018 , Dublin.
Economics Statistics Review Group (2016) Report of Economics Statistics Review Group,
Dublin.
ESRI and KBC Bank (2019) Consumer Sentiment Index, March 2019,
European Commission (2018) DG Taxation and Customs Union. Taxation Trends in the
European Union 2018 edition, Luxembourg.

xliii
European Commission (2019) Economic Forecast. Spring 2019, Luxembourg IBEC (2019), Economic Outlook Q2 2019, Dublin
International Labour Organisation (2013) Global Wage Report 2012/13
International Monetary Fund (2019) World Economic Outlook Washington, DC, Nevin Economic Research Institute (2019), Quarterly Economic Observer, Spring 2019,
Dublin.
National Competitiveness Council (2018) Competitiveness Rankings 2018, Dublin.
National Competitiveness Council (2018) Cost of Doing Business in Ireland 2018, Dublin.
National Competitiveness Council (2017) Ireland’s Competitiveness Scorecard 2017, Dublin.
OECD (2015), OECD Employment Outlook 2015. Paris: OECD Publishing.
OECD(2019) Economic Outlook Volume 2019 Issue 1: Preliminary Version
OECD (2019) Taxing Wages, Paris.
OECD (2015) Minimum wages after the crisis: Making them pay, Paris
OECD (2018) The OECD Jobs Strategy, Paris
OECD iLibrary Database on Earning
Paul Sweeney (2013) An Inquiry into the Declining Labour Share of National Income and the
Consequences for Economies and Societies, Journal of the Statistical and Social Inquiry
Society of Ireland
SOLAS Skills Bulletin 2018, Dublin
United Kingdom Low Pay Commission (2016), National Minimum Wage: LPC Report,
Spring 2016.
Workplace Relations Commission (2019), Annual Report, 2018, Dublin.
World Economic Forum (2018) The Global Competitiveness Report 2018, Geneva.