Embed Size (px)
Citation preview
Rec. ITU-R SA.1628 1
RECOMMENDATION ITU-R SA.1628∗
Feasibility of sharing in the band 35.5-36 GHZ between the Earth exploration-satellite service (active) and space
research service (active), and other services allocated in this band (Question ITU-R 233/7)
(2003)
The ITU Radiocommunication Assembly,
considering
a) that the frequency band 35.5-36 GHz is allocated to the Earth exploration-satellite service (EESS) (active) and space research service (SRS) (active) on a primary basis with No. 5.551A of the Radio Regulations (RR);
b) that the 35.5-36.0 GHz band is also allocated to the meteorological aids service and radiolocation service on a primary basis;
c) that ITU-R studies have shown that sharing of the 35.5-36 GHz band is feasible between terrestrial radars and precipitation radars, spaceborne radar altimeters and scatterometers, as shown in Annex 1;
d) that ITU-R studies have shown that stations from the fixed service allocated by RR No. 5.549 in the 35.5-36 GHz band are protected from emissions from EESS precipitation radars as shown in Annex 2;
e) that a bandwidth of up to 500 MHz is needed for the wideband altimeter to precisely measure altitude,
recommends
1 that in order to ensure compatibility between radiolocation service and EESS (active) and SRS (active), the mean pfd at the Earth's surface from the spaceborne active sensor generated at any angle greater than 0.8º from the beam centre should not exceed −73.3 dB(W/m2) in any 2 GHz band;
2 that compatibility with the fixed service is assured without any additional constraints on the EESS (active) as shown in Annex 2.
∗ This Recommendation should be brought to the attention of Radiocommunication Study Groups 8 and 9.
2 Rec. ITU-R SA.1628
Annex 1
Compatibility of spaceborne active sensors with radiolocation systems operating in the 35.5-36 GHz band
1 Introduction
The frequency band 35.5-36 GHz is allocated to the EESS (active), space research (active), radiolocation and meteorological aids services on a primary basis. Although the 35.5-36 GHz band is allocated for meteorological aids, there is no known use of the band by this service.
ITU-R studies have shown that sharing between spaceborne active sensors and radiolocation systems in the band 35.5-36 GHz is feasible. This Recommendation presents the results of simulations to evaluate the levels of potential interference between spaceborne active sensors and radiolocation stations in the 35.5-36 GHz band.
2 Approach
2.1 Overview
A dynamic interference model was developed using a commercial interference simulation tool. Interference statistics were collected for interference from spaceborne active sensors into radiolocation systems and from radiolocation systems into spaceborne active sensors.
2.2 Spaceborne active sensor models
Table 1 lists the parameters of the spaceborne active sensors included in the simulations. These sensors include altimeters and precipitation radars that are planned to be implemented in constellations of three to nine satellites.
For the purposes of these simulations, a Walker delta pattern was assumed for each active sensor constellation with the parameters listed in Table 1.
In the absence of specific antenna side-lobe patterns for any of the active sensors, the antenna beam for each sensor was modelled using a parabolic antenna beam with a peak gain and 3 dB beamwidth as specified in Table 1. The antenna side-lobe patterns were modelled by a capped Bessel function which simulated an envelope of the antenna side-lobe peaks calculated for the standard circular aperture model using the following formula:
2
12
)θsin(λ
π
)θsin(λ
π2
λ
πη)θ(
⋅
⋅
⋅=D
DJ
DG
A gain floor was set at –10 dBi for each antenna pattern.
Rec. ITU-R SA.1628 3
TABLE 1
Spaceborne active sensor model characteristics
2.3 Radiolocation models
This analysis modelled two radiometric imaging radar station types, two instrumentation radar (metric) station types and one seeker radar station type. The characteristics of these modelled systems are provided in Table 2.
In the absence of a reference antenna pattern for radiolocation stations in this band, the same capped Bessel function pattern and –10 dBi gain floor was used for the radiolocation stations as was used with the spaceborne active sensors. For the cases where the antenna beam was elliptical (e.g. the imager systems), the capped Bessel function was ellipticized to achieve the desired beamwidths across the principal axes of the beam.
Type of sensor Altimeter Precipitation radar
System name O-AltiKa O + P-AltiKa TRMM follow-on/GPM PR-2 O ++++ P-
AltiKa
Altitude (km) 800 650 400 750 650
Inclinaison 98.6 98.0 70.0 70.0 98.0
Number of satellites 3 8 9 9 8
Number of planes 3 4 3 3 3 3 4
Satellites per plane 1 2 3 3 3 3 2
Delta longitude 120 90 120 120 120 120 90
Inter-plane phasing 120 45 36 36 36 36 45
Antenna pointing Nadir Nadir ±37° azimuth sweep at 250°/s
Nadir ±28° azimuth sweep at 250°/s
Nadir Nadir
Peak gain (dBi) 48.90 54.30 55.00 55.00 57.00 57.00 54.30
3 dB beamwidth (degrees) 0.78 0.42 0.50 0.50 0.50 0.50 0.42
Bandwidth (MHz) 480.00 480.00 5.30 5.30 5.30 5.30 4.40
Peak power (W) 2.0 2.0 200.0 200.0 200.0 200.0 2.0
Duty cycle (%) 42.2 42.2 10.9 20.0 10.9 20.0 27.0
Average power (dBW) −0.73 −0.73 13.39 16.02 13.39 16.02 −2.68
4 Rec. ITU-R SA.1628
TABLE 2
Characteristics of radiolocation systems in the 35.5-36 GHz band
2.4 Interference model
A simulation model was developed to calculate the cumulative distribution function (CDF) of the interfering power levels produced by spaceborne active sensors interfering with radiolocation stations on Earth, and the interfering power levels produced by ground-based radiolocation stations interfering with spaceborne active sensors.
Interference statistics were also collected during each simulation run, including the worst-case interference power, the percentage of time the interference power exceeded the specified interference criteria, and the duration of the longest interference event exceeding the specified interference criteria.
Radiolocation system type Parameter
Imager 1 Imager 2 Metric 1 Metric 2 Seeker
Sensor type Passive Active Active Active Active
Modulation – Pulse Pulse Pulse Linear
frequency modulation
Compression ratio – – – – 200
Pulse width (µs) 0.05 0.25 0.05 10
Tx peak power (kW) – 0.5 135 1 0.001
Pulse repetition frequency (kHz)
– 30 1 50 10
RF bandwidth – 80 10 101 12
Antenna gain 35 dBi 30 52 51 28.7
Beamwidth (degrees) 0.5 × 3.0 0.75 × 10 0.25 × 0.25 0.5 × 0.5 4.4 × 4.4
Rx IF bandwidth (MHz) 2 GHz 40 6 185 100
Noise temperature (K) 850 – – – –
Noise figure (dB) – 4,5 10 10 5
Rx sensitivity (dBm) – –81 –95 –78 –93
Tuning Fixed Fixed Fixed Frequency
hop Fixed
Rec. ITU-R SA.1628 5
The interference power level I (dBW) was calculated using the following equation:
( ) atmrtt LOTRGRfGPI −++⋅+−++= )log(2044.32)ηlog(10log10
where:
Pt : interferer transmitter power (W)
η : interferer duty cycle (i.e. pulse duration times pulse repetition rate)
Gt : interferer antenna gain in direction of victim station (dBi)
f : victim station receive frequency (MHz)
R : slant range between interferer and victim station (km)
Gr : victim station antenna gain in direction of interferer (dBi)
OTR : receiver on-tune rejection (dB) = 10 log(Br / Bt) for Br < Bt, 0 otherwise, where Bt is the bandwidth of the transmitter and Br is the bandwidth of the receiver
Latm: atmospheric absorption loss (dB).
A value of 0 dB was used for the OTR, in all of the simulations reported in this Recommendation. Attenuation due to atmospheric absorption (dry air and water vapour), Latm, is dependent upon the path length to the satellite through the Earth's atmosphere, and hence upon the elevation angle from the terrestrial radar to the satellite. The simulation program calculated the value for this atmospheric absorption loss based on Recommendation ITU-R P.676. All calculations were performed on the basis of co-channel operations at 35.75 GHz.
3 Interference analysis
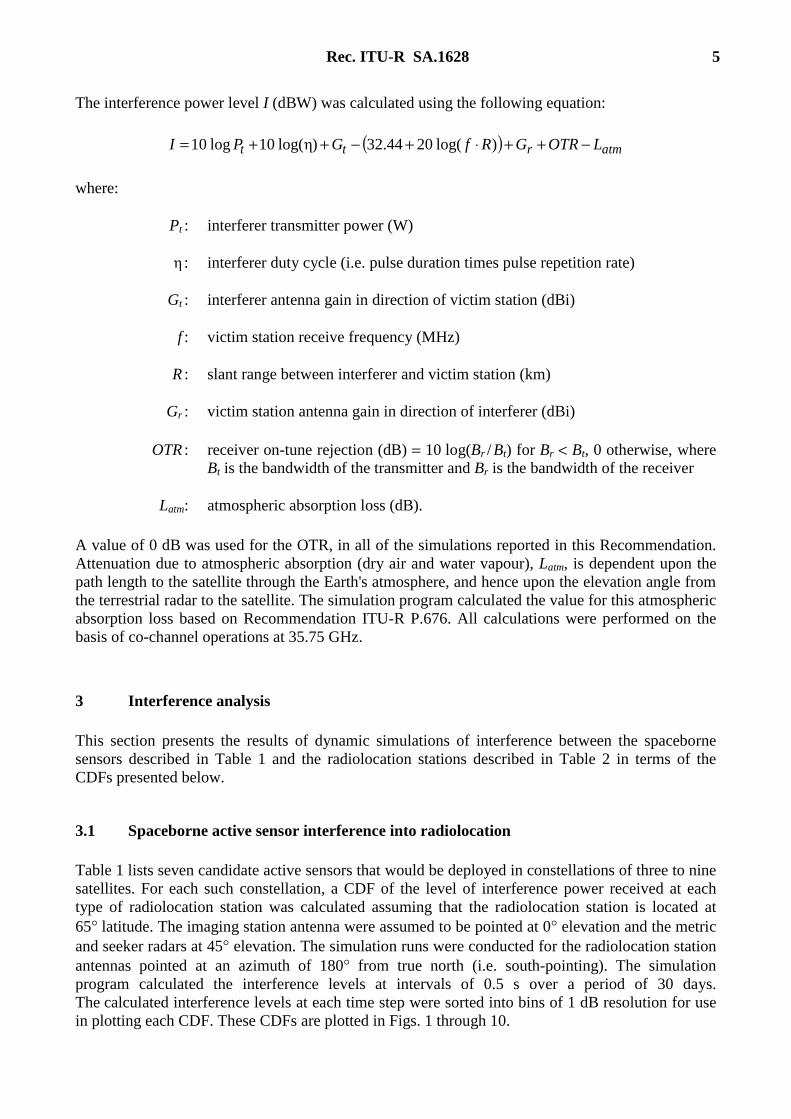
This section presents the results of dynamic simulations of interference between the spaceborne sensors described in Table 1 and the radiolocation stations described in Table 2 in terms of the CDFs presented below.
3.1 Spaceborne active sensor interference into radiolocation
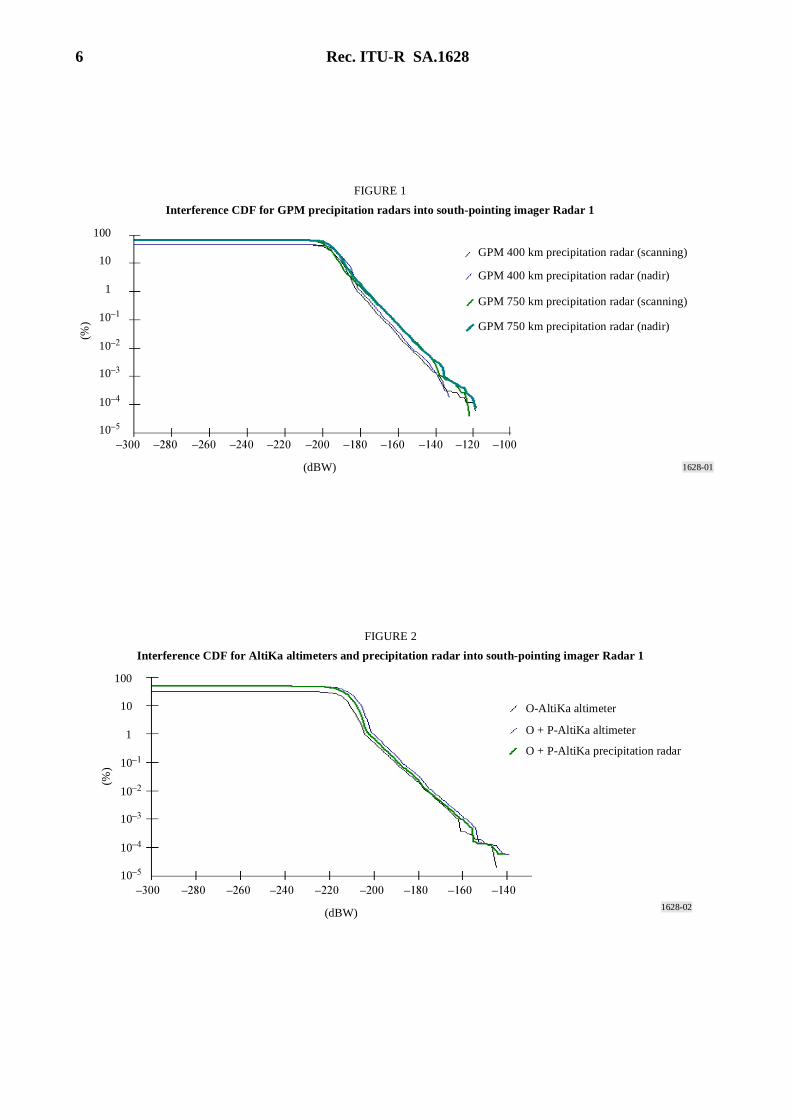
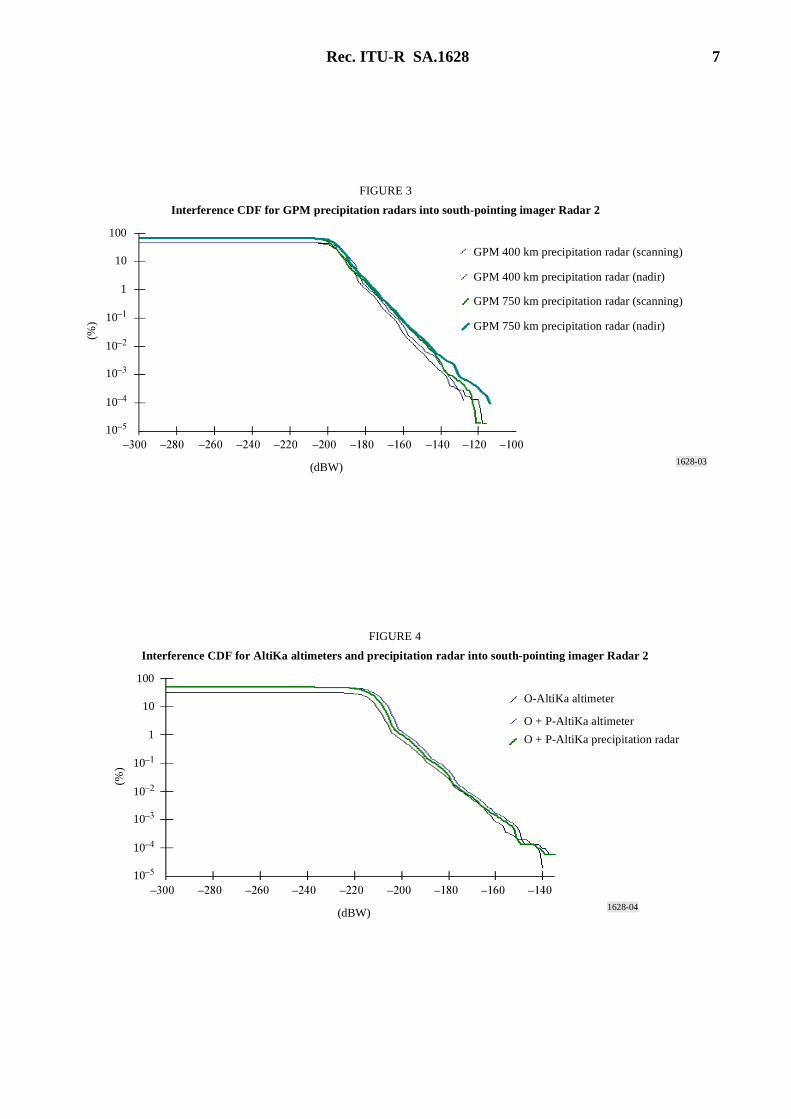
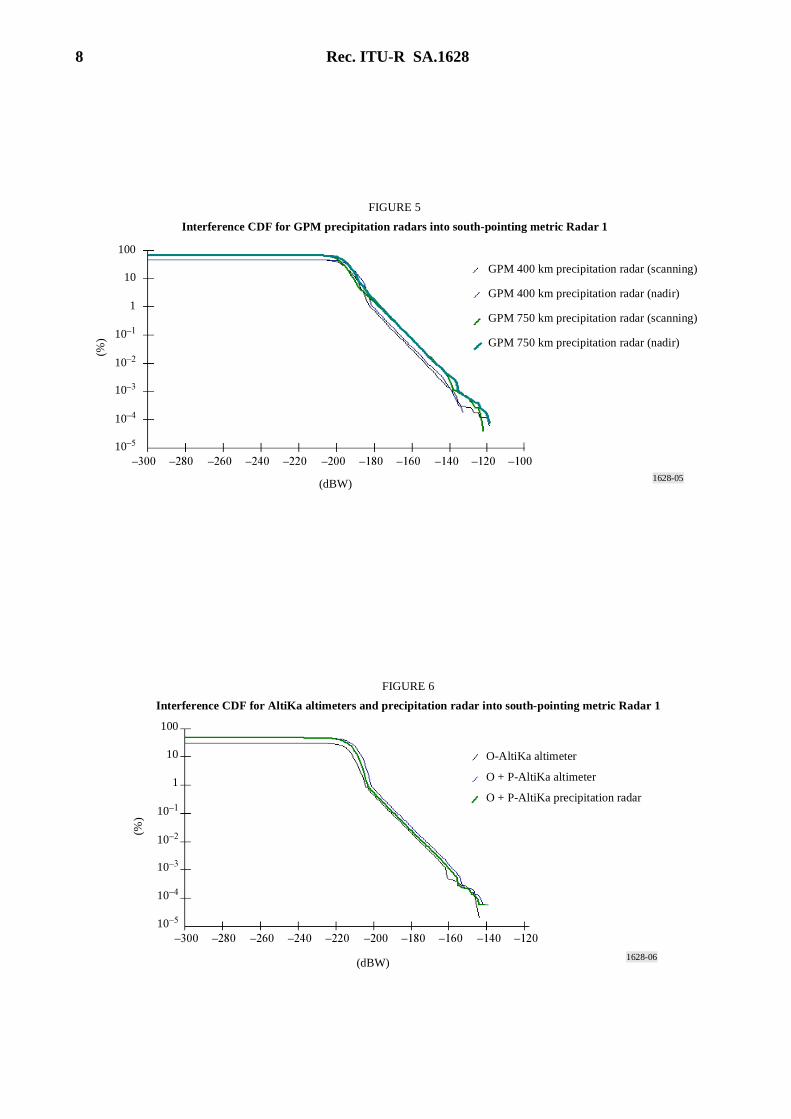
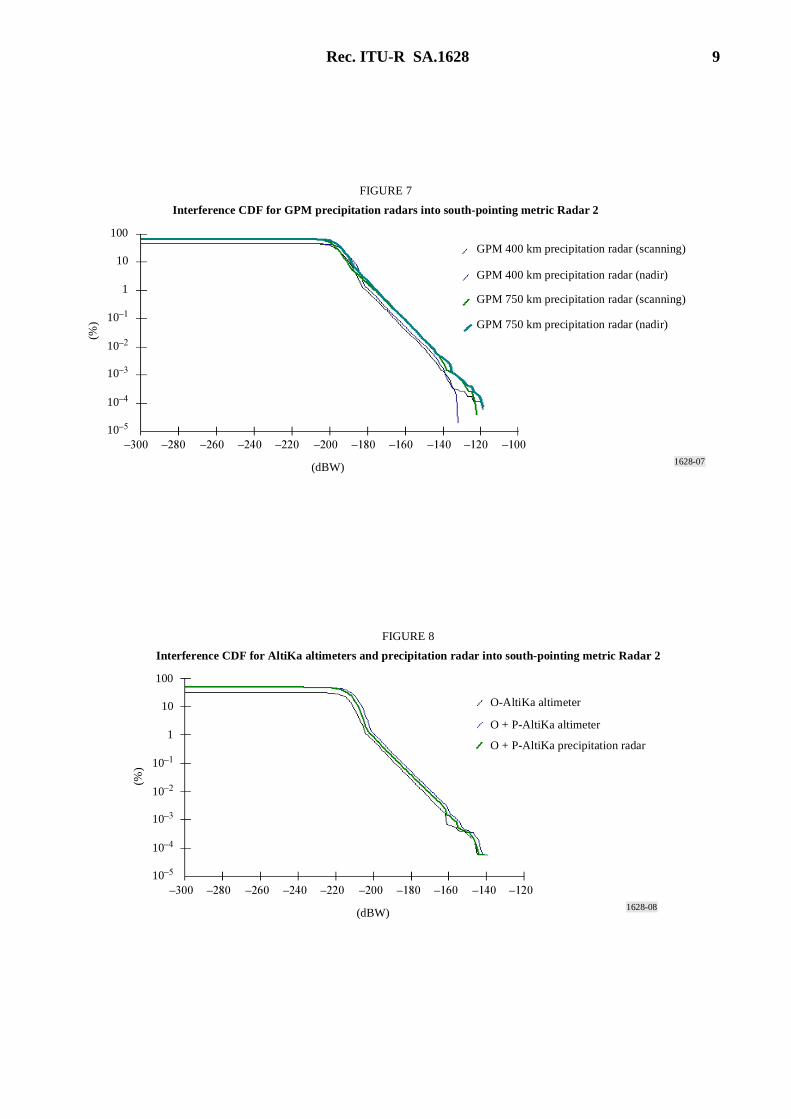
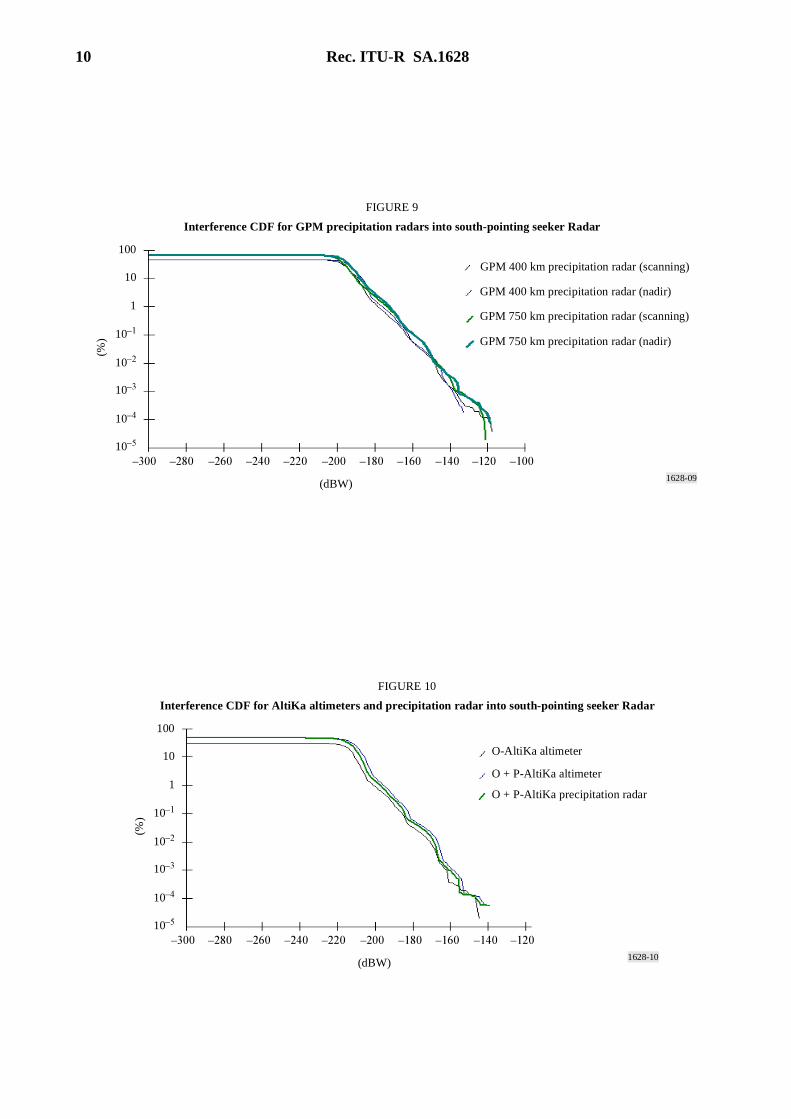
Table 1 lists seven candidate active sensors that would be deployed in constellations of three to nine satellites. For each such constellation, a CDF of the level of interference power received at each type of radiolocation station was calculated assuming that the radiolocation station is located at 65° latitude. The imaging station antenna were assumed to be pointed at 0° elevation and the metric and seeker radars at 45° elevation. The simulation runs were conducted for the radiolocation station antennas pointed at an azimuth of 180° from true north (i.e. south-pointing). The simulation program calculated the interference levels at intervals of 0.5 s over a period of 30 days. The calculated interference levels at each time step were sorted into bins of 1 dB resolution for use in plotting each CDF. These CDFs are plotted in Figs. 1 through 10.
6 Rec. ITU-R SA.1628
1628-01
100
10
1
10–1
10–2
10–3
10–4
10–5
–300 –280 –260 –240 –220 –200 –180 –160 –140 –120 –100
(%)
(dBW)
FIGURE 1
Interference CDF for GPM precipitation radars into south-pointing imager Radar 1
GPM 400 km precipitation radar (scanning)
GPM 400 km precipitation radar (nadir)
GPM 750 km precipitation radar (scanning)
GPM 750 km precipitation radar (nadir)
1628-02
100
10
1
10–1
10–2
10–3
10–4
10–5
–300 –280 –260 –240 –220 –200 –180 –160 –140
(%)
(dBW)
FIGURE 2
Interference CDF for AltiKa altimeters and precipitation radar into south-pointing imager Radar 1
O-AltiKa altimeter
O + P-AltiKa altimeter
O + P-AltiKa precipitation radar
Rec. ITU-R SA.1628 7
1628-03
100
10
1
10–1
10–2
10–3
10–4
10–5
–300 –280 –260 –240 –220 –200 –180 –160 –140 –120 –100
(%)
(dBW)
FIGURE 3
Interference CDF for GPM precipitation radars into south-pointing imager Radar 2
GPM 400 km precipitation radar (scanning)
GPM 400 km precipitation radar (nadir)
GPM 750 km precipitation radar (scanning)
GPM 750 km precipitation radar (nadir)
1628-04
100
10
1
10–1
10–2
10–3
10–4
10–5
–300 –280 –260 –240 –220 –200 –180 –160 –140
(%)
(dBW)
FIGURE 4
Interference CDF for AltiKa altimeters and precipitation radar into south-pointing imager Radar 2
O-AltiKa altimeter
O + P-AltiKa altimeter
O + P-AltiKa precipitation radar
8 Rec. ITU-R SA.1628
1628-05
100
10
1
10–1
10–2
10–3
10–4
10–5
–300 –280 –260 –240 –220 –200 –180 –160 –140 –120 –100
(%)
(dBW)
FIGURE 5
Interference CDF for GPM precipitation radars into south-pointing metric Radar 1
GPM 400 km precipitation radar (scanning)
GPM 400 km precipitation radar (nadir)
GPM 750 km precipitation radar (scanning)
GPM 750 km precipitation radar (nadir)
1628-06
100
10
1
10–1
10–2
10–3
10–4
10–5
–300 –280 –260 –240 –220 –200 –180 –160 –140 –120
(%)
(dBW)
FIGURE 6
Interference CDF for AltiKa altimeters and precipitation radar into south-pointing metric Radar 1
O-AltiKa altimeter
O + P-AltiKa altimeter
O + P-AltiKa precipitation radar
Rec. ITU-R SA.1628 9
1628-07
100
10
1
10–1
10–2
10–3
10–4
10–5
–300 –280 –260 –240 –220 –200 –180 –160 –140 –120 –100
(%)
(dBW)
FIGURE 7
Interference CDF for GPM precipitation radars into south-pointing metric Radar 2
GPM 400 km precipitation radar (scanning)
GPM 400 km precipitation radar (nadir)
GPM 750 km precipitation radar (scanning)
GPM 750 km precipitation radar (nadir)
1628-08
100
10
1
10–1
10–2
10–3
10–4
10–5
–300 –280 –260 –240 –220 –200 –180 –160 –140 –120
(%)
(dBW)
FIGURE 8
Interference CDF for AltiKa altimeters and precipitation radar into south-pointing metric Radar 2
O-AltiKa altimeter
O + P-AltiKa altimeter
O + P-AltiKa precipitation radar
10 Rec. ITU-R SA.1628
1628-09
100
10
1
10–1
10–2
10–3
10–4
10–5
–300 –280 –260 –240 –220 –200 –180 –160 –140 –120 –100
(%)
(dBW)
FIGURE 9
Interference CDF for GPM precipitation radars into south-pointing seeker Radar
GPM 400 km precipitation radar (scanning)
GPM 400 km precipitation radar (nadir)
GPM 750 km precipitation radar (scanning)
GPM 750 km precipitation radar (nadir)
1628-10
100
10
1
10–1
10–2
10–3
10–4
10–5
–300 –280 –260 –240 –220 –200 –180 –160 –140 –120
(%)
(dBW)
FIGURE 10
Interference CDF for AltiKa altimeters and precipitation radar into south-pointing seeker Radar
O-AltiKa altimeter
O + P-AltiKa altimeter
O + P-AltiKa precipitation radar
Rec. ITU-R SA.1628 11
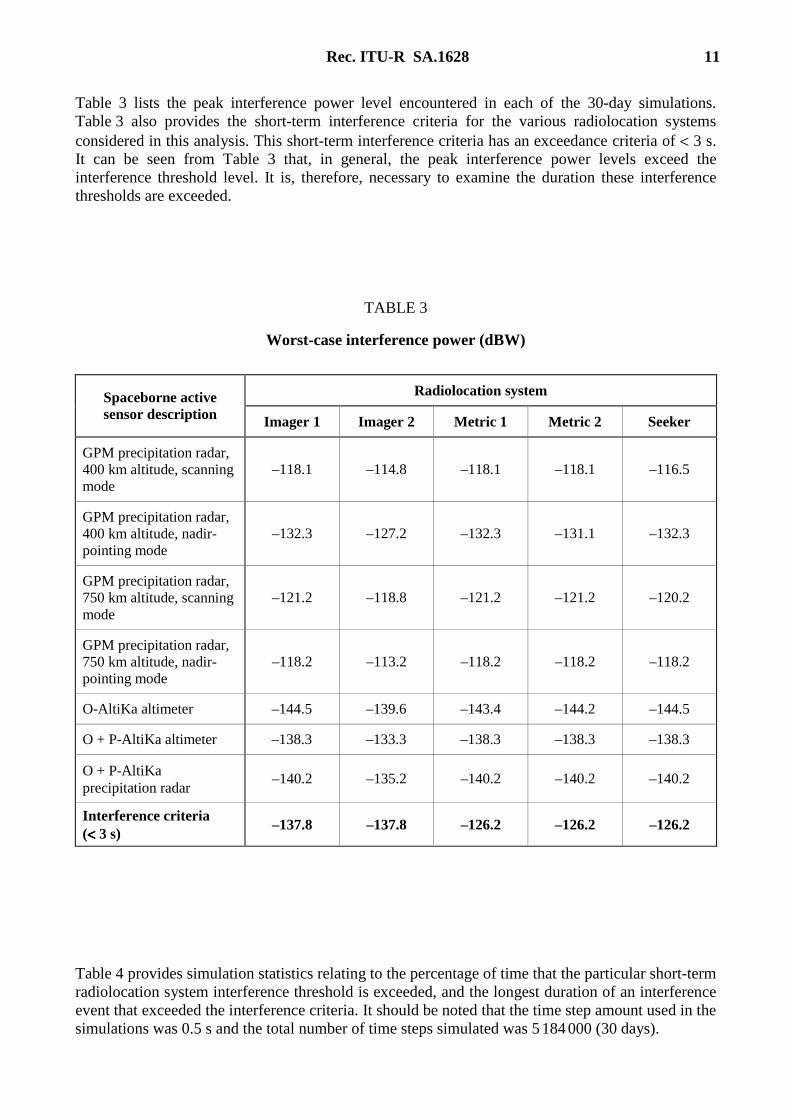
Table 3 lists the peak interference power level encountered in each of the 30-day simulations. Table 3 also provides the short-term interference criteria for the various radiolocation systems considered in this analysis. This short-term interference criteria has an exceedance criteria of < 3 s. It can be seen from Table 3 that, in general, the peak interference power levels exceed the interference threshold level. It is, therefore, necessary to examine the duration these interference thresholds are exceeded.
TABLE 3
Worst-case interference power (dBW)
Table 4 provides simulation statistics relating to the percentage of time that the particular short-term radiolocation system interference threshold is exceeded, and the longest duration of an interference event that exceeded the interference criteria. It should be noted that the time step amount used in the simulations was 0.5 s and the total number of time steps simulated was 5 184 000 (30 days).
Radiolocation system Spaceborne active sensor description Imager 1 Imager 2 Metric 1 Metric 2 Seeker
GPM precipitation radar, 400 km altitude, scanning mode
–118.1 –114.8 –118.1 –118.1 –116.5
GPM precipitation radar, 400 km altitude, nadir-pointing mode
–132.3 –127.2 –132.3 –131.1 –132.3
GPM precipitation radar, 750 km altitude, scanning mode
–121.2 –118.8 –121.2 –121.2 –120.2
GPM precipitation radar, 750 km altitude, nadir-pointing mode
–118.2 –113.2 –118.2 –118.2 –118.2
O-AltiKa altimeter –144.5 –139.6 –143.4 –144.2 –144.5
O + P-AltiKa altimeter –138.3 –133.3 –138.3 –138.3 –138.3
O + P-AltiKa precipitation radar
–140.2 –135.2 –140.2 –140.2 –140.2
Interference criteria (<<<< 3 s)
–137.8 –137.8 –126.2 –126.2 –126.2
12 Rec. ITU-R SA.1628
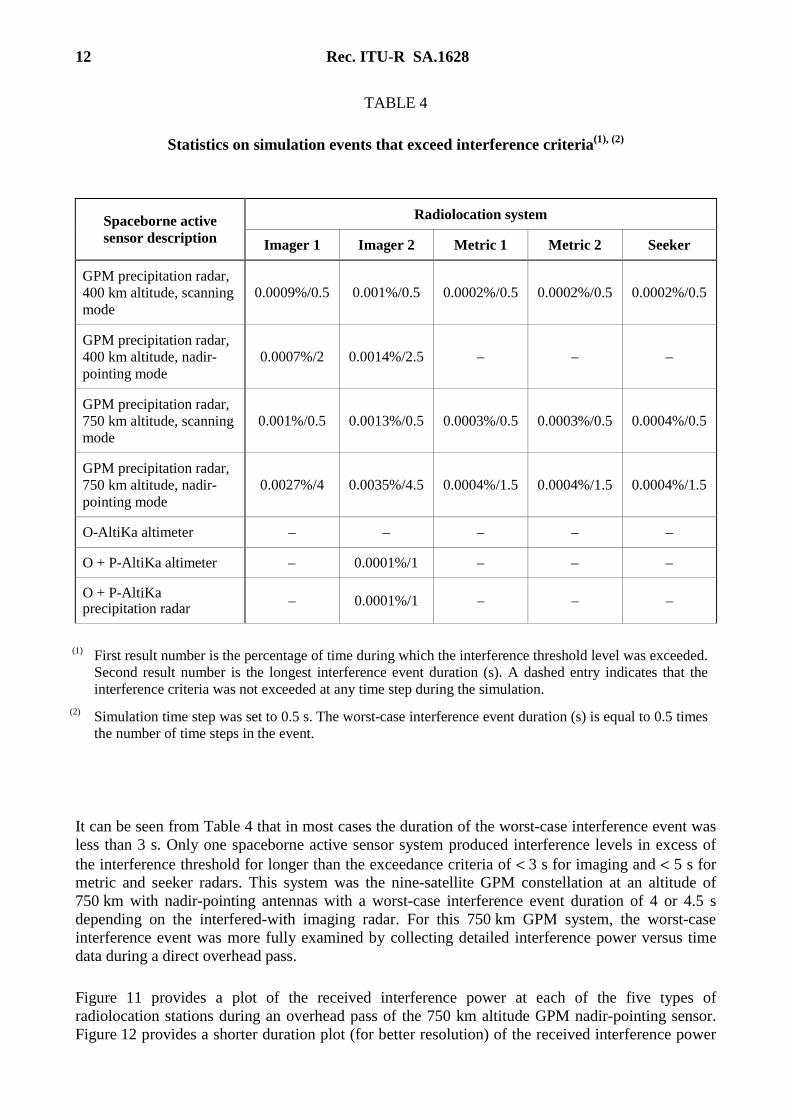
TABLE 4
Statistics on simulation events that exceed interference criteria(1), (2)
(1) First result number is the percentage of time during which the interference threshold level was exceeded. Second result number is the longest interference event duration (s). A dashed entry indicates that the interference criteria was not exceeded at any time step during the simulation.
(2) Simulation time step was set to 0.5 s. The worst-case interference event duration (s) is equal to 0.5 times the number of time steps in the event.
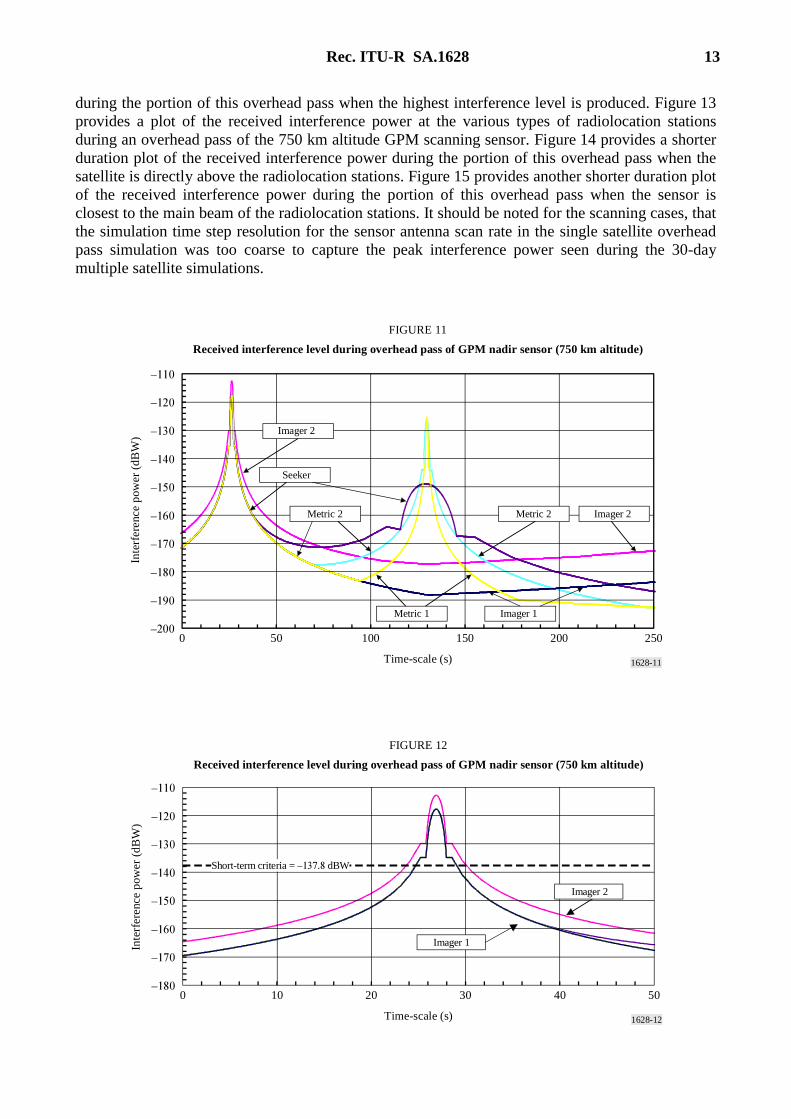
It can be seen from Table 4 that in most cases the duration of the worst-case interference event was less than 3 s. Only one spaceborne active sensor system produced interference levels in excess of the interference threshold for longer than the exceedance criteria of < 3 s for imaging and < 5 s for metric and seeker radars. This system was the nine-satellite GPM constellation at an altitude of 750 km with nadir-pointing antennas with a worst-case interference event duration of 4 or 4.5 s depending on the interfered-with imaging radar. For this 750 km GPM system, the worst-case interference event was more fully examined by collecting detailed interference power versus time data during a direct overhead pass.
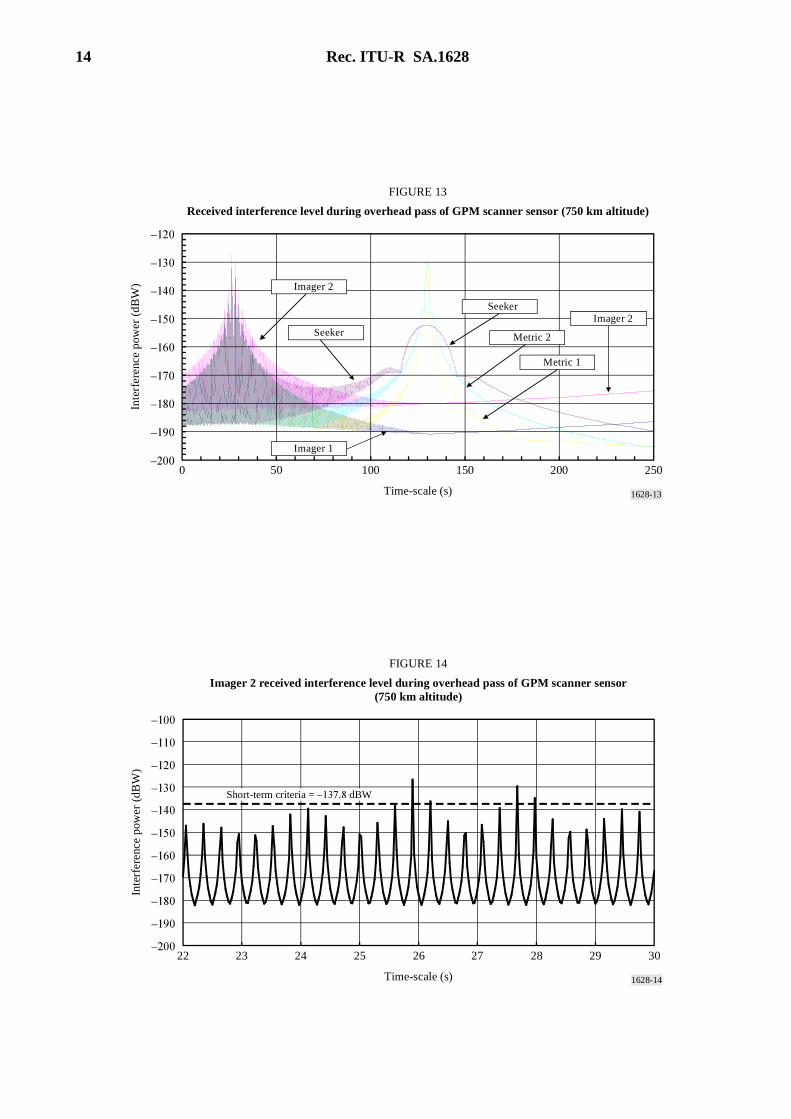
Figure 11 provides a plot of the received interference power at each of the five types of radiolocation stations during an overhead pass of the 750 km altitude GPM nadir-pointing sensor. Figure 12 provides a shorter duration plot (for better resolution) of the received interference power
Radiolocation system Spaceborne active sensor description Imager 1 Imager 2 Metric 1 Metric 2 Seeker
GPM precipitation radar, 400 km altitude, scanning mode
0.0009%/0.5 0.001%/0.5 0.0002%/0.5 0.0002%/0.5 0.0002%/0.5
GPM precipitation radar, 400 km altitude, nadir-pointing mode
0.0007%/2 0.0014%/2.5 – – –
GPM precipitation radar, 750 km altitude, scanning mode
0.001%/0.5 0.0013%/0.5 0.0003%/0.5 0.0003%/0.5 0.0004%/0.5
GPM precipitation radar, 750 km altitude, nadir-pointing mode
0.0027%/4 0.0035%/4.5 0.0004%/1.5 0.0004%/1.5 0.0004%/1.5
O-AltiKa altimeter – – – – –
O + P-AltiKa altimeter – 0.0001%/1 – – –
O + P-AltiKa precipitation radar – 0.0001%/1 – – –
Rec. ITU-R SA.1628 13
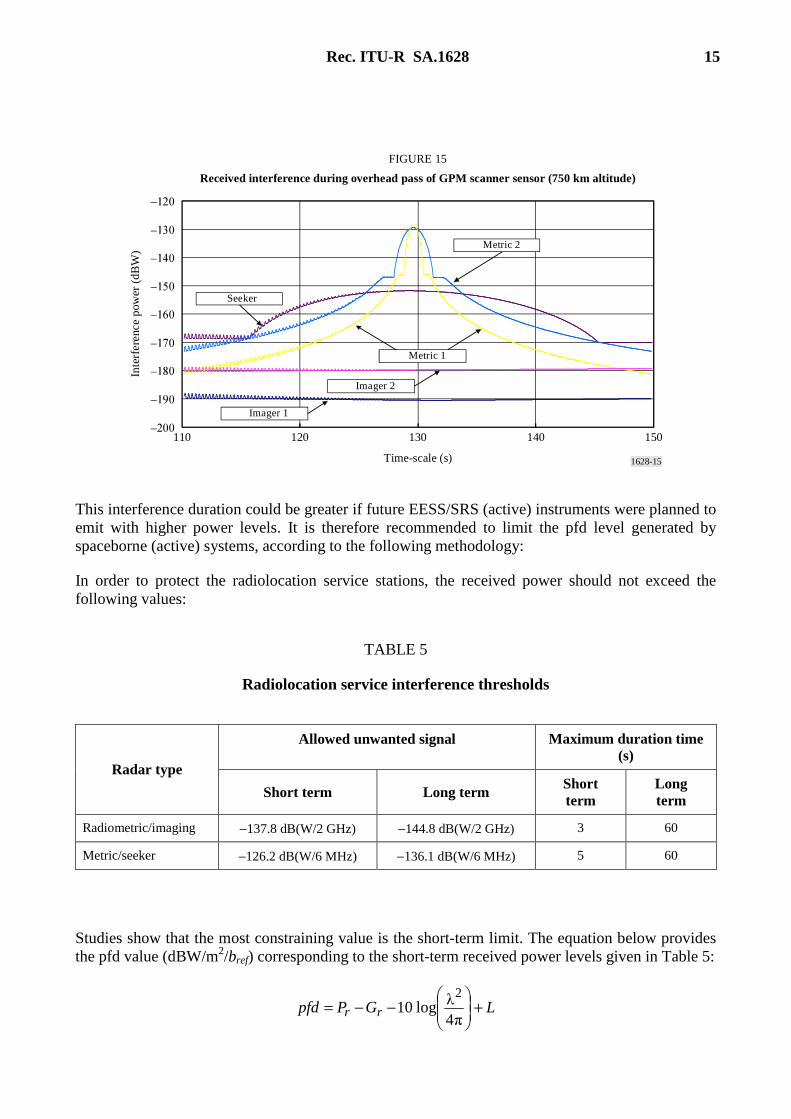
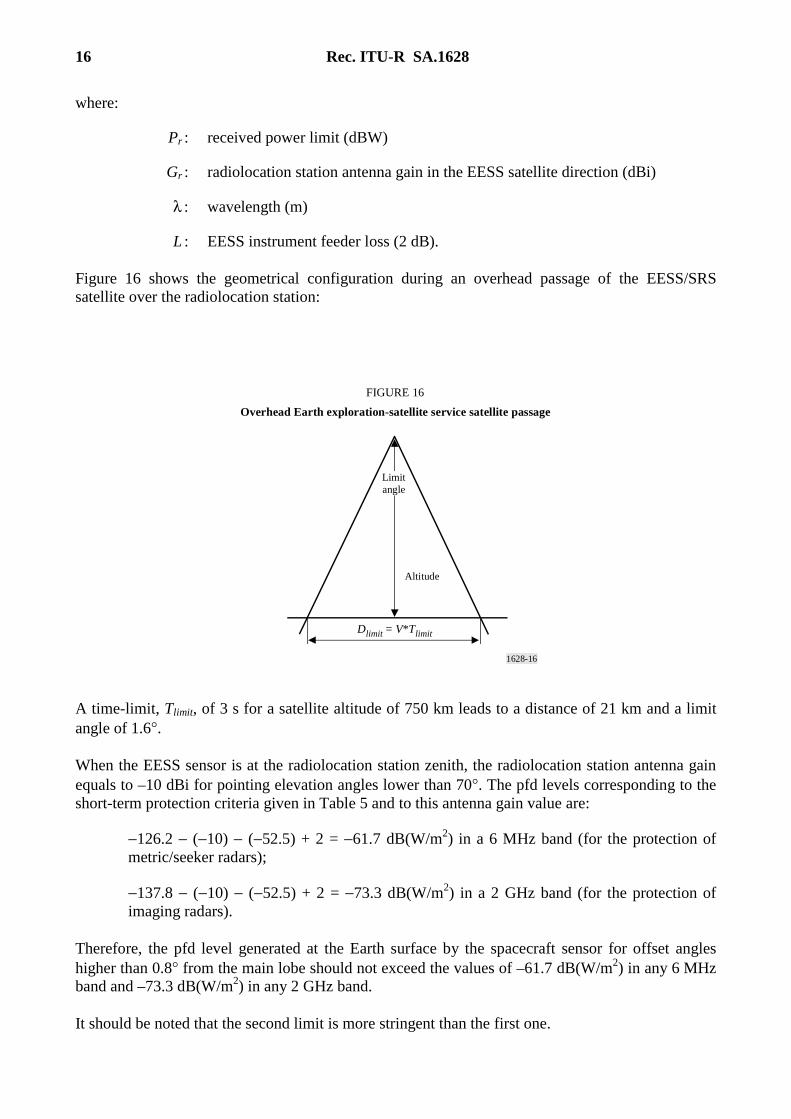
during the portion of this overhead pass when the highest interference level is produced. Figure 13 provides a plot of the received interference power at the various types of radiolocation stations during an overhead pass of the 750 km altitude GPM scanning sensor. Figure 14 provides a shorter duration plot of the received interference power during the portion of this overhead pass when the satellite is directly above the radiolocation stations. Figure 15 provides another shorter duration plot of the received interference power during the portion of this overhead pass when the sensor is closest to the main beam of the radiolocation stations. It should be noted for the scanning cases, that the simulation time step resolution for the sensor antenna scan rate in the single satellite overhead pass simulation was too coarse to capture the peak interference power seen during the 30-day multiple satellite simulations.
1628-11
–110
–120
–130
–140
–150
–160
–170
–180
–190
–2000 50 100 150 200 250
FIGURE 11
Received interference level during overhead pass of GPM nadir sensor (750 km altitude)
Imager 2
Seeker
Metric 2
Metric 1 Imager 1
Imager 2Metric 2
Time-scale (s)
Inte
rfer
ence
pow
er (
dBW
)
1628-12
–110
–120
–130
–140
–150
–160
–170
–1800 10 20 30 40 50
FIGURE 12
Received interference level during overhead pass of GPM nadir sensor (750 km altitude)
Time-scale (s)
Inte
rfer
ence
pow
er (
dBW
)
Imager 1
Imager 2
Short-term criteria = –137.8 dBW
14 Rec. ITU-R SA.1628
1628-13
–120
–130
–140
–150
–160
–170
–180
–190
–2000 50 100 150 200 250
FIGURE 13
Received interference level during overhead pass of GPM scanner sensor (750 km altitude)
Time-scale (s)
Inte
rfer
ence
pow
er (
dBW
) Imager 2
Seeker
SeekerImager 2
Metric 2
Metric 1
Imager 1
1628-14
–200
–190
–180
–170
–160
–150
–140
–130
–120
–110
–100
22 23 24 25 26 27 28 29 30
FIGURE 14
Imager 2 received interference level during overhead pass of GPM scanner sensor(750 km altitude)
Time-scale (s)
Inte
rfer
ence
pow
er (
dBW
)
Short-term criteria = –137.8 dBW
Rec. ITU-R SA.1628 15
1628-15
–120
–130
–140
–150
–160
–170
–180
–190
–200110 150120 130 140
FIGURE 15
Received interference during overhead pass of GPM scanner sensor (750 km altitude)
Time-scale (s)
Inte
rfer
ence
pow
er (
dBW
)
Imager 1
Imager 2
Metric 1
Metric 2
Seeker
This interference duration could be greater if future EESS/SRS (active) instruments were planned to emit with higher power levels. It is therefore recommended to limit the pfd level generated by spaceborne (active) systems, according to the following methodology:
In order to protect the radiolocation service stations, the received power should not exceed the following values:
TABLE 5
Radiolocation service interference thresholds
Studies show that the most constraining value is the short-term limit. The equation below provides the pfd value (dBW/m2/bref) corresponding to the short-term received power levels given in Table 5:
LGPpfd rr +
−−=
π4λlog10
2
Allowed unwanted signal Maximum duration time (s)
Radar type
Short term Long term Short term
Long term
Radiometric/imaging −137.8 dB(W/2 GHz) −144.8 dB(W/2 GHz) 3 60
Metric/seeker −126.2 dB(W/6 MHz) −136.1 dB(W/6 MHz) 5 60
16 Rec. ITU-R SA.1628
where:
Pr : received power limit (dBW)
Gr : radiolocation station antenna gain in the EESS satellite direction (dBi)
λ : wavelength (m)
L : EESS instrument feeder loss (2 dB).
Figure 16 shows the geometrical configuration during an overhead passage of the EESS/SRS satellite over the radiolocation station:
1628-16
Dlimit = V*Tlimit
FIGURE 16
Overhead Earth exploration-satellite service satellite passage
Altitude
Limit angle
A time-limit, Tlimit, of 3 s for a satellite altitude of 750 km leads to a distance of 21 km and a limit angle of 1.6°.
When the EESS sensor is at the radiolocation station zenith, the radiolocation station antenna gain equals to –10 dBi for pointing elevation angles lower than 70°. The pfd levels corresponding to the short-term protection criteria given in Table 5 and to this antenna gain value are:
−126.2 − (−10) − (−52.5) + 2 = −61.7 dB(W/m2) in a 6 MHz band (for the protection of metric/seeker radars);
−137.8 − (−10) − (−52.5) + 2 = −73.3 dB(W/m2) in a 2 GHz band (for the protection of imaging radars).
Therefore, the pfd level generated at the Earth surface by the spacecraft sensor for offset angles higher than 0.8° from the main lobe should not exceed the values of –61.7 dB(W/m2) in any 6 MHz band and –73.3 dB(W/m2) in any 2 GHz band.
It should be noted that the second limit is more stringent than the first one.
Rec. ITU-R SA.1628 17
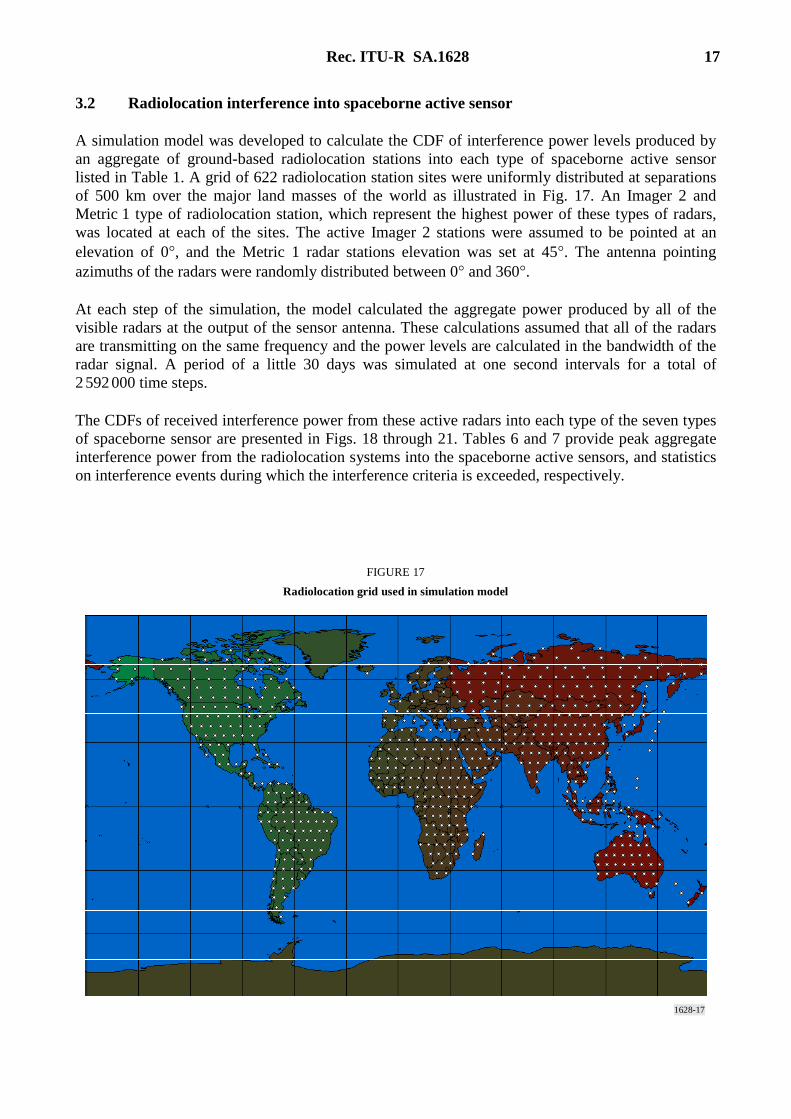
3.2 Radiolocation interference into spaceborne active sensor
A simulation model was developed to calculate the CDF of interference power levels produced by an aggregate of ground-based radiolocation stations into each type of spaceborne active sensor listed in Table 1. A grid of 622 radiolocation station sites were uniformly distributed at separations of 500 km over the major land masses of the world as illustrated in Fig. 17. An Imager 2 and Metric 1 type of radiolocation station, which represent the highest power of these types of radars, was located at each of the sites. The active Imager 2 stations were assumed to be pointed at an elevation of 0°, and the Metric 1 radar stations elevation was set at 45°. The antenna pointing azimuths of the radars were randomly distributed between 0° and 360°.
At each step of the simulation, the model calculated the aggregate power produced by all of the visible radars at the output of the sensor antenna. These calculations assumed that all of the radars are transmitting on the same frequency and the power levels are calculated in the bandwidth of the radar signal. A period of a little 30 days was simulated at one second intervals for a total of 2 592 000 time steps.
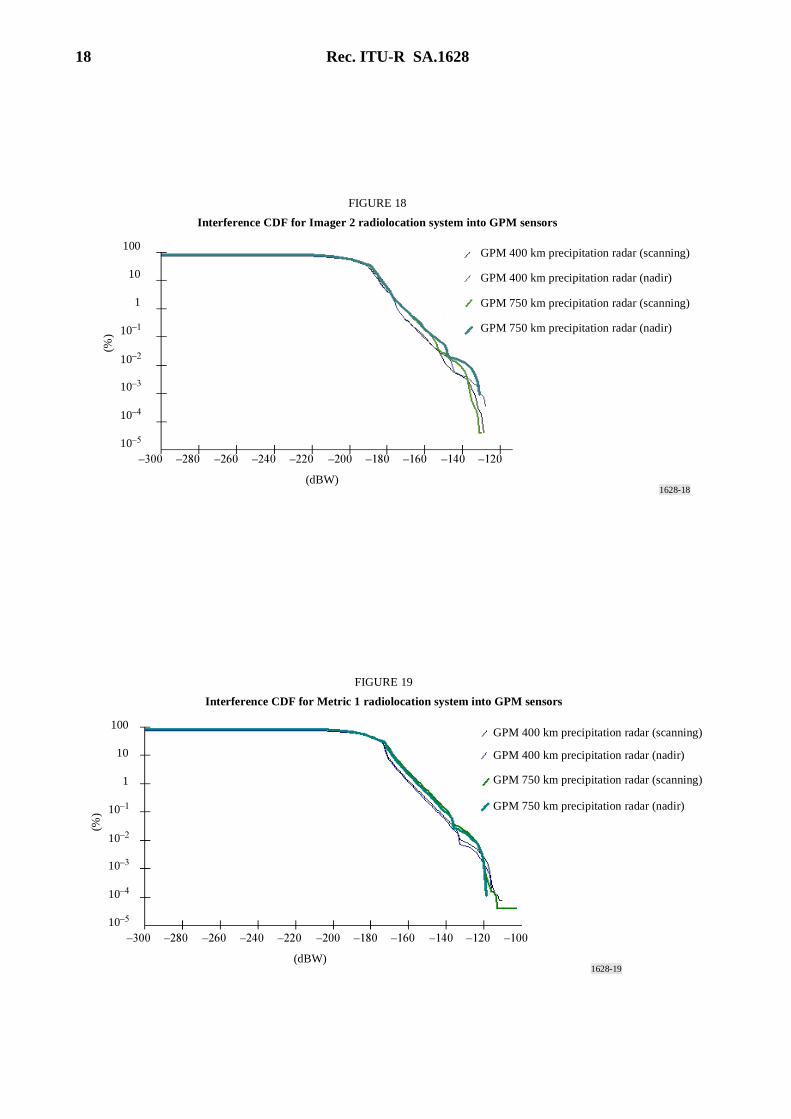
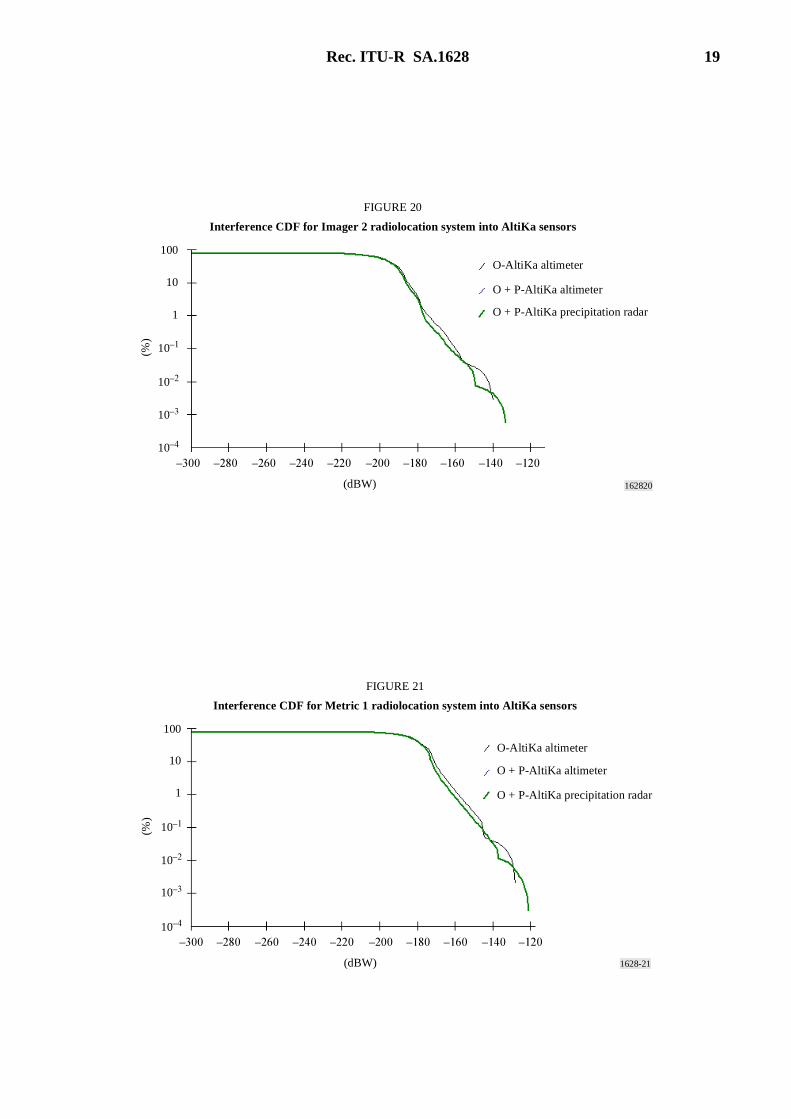
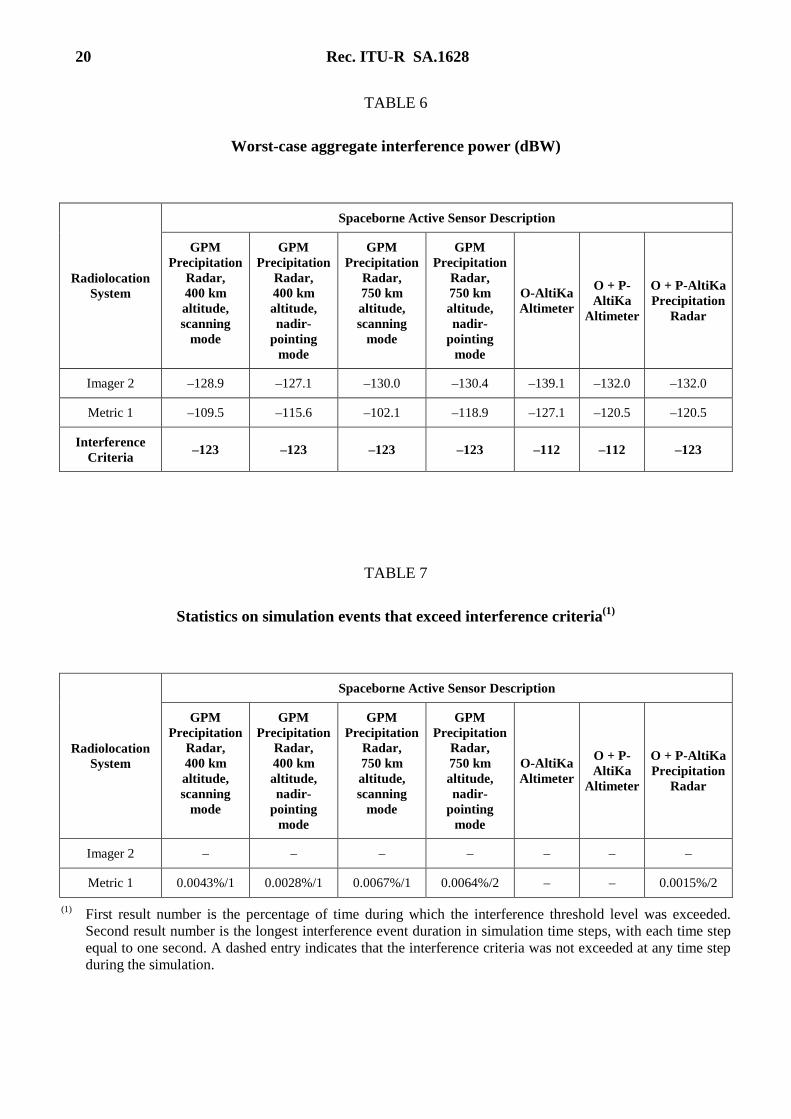
The CDFs of received interference power from these active radars into each type of the seven types of spaceborne sensor are presented in Figs. 18 through 21. Tables 6 and 7 provide peak aggregate interference power from the radiolocation systems into the spaceborne active sensors, and statistics on interference events during which the interference criteria is exceeded, respectively.
1628-17
FIGURE 17
Radiolocation grid used in simulation model
18 Rec. ITU-R SA.1628
1628-18
100
10
1
10–1
10–2
10–3
10–4
10–5
–300 –280 –260 –240 –220 –200 –180 –160 –140 –120
(%)
(dBW)
FIGURE 18
Interference CDF for Imager 2 radiolocation system into GPM sensors
GPM 400 km precipitation radar (scanning)
GPM 400 km precipitation radar (nadir)
GPM 750 km precipitation radar (scanning)
GPM 750 km precipitation radar (nadir)
1628-19
100
10
1
10–1
10–2
10–3
10–4
10–5
–300 –280 –260 –240 –220 –200 –180 –160 –140 –120 –100
(%)
(dBW)
FIGURE 19
Interference CDF for Metric 1 radiolocation system into GPM sensors
GPM 400 km precipitation radar (scanning)
GPM 400 km precipitation radar (nadir)
GPM 750 km precipitation radar (scanning)
GPM 750 km precipitation radar (nadir)
Rec. ITU-R SA.1628 19
162820
100
10
1
10–1
10–2
10–3
10–4
–300 –280 –260 –240 –220 –200 –180 –160 –140 –120
(%)
(dBW)
FIGURE 20
Interference CDF for Imager 2 radiolocation system into AltiKa sensors
O-AltiKa altimeter
O + P-AltiKa altimeter
O + P-AltiKa precipitation radar
1628-21
100
10
1
10–1
10–2
10–3
10–4
–300 –280 –260 –240 –220 –200 –180 –160 –140 –120
(%)
(dBW)
FIGURE 21
Interference CDF for Metric 1 radiolocation system into AltiKa sensors
O-AltiKa altimeter
O + P-AltiKa altimeter
O + P-AltiKa precipitation radar
20 Rec. ITU-R SA.1628
TABLE 6
Worst-case aggregate interference power (dBW)
TABLE 7
Statistics on simulation events that exceed interference criteria(1)
Spaceborne Active Sensor Description
Radiolocation System
GPM Precipitation
Radar, 400 km altitude, scanning
mode
GPM Precipitation
Radar, 400 km altitude, nadir-
pointing mode
GPM Precipitation
Radar, 750 km altitude, scanning
mode
GPM Precipitation
Radar, 750 km altitude, nadir-
pointing mode
O-AltiKa Altimeter
O + P-AltiKa
Altimeter
O + P-AltiKa Precipitation
Radar
Imager 2 –128.9 –127.1 –130.0 –130.4 –139.1 –132.0 –132.0
Metric 1 –109.5 –115.6 –102.1 –118.9 –127.1 –120.5 –120.5
Interference Criteria
–123 –123 –123 –123 –112 –112 –123
Spaceborne Active Sensor Description
Radiolocation System
GPM Precipitation
Radar, 400 km altitude, scanning
mode
GPM Precipitation
Radar, 400 km altitude, nadir-
pointing mode
GPM Precipitation
Radar, 750 km altitude, scanning
mode
GPM Precipitation
Radar, 750 km altitude, nadir-
pointing mode
O-AltiKa Altimeter
O + P-AltiKa
Altimeter
O + P-AltiKa Precipitation
Radar
Imager 2 – – – – – – –
Metric 1 0.0043%/1 0.0028%/1 0.0067%/1 0.0064%/2 – – 0.0015%/2
(1) First result number is the percentage of time during which the interference threshold level was exceeded. Second result number is the longest interference event duration in simulation time steps, with each time step equal to one second. A dashed entry indicates that the interference criteria was not exceeded at any time step during the simulation.
Rec. ITU-R SA.1628 21
4 Summary
CDFs of the interference levels into five different types of radiolocation stations that could be produced by seven types of constellations of spaceborne active sensors over a 30-day period were presented. The percentage of time that the radiolocation short-term allowable interference power level was exceeded ranged from less than 0.0001% to 0.0035% of the time. The duration of interference events exceeding this allowable short-term interference level was within the maximum duration limit, except for the case of one active sensor which exceeded the allowable interference level for 4 to 4.5 s compared to the 3 s limit.
CDFs of the interference levels into each of seven types of spaceborne active sensors over a 30-day period by the highest power imager and metric radars were presented. The percentage of time that the specified interference criteria was exceeded ranged from less than 0.0015% to 0.0067% of the time.
The results of these dynamic simulations provide additional information to demonstrate the feasibility of sharing between spaceborne active sensors and radiolocation stations in the 35.5-36 GHz band.
Annex 2
Sharing in the 35.5-36 GHz band between the EESS and SRS (active) and the fixed service
This study aims at verifying that the fixed service allocated in some countries of Region 1 by RR No. 5.549 systems is protected from interference from the EESS (active) and SRS (active) in the 35.5-36 GHz band.
1 Technical characteristics
1.1 EESS and SRS systems characteristics
See Annex 1.
1.2 Fixed service characteristics and interference criteria
The technical characteristics for the fixed service around 35 GHz are supposed to be similar to those given for the 37-39 GHz band. In this band there are several types of systems listed in Recommendation ITU-R F.758. These systems are either point-to-point (P-P) systems or point-to-multipoint (P-MP) systems.
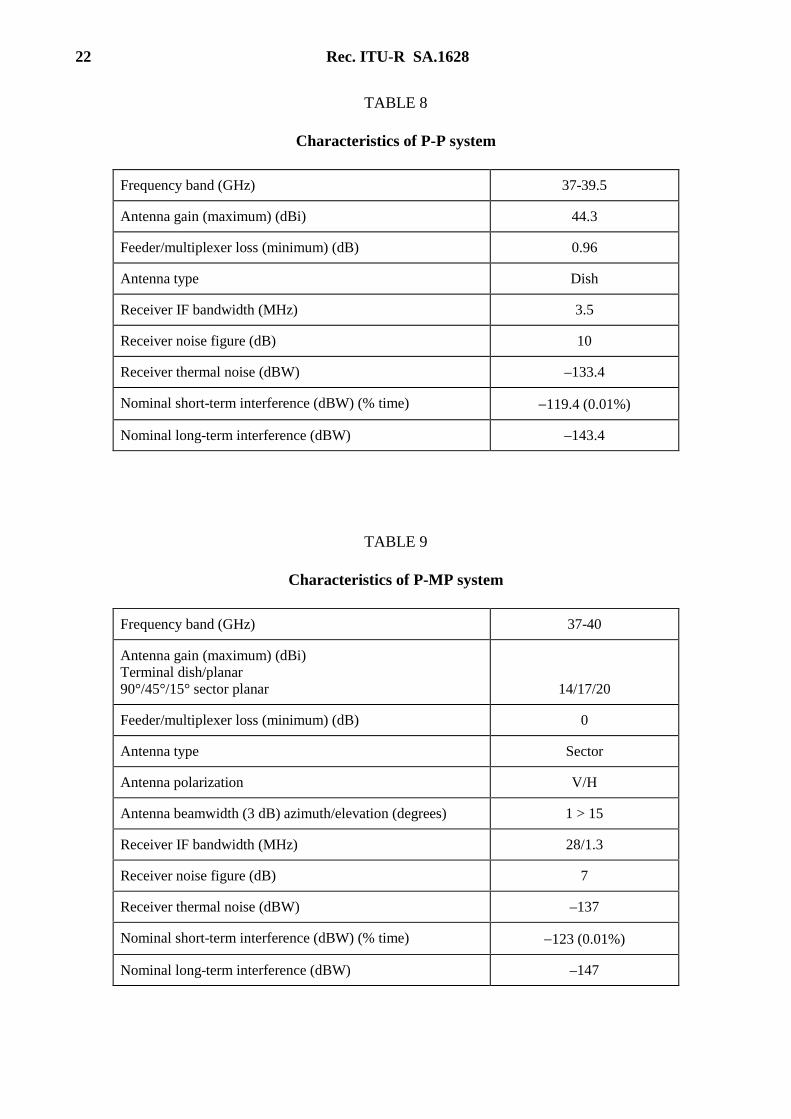
In order to verify that there is no problem of sharing between EESS (active) systems and the fixed service we have chosen one P-P system and one P-MP system which are given in Tables 8 and 9.
The long-term criterion (I/N = −10 dB) shall not be exceeded more than 20% of the time. We have chosen a short-term criterion corresponding to an I/N of 14 dB not to be exceeded more than 0.01% of the time.
22 Rec. ITU-R SA.1628
TABLE 8
Characteristics of P-P system
TABLE 9
Characteristics of P-MP system
Frequency band (GHz) 37-39.5
Antenna gain (maximum) (dBi) 44.3
Feeder/multiplexer loss (minimum) (dB) 0.96
Antenna type Dish
Receiver IF bandwidth (MHz) 3.5
Receiver noise figure (dB) 10
Receiver thermal noise (dBW) –133.4
Nominal short-term interference (dBW) (% time) −119.4 (0.01%)
Nominal long-term interference (dBW) –143.4
Frequency band (GHz) 37-40
Antenna gain (maximum) (dBi) Terminal dish/planar 90°/45°/15° sector planar
14/17/20
Feeder/multiplexer loss (minimum) (dB) 0
Antenna type Sector
Antenna polarization V/H
Antenna beamwidth (3 dB) azimuth/elevation (degrees) 1 > 15
Receiver IF bandwidth (MHz) 28/1.3
Receiver noise figure (dB) 7
Receiver thermal noise (dBW) –137
Nominal short-term interference (dBW) (% time) −123 (0.01%)
Nominal long-term interference (dBW) –147
Rec. ITU-R SA.1628 23
2 Analysis methodology
Same as Annex 1. No duty cycle was considered for the precipitation radars in the simulations. Should this parameter be considered, an additional 5 to 10 dB margin should be added to the margin found in § 3.
3 Analysis results
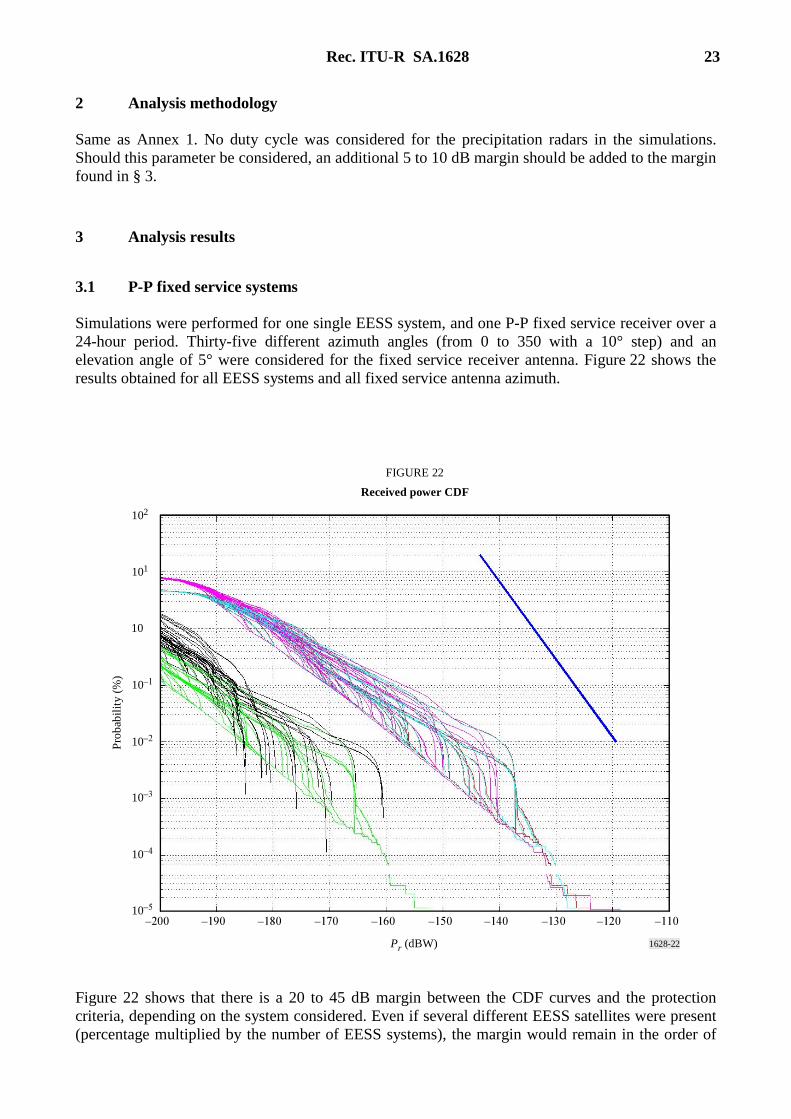
3.1 P-P fixed service systems
Simulations were performed for one single EESS system, and one P-P fixed service receiver over a 24-hour period. Thirty-five different azimuth angles (from 0 to 350 with a 10° step) and an elevation angle of 5° were considered for the fixed service receiver antenna. Figure 22 shows the results obtained for all EESS systems and all fixed service antenna azimuth.
1628-22
–200 –190 –130–180 –170 –160 –150 –140 –120 –110
10
10–1
10–2
10–3
10–4
10–5
101
102
Pr (dBW)
FIGURE 22
Received power CDF
Pro
babi
lity
(%
)
Figure 22 shows that there is a 20 to 45 dB margin between the CDF curves and the protection criteria, depending on the system considered. Even if several different EESS satellites were present (percentage multiplied by the number of EESS systems), the margin would remain in the order of
24 Rec. ITU-R SA.1628
15 to 20 dB. It is not currently possible to increase the peak power of EESS (active) systems by such a value and therefore is no need to impose any constraint to the EESS (active) or SRS (active) in this band to protect the P-P fixed service links.
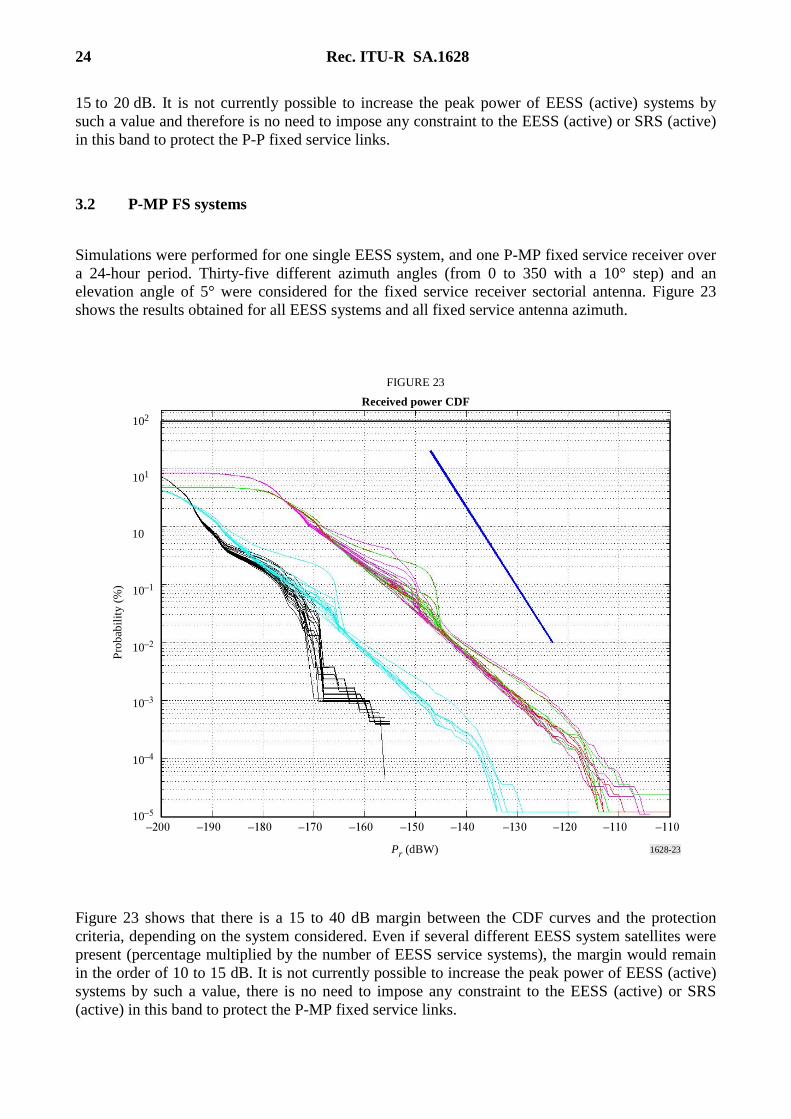
3.2 P-MP FS systems
Simulations were performed for one single EESS system, and one P-MP fixed service receiver over a 24-hour period. Thirty-five different azimuth angles (from 0 to 350 with a 10° step) and an elevation angle of 5° were considered for the fixed service receiver sectorial antenna. Figure 23 shows the results obtained for all EESS systems and all fixed service antenna azimuth.
1628-23
–200 –190 –130–180 –170 –160 –150 –140 –120 –110–110
10
10–1
10–2
10–3
10–4
10–5
101
102
Pr (dBW)
FIGURE 23
Received power CDF
Pro
babi
lity
(%
)
Figure 23 shows that there is a 15 to 40 dB margin between the CDF curves and the protection criteria, depending on the system considered. Even if several different EESS system satellites were present (percentage multiplied by the number of EESS service systems), the margin would remain in the order of 10 to 15 dB. It is not currently possible to increase the peak power of EESS (active) systems by such a value, there is no need to impose any constraint to the EESS (active) or SRS (active) in this band to protect the P-MP fixed service links.
Rec. ITU-R SA.1628 25
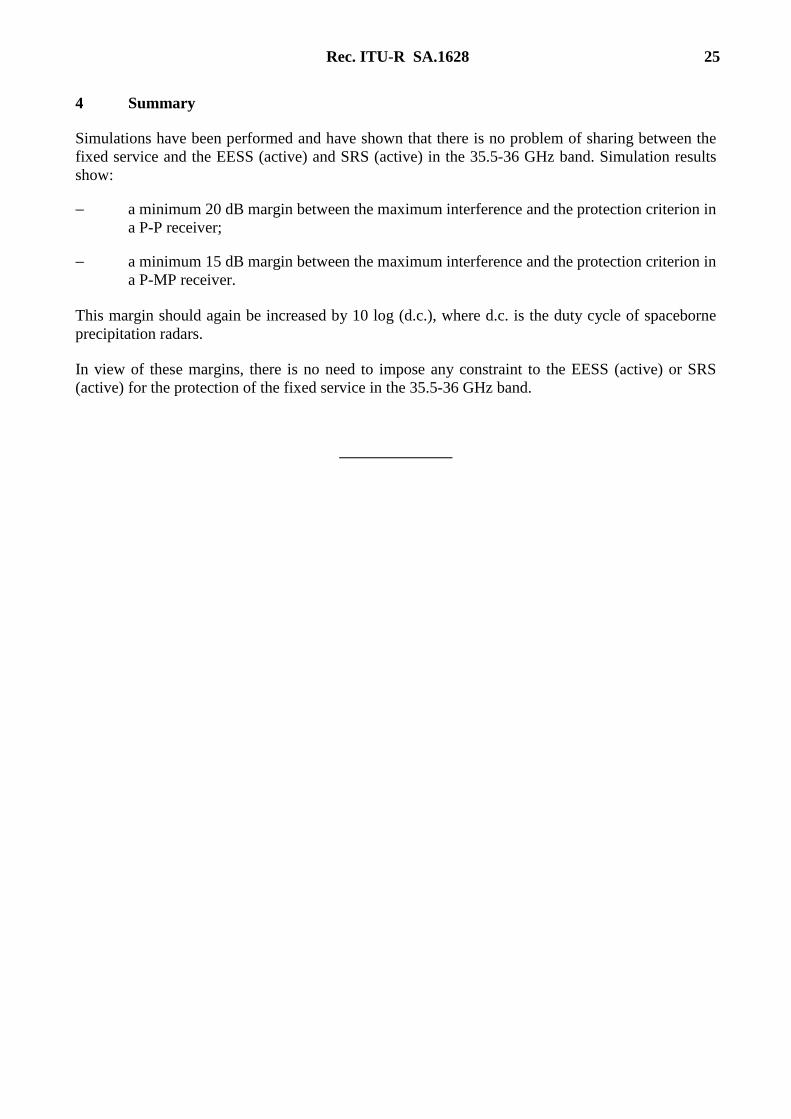
4 Summary
Simulations have been performed and have shown that there is no problem of sharing between the fixed service and the EESS (active) and SRS (active) in the 35.5-36 GHz band. Simulation results show:
− a minimum 20 dB margin between the maximum interference and the protection criterion in a P-P receiver;
− a minimum 15 dB margin between the maximum interference and the protection criterion in a P-MP receiver.
This margin should again be increased by 10 log (d.c.), where d.c. is the duty cycle of spaceborne precipitation radars.
In view of these margins, there is no need to impose any constraint to the EESS (active) or SRS (active) for the protection of the fixed service in the 35.5-36 GHz band.


![Girl Friends - Cap.35.5 [Omake]](https://img.pdfslide.us/doc/110x75/577ca5b71a28abea748ba1ca/girl-friends-cap355-omake.jpg)


![STEMI Admission [1628] General](https://img.pdfslide.us/doc/110x75/620427d1acd0ca7aa500053f/stemi-admission-1628-general.jpg)


![Full Project [FK-1628 - Deepesh]](https://img.pdfslide.us/doc/110x75/577d360f1a28ab3a6b920d7c/full-project-fk-1628-deepesh.jpg)