Embed Size (px)
Citation preview

Recommendation ITU-R BT.2077-0 (07/2015)
Real-time serial digital interfaces for UHDTV signals
BT Series
Broadcasting service
(television)

ii Rec. ITU-R BT.2077-0
Foreword
The role of the Radiocommunication Sector is to ensure the rational, equitable, efficient and economical use of the
radio-frequency spectrum by all radiocommunication services, including satellite services, and carry out studies without
limit of frequency range on the basis of which Recommendations are adopted.
The regulatory and policy functions of the Radiocommunication Sector are performed by World and Regional
Radiocommunication Conferences and Radiocommunication Assemblies supported by Study Groups.
Policy on Intellectual Property Right (IPR)
ITU-R policy on IPR is described in the Common Patent Policy for ITU-T/ITU-R/ISO/IEC referenced in Annex 1 of
Resolution ITU-R 1. Forms to be used for the submission of patent statements and licensing declarations by patent
holders are available from http://www.itu.int/ITU-R/go/patents/en where the Guidelines for Implementation of the
Common Patent Policy for ITU-T/ITU-R/ISO/IEC and the ITU-R patent information database can also be found.
Series of ITU-R Recommendations
(Also available online at http://www.itu.int/publ/R-REC/en)
Series Title
BO Satellite delivery
BR Recording for production, archival and play-out; film for television
BS Broadcasting service (sound)
BT Broadcasting service (television)
F Fixed service
M Mobile, radiodetermination, amateur and related satellite services
P Radiowave propagation
RA Radio astronomy
RS Remote sensing systems
S Fixed-satellite service
SA Space applications and meteorology
SF Frequency sharing and coordination between fixed-satellite and fixed service systems
SM Spectrum management
SNG Satellite news gathering
TF Time signals and frequency standards emissions
V Vocabulary and related subjects
Note: This ITU-R Recommendation was approved in English under the procedure detailed in Resolution ITU-R 1.
Electronic Publication
Geneva, 2015
ITU 2015
All rights reserved. No part of this publication may be reproduced, by any means whatsoever, without written permission of ITU.

Rec. ITU-R BT.2077-0 1
RECOMMENDATION ITU-R BT.2077-0
Real-time serial digital interfaces for UHDTV signals
(Question ITU-R 130-2/6)
(2015)
Scope
This Recommendation defines Serial Digital Interfaces for all image formats defined in Recommendation
ITU-R BT.2020. This Recommendation is divided into three parts. Part 1 and Part 3 are based on 10-bit word
containers and Part 2 is based on 12-bit word containers. Part 1 and Part 2 use multi-link 10 Gbit/s optical
interfaces and Part 3 uses single link and multi-link 6 Gbit/s, 12 Gbit/s and 24 Gbit/s electrical and optical
interfaces.
Keywords
Serial Interface, UHDTV, Optical Interface, Sub-Image, Real-Time
The ITU Radiocommunication Assembly,
considering
a) that Recommendation ITU-R BT.2020 defines UHDTV studio signals with 7 680 × 4 320
and 3 840 × 2 160 pixel counts, various frame frequencies up to 120 Hz, 4:4:4, 4:2:2, and 4:2:0
sample structures, and 10 and 12 bit depths;
b) that a whole range of equipment based on these signals requires digital interfaces for
broadcasting chains and industrial applications;
c) that digital interfaces for UHDTV studio signals should support all formats permitted in
Recommendation ITU-R BT.2020;
d) that digital interfaces for HDTV (HD-SDI) specified in Recommendation ITU-R BT.1120
were originally designed to transport 4:2:2, 10 bit HDTV signals at a frame frequency of up to
30 Hz or a field frequency of 60 Hz;
e) that practical optical interfaces supporting a data rate of around 10 Gbit/s are available, and
practical electrical and optical interfaces supporting data rates of 6 Gbit/s and 12 Gbit/s and
24 Gbit/s are available, and those interfaces supporting higher data rates will become possible in
the future,
recommends
that the specifications described in Part 1, Part 2 or Part 3 of this Recommendation should be used
for Real-Time Serial Digital Interfaces for UHDTV signals.
NOTE 1 – Table 1 tabulates key characteristics of the Part 1, 2 and 3 interfaces.
Where there is a choice of interfaces for the desired infrastructure, it can be made taking account of
operational and other business factors, including the transmission medium and distance as indicated
in Table 1.

2 Rec. ITU-R BT.2077-0
TABLE 1
Key characteristics of the Part 1, 2 and 3 interfaces
Part 1 Part 2 Part 3
Electrical Optical
Data
mapping
Container 10-bit word 12-bit word 10-bit word
Link speed 10.692 Gbit/s 10.692 Gbit/s 5.94, 11.88 or 23.76 Gbit/s
Number of links Up to 16 Up to 24 Up to 8
Physical layer
Transmission
Medium
Single-mode
Optical fibre
Multi-mode
Optical fibre Coaxial cable
Single-mode or
Multi-mode
Optical fibre
Number of
fibres/cables 1 (DWDM) 24 Up to 8
1 (CWDM) or
up to 8 (single
λ per fibre)
Connector LC/PC
simplex/duplex MPO BNC
LC/PC
simplex/duplex
Transmission
distance < 2 km < 100 m
< 100 m (6G)
< 70 m (12G)
< 30 m (24G)
< 100 m (MM)
< 4 km (SM)
Example applications Inter-studio In-studio In-studio In-studio or
Inter-studio
BNC: Backbone network connection
CWDM: Coarse wavelength division multiplex
DWDM: Dense wavelength division multiplex
LC/PC: Lucent connector
MPO: Multiple-fibre push-on/pull-off
NOTE 2 – Throughout this Recommendation ‘h’ indicates a number in hexadecimal notation and
‘(10)’ indicates a number in decimal notation.
NOTE 3 – The source ultra-high definition television (UHDTV) image sample structures for the
interface are defined in Recommendation ITU-R BT.2020 and are listed in Table 2. UHDTV has an
image format (sample structure) of 3 840 × 2 160 (UHDTV1) or 7 680 × 4 320 (UHDTV2).

Rec. ITU-R BT.2077-0 3
TABLE 2
Image sample structures and frame frequencies of UHDTV systems supported
by this Recommendation
System
category System nomenclature
Luma or R′ G′ B′
samples per line
Lines per
frame
Frame frequency
(Hz)
UHDTV1
3 840 × 2 160/23.98/P
3 840 2 160
24/1.001
3 840 × 2 160/24/P 24
3 840 × 2 160/25/P 25
3 840 × 2 160/29.97/P 30/1.001
3 840 × 2 160/30/P 30
3 840 × 2 160/50/P 50
3 840 × 2 160/59.94/P 60/1.001
3 840 × 2 160/60/P 60
3 840 × 2 160/100/P 100
3 840 × 2 160/119.88/P 120/1.001
3 840 × 2 160/120/P 120
UHDTV2
7 680 × 4 320/23.98/P
7 680 4 320
24/1.001
7 680 × 4 320/24/P 24
7 680 × 4 320/25/P 25
7 680 × 4 320/29.97/P 30/1.001
7 680 × 4 320/30/P 30
7 680 × 4 320/50/P 50
7 680 × 4 320/59.94/P 60/1.001
7 680 × 4 320/60/P 60
7 680 × 4 320/100/P 100
7 680 × 4 320/119.88/P 120/1.001
7 680 × 4 320/120/P 120

4 Rec. ITU-R BT.2077-0
PART 1
1 Definition of terms
ANC Ancillary data packets
UHDTV Ultra-high definition television, having an image format (sample structure)
of 3 840 × 2 160 or 7 680 × 4 320
UHDTV1 UHDTV having an image format (sample structure) of 3 840 × 2 160
UHDTV2 UHDTV having an image format (sample structure) of 7 680 × 4 320
CRC Cyclic redundancy check codes defined in Recommendation ITU-R BT.1120
CDR Clock data recovery
EAV The term EAV used in Part 1 of this Recommendation designates 4 bytes
of timing information around an end of active video area
HANC data Data included in the digital line blanking interval between EAV/LN/CRC and
SAV
K28.5 Special code for the word boundary detection of 8B/10B coding defined in
ANSI INCITS 230
LN Line number data defined in Recommendation ITU-R BT.1120
Container format The pixel array present on the interface to transport images
(for Part 1 of this Recommendation the container is 1 920 × 1 080)
SAV Timing information around a start of active video area defined in
Recommendation ITU-R BT.1120
Basic stream A 10-bit parallel stream which has the same structure as the source data
stream defined in Recommendation ITU-R BT.1120 This interleaved data
stream carries the image structure defined in the source format data defined in
Recommendation ITU-R BT.1120
Even basic stream Channel CH2, CH4, CH6 and CH8 (Link Bs) of basic streams defined in
Annex B to Part 1 § B1.4 (Mode D)
Odd basic stream CH1, CH3, CH5 and CH7 (Link As) of basic streams defined in Annex B to
Part 1 § B1.4 (Mode D)
Stuffing data Designates one of the data byte D0.0 of 8B/10B coding defined in
ANSI INCITS 230
2 Basic system overview
For UHDTV1, two images should be mapped into 4 or 8 or 16 or 32 sub-images through 2-sample
or 2-frame interleave division in the case of 100 Hz and 120 Hz and should be mapped into
single-link, dual-link, quad-link, octa-link or sixteen-link 10G-HDSDI Mode D defined in Annex B
to Part 1 through basic streams that comply with 1.5 Gbit/s Serial Digital Interface defined in
Recommendation ITU-R BT.1120 as shown in Fig. 1-1. Switching interface signals mapped
according to Part 1 of this Recommendation is restricted to a maximum of 60 Hz. Base band
switching is not constrained.

Rec. ITU-R BT.2077-0 5
When embedding optional ANC data, the ANC data packet format should be in conformance with
Recommendation ITU-R BT.1364. Ancillary audio data should be as defined in Recommendation
ITU-R BT.1365 and should be mapped in the following order:
– (1st) CH1 basic stream of 10G-HDSDI Link 1, up to a maximum of 16 channels at a
sampling frequency of 48 kHz or up to a maximum of eight channels at a sampling
frequency of 96 kHz;
– (2nd) CH1 basic stream of 10G-HDSDI Link 2, up to a maximum of 16 channels at a
sampling frequency of 48 kHz or up to a maximum of eight channels at a sampling
frequency of 96 kHz.
The multiple numbers of basic streams conveying the source data of UHDTV images should be
multiplexed and serialized into a single-link or multiple-link 10G-HDSDI as defined in §§ 3 and 4.
FIGURE 1-1
UHDTV mapping overview
Figure 1
1 21 2 1 21 2
1 21 2 1 21 2
3 43 4 3 43 4
1 21 2 1 21 2
10G-HDSDI Link 1
10G-HDSDI Link 2,4,8
or 16
Basic Stream 1
Basic Stream 8
Basic Stream 1
Basic Stream 8
UHDTV1, 2
3 43 4 3 43 4
3 43 4 3 43 4
2-sample or 2-Frame 2-sample
interleave division
HDTV Class Sub Images 1-4 or 1-16 or 1-32
EA
V
SA
VHANC
Data
System 1.1, 2.1~2.5,
4.1~4.3
dfined in
SMPTE ST 435-1
EA
V
SA
VHANC
Data
System 1.1, 2.1~2.5,
4.1~4.3
dfined in
SMPTE ST 435-1
EA
V
SA
VHANC
Data
System 1.1, 2.1~2.5,
4.1~4.3
defined in
Appendix A
EA
V
SA
VHANC
Data
System 1.1, 2.1~2.5,
4.1~4.3
defined in
Annex A
3 UHDTV1 Mapping into single-link or dual-link or quad-link 10G-HDSDI
3.1 Video payload mapping
Table 1-1 shows the image formats which should be divided into four sub-images by 2-sample
interleave division or 2-frame 2-sample interleave division and should be mapped into the
single-link or the dual-link or the quad-link 10G-HDSDI Mode D defined by Annex B to Part 1.
Each sub-image should have the 1 920 × 1 080 image format defined as systems 1.1, 2.1, 2.2, 2.3,
2.4, 2.5, 4.1, 4.2 or 4.3 in Annex A to Part 1, Tables 1-A1, 1-A2 and 1-A3.

6 Rec. ITU-R BT.2077-0
TABLE 1-1
Source image formats of UHDTV1 supported by Part 1 of this Recommendation
System
NumberSystem nomenclature
Sampling Structure/Pixel
DepthFrame frequency Hz
Sub-image format
defined in Annex A to
Part 1
U1.1
3840 × 2160/24/P
3840 × 2160/25/P
3840 × 2160/30/P
3840 × 2160/23.98/P
3840 × 2160/29.97/P
4:2:0 or 4:2:2
(Y’C’B C’R )/10-bit
24, 25 and 30 Progressive
24/1.001, 30/1.001
Progressive
System 1.1
U1.2
3840 × 2160/24/P
3840 × 2160/25/P
3840 × 2160/30/P
3840 × 2160/23.98/P
3840 × 2160/29.97/P
4:4:4 (R’G’B’)/10-bit
24, 25 and 30 Progressive
24/1.001, 30/1.001
Progressive
System 2.2
U1.3
3840 × 2160/24/P
3840 × 2160/25/P
3840 × 2160/30/P
3840 × 2160/23.98/P
3840 × 2160/29.97/P
4:4:4 (R’G’B’)/12-bit
24, 25 and 30 Progressive
24/1.001, 30/1.001
Progressive
System 2.3
U1.4
3840 × 2160/24/P
3840 × 2160/25/P
3840 × 2160/30/P
3840 × 2160/23.98/P
3840 × 2160/29.97/P
4:4:4 (Y’C’B C’R )/10-bit
24, 25 and 30 Progressive
24/1.001, 30/1.001
Progressive
System 2.4
U1.5
3840 × 2160/24/P
3840 × 2160/25/P
3840 × 2160/30/P
3840 × 2160/23.98/P
3840 × 2160/29.97/P
4:2:0, 4:2:2 or 4:4:4
(Y’C’B C’R )/12-bit
24, 25 and 30 Progressive
24/1.001, 30/1.001
Progressive
System 2.5
U1.6
3840 × 2160/50/P
3840 × 2160/60/P
3840 × 2160/59.94/P
4:2:0 or 4:2:2
(Y’C’B C’R )/10-bit
50 and 60 Progressive
60/1.001 Progressive
System 2.1
U1.7
3840 × 2160/50/P
3840 × 2160/60/P
3840 × 2160/59.94/P
4:2:0 or 4:2:2
(Y’C’B C’R )/12-bit
50 and 60 Progressive
60/1.001 Progressive
System 4.1
U1.8
3840 × 2160/50/P
3840 × 2160/60/P
3840 × 2160/59.94/P
4:4:4
(R’G’B’ or Y’C’B C’R )/10-bit
50 and 60 Progressive
60/1.001 Progressive
System 4.2
U1.9
3840 × 2160/50/P
3840 × 2160/60/P
3840 × 2160/59.94/P
4:4:4
(R’G’B’ or Y’C’B C’R )/12-bit
50 and 60 Progressive
60/1.001 Progressive
System 4.3
U1.10 3840 × 2160/120/P4:2:0 or 4:2:2
(Y’C’B C’R )/10-bit120 Progressive System 2.1
U1.11 3840 × 2160/120/P4:2:0 or 4:2:2
(Y’C’B C’R )/12-bit120 Progressive System 4.1
U1.12 3840 × 2160/120/P4:4:4
(R’G’B’ or Y’C’B C’R )/10-bit120 Progressive System 4.2
U1.13 3840 × 2160/120/P4:4:4
(R’G’B’ or Y’C’B C’R )/12-bit120 Progressive System 4.3
U1.14 3840 × 2160/120/P4:2:0 or 4:2:2
(Y’C’B C’R )/10-bit100 Progressive System 2.1
U1.15 3840 × 2160/120/P4:2:0 or 4:2:2
(Y’C’B C’R )/12-bit100 Progressive System 4.1
U1.16 3840 × 2160/120/P4:4:4
(R’G’B’ or Y’C’B C’R )/10-bit100 Progressive System 4.2
U1.17 3840 × 2160/120/P4:4:4
(R’G’B’ or Y’C’B C’R )/12-bit100 Progressive System 4.3
U1.13 3840 × 2160/120/P4:4:4
(R’G’B’ or Y’C’B C’R )/12-bit120/1.001 Progressive System 4.3
U1.12 3840 × 2160/120/P4:4:4
(R’G’B’ or Y’C’B C’R )/10-bit120/1.001 Progressive System 4.2
U1.11 3840 × 2160/120/P4:2:0 or 4:2:2
(Y’C’B C’R )/12-bit120/1.001 Progressive System 4.1
U1.10 3840 × 2160/120/P4:2:0 or 4:2:2
(Y’C’B C’R )/10-bit120/1.001 Progressive System 2.1

Rec. ITU-R BT.2077-0 7
System U1.1 through U1.9 images should be divided and mapped into the active area of sub-images
one through four by 2-sample interleave division as defined by Fig. 1-A4 in Annex A to Part 1.
Sub-images of Systems U1.1 through U1.9 are treated as sub-images of Systems 1.1, 2.2 through
2.5, 2.1 or 4.1 through 4.3 as shown in Table 1-1 and should have the digital sample structure as
defined in Recommendation ITU-R BT.2020.
The 0 components of the 4:2:0 (even-numbered samples on odd-numbered lines of unassigned
C′BC′R) system image data should be assigned 200h (512(10)) in case of a 10-bit system and 800h
(2048(10)) in case of a 12-bit system.
Table 1-A5 in Annex A to Part 1 specifies the relation between the horizontal/vertical pixel number
of the original 3 840 × 2 160 image and the sample/line number of the mapped 1 920 × 1 080
sub-images one, two, three and four by the 2-sample interleave division.
3.2 Single-link 10G-HDSDI for Systems U1.1 to U1.5
In the case of Systems from U1.1 to U1.5 images (3 840 × 2 160/23.98/P, 24/P, 25/P, 29.97/P and
30/P), each sub-image one to four created by the 2-sample interleave division should be divided into
the single-link or the dual-link 1.5 Gbit/s basic stream. Four single-link or dual-link basic streams
from four sub-images should be mapped into the single-link 10G-HDSDI as specified in § B1.4 of
Annex B to Part 1.
3.3 Dual-link 10G-HDSDI for Systems U1.6 to U1.9
In the case of Systems U1.6 through U1.9 images (3 840 × 2 160/50/P, 59.94/P and 60/P), each
sub-image data created by the 2-sample interleave division should be divided into the dual-link
basic stream or the quad-link basic stream with the same structure as the dual-link 1.5 Gbit/s or the
quad-link 1.5 Gbit/s basic streams defined in §§ A1.2 and A1.3 of Annex A to Part 1.
Sub-images one to four generated from System U1.6 images are equivalent to System 2.1 as defined
by Annex A to Part 1 and should be divided into eight basic streams as shown in Fig. 1-2.
FIGURE 1-2
8 way division for System U1.6
System 2.1 defined in
Annex A
Sub Image 2
System 2.1 defined in
Annex A
Sub Image 3
System 2.1 defined in
Annex A
Sub Image 4
Line demultiplexing defined
in§4 of BT.1120
Basic Stream CH 1 (Link A)
Basic Stream CH 2 (Link B)
Basic Stream CH 3 (Link A)
Basic Stream CH 4 (Link B)
Basic Stream CH 5 (Link A)
Basic Stream CH 6 (Link B)
Basic Stream CH 7 (Link A)
Basic Stream CH 8 (Link B)
Sub Image 1 System 2.1 defined in
Annex A
10G-HDSDI Mode D Link 1
10G-HDSDI Mode D Link 2

8 Rec. ITU-R BT.2077-0
Eight basic streams of a virtual interface for System U1.6 should be mapped into dual-link
10G-HDSDI. Basic streams CH1, CH2, CH3 and CH4 should be mapped into CH1, CH3, CH5 and
CH7 (Link As) of 10G-HDSDI Link 1 and basic streams CH5, CH6, CH7 and CH8 should be
mapped into CH1, CH3, CH5 and CH7 (Link As) of 10G-HDSDI Link 2, i.e.:
– basic streams CH1, CH2, CH3 and CH4 should be mapped into CH1, CH3, CH5 and CH7
(Link A) of 10G-HDSDI Link 1;
– basic streams CH5, CH6, CH7 and CH8 should be mapped into CH1, CH3, CH5 and CH7
(Link A) of 10G-HDSDI Link 2.
In the case of System U1.7, U1.8 and U1.9 images, sub-images one to four should be divided into
16 basic streams as shown in Fig. 1-3.
FIGURE 1-3
16 way division for Systems U1.7, U1.8 and U1.9
System 4.1~4.3 defined in
Annex A
Sub Image 1
System 4.1~4.3 defined in
Annex A
Sub Image 2
System 4.1~4.3 defined in
Annex A
Sub Image 3
System 4.1~4.3 defined in
Annex A
Sub Image 4
Line demultiplexing defined in
Figure A2 Annex A
System 2.2, 2.3, 2.5_channel 1
System 2.2, 2.3, 2.5_channel 2
System 2.2, 2.3, 2.5_channel 3
System 2.2, 2.3, 2.5_channel 4
System 2.2, 2.3, 2.5_channel 5
System 2.2, 2.3, 2.5_channel 6
System 2.2, 2.3, 2.5_channel 7
System 2.2, 2.3, 2.5_channel 8
Basic Stream CH 1 (Link A)
Basic Stream CH 2 (Link B)
Basic Stream CH 5 (Link A)
Basic Stream CH 6 (Link B)
Basic Stream CH 9 (Link A)
Basic Stream CH 10 (Link B)
Basic Stream CH 13 (Link A)
Basic Stream CH 14 (Link B)
Basic Stream CH 3 (Link A)
Basic Stream CH 4 (Link B)
Basic Stream CH 7 (Link A)
Basic Stream CH 8 (Link B)
Basic Stream CH 11 (Link A)
Basic Stream CH 12 (Link B)
Basic Stream CH 15 (Link A)
Basic Stream CH 16 (Link B)
Word demultiplexing defined in
Figure A2 of Annex A
System 2.1 defined in
SMPTE ST 435-1
Sub Image 2
System 2.1 defined in
SMPTE ST 435-1
Sub Image 3
System 2.1 defined in
SMPTE ST 435-1
Sub Image 4
Basic Stream CH 1 (Link A)
Basic Stream CH 2 (Link B)
Basic Stream CH 3 (Link A)
Basic Stream CH 4 (Link B)
Basic Stream CH 5 (Link A)
Basic Stream CH 6 (Link B)
Basic Stream CH 7 (Link A)
Basic Stream CH 8 (Link B)
System 2.1 defined in
SMPTE ST 435-1
Sub Image 1
10G-HDSDI Mode D Link 1
10G-HDSDI Mode D Link 2
10G-SDI Mode D Link 1
10G-SDI Mode D Link 2Line demultiplexing defined in
Figure A2 Annex A
10G-HDSDI Mode D defined by Annex B to Part 1 may transmit up to four pairs of the dual-link
1.5 Gbit/s System 2.2, 2.3, 2.4 or 2.5 or up to two pairs of the quad-link 1.5 Gbit/s System 4.1, 4.2
or 4.3 as defined in Annex B to Part 1. In summary, UHDTV1 images of Systems U1.6, U1.7, U1.8
and U1.9 should be transmitted using a dual-link 10G-HDSDI Mode D.
Sixteen basic streams of a virtual interface for Systems U1.7, U1.8 and U1.9 should be mapped into
dual-link 10G-HDSDI. Groups of basic streams CH(8k-7), CH(8k-6), CH(8k-5), CH(8k-4),
CH(8k-3), CH(8k-2), CH(8k-1) and CH(8k), where k is a number from one to two, should be
mapped into CH1, CH2, CH3, CH4, CH5, CH6, CH7 and CH8 of 10G-HDSDI Link (k), i.e.:
– basic streams CH1 through CH8 should be mapped into CH1 through CH8 of 10G-HDSDI
Link 1;
– basic streams CH9 through CH16 should be mapped into CH1 through CH8 of
10G-HDSDI Link 2.

Rec. ITU-R BT.2077-0 9
3.4 Quad-link 10G-HDSDI for Systems U1.10 to U1.17
In the case of Systems U1.10 through U1.17 images (3 840 × 2 160/100/P or 120/P), eight
sub-image data should be created as per four lines by the 2-frame 2-sample interleave division as
shown in Fig. 1-4. Each sub-image should be divided into the dual-link basic stream or the
quad-link basic stream with the same structure as the dual-link 1.5 Gbit/s or the quad link 1.5 Gbit/s
basic streams defined in §§ A1.2 and A1.3 of Annex A to Part 1.
FIGURE 1-4
2-frame 2-sample interleaving of 3 840 × 2 160/100/P or 120/P mapping onto 8ch of 1 920 × 1 080/50/P or 60/P
0
0 3839
2159
1 21 2
3 43 4
5 65 6
7 87 8
UHDTV1 100/P or 120/P Image (First frame)3840x2160/100/P or 120/P shall be mapped
onto the 8ch of 1920x1080/50/P or 60/P as
per 2-Frame 2-sample(4 lines)2 2
3 43 4
6 6
7 87 8
2 2
3 43 4
6 6
7 87 8
2 2
3 43 4
6 6
7 87 8
1 21 2
3 43 4
5 65 6
7 87 8
2 2
3 43 4
6 6
7 87 8
0
2159
First to eight Sub-Images
0 191921991
1125
1 1
EA
V
SAVHANC
Data
21 line
22 line
2 line
38390
1 1
5 5
1 1 1 1
5 5 5 5
1 1
5 5
1 21 2
3 43 4
5 65 6
7 87 8
2 2
3 43 4
6 6
7 87 8
1 1
5 5
1 1
2 2 2 2
2 2 2 2
2 2 2 2
2 2 2 2 2
EA
V
SA
VHANC
Data
2 8 8 8 8
8 8 8 8
8 8 8 8
8 8 8 8
EA
V
SA
VHANC
Data
1125
1919
UHDTV1 100/P or 120/P Image (Second frame)
First
ha
lfS
eco
nd
ha
lf
Data from the first frame is mapped to the
first half of 1920x1080/50/P or 60/P signal
and data from the second frame is second
half of 1920x1080/50/P or 60/P signal
2-frame 2-sample interleave division should be applied to the 3 840 × 2 160/100/P or 120/P images
listed in Table 1-1 (U1.10 through U1.16) and should map two consecutive frames, the first frame
and the second frame, onto the vertical blanking area and the active area of 8ch of
1 920 × 1 080/50/P or 60P signals as per 4 lines. 4N, 4N + 1, 4N + 2 and 4N + 3 lines
(N = 0, 1, 2, 3 … 539) from the first and the second frame should be mapped onto the sub-images 1
and 2, sub-images 3 and 4, sub-images 5 and 6 and sub-images 7 and 8 respectively as per two
consecutive horizontal samples. The first frame should be mapped onto the line number from
22-line to 561-line and the second frame should be mapped onto the line number from 584-line to
1123-line. The vertical line blanking from 1-line to 21-line should be inserted before the first frame
and the vertical blanking from 562-line to 583-line should be inserted between the first frame and
the second frame. Two vertical lines 1124-line and 1125-line should be appended after the second
frame. This division results in equivalent sub-images 1 through 8.
10 Rec. ITU-R BT.2077-0
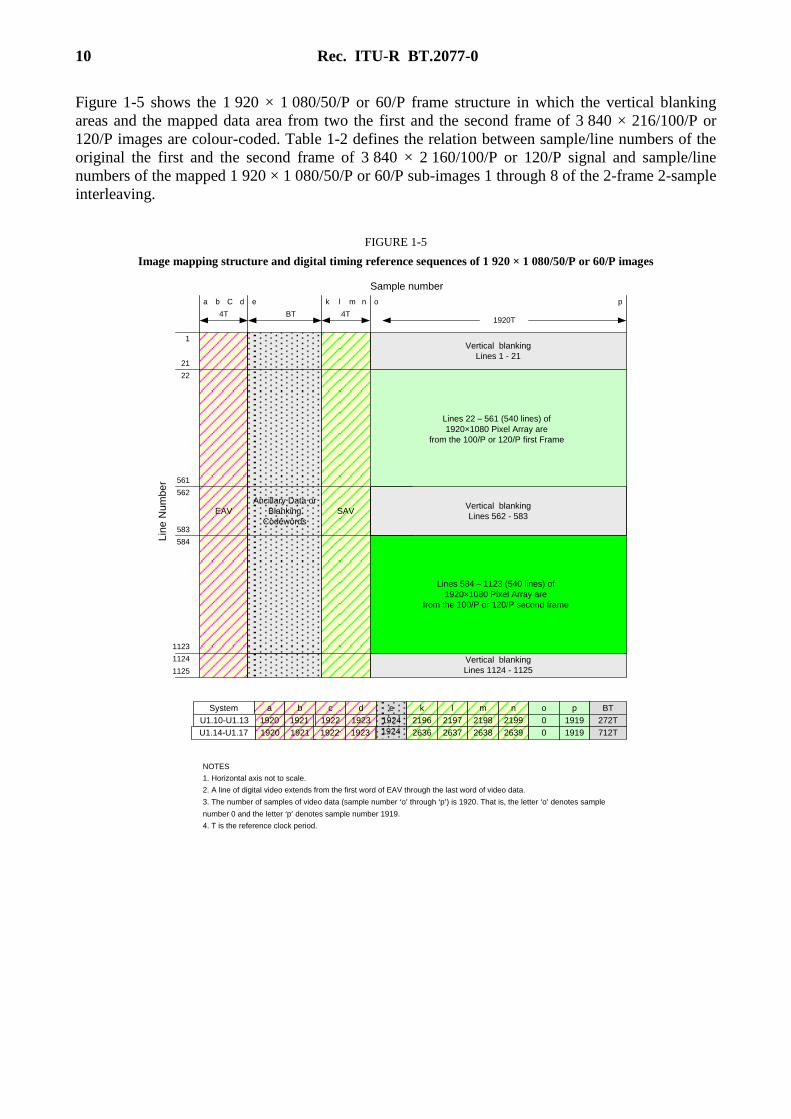
Figure 1-5 shows the 1 920 × 1 080/50/P or 60/P frame structure in which the vertical blanking
areas and the mapped data area from two the first and the second frame of 3 840 × 216/100/P or
120/P images are colour-coded. Table 1-2 defines the relation between sample/line numbers of the
original the first and the second frame of 3 840 × 2 160/100/P or 120/P signal and sample/line
numbers of the mapped 1 920 × 1 080/50/P or 60/P sub-images 1 through 8 of the 2-frame 2-sample
interleaving.
FIGURE 1-5
Image mapping structure and digital timing reference sequences of 1 920 × 1 080/50/P or 60/P images
Ancillary Data or
Blanking
Codewords
Lin
e N
um
be
r
1
21
22
Lines 584 – 1123 (540 lines) of
1920×1080 Pixel Array are
from the 100/P or 120/P second frame
Vertical blanking
Lines 1 - 21
Vertical blanking
Lines 1124 - 1125
EAV SAV
1123
1124
1125
Lines 22 – 561 (540 lines) of
1920×1080 Pixel Array are
from the 100/P or 120/P first Frame
561
562
583
584
Vertical blanking
Lines 562 - 583
NOTES
1. Horizontal axis not to scale.
2. A line of digital video extends from the first word of EAV through the last word of video data.
3. The number of samples of video data (sample number ‘o’ through ‘p’) is 1920. That is, the letter ‘o’ denotes sample
number 0 and the letter ‘p’ denotes sample number 1919.
4. T is the reference clock period.
System a b c d
1920
1921
1922 1923
e k l
1924 2196 2197
m n o p
2198 2199 0 1919U1.10-U1.13
BT
272T
a b C d e k l m n o p
4T BT 4T1920T
Sample number
U1.14-U1.17 1920
1921
1922 1923 1924 2636 2637 2638 2639 0 1919 712T

Rec. ITU-R BT.2077-0 11
TABLE 1-2
Relation between the original image sample/line number from the first and the second frame
and the mapped sub-image sample/line number of 2-frame 2-sample interleave division
Sub-image Original 3 840 × 2 160/100/P or 120/P
sample number
Original 3 840 × 2 160/100/P or 120/P
line number
Mapped 1 920 × 1 080/50/P or 60/P
sample number
Mapped 1 920 × 1 080/50/P or 60/P
line number
1 4M, 4M + 1 samples 4N line
2M, 2M + 1 samples 22 + N line
(from the first frame)
2M, 2M + 1 samples 584 + N line
(from the second frame)
2 4M + 2, 4M + 3 samples 4N line
3 4M, 4M + 1 samples 4N + 1 line
4 4M + 2, 4M + 3 samples 4N + 1 line
5 4M, 4M + 1 samples 4N + 2 line
6 4M + 2, 4M + 3 samples 4N + 2 line
7 4M, 4M + 1 samples 4N + 3 line
8 4M + 2, 4M + 3 samples 4N + 3 line
NOTE – M = 0, 1, 2, 3 ... 959, N = 0, 1, 2, 3 ... 539
Sub-images 1 to 8 generated from Systems U1.10 and U1.14 images are equivalent to System 2.1 as
defined by Annex A to Part 1 and should be divided into 16 basic streams as shown in Fig. 1-6.
FIGURE 1-6
16 way division for System U1.6

12 Rec. ITU-R BT.2077-0
Sixteen basic streams of a virtual interface for Systems U1.10 and U 1.14 should be mapped into
quad-link 10G-HDSDI as follows:
– basic streams CH1, CH2, CH3 and CH4 should be mapped into CH1, CH3, CH5 and CH7
(Link As) of 10G-HDSDI Link 1;
– basic streams CH5, CH6, CH7 and CH8 should be mapped into CH1, CH3, CH5 and CH7
(Link As) of 10G-HDSDI Link 2;
– basic streams CH9, CH10, CH11 and CH12 should be mapped into CH1, CH3, CH5 and
CH7 (Link As) of 10G-HDSDI Link 3;
– basic streams CH13, CH14, CH15 and CH16 should be mapped into CH1, CH3, CH5 and
CH7 (Link As) of 10G-HDSDI Link 4.
In the case of Systems U1.11, U1.12, U1.13, U1.15, U1.16 and U1.17 images, sub-images 1 to 8
should be divided into 32 basic streams as shown in Fig. 1-7.
FIGURE 1-7
32 way division for Systems U1.11, U1.12 and U1.13
System 4.1~4.3 defined in
Annex A
Sub Image 1
System 4.1~4.3 defined in
Annex A
Sub Image 2
System 4.1~4.3 defined in
Annex A
Sub Image 3
System 4.1~4.3 defined in
Annex A
Sub Image 4
Line demultiplexing defined in
Figure A2 of Annex A
System 2.2, 2.3, 2.5_channel 1
System 2.2, 2.3, 2.5_channel 2
System 2.2, 2.3, 2.5_channel 3
System 2.2, 2.3, 2.5_channel 4
System 2.2, 2.3, 2.5_channel 5
System 2.2, 2.3, 2.5_channel 6
System 2.2, 2.3, 2.5_channel 7
System 2.2, 2.3, 2.5_channel 8
Basic Stream CH 1 (Link A)
Basic Stream CH 2 (Link B)
Basic Stream CH 5 (Link A)
Basic Stream CH 6 (Link B)
Basic Stream CH 9 (Link A)
Basic Stream CH 10 (Link B)
Basic Stream CH 13 (Link A)
Basic Stream CH 14 (Link B)
Basic Stream CH 3 (Link A)
Basic Stream CH 4 (Link B)
Basic Stream CH 7 (Link A)
Basic Stream CH 8 (Link B)
Basic Stream CH 11 (Link A)
Basic Stream CH 12 (Link B)
Basic Stream CH 15 (Link A)
Basic Stream CH 16 (Link B)
Word demultiplexing defined in
Figure A2 of Annex A
System 4.1~4.3 defined in
Annex A
Sub Image 5
System 4.1~4.3 defined in
Annex A
Sub Image 6
System 4.1~4.3 defined in
Annex A
Sub Image 7
System 4.1~4.3 defined in
Annex A
Sub Image 8
System 2.2, 2.3, 2.5_channel 9
System 2.2, 2.3, 2.5_channel 10
System 2.2, 2.3, 2.5_channel 11
System 2.2, 2.3, 2.5_channel 12
System 2.2, 2.3, 2.5_channel 13
System 2.2, 2.3, 2.5_channel 14
System 2.2, 2.3, 2.5_channel 15
System 2.2, 2.3, 2.5_channel 16
Basic Stream CH 17 (Link A)
Basic Stream CH 18 (Link B)
Basic Stream CH 21 (Link A)
Basic Stream CH 22 (Link B)
Basic Stream CH 25 (Link A)
Basic Stream CH 26 (Link B)
Basic Stream CH 29 (Link A)
Basic Stream CH 30 (Link B)
Basic Stream CH 19 (Link A)
Basic Stream CH 20 (Link B)
Basic Stream CH 23 (Link A)
Basic Stream CH 24 (Link B)
Basic Stream CH 27 (Link A)
Basic Stream CH 28 (Link B)
Basic Stream CH 31 (Link A)
Basic Stream CH 32 (Link B)
10G-HDSDI Mode D
Link 1
10G-HDSDI Mode D
Link 2
10G-HDSDI Mode D
Link 3
10G-HDSDI Mode D
Link 4

Rec. ITU-R BT.2077-0 13
10G-HDSDI Mode D defined by Annex B to Part 1 may transmit up to four pairs of the dual-link
1.5 Gbit/s System 2.2, 2.3, 2.4 or 2.5 or up to two pairs of the quad-link 1.5 Gbit/s System 4.1, 4.2
or 4.3 as defined in Annex B to Part 1. In summary, UHDTV1 images of Systems U1.10 through
U1.17 should be transmitted using a quad-link 10G-HDSDI Mode D as defined in Annex B to
Part 1.
Thirty-two basic streams of a virtual interface for Systems U1.11, U1.12, U1.13, U1.15, U1.16 and
U1.17 should be mapped into quad-link 10G-HDSDI. Groups of basic streams CH(8k-7), CH(8k-6),
CH(8k-5), CH(8k-4), CH(8k-3), CH(8k-2), CH(8k-1) and CH(8k), where k is a number from 1 to 4,
should be mapped into CH1, CH2, CH3, CH4, CH5, CH6, CH7 and CH8 of 10G-HDSDI Link (k),
i.e.:
– basic streams CH1 through CH8 should be mapped into CH1 through CH8 of 10G-HDSDI
Link 1;
– basic streams CH9 through CH16 should be mapped into CH1 through CH8 of
10G-HDSDI Link 2;
– basic streams CH17 through CH24 should be mapped into CH1 through CH8 of
10G-HDSDI Link 3;
– basic streams CH25 through CH32 should be mapped into CH1 through CH8 of
10G-HDSDI Link 4.
3.5 Optical interface characteristics
The optical interface characteristics of the single-link, the dual-link and the quad-link 10G-HDSDI
should be in conformance with Annex C to Part 1.
When transporting the dual-link 10G-HDSDI signal through a single single-mode fibre, the WDM
or the DWDM technology may be used. The nominal wavelengths of 1310 nm and 1550 nm should
be assigned to the Link 1 and 2 for the WDM transport in conformance with Annex C to Part 1.
When using DWDM technology, the approximate nominal central wavelengths of 1557.36 nm and
1556.55 nm should be assigned to the Link 1 and 2 as listed in Table 1-3. The approximate nominal
central wavelengths of 1557.36 nm, 1556.55 nm, 1555.75 nm and 1554.94 nm should be assigned
for the Link 1 through 4 for the 4ch DWDM interfaces.
TABLE 1-3
Nominal central wavelengths of 2ch and 4ch DWDM interface for UHDTV1
Link No. Approximate nominal central
wavelengths for 2ch DWDM
Approximate nominal central
wavelengths for 4ch DWDM
1 1557.36 nm 1557.36 nm
2 1556.55 nm 1556.55 nm
3 1555.75 nm
4 1554.94 nm

14 Rec. ITU-R BT.2077-0
3.6 ANC/audio data mapping
3.6.1 ANC data mapping
Ancillary data if present should be mapped into the blanking area of CH1 basic stream of
10G-HDSDI. The data format should be in conformance with Recommendation ITU-R BT.1364.
In the case of the dual-link and the quad-link 10G-HDSDI, the ANC data should be mapped into
CH1 basic stream of 10G-HDSDI Link 1 first, and any remaining data should be mapped into CH1
of 10G-HDSDI Link 2 through Link 4 in the order of Link 1, Link 2, Link 3 and Link 4.
3.6.2 Audio data mapping
When present, audio data should be mapped into the C′B/C′R data stream of the horizontal ANC data
space of CH1 basic stream of 10G-HDSDI Link in conformance with Recommendation
ITU-R BT.1365 and should be transmitted in groups of four up to a maximum of 16 channel at a
sampling frequency of 48 kHz or up to a maximum of eight channel at a sampling frequency of
96 kHz.
In the case of the dual-link and the quad-link 10G-HDSDI, CH1 basic stream of 10G-HDSDI
Link 1 should be used first for audio data transmission in groups of four up to a maximum of 16
channels at a sampling frequency of 48 kHz or up to a maximum of 8 channels at a sampling
frequency of 96 kHz in conformance with Recommendation ITU-R BT.1365. If more than 16
channels of audio (8 channels at a sampling frequency of 96 kHz) is required, CH1 basic stream of
10G-HDSDI Link 2 through Link 4 in the order of Link 1, Link 2, Link 3 and Link 4 should be used
in conformance with Recommendation ITU-R BT.1365.
The maximum channel number carried by dual-link and the quad-link 10G-HDSDI Mode D is
32 channels and 64 channels at a sampling frequency of 48 kHz or 16 channels and 32 channels at
a sampling frequency of 96 kHz.
NOTE – Mode D as defined in Annex B to Part 1 can carry the HANC data included in CH1, 3, 5, 7 basic
streams at frame frequencies from 23.98 Hz through 25 Hz. In Part 1 of this Recommendation the audio data
is only mapped into the HANC data space of CH1 basic stream irrespective of frame frequency.
Audio control packets should be mapped into the “Y” data stream of the horizontal ANC data space
of CH1 basic stream of 10G-HDSDI Link 1 and Link 2 through Link 4 (if necessary), and should be
in conformance with Recommendation ITU-R BT.1364.
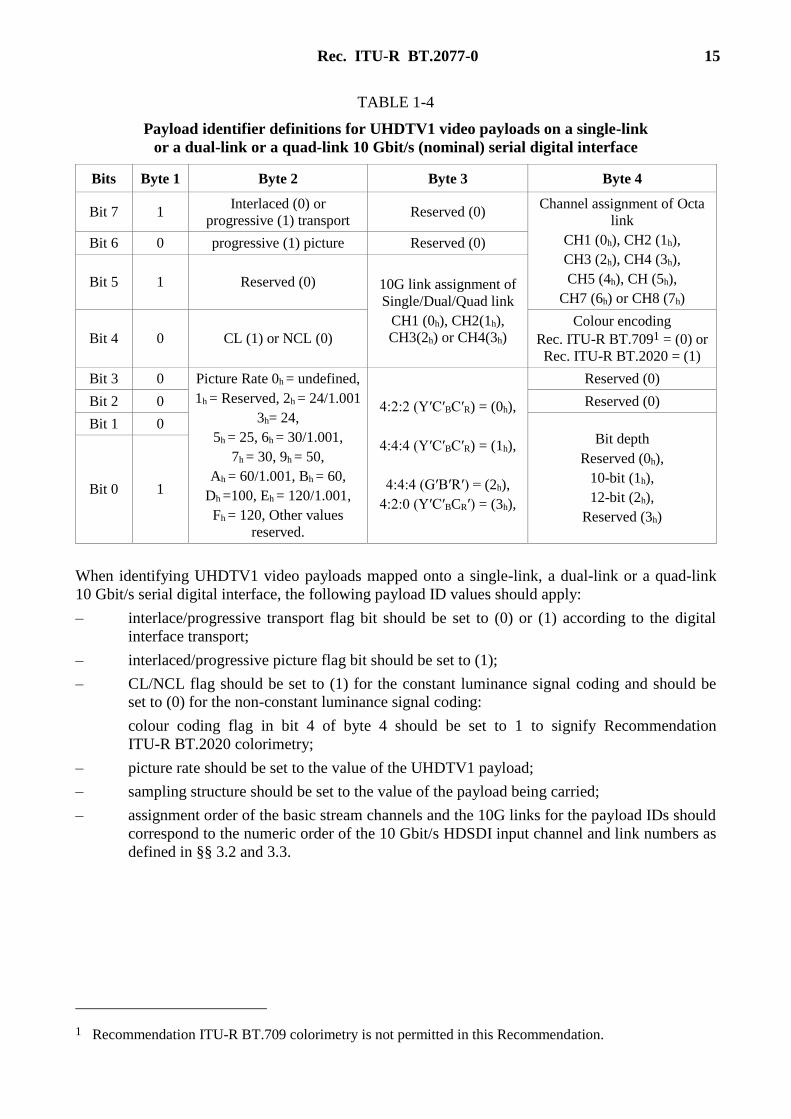
3.6.3 Payload ID mapping
The payload identifier should be mapped into the blanking area of each basic stream of
10G-HDSDIs. Table 1-4 defines the payload identifier for the UHDTV1 video payload.
This payload identifier should be in conformance with the payload identifier format defined in
Recommendation ITU-R BT.1614. The byte 1 value of A1h is mandatory and identifies the video
payload format as UHDTV1. The remaining 3 bytes values specify the other features of the video
payload for UHDTV1 as defined in Part 1 of this Recommendation.
The location of this payload identifier should be in conformance with Annex B to Part 1.
Rec. ITU-R BT.2077-0 15
TABLE 1-4
Payload identifier definitions for UHDTV1 video payloads on a single-link
or a dual-link or a quad-link 10 Gbit/s (nominal) serial digital interface
Bits Byte 1 Byte 2 Byte 3 Byte 4
Bit 7 1 Interlaced (0) or
progressive (1) transport Reserved (0)
Channel assignment of Octa
link
CH1 (0h), CH2 (1h),
CH3 (2h), CH4 (3h),
CH5 (4h), CH (5h),
CH7 (6h) or CH8 (7h)
Bit 6 0 progressive (1) picture Reserved (0)
Bit 5 1 Reserved (0) 10G link assignment of
Single/Dual/Quad link
CH1 (0h), CH2(1h),
CH3(2h) or CH4(3h) Bit 4 0 CL (1) or NCL (0)
Colour encoding
Rec. ITU-R BT.7091 = (0) or
Rec. ITU-R BT.2020 = (1)
Bit 3 0 Picture Rate 0h = undefined,
1h = Reserved, 2h = 24/1.001
3h= 24,
5h = 25, 6h = 30/1.001,
7h = 30, 9h = 50,
Ah = 60/1.001, Bh = 60,
Dh =100, Eh = 120/1.001,
Fh = 120, Other values
reserved.
4:2:2 (Y′C′BC′R) = (0h),
4:4:4 (Y′C′BC′R) = (1h),
4:4:4 (G′B′R′) = (2h),
4:2:0 (Y′C′BCR′) = (3h),
Reserved (0)
Bit 2 0 Reserved (0)
Bit 1 0 Bit depth
Reserved (0h),
10-bit (1h),
12-bit (2h),
Reserved (3h)
Bit 0 1
When identifying UHDTV1 video payloads mapped onto a single-link, a dual-link or a quad-link
10 Gbit/s serial digital interface, the following payload ID values should apply:
– interlace/progressive transport flag bit should be set to (0) or (1) according to the digital
interface transport;
– interlaced/progressive picture flag bit should be set to (1);
– CL/NCL flag should be set to (1) for the constant luminance signal coding and should be
set to (0) for the non-constant luminance signal coding:
colour coding flag in bit 4 of byte 4 should be set to 1 to signify Recommendation
ITU-R BT.2020 colorimetry;
– picture rate should be set to the value of the UHDTV1 payload;
– sampling structure should be set to the value of the payload being carried;
– assignment order of the basic stream channels and the 10G links for the payload IDs should
correspond to the numeric order of the 10 Gbit/s HDSDI input channel and link numbers as
defined in §§ 3.2 and 3.3.
1 Recommendation ITU-R BT.709 colorimetry is not permitted in this Recommendation.

16 Rec. ITU-R BT.2077-0
The 10G channel number in bit b4 and b5 of byte 3 should be set to a value of (0h) in the case of
a single-link or first link and to (1h) for the second link in the case of a dual-link and (0h) for the
first link, (1h) for the second link, (2h) for the third link and (3h) for the fourth link in the case of
a quad-link.
The basic stream channel number in bit b5, b6 and b7 of byte 4 should be set to the following
values:
– – (0h) should identify the first link;
– – (1h) should identify the second link;
– – (2h) should identify the third link;
– – (3h) should identify the fourth link;
– – (4h) should identify the fifth link;
– – (5h) should identify the sixth link;
– – (6h) should identify the seventh link;
– – (7h) should identify the eighth link.
The bit depth of the sample quantization should be identified by bits b0 and b1 of byte 4 having
the following values:
– – (0h) should be reserved;
– – (1h) should identify quantization using 10 bits per sample;
– – (2h) should identify quantization using 12 bits per sample;
– – (3h) should be reserved.
4 UHDTV2 mapping into quad-link or octa-link or sixteen-link 10G-HDSDI
4.1 Video payload mapping
Table 1-5 shows the UHDTV2 image formats which should be divided into four UHDTV1 images
and then should be further divided into 16 or 32 sub-images which have been defined in Annex A
to Part 1 as System 1.1, 2.1, 2.2, 2.3, 2.4, 2.5, 4.1, 4.2 or 4.3 by 2-sample interleave division or
2-frame 2-sample interleave division. Therefore, this division of a UHDTV2 image generates 16 or
32 sub-images which have the 1 920 × 1 080 picture formats and should be mapped into the
quad-link, the octa-link or the sixteen-link of 10G-HDSDI Mode D defined in Annex B to Part 1.
Figure 1-8 shows 2-sample interleave division of UHDTV2 image into four UHDTV1 images by
2-sample interleave division. Even lines of Systems U2.1 through U2.9 images should be divided
into sub-UHDTV1 images 1 and 2 as per two consecutive horizontal samples, and odd lines should
be divided into sub-UHDTV1 images 3 and 4 as per two consecutive horizontal samples.
The 0 components of the 4:2:0 (even-numbered samples on odd-numbered lines of unassigned
C′BC′R) system image data should be assigned 200h (512(10)) in case of a 10-bit system and 800h
(2048(10)) in case of a 12-bit system.

Rec. ITU-R BT.2077-0 17
TABLE 1-5
Source image formats of UHDTV2 supported by Part 1 of this Recommendation
System
NumberSystem nomenclature
Sampling Structure/Pixel
DepthFrame frequency Hz
Sub-image format
defined in Annex A to
Part 1
U2.1
7680 × 4320/24/P
7680 × 4320/25/P
7680 × 4320/30/P
7680 × 4320/23.98/P
7680 × 4320/29.97/P
4:2:0 or 4:2:2
(Y’C’B C’R )/10-bit
24, 25 and 30 Progressive
24/1.001, 30/1.001
Progressive
System 1.1
U2.2 4:4:4 (R’G’B’)/10-bit
24, 25 and 30 Progressive
24/1.001, 30/1.001
Progressive
System 2.2
U2.3 4:4:4 (R’G’B’)/12-bit
24, 25 and 30 Progressive
24/1.001, 30/1.001
Progressive
System 2.3
U2.4 4:4:4 (Y’C’B C’R )/10-bit
24, 25 and 30 Progressive
24/1.001, 30/1.001
Progressive
System 2.4
U2.54:2:0, 4:2:2 or 4:4:4
(Y’C’B C’R )/12-bit
24, 25 and 30 Progressive
24/1.001, 30/1.001
Progressive
System 2.5
U2.6
7680 × 4320/50/P
7680 × 4320/60/P
7680 × 4320/59.94/P
4:2:0 or 4:2:2
(Y’C’B C’R )/10-bit
50 and 60 Progressive
60/1.001 Progressive
System 2.1
U2.74:2:0 or 4:2:2
(Y’C’B C’R )/12-bit
50 and 60 Progressive
60/1.001 Progressive
System 4.1
U2.84:4:4
(R’G’B’ or Y’C’B C’R )/10-bit
50 and 60 Progressive
60/1.001 Progressive
System 4.2
U2.94:4:4
(R’G’B’ or Y’C’B C’R )/12-bit
50 and 60 Progressive
60/1.001 Progressive
System 4.3
7680 × 4320/24/P
7680 × 4320/25/P
7680 × 4320/30/P
7680 × 4320/23.98/P
7680 × 4320/29.97/P
7680 × 4320/24/P
7680 × 4320/25/P
7680 × 4320/30/P
7680 × 4320/23.98/P
7680 × 4320/29.97/P
7680 × 4320/24/P
7680 × 4320/25/P
7680 × 4320/30/P
7680 × 4320/23.98/P
7680 × 4320/29.97/P
7680 × 4320/24/P
7680 × 4320/25/P
7680 × 4320/30/P
7680 × 4320/23.98/P
7680 × 4320/29.97/P
7680 × 4320/50/P
7680 × 4320/60/P
7680 × 4320/59.94/P
7680 × 4320/50/P
7680 × 4320/60/P
7680 × 4320/59.94/P
7680 × 4320/50/P
7680 × 4320/60/P
7680 × 4320/59.94/P
U2.10 7680 × 4320/119.88/P4:2:0 or 4:2:2
(Y’C’B C’R )/10-bit120/1.001 Progressive System 2.1
U2.11 7680 × 4320/120/P4:2:0 or 4:2:2
(Y’C’B C’R )/12-bit120 Progressive System 4.1
U2.12 7680 × 4320/120/P4:4:4
(R’G’B’ or Y’C’B C’R )/10-bit120 Progressive System 4.2
U2.13 7680 × 4320/120/P4:4:4
(R’G’B’ or Y’C’B C’R )/12-bit120 Progressive System 4.3
U2.14 7680 × 4320/100/P4:2:0 or 4:2:2
(Y’C’B C’R )/10-bit100 Progressive System 2.1
U2.15 7680 × 4320/100/P4:2:0 or 4:2:2
(Y’C’B C’R )/12-bit100 Progressive System 4.1
U2.16 7680 × 4320/100/P4:4:4
(R’G’B’ or Y’C’B C’R )/10-bit100 Progressive System 4.2
U2.17 7680 × 4320/100/P4:4:4
(R’G’B’ or Y’C’B C’R )/12-bit100 Progressive System 4.3
U2.13 7680 × 4320/119.88/P4:4:4
(R’G’B’ or Y’C’B C’R )/12-bit120/1.001 Progressive System 4.3
U2.12 7680 × 4320/119.88/P4:4:4
(R’G’B’ or Y’C’B C’R )/10-bit120/1.001 Progressive System 4.2
U2.11 7680 × 4320/119.88/P4:2:0 or 4:2:2
(Y’C’B C’R )/12-bit120/1.001 Progressive System 4.1
U2.10 7680 × 4320/120/P4:2:0 or 4:2:2
(Y’C’B C’R )/10-bit120 Progressive System 2.1

18 Rec. ITU-R BT.2077-0
FIGURE 1-8
2-sample interleave division of UHDTV2 image into UHDTV1 images
4.2 Quad-link 10G-HDSDI for Systems U2.1 to U2.5
Four sub UHDTV1 images generated from System U2.1 should be mapped into quad-link
10G-HDSDI. sub UHDTV1 image k is equivalent to System number 8.2 defined in § A1.4 of
Annex A to Part 1 and should be mapped into CH1, CH3, CH5, CH7 (Link As) of 10G-HDSDI
Link k; i.e.:
– UHDTV1 image 1 should be mapped into CH1, CH3, CH5 and CH7 (Link As) of
10G-HDSDI Link 1;
– UHDTV1 image 2 should be mapped into CH1, CH3, CH5 and CH7 (Link As) of
10G-HDSDI Link 2;
– UHDTV1 image 3 should be mapped into CH1, CH3, CH5 and CH7 (Link As) of
10G-HDSDI Link 3;
– UHDTV1 image 4 should be mapped into CH1, CH3, CH5 and CH7 (Link As) of
10G-HDSDI Link 4.

Rec. ITU-R BT.2077-0 19
Four sub UHDTV1 images generated from Systems U2.2 to U2.5 should be mapped into quad-link
10G-HDSDI. Sub UHDTV1 image k, where k is a number from 1 to 4, should be mapped into
10G-HDSDI Link k in the same way as described in § B1.4 of Annex B to Part 1, i.e.:
– UHDTV1 image 1 should be mapped into CH1 through CH8 of 10G-HDSDI Link 1;
– UHDTV1 image 2 should be mapped into CH1 through CH8 of 10G-HDSDI Link 2;
– UHDTV1 image 3 should be mapped into CH1 through CH8 of 10G-HDSDI Link 3;
– UHDTV1 image 4 should be mapped into CH1 through CH8 of 10G-HDSDI Link 4.
4.3 Octa-link 10G-HDSDI for Systems U2.6 to U2.9
Four sub UHDTV1 images generated from System U2.6 should be mapped into octa-link
10G-HDSDI. Sub UHDTV1 image k, where k is a number from 1 to 4, should be mapped into CH1,
CH3, CH5 and CH7 (Link As) of 10G-HDSDI Link (2k-1) and Link (2k), i.e.:
– UHDTV1 image 1 should be mapped into CH1, CH3, CH5 and CH7 (Link As) of
10G-HDSDI Link 1 and Link 2;
– UHDTV1 image 2 should be mapped into CH1, CH3, CH5 and CH7 (Link As) of
10G-HDSDI Link 3 and Link 4;
– UHDTV1 image 3 should be mapped into CH1, CH3, CH5 and CH7 (Link As) of
10G-HDSDI Link 5 and Link 6;
– UHDTV1 image 4 should be mapped into CH1, CH3, CH5 and CH7 (Link As) of
10G-HDSDI Link 7 and Link 8.
Four sub UHDTV1 images generated from Systems U2.7, U2.8 and U2.9 should be mapped into
octa-link 10G-HDSDI. Sub UHDTV1 image k, where k is a number from 1 to 4, should be
mapped into CH1, CH2, CH3, CH4, CH5, CH6, CH7 and CH8 of 10G-HDSDI Link (2k-1) and
Link (2k), i.e.:
– UHDTV1 image 1 should be mapped into CH1 through CH8 of 10G-HDSDI Link 1 and
Link 2;
– UHDTV1 image 2 should be mapped into CH1 through CH8 of 10G-HDSDI Link 3 and
Link 4;
– UHDTV1 image 3 should be mapped into CH1 through CH8 of 10G-HDSDI Link 5 and
Link 6;
– UHDTV1 image 4 should be mapped into CH1 through CH8 of 10G-HDSDI Link 7 and
Link 8.
4.4 Sixteen-link 10G-HDSDI for Systems U2.10 to U2.17
Four sub UHDTV1 images generated from Systems U2.10 and U2.14 should be mapped into
Sixteen-link 10G-HDSDI. Sub UHDTV1 image k, where k is a number from 1 to 4, should be
mapped into CH1, CH3, CH5 and CH7 (Link As) of 10G-HDSDI Link (4k-3), Link (4k-2),
Link (4k-3) and Link (4k), i.e.:
– UHDTV1 image 1 should be mapped into CH1, CH3, CH5 and CH7 (Link As) of
10G-HDSDI Link 1, Link 2, Link 3 and Link 4;
– UHDTV1 image 2 should be mapped into CH1, CH3, CH5 and CH7 (Link As) of
10G-HDSDI Link 5, Link 6, Link 7 and Link 8;
– UHDTV1 image 3 should be mapped into CH1, CH3, CH5 and CH7 (Link As) of
10G-HDSDI Link 9, Link 10, Link 11 and Link 12;

20 Rec. ITU-R BT.2077-0
– UHDTV1 image 4 should be mapped into CH1, CH3, CH5 and CH7 (Link As) of
10G-HDSDI Link 13, Link 14, Link 15 and Link 16.
Four sub UHDTV1 images generated from Systems U2.11, U2.12 and U2.13, U2.15, U2.16, U2.17
should be mapped into sixteen-link 10G-HDSDI. Sub UHDTV1 image k, where k is a number from
1 to 4, should be mapped into CH1, CH2, CH3, CH4, CH5, CH6, CH7 and CH8 of 10G-HDSDI
Link (4k-3), Link (4k-2), Link (4k-3) and Link (4k), i.e.:
– UHDTV1 image 1 should be mapped into CH1 through CH8 of 10G-HDSDI Link 1,
Link 2, Link 3 and Link 4;
– UHDTV1 image 2 should be mapped into CH1 through CH8 of 10G-HDSDI Link 5,
Link 6, Link 7 and Link 8;
– UHDTV1 image 3 should be mapped into CH1 through CH8 of 10G-HDSDI Link 9,
Link 10, Link 11 and Link 12;
– UHDTV1 image 4 should be mapped into CH1 through CH8 of 10G-HDSDI Link 13,
Link 14, Link 15 and Link 16.
4.5 Optical interface characteristics
The optical interface characteristics of the quad-link, the octa-link and the sixteen-link 10G-HDSDI
should be in conformance with Annex C to Part 1.
DWDM technology may be used for the transport of the quad-link, the octa-link or the sixteen-link
10G-HDSDI. Table 1-6 defines the optical wavelengths of the 4ch, the 8ch and the 16ch DWDM
interfaces. The approximate nominal central wavelengths of 1557.36 nm, 1556.55 nm, 1555.75 nm
and 1554.94 nm should be assigned for the Link 1 through 4 for the 4ch DWDM interfaces,
1557.36 nm, 1556.55 nm, 1555.75 nm, 1554.94 nm, 1554.13 nm, 1553.33 nm, 1552.52 nm and
1551.72 nm should be assigned to the Link 1 through 8 for the 8ch DWDM interfaces and
1557.36 nm, 1556.55 nm, 1555.75 nm, 1554.94 nm, 1554.13 nm, 1553.33 nm, 1552.52 nm,
1551.72 nm, 1550.92 nm, 1550.12 nm, 1549.32 nm, 1548.51 nm, 1547.72 nm, 1546.92 nm,
1546.12 nm and 1545.32 nm should be assigned to the Link 1 through 16 for the 16ch DWDM
interfaces in conformance with Annex C to Part 1.
TABLE 1-6
Nominal central wavelengths of 4ch and 8ch DWDM interfaces for UHDTV2
Link No. Approximate nominal
central wavelengths
for 4ch DWDM
Approximate nominal
central wavelengths
for 8ch DWDM
Approximate nominal
central wavelengths
for 9-16ch DWDM
1 1 557.36 nm 1 557.36 nm 1 557.36 nm
2 1 556.55 nm 1 556.55 nm 1 556.55 nm
3 1 555.75 nm 1 555.75 nm 1 555.75 nm
4 1 554.94 nm 1 554.94 nm 1 554.94 nm
5 1 554.13 nm 1 554.13 nm
6 1 553.33 nm 1 553.33 nm
7 1 552.52 nm 1 552.52 nm
8 1 551.72 nm 1 551.72 nm
9 1 550.92 nm
10 1 550.12 nm

Rec. ITU-R BT.2077-0 21
TABLE 1-6 (end)
Link No. Approximate nominal
central wavelengths
for 4ch DWDM
Approximate nominal
central wavelengths
for 8ch DWDM
Approximate nominal
central wavelengths
for 9-16ch DWDM
11 1 549.32 nm
12 1 548.51 nm
13 1 547.72 nm
14 1 546.92 nm
15 1 546.12 nm
16 1 545.32 nm
4.6 ANC/audio data mapping
4.6.1 ANC data mapping
If present, optional ANC data should be mapped into the blanking area of each CH1 basic stream
of 4 (or 8 or 16) 10G-HDSDI Links. The data format should be in conformance with
Recommendation ITU-R BT.1364.
The ANC data should be mapped into CH1 basic stream of 10G-HDSDI Link 1 first, and any
remaining data should be mapped into CH1 of 10G-HDSDI Link 2 through Link 4 (or Link 8 or
Link 16) in ascending order.
4.6.2 Audio data mapping
When present, audio data should be mapped into the C′B/C′R data streams of the HANC data
space in conformance with Recommendation ITU-R BT.1365 and should be mapped in the
following order:
– (1st) CH1 basic stream of 10G-HDSDI Link 1, up to a maximum of 16 channels at
a sampling frequency of 48 kHz or up to a maximum of 8 channels at a sampling frequency
of 96 kHz;
– (2nd) CH1 basic stream of 10G-HDSDI Link 2, up to a maximum of 16 channels at
a sampling frequency of 48 kHz or up to a maximum of 8 channels at a sampling frequency
of 96 kHz;
– (3rd) CH1 basic stream of 10G-HDSDI Link 3, up to a maximum of 16 channels at
a sampling frequency of 48 kHz or up to a maximum of 8 channels at a sampling frequency
of 96 kHz;
– (4th) (or 8th in the case of octa-link or 16th in the case of sixteen-link) CH1 basic stream of
10G-HDSDI Link 4 (or 8 or 16), up to a maximum of 16 channels at a sampling frequency
of 48 kHz or up to a maximum of 8 channels at a sampling frequency of 96 kHz.
Audio data should be mapped into the CH1 basic stream of 10G-HDSDI Link 1 first, up to its
maximum transmission capacity of HANC data space, then into the CH1 basic stream of
10G-HDSDI Link 2, up to its maximum transmission capacity of HANC data space and so on.
It should not be permitted to map audio data into the CH1 basic streams of 10G-HDSDI Link
(n; n = 2 ~ 4 (or 8 or 16)), if the CH1 basic stream of 10G-HDSDI Link (n – 1) is not filled up to its
maximum transmission capacity.

22 Rec. ITU-R BT.2077-0
The maximum channel number carried by quad-link 10G-HDSDI Mode D is 64 channels at a
sampling frequency of 48 kHz or 32 channels at a sampling frequency of 96 kHz. The maximum
channel number carried by octa-link and sixteen-link 10G-HDSDI is 128 channels and 256 channels
at a sampling frequency of 48 kHz or 64 channels and 128 channels at a sampling frequency of
96 kHz.
NOTE – Mode D defined in Annex B to Part 1 can carry the HANC data included in CH1, 3, 5, 7 basic
streams at frame frequencies from 23.98 Hz through 25 Hz. In Part 1 of this Recommendation the audio data
is only mapped into the HANC data space of CH1 basic stream irrespective of frame frequency.
Audio control packets should be mapped into the Y′ data streams of the HANC data space of CH1
of 10G-HDSDI Link 1 through Link 4 (or 8 or 16) (if necessary), and should be in conformance
with Recommendation ITU-R BT.1365.
4.6.3 Payload ID mapping
The payload identifier should be mapped into the blanking area of each basic stream of
10G-HDSDIs. Table 1-7 defines the payload identifier for the UHDTV2 video payload.
This payload identifier should be in conformance with the payload identifier format defined in
Recommendation ITU-R BT.1614. The byte 1 value of A2h is mandatory and identifies the video
payload format as UHDTV2. The remaining 3 bytes values specify the other features of the video
payload for UHDTV2 as defined in Part 1 of this Recommendation.
The location of this payload identifier should be in conformance with Annex B to Part 1.
TABLE 1-7
Payload identifier definitions for UHDTV2 video payloads on a quad-link, an octa-link or
a sixteen-link 10 Gbit/s (nominal) serial digital interface
Bits Byte 1 Byte 2 Byte 3 Byte 4
Bit 7 1 Interlaced (0) or
progressive (1) transport 10G channel assignment of quad/octa/16 link
CH1 (0h), CH2(1h)
CH3 (2h), CH4 (3h),
CH5 (4h), CH6 (5h),
CH7 (6h), CH8 (7h)
... CH16(Fh)
Channel assignment
of octa link
CH1 (0h), CH2 (1h),
CH3 (2h), CH4 (3h),
CH5 (4h), CH6 (5h),
CH7 (6h) or CH8 (7h)
Bit 6 0 Progressive (1) picture
Bit 5 1 Reserved (0)
Bit 4 0 CL (1) or NCL (0)
Colour encoding
Rec. ITU-R BT.7092 (0) or
Rec. ITU-R BT.2020 (1)
Bit 3 0 Picture Rate 0h = undefined,
1h = Reserved, 2h = 24/1.001
3h = 24,
5h = 25, 6h = 30/1.001,
7h = 30, 9h = 50,
Ah = 60/1.001, Bh = 60,
Dh = 100, Eh = 120/1.001
Fh = 120,
Other values reserved
4:2:2 (Y′C′BC′R) = (0h),
4:4:4 (Y′C′BC′R) = (1h),
4:4:4 (G′B′R′) = (2h),
4:2:0 (Y′C′BC′R) = (3h),
Reserved (0)
Bit 2 0 Reserved (0)
Bit 1 1
Bit depth
Reserved (0h), 10-bit (1h),
12-bit (2h),
Reserved (3h)
Bit 0 0
2 Recommendation ITU-R BT.709 colorimetry is not permitted in this Recommendation.

Rec. ITU-R BT.2077-0 23
When identifying UHDTV2 video payloads mapped onto a quad-link, an octa-link or a sixteen-link
10 Gbit/s serial digital interface, the following payload ID values should apply, the:
– interlace/progressive transport flag bit should be set to (0) or (1) according to the digital
interface transport;
– interlaced/progressive picture flag bit should be set to (1);
– CL/NCL flag should be set to (1) for the constant luminance signal coding and should be
set to (0) for the non-constant luminance signal coding;
– picture rate should be set to the value of the UHDTV2 video payload;
– The colour coding flag in bit 4 of byte 4 should be set to (1) to signify Recommendation
ITU-R BT.2020 colorimetry;
– sampling structure should be set to the value of the payload being carried;
– assignment order of the basic stream channels and the 10G links for the payload IDs should
correspond to the order of the 10 Gbit/s HDSDI input channel and link numbers as defined
in §§ 4.2 and 4.3.
For quad-link the 10G channel number in bit b4, b5, b6 and b7 of byte 3 should be set to the
following values:
– – (0h) should identify the first link;
– – (1h) should identify the second link;
– – (2h) should identify the third link;
– – (3h) should identify the fourth link.
For octa-link the 10G channel number in bit b4, b5, b6 and b7 of byte 3 should be set to the
following values:
– – (0h) should identify the first link;
– – (1h) should identify the second link;
– – (2h) should identify the third link;
– – (3h) should identify the fourth link;
– – (4h) should identify the fifth link;
– – (5h) should identify the sixth link;
– – (6h) should identify the seventh link;
– – (7h) should identify the eighth link.
The 10G channel number in bit b4, b5, b6 and b7 of byte 3 should be set to the following values in
the case of a sixteen-link:
– – (0h) should identify the first link;
– – (1h) should identify the second link;
– – (2h) should identify the third link;
– – (3h) should identify the fourth link;
– – (4h) should identify the fifth link;
– – (5h) should identify the sixth link;
– – (6h) should identify the seventh link;
– – (7h) should identify the eighth link.
– – (8h) should identify the ninth link;
– – (9h) should identify the tenth link;

24 Rec. ITU-R BT.2077-0
– – (Ah) should identify the 11th link;
– – (Bh) should identify the 12th link;
– – (Ch) should identify the 13th link;
– – (Dh) should identify the 14th link;
– – (Eh) should identify the 15th link;
– – (Fh) should identify the 16th link.
The basic stream channel number in bit b5, b6 and b7 of byte 4 should be set to the following
values:
– – (0h) should identify the first link;
– – (1h) should identify the second link;
– – (2h) should identify the third link;
– – (3h) should identify the fourth link;
– – (4h) should identify the fifth link;
– – (5h) should identify the sixth link;
– – (6h) should identify the seventh link;
– – (7h) should identify the eighth link.
The bit depth of the sample quantization should be identified by bits b0 and b1 of byte 4 having the
following values:
– – (0h) reserved
– – (1h) should identify quantization using 10 bits per sample;
– – (2h) should identify quantization using 12 bits per sample;
– – (3h) reserved.
Rec. ITU-R BT.2077-0 25
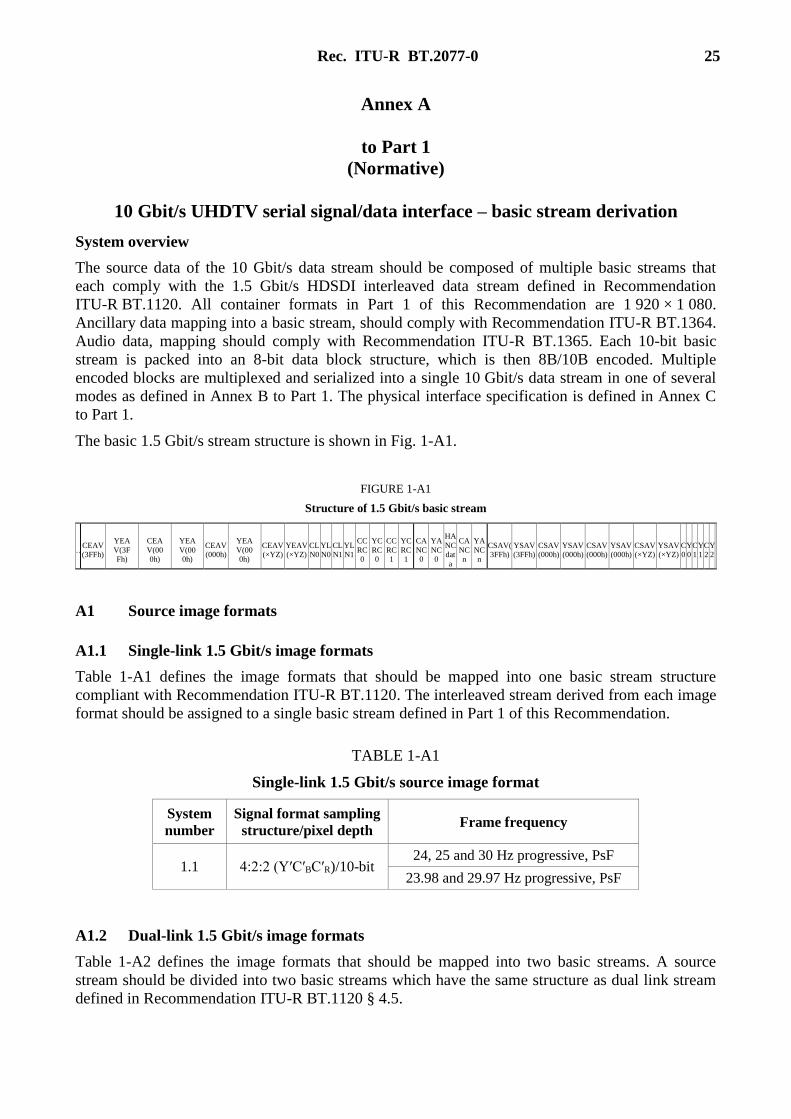
Annex A
to Part 1
(Normative)
10 Gbit/s UHDTV serial signal/data interface – basic stream derivation
System overview
The source data of the 10 Gbit/s data stream should be composed of multiple basic streams that
each comply with the 1.5 Gbit/s HDSDI interleaved data stream defined in Recommendation
ITU-R BT.1120. All container formats in Part 1 of this Recommendation are 1 920 × 1 080.
Ancillary data mapping into a basic stream, should comply with Recommendation ITU-R BT.1364.
Audio data, mapping should comply with Recommendation ITU-R BT.1365. Each 10-bit basic
stream is packed into an 8-bit data block structure, which is then 8B/10B encoded. Multiple
encoded blocks are multiplexed and serialized into a single 10 Gbit/s data stream in one of several
modes as defined in Annex B to Part 1. The physical interface specification is defined in Annex C
to Part 1.
The basic 1.5 Gbit/s stream structure is shown in Fig. 1-A1.
FIGURE 1-A1
Structure of 1.5 Gbit/s basic stream
… CEAV
(3FFh) YEA
V(3F
Fh)
CEA
V(00
0h)
YEA
V(00
0h) CEAV
(000h) YEA
V(00
0h) CEAV
(×YZ) YEAV
(×YZ) CL
N0 YL
N0 CL
N1 YL
N1 CC
RC
0
YC
RC
0
CC
RC
1
YC
RC
1
CA
NC
0
YA
NC
0
HA
NC
dat
a
CA
NC
n
YA
NC
n CSAV(
3FFh) YSAV
(3FFh) CSAV
(000h) YSAV
(000h) CSAV
(000h) YSAV
(000h) CSAV
(×YZ) YSAV
(×YZ) C
0 Y
0 C
1 Y
1 C
2 Y
2 :
A1 Source image formats
A1.1 Single-link 1.5 Gbit/s image formats
Table 1-A1 defines the image formats that should be mapped into one basic stream structure
compliant with Recommendation ITU-R BT.1120. The interleaved stream derived from each image
format should be assigned to a single basic stream defined in Part 1 of this Recommendation.
TABLE 1-A1
Single-link 1.5 Gbit/s source image format
System
number
Signal format sampling
structure/pixel depth Frame frequency
1.1 4:2:2 (Y′C′BC′R)/10-bit 24, 25 and 30 Hz progressive, PsF
23.98 and 29.97 Hz progressive, PsF
A1.2 Dual-link 1.5 Gbit/s image formats
Table 1-A2 defines the image formats that should be mapped into two basic streams. A source
stream should be divided into two basic streams which have the same structure as dual link stream
defined in Recommendation ITU-R BT.1120 § 4.5.

26 Rec. ITU-R BT.2077-0
TABLE 1-A2
Dual-link 1.5 Gbit/s source image formats
System
number
Signal format sampling
structure/pixel depth Frame/field frequency
2.1 4:2:2 (Y′C′BC′R)/10-bit
50 and 60 Hz progressive
59.94 Hz progressive
47.95 and 59.94 Hz progressive
2.2 4:4:4 (R′G′B′), 4:4:4:4
(R′G′B′+A)/10-bit
24, 25,and 30 Hz progressive, PsF
23.98 and 29.97 Hz progressive, PsF
2.3 4:4:4 (R′G′B′)/12-bit 24, 25 and 30 Hz progressive, PsF
23.98 and 29.97 Hz progressive, PsF
2.4 4:4:4 (Y′C′BC′R)/10-bit,
4:4:4:4 (Y′C′BC′R + A)/10-bit
24, 25 and 30 Hz progressive, PsF
23.98 and 29.97 Hz progressive, PsF
2.5 4:2:2 (Y′C′BC′R), 4:4:4
(Y′C′BC′R)/12-bit
24, 25 and 30 Hz progressive, PsF
50 and 60 Fields/s Interlace
23.98 and 29.97 Hz progressive, PsF
A1.3 Quad-link 1.5 Gbit/s image formats
Table 1-A3 defines the image formats that should be mapped into four basic streams as defined in
§ A1.3.1.
TABLE 1-A3
Quad-link 1.5 Gbit/s source image formats
System
number
Signal format sampling
structure/pixel depth Frame/field frequency
4.1 4:2:2 (Y′C′BC′R)/12-bit 50 and 60 Hz progressive
59.94 Hz progressive
4.2 4:4:4 (R′G′B′), 4:4:4:4
(R′G′B′+A)/10-bit
50 and 60 Hz progressive
59.94 Hz progressive
4.3 4:4:4 (R′G′B′)/12-bit 50 and 60 Hz progressive
59.94 Hz progressive

Rec. ITU-R BT.2077-0 27
A1.3.1 Four way division of source data
A pair of frames as defined in Table 1-A3 should be divided and mapped into two sub-images
equivalent to the System 2.2, 2.3 or System 2.5 image data using the line de-multiplexing method
defined in § 4.5 of Recommendation ITU-R BT.1120. Each of these sub-images should be word
de-multiplexed into two basic streams. In this Annex, sub-image should have the active digital
sample structure as defined in Recommendation ITU-R BT.709.
Figure 1-A2 defines 4 way division of the System 4.1, 4.2 and 4.3 streams.
FIGURE 1-A2
Four way division for source stream of Systems 4.1, 4.2, and 4.3
As shown in Fig 4 Rec BT 1120 As shown in Fig 11 Rec BT 1120
As shown in Fig 4 Rec BT 1120 As shown in Fig 7 Rec BT 1120
As shown in Fig 4 Rec BT 1120 As shown in Fig 9 Rec BT 1120

28 Rec. ITU-R BT.2077-0
A1.4 Octa-link 1.5 Gbit/s
Table 1-A4 lists the image formats that should be mapped into eight basic streams. Each of the 4K
image formats listed in Table 1-A4 should be divided and mapped to the active area of four 2K
sub-images by one of two methods and then each sub-image converted into two basic streams. The detail
of the process is defined in § A1.4.1.
TABLE 1-A4
Octa-link 1.5 Gbit/s source image formats
System
number Picture format
Signal format sampling
structure/pixel depth Frame/field frequency
8.2 3 840 × 2 160 4:2:0 (Y′C′BC′R), 4:2:2
(Y′C′BC′R)/10-bit
24, 25 and 30 Hz progressive
23.98 and 29.97 Hz progressive
8.3 3 840 × 2 160 4:4:4 (R′G′B′)/10-bit 24, 25 and 30 Hz progressive
23.98 and 29.97 Hz progressive
8.4 3 840 × 2 160 4:4:4 (Y′C′BC′R)/10-bit 24, 25 and 30 Hz progressive
23.98 and 29.97 Hz progressive
8.5 3 840 × 2 160 4:2:0 (Y′C′BC′R), 4:2:2
(Y′C′BC′R)/12-bit
24, 25 and 30 Hz progressive
23.98 and 29.97 Hz progressive
8.6 3 840 × 2 160 4:4:4 (R′G′B′)/12-bit 24, 25 and 30 Hz progressive
23.98 and 29.97 Hz progressive
8.7 3 840 × 2 160 4:4:4 (Y′C′BC′R)/12-bit 24, 25 and 30 Hz progressive
23.98 and 29.97 Hz progressive
A1.4.1 Eight way division of source data
Figure 1-A3 shows sample structures of 4:4:4 (R′G′B′) or (Y′C′BC′R), 4:2:2 (Y′C′BC′R) and 4:2:0
(Y′C′BC′R) systems for System 8.2 through 8.7 images defined in Recommendation
ITU-R BT.2020. C′B and C′R signals should be horizontally sub-sampled by a factor of two in case
of a 4:2:2 system and horizontally and vertically sub-sampled by a factor of two in case of a
4:2:0 system.
When transporting 4:2:0 system image data through a transport which has a 4:2:2 data structure,
the 0 components of the 4:2:0 (even-numbered samples on odd-numbered lines of unassigned
C′BC′R) system image data should be assigned 200h (512(10)) in case of a 10-bit system and
800h (2048(10)) in case of a 12-bit system.

Rec. ITU-R BT.2077-0 29
FIGURE 1-A3
Sample structures of 4:4:4 (R′G′B′) or (Y′ C′BC′R), 4:2:2 (Y′C′BC′R) and 4:2:0 (Y′C′BC′R) Systems
0 3839
0
0 3839
2159
0
0 3839
2159
R’G’B’or Y’CB’CR’ 4:4:4 system Y’CB’CR’ 4:2:2 system Y’CB’CR’ 4:2:0 system
0
The active area of a 4K image of the systems listed in Table 1-A4 should be divided and mapped
into the active area of four 2K sub-images equivalent to the System 1.1 or System 2.2 through
System 2.5 image data.
Source image formats listed in Table 1-A4 should be mapped into four sub-images using either
2-sample interleave division as shown in Fig. 1-A4 or square division as shown in Fig. 1-A5.
Figure 1-A3 illustrates how each four sub-images created by 2-sample interleave division has the
same sampling structure 4:4:4 or 4:2:2.
Figure 1-A4 illustrates 2-sample interleave division at 30 Hz which requires less memory size and
the signal processing delay is much less than that of the square division. Even lines of image
formats listed in Table 1-A4 should be divided and mapped to the active area of sub-image 1 and 2
as per 2 consecutive horizontal samples and odd lines should be divided and mapped to the active
area of sub-image 3 and 4 as per 2 consecutive horizontal samples. This division results in
equivalent sub-image 1, 2, 3 and 4.
FIGURE 1-A4
2-sample interleave division to sub-image 1 through 4
0
0 3839
2159
1 21 2 1 21 2
3 43 4 3 43 4
1 21 2 1 21 2
3 43 4 3 43 4
1 21 2 1 21 2
3 43 4 3 43 4
Sub Image 1
Sub Image 2
Sub Image 3
Sub Image 4
(System 1.1, 2.1~2.5,
4.1~4.3
defined in Annex A)
UHDTV1 Class Image2-sample interleave division
HDTV Class Images
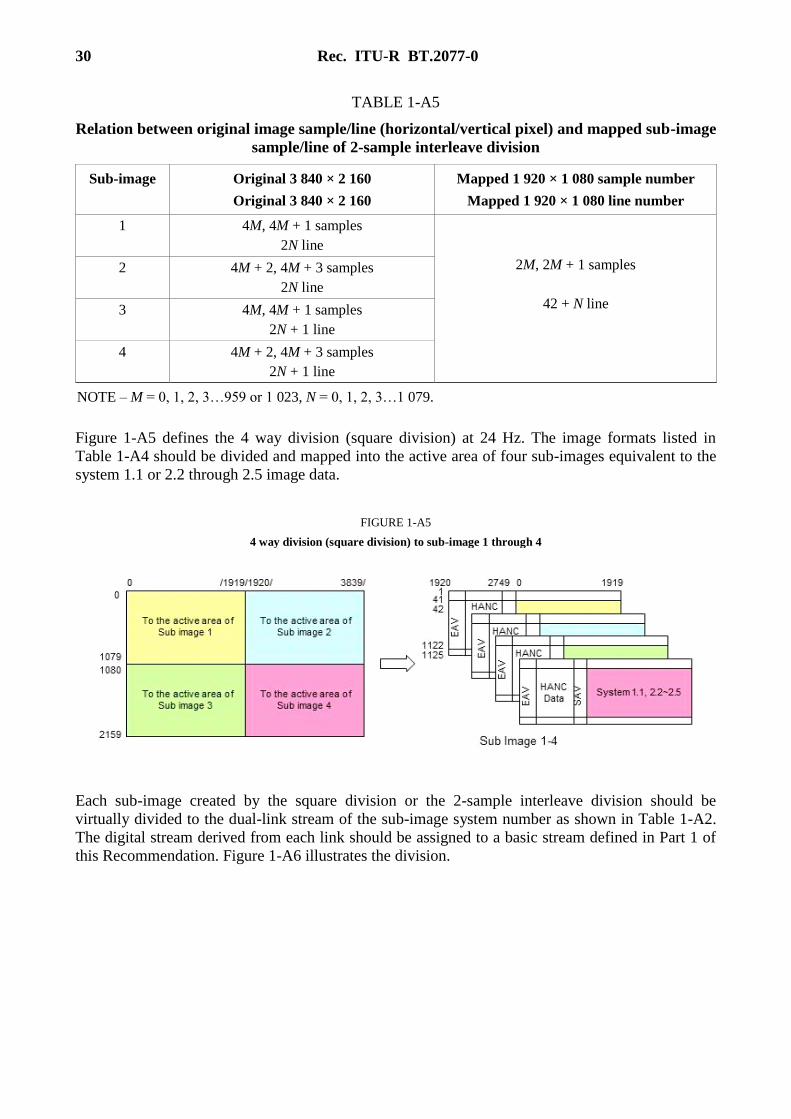
Table 1-A5 defines the relation between sample/line (horizontal/vertical pixel) numbers of the
original 3 840 × 2 160 image and sample/line numbers of the mapped 1 920 × 1 080 sub-image 1, 2,
3 and 4 of the 2-sample interleave division. Each sub-image should be divided and mapped into the
active area as defined in Recommendation ITU-R BT.1120.
30 Rec. ITU-R BT.2077-0
TABLE 1-A5
Relation between original image sample/line (horizontal/vertical pixel) and mapped sub-image
sample/line of 2-sample interleave division
Sub-image Original 3 840 × 2 160
Original 3 840 × 2 160
Mapped 1 920 × 1 080 sample number
Mapped 1 920 × 1 080 line number
1 4M, 4M + 1 samples
2N line
2M, 2M + 1 samples
42 + N line
2 4M + 2, 4M + 3 samples
2N line
3 4M, 4M + 1 samples
2N + 1 line
4 4M + 2, 4M + 3 samples
2N + 1 line
NOTE – M = 0, 1, 2, 3…959 or 1 023, N = 0, 1, 2, 3…1 079.
Figure 1-A5 defines the 4 way division (square division) at 24 Hz. The image formats listed in
Table 1-A4 should be divided and mapped into the active area of four sub-images equivalent to the
system 1.1 or 2.2 through 2.5 image data.
FIGURE 1-A5
4 way division (square division) to sub-image 1 through 4
Each sub-image created by the square division or the 2-sample interleave division should be
virtually divided to the dual-link stream of the sub-image system number as shown in Table 1-A2.
The digital stream derived from each link should be assigned to a basic stream defined in Part 1 of
this Recommendation. Figure 1-A6 illustrates the division.

Rec. ITU-R BT.2077-0 31
FIGURE 1-A6
8 way division
In the case of System 8.2 image (3 840 × 2 160, 4:2:2 or 4:2:0/10-bit), sub-images 1 to 4 are
equivalent to System number 1.1 and Link A should be assigned for the image transmission.
A2 Payload identifier
A payload identifier should be mapped into each basic stream in conformance with
Recommendation ITU-R BT.1614.
A2.1 Payload identifier for 1.5 Gbit/s
The payload identifier for 1.5 Gbit/s should be in conformance with Recommendation
ITU-R BT.1120.
A2.2 Payload identifier for dual-link 1.5 Gbit/s
The payload identifier for dual-link 1.5 Gbit/s should be in conformance with Recommendation
ITU-R BT.1120.
A2.3 Payload identifier for quad-link 1.5 Gbit/s
When identifying 1080-line video payloads mapped onto a quad-link 1.485 Gbit/s serial digital
interface, the following limitations should apply (see Table 1-A6):
– Byte 1 should be set to 90h;
– The picture rate should only use the values permitted for quad-link interfaces in Part 1 of
this Recommendation.
The sampling structure should be set to the value as defined in the payload ID
– Bit 6 of byte 3 should be used to identify 1 920 active Y′/R′G′B′ samples (0);
– the channel number in bit b6 and b7 of byte 4 should be set to a value of 0h for the first link,
to 1h for the second link, to 2h for the third link, and to 3h for the fourth link;
– the bit depth should be identified by bits b0 and b1 of byte 4 having the following values:
• 0h reserved;
• 1h should identify quantization using 10 bits per sample;
• 2h should identify quantization using 12 bits per sample.
NOTE – In the case where the bit depth field indicates 12-bits per sample, these bits have been mapped into
a 10-bit interface.

32 Rec. ITU-R BT.2077-0
TABLE 1-A6
Payload identifier definitions for 1080-line video payloads on a quad-link 1.485 Gbit/s
(nominal) serial digital interface
Bits Byte 1 Byte 2 Byte 3 Byte 4
Bit 7 1 Interlaced (0) or
progressive (1)
transport
Reserved Channel assignment
CH1 (0h), CH2 (1h),
CH3 (2h) or CH4 (3h) Bit 6 0
Interlaced (0) or
progressive (1)
picture
Horizontal sampling
1 920 (0) Reserved (1)
Bit 5 0 Reserved (0) Aspect Ratio 16:9 (1)
Unknown (0) Reserved (0)
Bit 4 1 CL (1) or NCL (0) Reserved (0)
Colour coding
Rec. ITU-R BT.709 = (0)3,
Rec. ITU-R BT.2020 = (1)
Bit 3 0 Picture Rate
0h = undefined,
1h = Reserved,
2h = 24/1.001
3h = 24,
5h = 25,
6h = 30/1.001,
7h = 30, 9h = 50,
Ah = 60/1.001,
Bh = 60,
Dh =100,
Eh = 120/1.001,
Fh = 120
Other values
reserved.
4:2:2 (Y′C′BC′R) = (0h),
4:4:4 (Y′C′BC′R) = (1h),
4:4:4 (G′B′R′) = (2h),
4:2:0 (Y′C′BC′R) = (3h)
Reserved (0)
Bit 2 0 Reserved (0)
Bit 1 0
Bit depth
Reserved (0h), 10-bit (1h),
12-bit (2h),
Reserved (3h)
Bit 0 0
3 Recommendation ITU-R BT.709 colorimetry is not permitted in this Recommendation.

Rec. ITU-R BT.2077-0 33
A2.4 Payload identifier for octa-link 1.5 Gbit/s
When identifying 1080-line video payloads mapped onto an octa-link 1.485 Gbit/s serial digital
interface, the following limitations should apply (see Table 1-A7):
– byte 1 should be set to A0h;
– the picture rate should only use the values as permitted for octa-link interfaces in § A1.4.
The sampling structure should be set to the value as defined in the payload ID. This should include
the use of the alpha channel as a carrier of data as well as video.
– bit 6 of byte 3 should be used to identify 1920 active Y′/R′G′B′ samples (0);
– the channel number in bit b5, b6 and b7 of byte 4 should be set to the following values:
• (0h) should identify the first link;
• (1h) should identify the second link;
• (2h) should identify the third link;
• (3h) should identify the fourth link;
• (4h) should identify the fifth link;
• (5h) should identify the sixth link;
• (6h) should identify the seventh link;
• (7h) should identify the eighth link.
– The bit depth should be identified by bits b0 and b1 of byte 4 having the following values:
• (0h) and (3h) Reserved for this application;
• (1h) should identify quantization using 10 bits per sample;
• (2h) should identify quantization using 12 bits per sample.
NOTE – In the case where the bit depth field indicates 12-bits per sample, these bits have been mapped into
a 10-bit interface.

34 Rec. ITU-R BT.2077-0
TABLE 1-A7
Payload identifier definitions for 1080-line video payloads on an octa-link 1.485 Gbit/s
(nominal) serial digital interface
Bits Byte 1 Byte 2 Byte 3 Byte 4
Bit 7 1 Interlaced (0) or
progressive (1)
transport
Reserved Channel assignment
CH1 (0h), CH2 (1h),
CH3 (2h), CH4 (3h),
CH5 (4h), CH6 (5h),
CH7 (6h) or CH8 (7h)
Bit 6 0
Interlaced (0) or
progressive (1)
picture
Horizontal sampling
1 920 (0)or Reserved (1)
Bit 5 1 Reserved (0) Aspect Ratio 16:9 (1)
Unknown (0)
Bit 4 0 CL (1) or NCL (0) Reserved (0)
Colour encoding
Rec. ITU-R BT.709 = (0)4,
Rec. ITU-R BT.2020 = (1)
Bit 3 0
Picture Rate
0h = undefined,
1h = Reserved,
2h = 24/1.001,
3h = 24, 5h = 25,
6h = 30/1.001,
7h = 30, 9h = 50,
Ah = 60/1.001,
Bh = 60, Dh =100,
Eh = 120/1.001
Fh = 120,
Other values
reserved.
4:2:2 (Y′C′BC′R) = (0h),
4:2:2:4
(Y′/C′B/C′R/A) = (4h),
4:4:4:4
(Y'/C'B/C'R/A) = (5h),
4:4:4:4
(G'B'R'/A) = (6h),
4:4:4 (Y′C′BC′R) = (1h),
4:2:2:4
(Y'/C'B/C'R/D) = (8h),
4:4:4:4
(Y'/C'B/C'R/D) = (9h),
4:4:4:4
(G'B'R'/D) = (Ah),
4:4:4 (G′B′R′) = (2h),
4:2:0 (Y′C′BC′R) = (3h),
Reserved (0)
Bit 2 0 Reserved (0)
Bit 1 0
Bit depth
Reserved (0h),
10-bit (1h),
12-bit (2h),
Reserved (3h)
Bit 0 0
A2.5 Placement of payload identifier
The placement of the payload identifier for each basic stream of 10G-HDSDI should be
immediately after the SAV in the lines defined in Recommendation ITU-R BT.1614.
4 Recommendation ITU-R BT.709 colorimetry is not permitted in this Recommendation.

Rec. ITU-R BT.2077-0 35
Annex B
to Part 1
(Normative)
10 Gbit/s Serial signal/data interface – basic stream data mapping
System overview
This Annex specifies the multiplexing schemes to map up to 8 basic streams defined by Annex A to
Part 1 into the 10 Gbit/s serial interface. The source image formats supported are referenced in
Recommendation ITU-R BT.2020. 100 Hz and 120 Hz frame mappings are fully described in
Part 1. The mapping also supports transmission of the embedded audio, payload ID and other
ancillary data defined in Recommendation ITU-R BT.1364 in the source stream.
Figure 1-B1 shows the overall block diagram of the 10.692 Gbit/s interface which can carry
3 840 × 2 160/30P/4:4:4.
The outline of the data mapping process should be as follows:
– the 10-bit basic streams should be packed into arrays of 8-bit words;
– the generated byte array should be channel coded as 8B/10B encoded data;
– the blocks of encoded data should be interleaved and serialized into the 10.692 Gbit/s serial
stream.
HANC data in some of the basic streams are not interleaved into 10.692 Gbit/s stream in the case of
mapping Mode B, C or D. Details are defined in §§ B1.2, B1.3 and B1.4.
Figure 1-B1 illustrates the signal processing involved at the TX and RX ends of the transport.
Default data values (040h for Y′ data and 200h for C′B/C′R data) should be inserted into unused
HANC data space of a basic stream if it has not been mapped onto the 10.692 Gbit/s stream.

36 Rec. ITU-R BT.2077-0
FIGURE 1-B1
Overall block
B1 Basic stream data mapping
This section defines four data mapping structures. Mode A and Mode B should be used for
System 1.1 through System 4.3 images. Mode D should be used for System 8.2 through System 8.7
images, up to four pairs of System 2.2 through System 2.5 images or up to two pairs of System 4.1
through System 4.3 images. System numbers are defined in Annex A to Part 1.
Transmission of up to five basic streams as defined in Annex A to Part 1 is possible in Mode A, up
to six basic streams is possible in Mode B and up to eight basic streams is possible in Mode D.
All basic streams that are mapped together onto a 10.692 Gbit/s stream should have the same frame
frequency and the same number of horizontal samples per line.
The placement of the ANC data including the payload identifier as defined in Recommendation
ITU-R BT.1614 in the basic streams should be immediately following SAV of the line(s) specified
in Recommendation ITU-R BT.1120.
The word clock frequency of each basic stream, as defined by Annex A to Part 1 and, should be
148.5 MHz or 148.5/1.001 MHz. The word clock frequency should be locked to the serial clock
frequency (10.692 GHz or 10.692/1.001 GHz).
B1.1 5-Channel Mode (Mode A)
Up to five basic streams may be embedded into the 10.692 Gbit/s stream using mapping Mode A.
The mapping should maintain all the information included in each of the five basic streams.
The 8B/10B encoded 50-bit data block data from each basic stream should be multiplexed into a
single stream by the 50-bit block interleaving. The detail of the 50-bit block packing is defined in
§ B1.1.1.
Byte Array Formatter
8B/10B Encoder
Sync Inserter
Data Multiplexer Serializer E to O
Converter
basic stream 1
basic stream 2
basic stream N
10.692 Gbit/s Stream
Transmitter side
O to E Converter
Deserializer
Data Demultiplexer
Sync Separator 8B/10B Decoder
basic stream Generator
basic stream 1
basic stream 2
basic stream N
10.692 Gbit/s
Stream
Receiver side

Rec. ITU-R BT.2077-0 37
The CH1 basic stream data should always be present for encoder and decoder synchronization.
Other channels, when not used for image data, should be filled with stuffing data set to 100h.
Figure 1-B2 illustrates the basic concept of Mode A mapping.
FIGURE 1-B2
Basic stream interleaving for Mode A
B1.1.1 Mode A 50-Bit data blocking and 8B/10B encoding
Four-word (40-bit) data blocks of the source basic stream data starting from the first SAV data
should be used for the blocking process.
Each 40-bit data block should be packed into five 8-bit words and then should be 8B/10B coded as
defined in § 11 of ANSI INCITS 230. Consequently a 50-bit encoded data block should be
generated from a 40-bit source data block. Figure 1-B3 defines the blocking process.
Encoding disparity in a 10.692 Gbit/s stream should be alternated at every 10-bit word. Initial value
of negative disparity should be assigned to CH1 first SAV word of each line.
FIGURE 1-B3
Data alignment and 8B/10B encode process of 4-word data block

38 Rec. ITU-R BT.2077-0
B1.1.2 Data replacement of SAV part of CH1
In the CH1 basic stream, the first 40-bit byte aligned block at the beginning of each SAV should be
replaced by a synchronization block. This process should be executed before 8B/10B encoding and
should be as defined in Fig. 1-B4.
FIGURE 1-B4
SAV data replacement for CH1 data
The first 2 bytes of the byte aligned SAV data should be replaced with two K28.5 special characters
defined in 8B/10B Code, and successive three words of the byte aligned SAV data should be
replaced with the content ID bytes as defined in Table 1-B1.
Table 1-B1 defines the layout of content ID words.
Bit 7 of ID 1 should be set to 0 in the case of the “1 920 × 1 080 basic stream”, 1 is reserved.
Bits 5 and 6 of ID 1 should indicate the mapping structure and should be assigned as defined in
Table 1-B3.
Bits 0 through 4 of ID1 should indicate the System number of CH1 basic stream and should be set
as defined in Table 1-B2.
TABLE 1-B1
Content ID data arrangement for Mode A
Bit 7 (MSB) 6 5 4 3 2 1 0 (LSB)
ID 1 Basic stream Mapping structure = 00 System ID
ID 2 Reserved (00h)
ID 3 Reserved (00h)
MSB: Most significant bit
LSB: Least significant bit
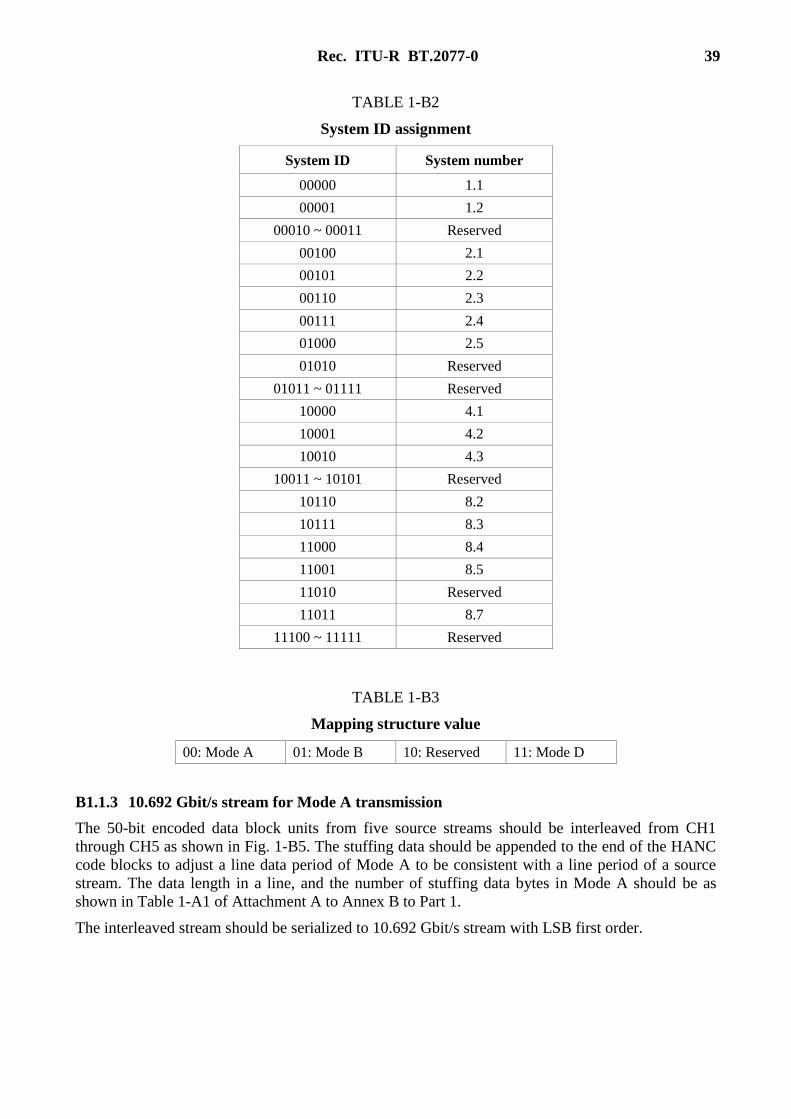
Rec. ITU-R BT.2077-0 39
TABLE 1-B2
System ID assignment
System ID System number
00000 1.1
00001 1.2
00010 ~ 00011 Reserved
00100 2.1
00101 2.2
00110 2.3
00111 2.4
01000 2.5
01010 Reserved
01011 ~ 01111 Reserved
10000 4.1
10001 4.2
10010 4.3
10011 ~ 10101 Reserved
10110 8.2
10111 8.3
11000 8.4
11001 8.5
11010 Reserved
11011 8.7
11100 ~ 11111 Reserved
TABLE 1-B3
Mapping structure value
00: Mode A 01: Mode B 10: Reserved 11: Mode D
B1.1.3 10.692 Gbit/s stream for Mode A transmission
The 50-bit encoded data block units from five source streams should be interleaved from CH1
through CH5 as shown in Fig. 1-B5. The stuffing data should be appended to the end of the HANC
code blocks to adjust a line data period of Mode A to be consistent with a line period of a source
stream. The data length in a line, and the number of stuffing data bytes in Mode A should be as
shown in Table 1-A1 of Attachment A to Annex B to Part 1.
The interleaved stream should be serialized to 10.692 Gbit/s stream with LSB first order.

40 Rec. ITU-R BT.2077-0
FIGURE 1-B5
Data alignment process for a total line
B1.2 6-Channel Mode (Mode B)
Up to six basic streams may be embedded into the 10.692 Gbit/s stream using mapping Mode B.
The Mode B mapping should maintain all of the information included in CH1 to CH6 basic streams
with the exception of HANC data in basic streams assigned to channel 5 and 6.
The CH1 basic stream should always be present for encoder and decoder synchronization. Other
channels, where not used for image data, should be filled with stuffing data.
Figure 1-B6 illustrates the basic concept of Mode B mapping.
FIGURE 1-B6
Basic stream interleaving for Mode B
B1.2.1 Mode B 50-bit data blocking and 8B/10B encoding
Four-word (40-bit) data block of the source stream starting from the first SAV data should be used
for the blocking process.
Each four-word block should be packed into five 8-bit words and then should be encoded with
8B/10B coding as defined in § B1.1.1.

Rec. ITU-R BT.2077-0 41
B1.2.2 Data replacement of SAV part of CH1
Data replacement of each SAV of the CH1 basic stream should be as defined in § B1.1.2.
Table 1-B4 specifies the layout of the content ID words for Mode B.
TABLE 1-B4
Content ID data arrangement for Mode B
Bit 7 (MSB) 6 5 4 3 2 1 0 (LSB)
ID 1 Basic stream Mapping Structure = 01 System ID
ID 2 Division Reserved (0)
ID 3 Reserved (00h)
Bit 7 of ID 1 should be set using the same definitions as § B1.1.2 and ID 2 and ID 3 should be
specific to Mode B.
Bit 7 of ID 2 should be set to 0 in the case of the “square division” and should be set to 1 in the case
of the “2-sample interleave division”.
Bit 0 through bit 6 of ID 2 should be reserved and should be set to 0.
ID 3 should be reserved and should be set to 00h.
B1.2.3 10.692 Gbit/s stream for Mode B transmission
Figure 1-B7 defines the stream structure of Mode B transmission. The mapping of this mode should
carry all the video data included in CH1 to CH6 basic stream.
For a “1 920 × 1080 basic stream”, HANC data included in CH1 to CH4 at the frame frequencies
of 23.98 Hz through 30 Hz should be 8B/10B encoded and embedded in the 10.692 Gbit/s stream
with 50-bit blocking. Each 4-word HANC data block should be packed to five 8-bit words and then
should be encoded with 8B/10B coding as the same way as defined in § B1.1.1. HANC data
included in other channels should be discarded. All other data included in CH1 through CH6 should
be embedded in the same way as Mode A transmission.
Stuffing data should be appended to the end of the HANC code blocks to adjust the line data period
of Mode B to be consistent with the line period of source stream. The data length in a line and the
number of stuffing bytes in Mode B should be as shown in Table 1-A2 of Attachment A to Annex B
to Part 1.
The interleaved stream should be serialized into 10.692 Gbit/s stream with LSB first.

42 Rec. ITU-R BT.2077-0
FIGURE 1-B7
Data alignment structure of Mode B stream
B1.3 8-Channel Mode (Mode C)
Mode C is reserved and is not used in this Recommendation.
B1.4 8-Channel Mode (Mode D)
Up to eight basic streams may be embedded into the 10.692 Gbit/s stream using mapping Mode D.
Mode D should be used for System 8.2 through System 8.7 images, up to four pairs of System 2.2
through System 2.6 images or up to two pairs of System 4.1 through System 4.3 images may be
carried. The mapping for this mode should carry all the video data included in the CH1 to CH8
basic stream. Mode D also carries the HANC data included in CH1, CH3, CH5, CH7 of
1 920 × 1 080 basic stream at frame frequencies of 23.98 Hz, 24 Hz and 25 Hz and CH1 of
1 920 × 1 080 basic stream at frame frequencies of 29.97 Hz and 30 Hz.
A pair of four word blocks from each of the odd and even basic stream derived from each
sub-image should be combined to make an 80-bit block. The details of the 80-bit blocking is
described in § B1.4.1. Blocking for CH1 or CH1, CH3, CH5, CH7 (Link As) HANC data space
should be as defined in § B1.1.1.
The CH1 basic stream data should always be present for encoder and decoder synchronizing.
Other channels, when not used for video data and HANC data, should be filled with stuffing data.
Figure 1-B8 illustrates the basic concept of Mode D mapping.

Rec. ITU-R BT.2077-0 43
FIGURE 1-B8
Basic stream interleaving for Mode D
B1.4.1 Mode D video data blocking, scrambling and 8B/10B encoding
Four-word (40-bit) data blocks of the source stream starting from the first SAV data should be used
for the mapping operation. Figure 1-B9 illustrates the detail of the blocking process.

44 Rec. ITU-R BT.2077-0
FIGURE 1-B9
80-bit blocking in Mode D
Each four-word block of each odd basic stream should be scrambled using the same scrambling
polynomial as defined in Recommendation ITU-R BT.1120 with the initial value of the scrambler
set to zero before the first SAV of each line. Bits b0 and b1 of XYZh(C) in the SAV of CH1, CH3,
CH5 and CH7 should be set to (0,0), (0,1), (1,0) and (1,1) respectively to randomize each scrambled
data. The scrambled data starts from 1F5h, which is the scrambled 3FFh(C) and does not include
initial register value of 0.
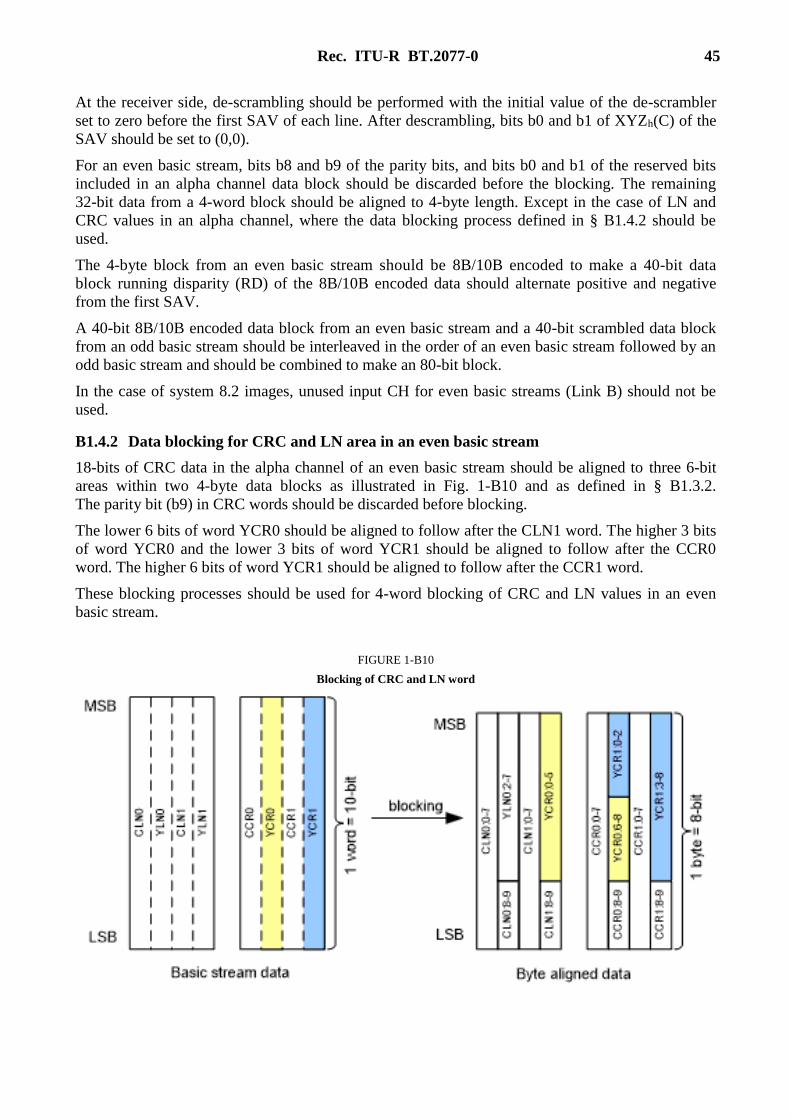
Rec. ITU-R BT.2077-0 45
At the receiver side, de-scrambling should be performed with the initial value of the de-scrambler
set to zero before the first SAV of each line. After descrambling, bits b0 and b1 of XYZh(C) of the
SAV should be set to (0,0).
For an even basic stream, bits b8 and b9 of the parity bits, and bits b0 and b1 of the reserved bits
included in an alpha channel data block should be discarded before the blocking. The remaining
32-bit data from a 4-word block should be aligned to 4-byte length. Except in the case of LN and
CRC values in an alpha channel, where the data blocking process defined in § B1.4.2 should be
used.
The 4-byte block from an even basic stream should be 8B/10B encoded to make a 40-bit data
block running disparity (RD) of the 8B/10B encoded data should alternate positive and negative
from the first SAV.
A 40-bit 8B/10B encoded data block from an even basic stream and a 40-bit scrambled data block
from an odd basic stream should be interleaved in the order of an even basic stream followed by an
odd basic stream and should be combined to make an 80-bit block.
In the case of system 8.2 images, unused input CH for even basic streams (Link B) should not be
used.
B1.4.2 Data blocking for CRC and LN area in an even basic stream
18-bits of CRC data in the alpha channel of an even basic stream should be aligned to three 6-bit
areas within two 4-byte data blocks as illustrated in Fig. 1-B10 and as defined in § B1.3.2.
The parity bit (b9) in CRC words should be discarded before blocking.
The lower 6 bits of word YCR0 should be aligned to follow after the CLN1 word. The higher 3 bits
of word YCR0 and the lower 3 bits of word YCR1 should be aligned to follow after the CCR0
word. The higher 6 bits of word YCR1 should be aligned to follow after the CCR1 word.
These blocking processes should be used for 4-word blocking of CRC and LN values in an even
basic stream.
FIGURE 1-B10
Blocking of CRC and LN word

46 Rec. ITU-R BT.2077-0
B1.4.3 Data replacement of SAV Part of CH2
Data replacement of the synchronization word should be done on the byte aligned data at the
beginning of the SAV of the CH2 basic stream in Mode D. This process should be executed before
8B/10B encoding.
The first two words of the SAV should be replaced with two K28.5 special characters defined in
8B/10B coding and successive two words of the byte aligned data should be replaced with content
IDs. These processes are illustrated in Fig. 1-B11.
FIGURE 1-B11
SAV data replacement for CH2 data
Table 1-B5 specifies the layout of the content ID words for Mode D. ID 1 should be set using the
same definitions as § B1.1.2 and ID 2 should be specific to Mode D. The System ID information
should be a representation of the System number of the CH1 basic stream as defined in Table 1-B2.
TABLE 1-B5
Content ID data arrangement for Mode D
Bit 7 (MSB) 6 5 4 3 2 1 0 (LSB)
ID 1 Basic stream Mapping structure = 11 System ID
ID 2 Division Reserved (0)
Bit 7 of ID 1 should be set to 0 in the case of the “1 920 × 1 080 basic stream”.
Bit 7 of ID 2 should be set to 0 in the case of the “square division” and should be set to 1 in the case
of the “2-sample interleave division”. The square division and the 2-sample interleave division is
defined in Annex A to Part 1.
Bit 0 through bit 6 of ID2 should be reserved and should be set to 0.
B1.4.4 10.692 Gbit/s stream for Mode D transmission
Figure 1-B12 illustrates the stream structure of video data in Mode D transmission. Data from each
sub-image should be interleaved with a unit of 80-bit Block.

Rec. ITU-R BT.2077-0 47
FIGURE 1-B12
80-bit array interleaving derived from basic stream pair
Figure 1-B12 illustrates the stream structure of Mode D transmission.
In the case of 1 920 × 1 080 basic stream HANC data included in CH1, CH3, CH5 and CH7 at
frame frequencies of 23.98 Hz, 24 Hz, 25 Hz, and HANC data in CH1 at frame frequencies of
29.97 Hz, 30 Hz should be 8B/10B encoded and embedded in the 10.692 Gbit/s stream with 50-bit
blocking. HANC data included in other channels should be discarded. All other data included in
CH1 to CH8 should be embedded with 80-bit block interleaving.
The interleaved stream should be serialized to 10.692 Gbit/s stream with LSB first. The data length
in a line in Mode D should be as shown in Table 1-AB.3 of Attachment A to Annex B to Part 1.
FIGURE 1-B13
Data alignment structure of Mode D

48 Rec. ITU-R BT.2077-0
Attachment A
to Annex B
to Part 1
(Normative)
Data length in a line in Mode A, B and D
Data length in a line in Mode A, B, and D should be as shown in Tables 1-AB.1, 1-AB.2 and
1-AB.3 respectively.
TABLE 1-AB.1
Data length in a line (Mode A)
Basic stream System No. Frame frequency
Total
word for
a line
Video
data
HANC and
EAV/SAV data
Stuffing
data
1 920 × 1 080
1.1, 2.1, 2.2,
2.3, 2.4, 2.5,
4.1, 4.2, 4.3
23.98 Hz or 24 Hz 39 600 24 000 CH 1, 2,
3, 4, 5 10 375 5 225
25 Hz or 50 Hz 38 016 24 000 CH 1, 2,
3, 4, 5 9 000 5 016
29.97 Hz, 30 Hz
59.94 Hz or 60 Hz 31 680 24 000
CH 1, 2,
3, 4, 5 3 500 4 180
TABLE 1-AB.2
Data length in a line (Mode B)
Basic
stream System No. Frame frequency
Total
word for
a line
Video
data
HANC and
EAV/SAV data
Stuffing
data
1 920 × 1 080
1.1, 2.1, 2.2,
2.3, 2.4, 2.5,
4.1, 4.2, 4.3
23.98 Hz or 24 Hz 39 600 28 800 CH 1, 2,
3, 4 8 360 2 440
25 Hz or 50 Hz 38 016 28 800 CH 1, 2,
3, 4 7 260 1 956
29.97 Hz, 30 Hz
59.94 Hz or 60 Hz 31 680 28 800
CH 1, 2,
3, 4 2 860 20
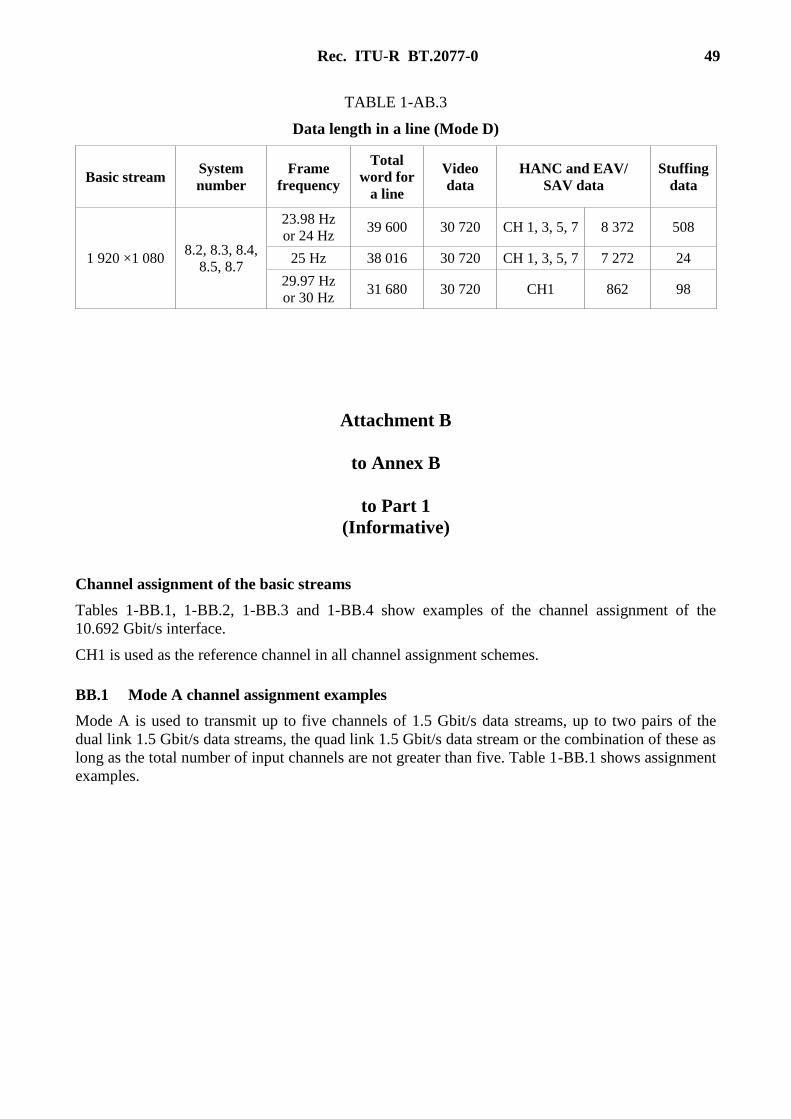
Rec. ITU-R BT.2077-0 49
TABLE 1-AB.3
Data length in a line (Mode D)
Basic stream System
number
Frame
frequency
Total
word for
a line
Video
data
HANC and EAV/
SAV data
Stuffing
data
1 920 ×1 080 8.2, 8.3, 8.4,
8.5, 8.7
23.98 Hz
or 24 Hz 39 600 30 720 CH 1, 3, 5, 7 8 372 508
25 Hz 38 016 30 720 CH 1, 3, 5, 7 7 272 24
29.97 Hz
or 30 Hz 31 680 30 720 CH1 862 98
Attachment B
to Annex B
to Part 1
(Informative)
Channel assignment of the basic streams
Tables 1-BB.1, 1-BB.2, 1-BB.3 and 1-BB.4 show examples of the channel assignment of the
10.692 Gbit/s interface.
CH1 is used as the reference channel in all channel assignment schemes.
BB.1 Mode A channel assignment examples
Mode A is used to transmit up to five channels of 1.5 Gbit/s data streams, up to two pairs of the
dual link 1.5 Gbit/s data streams, the quad link 1.5 Gbit/s data stream or the combination of these as
long as the total number of input channels are not greater than five. Table 1-BB.1 shows assignment
examples.

50 Rec. ITU-R BT.2077-0
TABLE 1-BB.1
Channel assignment examples for Mode A
1 920 × 1 080 basic stream
CH1 CH2 CH3 CH4 CH5
System 1.1
1 920/24/P
System 1.1
1 920/24/P
System 1.1
1 920/24/P
System 1.1
1 920/24/P
System 1.1
1 920/24/P
System 2.1
1 920/50/P, Link (basic stream) A, B
System 2.1
1 920/50/P, Link (basic stream) A, B
System 1.1
1 920/25/P
System 2.1
1 920/50/P, Link (basic stream) A, B
System 1.1
1 920/50/I
System 1.1
1 920/25/P
System 1.1
1 920/25/P
System 2.1, 2.2, 2.3, 2.4, 2.5
1 920/24/P, Link (basic stream) A, B
System 2.1, 2.2, 2.3, 2.4, 2.5
1 920/24/P, Link (basic stream) A, B
System 1.1
1 920/24/P or none
System 1.1
1 920/24/P
System 1.1
1 920/24/P
System 1.1
1 920/24/P
System 2.1, 2.2, 2.3, 2.4, 2.5 or 2.6
1 920/24/P, Link (basic stream) A, B
System 4.1, 4.2 or 4.3
1 920/50/P, basic stream A, B, D
System 1.1
1 920/25/P
NOTE 1 – Frame frequencies shown in this table are the lowest case of each image system. Other frame
frequencies can also be applicable so far as the image format allows.
NOTE 2 – Use of shaded area is optional.
BB.2 Mode B channel assignment examples
Mode B is used to transmit up to six channels of the 1.5 Gbit/s data streams, up to three pairs of the
dual-link 1.5 Gbit/s data streams, the quad-link 1.5 Gbit/s or the combination of these as long as the
total number of input channels is not greater than six. Table 1-BB.2 shows the assignment
examples.
TABLE 1-BB.2
Channel assignment examples for Mode B
1 920 × 1 080 basic stream
CH1 CH2 CH3 CH4 CH5 CH6
System 1.1
1 920/24/P
System 1.1
1 920/24/P
System 1.1
1 920/24/P
System 1.1
1 920/24/P
System 1.1
1 920/24/P
System 1.1
1 920/24/P
System 2.1, 2.2, 2.3, 2.4 or 2.5
1 920/24/P,
Link (basic stream) A, B
System 2.1, 2.2, 2.3, 2.4 or 2.5
1 920/24/P,
Link (basic stream) A, B
System 2.1, 2.2, 2.3, 2.4 or 2.5
1 920/24/P,
Link (basic stream) A, B
System 4.1, 4.2 or 4.3
1 920/50/P, basic stream A, B, D
System 2.1, 2.2, 2.3, 2.4 or 2.5
1 920/25/P
Link (basic stream) A, B
NOTE 1 – HANC data included in CH5 and CH6 are discarded.
NOTE 2 – Frame frequencies shown in this table are the lowest case of each image system. Other frame
frequencies can also be applicable so far as the image format allows.
NOTE 3 – Use of shaded area is optional.

Rec. ITU-R BT.2077-0 51
BB.3 Mode D channel assignment examples
Mode D for the System 8.2 through 8.7 octa-link 1 920 × 1 080 basic streams at frame frequencies
from 23.98 Hz to 30 Hz.
Mode D is also used to transmit up quad link 1 920 × 1 080 basic streams at frame frequencies from
50 Hz to 60 Hz or the combination of these as long as the total number of input channels are not
greater than eight.
Table 1-BB.3 shows the assignment examples.
TABLE 1-BB.3
Channel assignment for Mode D
1 920 × 1 080 basic stream
CH1 CH2 CH3 CH4 CH5 CH6 CH7 CH8
System 8.2, 8.3, 8.5, or 8.7
3840/24/P, basic stream CH 1, 2, 3, 4, 5, 6, 7 and 8
System 2.2, 2.3, 2.4 or
2.5 1 920/24/P, Link
(basic stream) A, B
System 2.2, 2.3, 2.4
or 2.5
1 920/24/P, Link
(basic stream) A, B
System 2.2, 2.3, 2.4
or 2.5
1 920/24/P, Link
(basic stream) A, B
System 2.2, 2.3, 2.4
or 2.5
1 920/24/P, Link
(basic stream) A, B
System 4.1, 4.2 or 4.3
1 920/50/P, basic stream A, B, C, D
System 2.2, 2.3, 2.4 or
2.5 1 920/24/P, Link
(basic stream) A, B
System 2.2, 2.3, 2.4 or
2.5
1 920/24/P, Link
(basic stream) A, B
System 4.1, 4.2 or 4.3
1 920/50/P, basic stream A, B, C, D
System 4.1, 4.2 or 4.3
1 920/50/P, basic stream A, B, C, D
NOTE 1 – HANC data included in CH2 to CH8 at frame frequencies of 29.97 Hz and 30 Hz and HANC
data included in CH2, CH4, CH6 and CH8 at frame frequencies of 23.98 Hz, 24 Hz and 25 Hz are
discarded.
NOTE 2 – Frame frequencies shown in this table are the lowest case of each image system. Other frame
frequencies also can be applicable so far as the image format allows.
NOTE 3 – Use of shaped area is optional.
Annex C
to Part 1
(Normative)
10 Gbit/s serial signal/data interface – optical fibre interface
Overview
The interface specification defined in this Annex applies to implementations covering a distance up
to 2 km using single-mode fibre.

52 Rec. ITU-R BT.2077-0
C1 Serial fibre interface optical and electrical specifications
The interface consists of one transmitter and one receiver in a point-to-point connection.
C1.1 The optical transmitter characteristics at nominal wavelengths of 1310 nm and
1550 nm should be as defined in Table 1-C1
The optical transmitter characteristics for DWDM at the nominal wavelength of 1550 nm should be
as specified in Table 1-C1. The spectral grids for DWDM applications should be in conformance
with 100 GHz and above defined in Recommendation ITU-T G.694.1.
The eye pattern should be measured with respect to the mask of the eye using a receiver with a
fourth-order Bessel-Thomson response with a 3 dB frequency of 0.75 × 10.692 GHz = 8 GHz.
TABLE 1-C1
Optical transmitter characteristics
Nominal wavelength 1310 nm 1550 nm 1550 nm DWDM
applications
Optical wavelength 1260 nm to 1355
nm 1530 nm to 1565 nm 1530 nm to 1565 nm
Wavelength accuracy NA (not applicable) NA −100 pm to +100 pm
–20 dB spectral width (max) 1 nm 1 nm 1 nm
Average launch power (max)
(Note 1) +0.5 dBm +4 dBm +4 dBm
Average launch power (min)
(Note 1) −5.5 dBm −4.7 dBm −1 dBm
Extinction ratio (min) 6 dB 6 dB 8.2 dB
Maximum reflected power
(Note 1) −12 dB −21 dB −21 dB
Output optical eye mask
(Note 2) See Fig. 1-C1
Input electrical eye mask
(Note 2) See Fig. 1-C2 and Table 1-C2
Jitter See § C 2
Electrical/optical transfer
function Logic ‘1’ = Higher optical power / Logic ‘0’ = Lower optical power
NOTE 1 – Power is average power measured with an average-reading power meter.
NOTE 2 – One thousand accumulated waveforms is recommended for transmitter optical output eye mask
compliance test.

Rec. ITU-R BT.2077-0 53
FIGURE 1-C1
Transmitter output optical eye mask
FIGURE 1-C2
Transmitter differential input electrical eye mask

54 Rec. ITU-R BT.2077-0
TABLE 1-C2
Transmitter differential input electrical eye mask specifications
Application With CDR Without CDR
Eye mask x1 0.305 UI max 0.12 UI max
Eye mask x2 NA 0.33 UI max
Eye mask Y1 60 mV min 95 mV min
Eye mask Y2 410 mV max 350 mV max
C1.2 Optical fibre characteristics should be as defined in Table 1-C3
The specified connectors for the optical transceiver should be LC/PC simplex/duplex as defined by
IEC 61754-20. The connectors on the other side of adapter cables installed between the optical
transceivers and patch panels may optionally be specified as SC, ST, FC, MU etc.
TABLE 1-C3
Optical fibre link characteristics
Fibre type Single mode (as defined by IEC 60793-2)
Connector LC/PC simplex/duplex (as defined by IEC 61754-20)
Receiver characteristics should be as defined in Table 1-C4.
The electrical output with and without clock data recovery (CDR) at the connector of a receiver
module on a host board should be as defined in Fig. 1-C3, Table 1-C4, Table 1-C5 and Table 1-C6.
Within the receiver input range a BER < 10−12 should be achieved with the test signals defined in
Recommendation ITU-R BT.1729 or PRBS 231–1 pattern (when testing system components with
BER testers).
A BER < 10−14 is recommended.
NOTE – The PRBS231–1 pattern generator is defined in IEEE 802.3ae-2002.

Rec. ITU-R BT.2077-0 55
TABLE 1-C4
Optical receiver characteristics
Nominal wavelength 1310 nm 1550 nm 1550 nm DWDM
applications
Average receive power (max) (Note 1) 0.5 dBm −1 dBm −1 dBm
Average receive power (min)
(BER = 10−12) (Note 1, 2) −13.5 dBm −13.5 dBm −15.5 dBm
Detector damage threshold (min) (Note 3) +1 dBm +4 dBm +4 dBm
Output electrical eye mask (Note 4) See Fig. 1-C3, Table 1-C5 and Table 1-C6
Jitter See § C2.1
Optical/electrical transfer function Higher optical power = Logic ‘1’ /
Lower optical power = Logic ‘0’
NOTE 1 – Power is average power measured with an average-reading power meter.
NOTE 2 – Measurement for 5 minutes is recommended for verifying BER < 10−12 when using a BER-based
test equipment.
NOTE 3 – To avoid the receiver damage when connected to the 1550 nm transmitter, the detector damage
threshold of greater than +4 dBm is recommended.
NOTE 4 – One thousand accumulated waveforms is recommended for receiver electrical output eye
compliance test.
FIGURE 1-C3
Receiver differential output electrical eye mask

56 Rec. ITU-R BT.2077-0
TABLE 1-C5
Optical transceiver input, receiver output electrical specifications
Application With CDR Without CDR
Differential input/Output
impedance (typ) 100 ohm 100 ohm
Termination mismatch (max) 5% 5%
Differential input/Output
return loss (min)
SDD11/SDD22
20 dB (0.05-0.1 GHz) Note 2 (0.01-4.1 GHz)
8 dB (0.1-5.5 GHz)
Note 3 (4.1-11.1 GHz) Note 1 (5.5-12 GHz)
Common mode input/
Output return loss (min)
SCC11 (Note 5)/SCC22
3 dB (0.1-15 GHz)
Note 4 (0.01-2.5 GHz)
3 dB (2.5-11.1 GHz)
NOTE 1 – Differential return loss is given by the equation SDD11 (dB) and SDD22 (dB) = 8 – 20.66 × log10
(f / 5.5), with f in GHz.
NOTE 2 – Differential return loss is given by the equation SDD11 (dB) and SDD22 (dB) = 12 – 2 ×
SQRT(f), with f in GHz.
NOTE 3 – Differential return loss is given by the equation SDD11 (dB) and SDD22 (dB) = 6.3 – 13 × log10
(f / 5.5), with f in GHz.
NOTE 4 – Common mode output return loss is given by the equation SCC22 (dB) = 7 – 1.6 × f,
with f in GHz.
NOTE 5 – Common mode input return loss SCC11 is not specified for the input characteristics of
applications without CDR.
TABLE 1-C6
Receiver differential output electrical eye mask specifications
Application With CDR Without CDR
Eye mask x1 0.17 UI max 0.35 UI max
Eye mask x2 0.42 UI max NA
Eye mask Y1 170 mV min 150 mV min
Eye mask Y2 425 mV max 425 mV max
C2 Serial fibre interface jitter specifications
C2.1 Jitter in the timing of transitions of the data signal should be measured in accordance
with Recommendation ITU-R BT.1363
Measurement parameters are defined in Recommendation ITU-R BT.1363 and should have the
values defined in Table 1-C7. Jitter specification defined in this section should be applied to the
optical receivers equipped with CDR.

Rec. ITU-R BT.2077-0 57
TABLE 1-C7
Jitter specifications
Parameter Value Description
f1 10 Hz Low-frequency specification limit
f2 20 kHz Upper band edge for A1
f3 4 MHz Lower band edge for A2
f4 > 1/10 the clock rate High-frequency specification limit
A1 10 UI Timing jitter: Sinusoidal jitter amplitude should be
less than 2 × 10⁵/ f + 0.1 UI at 20 kHz < f ≤ 4 MHz
A2 0.15 UI Alignment jitter: sinusoidal jitter amplitude should
be less than 0.15 UI at f > 4 MHz
Error criterion BER = 10-12 Criterion for onset of errors
Test signal PRBS 231-1 or ITU-R test
signal
Data rate of PRBS 231–1 should be 10.692 Gbit/s or
10.692/1.001 Gbit/s or
ITU-R BT.1729 Test signal encoded into each basic
stream according to Part 1 of this Recommendation
(Note 1, 2)
NOTE 1 – Any of applicable image system and mapping mode can be used for the measurement.
NOTE 2 – ITU-R Test signal Recommendation ITU-R BT.1729 is chosen for on-site jitter measurements.
NOTE 3 – See Recommendation ITU-R BT.1363 for definition of jitter terms.
C2.2 Optical transmitter and receiver should meet the requirements defined in Table 1-C8
and Table 1-C9
TABLE 1-C8
Optical module transmitter requirements
Parameter Symbol Conditions Min Typ Max
Jitter transfer bandwidth BW PRBS 231–1 8 MHz
Jitter peaking Frequency > 50 kHz 1 dB
TABLE 1-C9
Optical module receiver requirements
Parameter Symbol Conditions Min Typ Max
Jitter transfer bandwidth BW PRBS 231–1 8 MHz
Jitter peaking Frequency > 50 kHz 1 dB

58 Rec. ITU-R BT.2077-0
PART 2
1 Definition of Terms
8K image 7 680 × 4 320 pixel image specified for the UHDTV2 system
4K image 3 840 × 2 160 pixel image specified for the UHDTV1 system
4K Sub-Image 3 840 × 2 160 pixel image of each colour component obtained
by sub-sampling of an 8K image
Basic image 1 920 × 1 080 pixel image of each colour component obtained
by sub-sampling of a 4K image or 4K sub-image
8K/Fr 8K image with frame frequency of Fr (Fr = 120, 120/1.001,
100, 60, 60/1.001, 50, 30, 30/1.001, 25, 24, 24/1.001)
4K/Fr 4K image with frame frequency of Fr (Fr = 120, 120/1.001,
100, 60, 60/1.001, 50, 30, 30/1.001, 25, 24, 24/1.001)
4Ks/Fr 4K Sub-Image with frame frequency of Fr
(Fr = 120, 120/1.001, 100, 60, 60/1.001, 50, 30, 30/1.001, 25,
24, 24/1.001)
2K/Fr Basic image with frame frequency of Fr (Fr = 120, 120/1.001,
100, 60, 60/1.001, 50, 30, 30/1.001, 25, 24, 24/1.001)
Basic stream A 12-bit-word multiplexed data stream which consists of a
four-word EAV (end of active video) timing reference code, a
two-word line number (LN), a two-word CRCC (cyclic
redundancy check code) error detection code, ancillary data or
blanking data, a four-word SAV (start of active video) timing
reference code, and video data
Active line 1920 words of data that constitute one line of a basic image
Active frame 1080 lines that include all active lines
Frame blanking The lines between an active frame and the next active frame
Running disparity A binary parameter indicating the cumulative disparity
(positive or negative) of all previously issued transmission
characters
2 Video data signals
2.1 Overview of mapping from 8K or 4K images to 10G link signals
2.1.1 Mapping of 8K or 4K images with 120 Hz, 120/1.001 Hz or 100 Hz frame frequency
The mapping of 8K images with 120 Hz, 120/1.001 Hz or 100 Hz frame frequency to multiple 10G
link signals should be as illustrated in Fig. 2-1 and the mapping of 4K images with 120 Hz,
120/1.001 Hz or 100 Hz frame frequency should be as illustrated in Fig. 2-2. The colour
components, C1, C2, and C3 of each figure should be respectively represented as Y′, C′B, and C′R or
G′, B′, and R′.

Rec. ITU-R BT.2077-0 59
For 8K/Fr (Fr = 120, 120/1.001, 100), the three colour components that constitute the image should
be respectively divided into four to produce N (N = 6, 8, or 12) 4K sub-images, each of which is
then further divided to produce 4N basic images. Those 4N basic images should be converted to 4N
basic streams, each two of which are mapped to one 10G link signal to generate 2N 10G link
signals.
For 4K/Fr (Fr = 120, 120/1.001, 100), the three colour components that constitute the image should
be respectively divided into four to produce M (M = 6, 8, or 12) basic images. The M basic images
should be then converted to M basic streams, each two of which are mapped to one 10G link signal
to generate 4 or 6 10G link signals. The reason for there being no M/2 is that 10G link signals are
generated for each colour component. Detailed specifications are in § 4.2.4.
FIGURE 2-1
Mapping overview of 8K images with 120 Hz, 120/1.001 Hz or 100 Hz frame frequency
FIGURE 2-2
Mapping overview of 4K images with 120 Hz, 120/1.001 Hz or 100 Hz frame frequency
8K, 120Hz8K, 120Hz
8K/Fr
Fr=120, 120/1.001, 100
C1, C2, C3
:Colour components
Y′, C′B, C′R
G′, B′, R′
4Ks/Fr
8K Image
4K Sub-Image
(1~N)
Basic Image
(1~4N)
N
N = 6, 8, 12
2K/Fr
10G Link
(1~2N)
12
3
4
1
4N-2
4N-1
4N
4N-3
1
C1
C2
C3
Basic Stream
(1~4N)
2
3
4
1
4N-2
4N-1
4N
4N-3
2
2N-1
2N
4K, 60Hz
4K Image
Basic Image
(1~M)
M = 6, 8, 12
2K/Fr
2
1
M-1
M
4K, 60Hz4K/Fr
Fr=120, 120/1.001, 100
C1, C2, C3
:Colour components
Y′, C′B, C′R
G′, B′, R′
10G Link
(1~4 or 1~6)
1
Basic Stream
(1~M)
2
1
4 or 6M-1
M
C1C2C3
4
3 2
4
3

60 Rec. ITU-R BT.2077-0
2.1.2 Mapping of 8K or 4K images with 60 Hz, 60/1.001 Hz or 50 Hz frame frequency
The mapping of 8K images with 60 Hz, 60/1.001 Hz or 50 Hz frame frequency to multiple 10G link
signals should be as illustrated in Fig. 2-3 and the mapping of 4K images with 60 Hz, 60/1.001 Hz
or 50 Hz frame frequency should be as illustrated in Fig. 2-4.
For 8K/Fr (Fr = 60, 60/1.001, 50), the three colour components that constitute the image should be
respectively divided into four to produce N (N = 6, 8, or 12) 4K sub-images, and then 4N basic
images should be generated. Next, the 4N basic images are converted to 4N basic streams, each four
of which should be mapped to one 10G link signal to generate N 10G link signals.
For 4K/Fr (Fr = 60, 60/1.001, 50), the three colour components that constitute the image should be
respectively divided into four to produce M (M = 6, 8, or 12) basic images. The M basic images
should be then converted to M basic streams, each four of which should be mapped to one 10G link
signal to generate three 10G link signals. The reason for there being no M/4 is that 10G link signals
are generated for each colour component. Detailed specifications are in § 4.2.5.
FIGURE 2-3
Mapping overview of 8K images with 60 Hz, 60/1.001 Hz or 50 Hz frame frequency
8K, 120Hz8K, 120Hz
8K/Fr
C1, C2, C3
:Colour components
Y′, C′B, C′R
G′, B′, R′
4Ks/Fr
8K Image
4K Sub-Image
(1~N)
Basic Image
(1~4N)
N
N = 6, 8, 12
2K/Fr
10G Link
(1~N)
12
3
4
1
4N-2
4N-1
4N
4N-3
1
Basic Stream
(1~4N)
2
3
4
1
4N-2
4N-1
4N
4N-3
N
C1
C2
C3
Fr=60, 60/1.001, 50

Rec. ITU-R BT.2077-0 61
FIGURE 2-4
Mapping overview of 4K images with 60 Hz, 60/1.001 Hz or 50 Hz frame frequency
4K, 60Hz
4K Image
Basic Image
(1~M)
M = 6, 8, 12
2K/Fr
2
3
4
1
M-2
M-1
M
M-3
4K, 60Hz4K/Fr
10G Link
(1~3)
1
Basic Stream
(1~M)
2
3
4
1
3M-2
M-1
M
M-3
C1C2C3
Fr=60, 60/1.001, 50
C1, C2, C3
:Colour components
Y′, C′B, C′R
G′, B′, R′
2.1.3 Mapping of 8K or 4K images with 30 Hz, 30/1.001 Hz, 25 Hz, 24 Hz or 24/1.001 Hz
frame frequency
The mapping of 8K images with 30 Hz, 30/1.001 Hz, 25 Hz, 24 Hz or 24/1.001 Hz frame frequency
to multiple 10G link signals should be as illustrated in Fig. 2-5 and the mapping of 4K images with
30 Hz, 30/1.001 Hz, 25 Hz, 24 Hz or 24/1.001 Hz frame frequency should be as illustrated in
Fig. 2-6.
For 8K/Fr (Fr = 30, 30/1.001, 25, 24, 24/1.001), the three colour components that constitute the
image should be respectively divided into four to produce N (N = 6, 8, or 12) 4K sub-images, and
then 4N basic images should be generated. Next, the 4N basic images should be converted to 4N
basic streams, each eight of which should be mapped to one 10G link signal to generate 4 or 6 10G
link signals. The reason for there being no N/2 is that 10G link signals are generated for each colour
component. Detailed specifications are in § 4.2.3.
For 4K/Fr (Fr = 30, 30/1.001, 25, 24, 24/1.001), the three colour components that constitute the
image should be respectively divided into four to produce M (M = 6, 8, or 12) basic images. The M
basic images should be then converted to M basic streams, each eight of which should be mapped to
one 10G link signal to generate three 10G link signals. The reason for there being no M/8 is that
10G link signals are generated for each colour component. Detailed specifications are in § 4.2.6.

62 Rec. ITU-R BT.2077-0
FIGURE 2-5
Mapping overview of 8K images with 30 Hz, 30/1.001 Hz, 25 Hz, 24 Hz or 24/1.001 Hz frame frequency
FIGURE 2-6
Mapping overview of 4K images with 30 Hz, 30/1.001 Hz, 25 Hz, 24 Hz or 24/1.001 Hz frame frequency
4K, 60Hz
4K Image
Basic Image
(1~M)
4K, 60Hz4K/Fr
10G Link
(1~3)
Basic Stream
(1~M)
C1C2C3
M = 6, 8, 12
2K/Fr
2
3
4
1
M-2
M-1
M
M-3
12
3
4
1
3M-2
M-1
M
M-3
Fr=30, 30/1.001, 25,
24, 24/1.001
C1, C2, C3
:Colour components
Y′, C′B, C′R
G′, B′, R′
8K, 120Hz8K, 120Hz
8K/Fr
C1, C2, C3
:Colour components
Y′, C′B, C′R
G′, B′, R′
8K Image
4K Sub-Image
(1~N)
Basic Image
(1~4N)10G Link
(1~4 or 1~6)
Basic Stream
(1~4N)
C1
C2
C3 N-1
26
7
8
5
4N-6
4N-5
4N-4
4N-7
6
7
8
5
4N-6
4N-5
4N-4
4N-7
4Ks/Fr
2K/Fr
12
3
4
1
1
2
3
4
1
N4N-2
4N-1
4N
4N-3
4N-2
4N-1
4N
4N-3
4 or 6
Fr=30, 30/1.001, 25,
24, 24/1.001
N = 6, 8, 12

Rec. ITU-R BT.2077-0 63
2.1.4 Configuration of colour signal component and system ID
Figure 2-7 illustrates the image division of 8K images into 4K sub-images and 4K images into basic
images when the sampling structures for 8K images and 4K images are 4:2:2 (Y′C′BC′R) or 4:2:0
(Y′C′BC′R).
For the 4:2:2 (Y′C′BC′R) sampling structure, the colour components of the 4K sub-images generated
from the 8K images should be limited to Y1, Y2, Y3, Y4, CB1, CB3, CR1, and CR3 and the colour
components of the basic images generated from the 4K image should be limited to y1, y2, y3, y4,
cB1, cB3, cR1, and cR3.
For the sampling structure 4:2:0 (Y′C′BC′R), the colour components of the 4K sub-images generated
from the 8K images should be limited to Y1, Y2, Y3, Y4, CB1, CR1 and the colour components of
the basic images generated from the 4K image should be limited to y1, y2, y3, y4, cB1, and cR1.
FIGURE 2-7
Image division of 4:2:2 (Y′C′BC′R) and 4:2:0 (Y′C′BC′R) systems
The system numbers for identifying the image format are defined in Table 2-1 for 8K images and in
Table 2-2 for 4K images.
8K Image or 4K Image 4K Sub-Image or Basic Image
Colour component Y′
Colour component C′B
Colour component C′R
Y1,
y1
Y2,
y2
Y3,
y3
Y4,
y4
CR1,
cR1
CB1,
cB1
CB3,
cB3
CR3,
cR3
4K Sub-Image or Basic Image
Colour component Y′
Colour component C′B
Colour component C′R
Y1,
y1
Y2,
y2
Y3,
y3
Y4,
y4
CR1,
cR1
CB1,
cB1
4:2:2(Y′C′BC′R) system
8K Image or 4K Image
4:2:0(Y′C′BC′R) system

64 Rec. ITU-R BT.2077-0
TABLE 2-1
8K Image formats
8K image
Sampling
structure
4K sub-image Frame
frequency
(Hz)
Number of
10G links
System
number Number of
sub-images
(N)
Elements of colour
components
8K,
4:4:4(G′B′R′) 12
G1, G2, B1, B2, R1, R2,
G3, G4, B3, B4, R3, R4
120, 120/1.001 24 U2.1
100 24 U2.2
60, 60/1.001 12 U2.3
50 12 U2.4
30, 30/1.001 6 U2.5
25 6 U2.6
24, 24/1.001 6 U2.7
8K,
4:4:4(Y′C′BC′R) 12
Y1, Y2, CB1, CB2, CR1, CR2,
Y3, Y4, CB3, CB4, CR3, CR4
120, 120/1.001 24 U2.8
100 24 U2.9
60, 60/1.001 12 U2.10
50 12 U2.11
30, 30/1.001 6 U2.12
25 6 U2.13
24, 24/1.001 6 U2.14
8K,
4:2:2(Y′C′BC′R) 8
Y1, Y2, CB1, CR1,
Y3, Y4, CB3, CR3
120, 120/1.001 16 U2.15
100 16 U2.16
60, 60/1.001 8 U2.17
50 8 U2.18
30, 30/1.001 4 U2.19
25 4 U2.20
24, 24/1.001 4 U2.21
8K,
4:2:0(Y′C′BC′R) 6
Y1, Y2, CB1, CR1,
Y3, Y4
120, 120/1.001 12 U2.22
100 12 U2.23
60, 60/1.001 6 U2.24
50 6 U2.25
30, 30/1.001 4 U2.26
25 4 U2.27
24, 24/1.001 4 U2.28
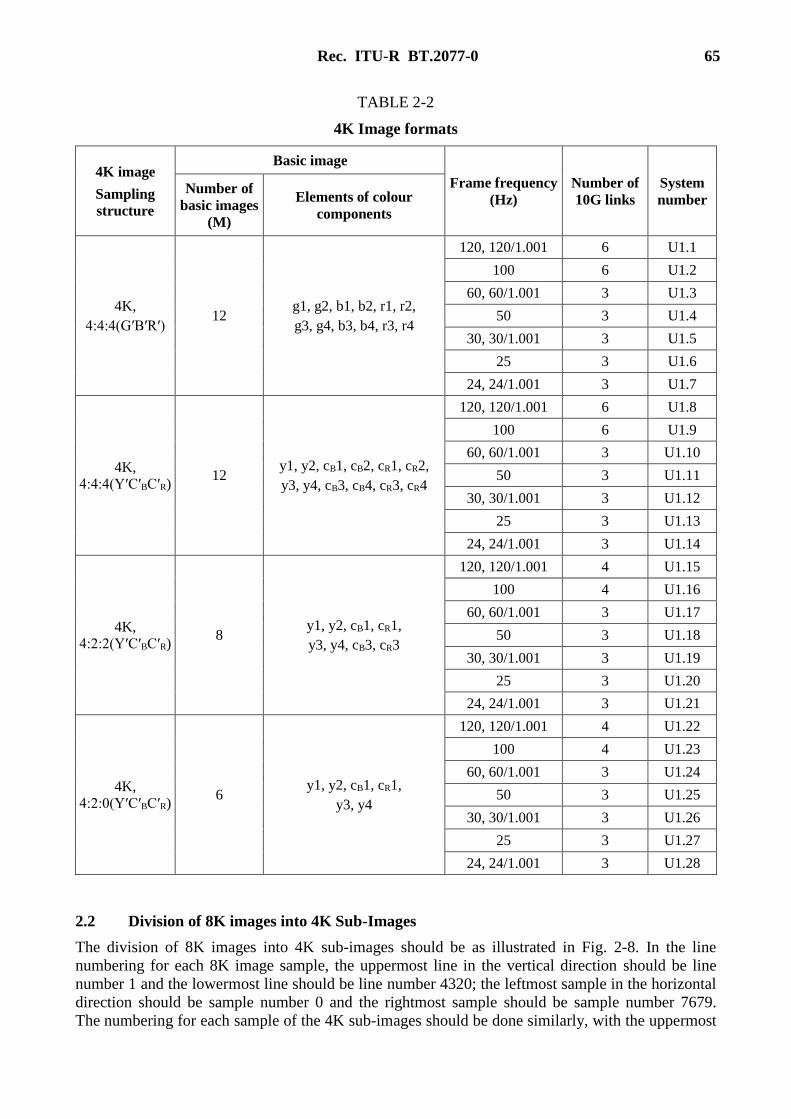
Rec. ITU-R BT.2077-0 65
TABLE 2-2
4K Image formats
4K image
Sampling
structure
Basic image
Frame frequency
(Hz)
Number of
10G links
System
number Number of
basic images
(M)
Elements of colour
components
4K,
4:4:4(G′B′R′) 12
g1, g2, b1, b2, r1, r2,
g3, g4, b3, b4, r3, r4
120, 120/1.001 6 U1.1
100 6 U1.2
60, 60/1.001 3 U1.3
50 3 U1.4
30, 30/1.001 3 U1.5
25 3 U1.6
24, 24/1.001 3 U1.7
4K,
4:4:4(Y′C′BC′R) 12
y1, y2, cB1, cB2, cR1, cR2,
y3, y4, cB3, cB4, cR3, cR4
120, 120/1.001 6 U1.8
100 6 U1.9
60, 60/1.001 3 U1.10
50 3 U1.11
30, 30/1.001 3 U1.12
25 3 U1.13
24, 24/1.001 3 U1.14
4K,
4:2:2(Y′C′BC′R) 8
y1, y2, cB1, cR1,
y3, y4, cB3, cR3
120, 120/1.001 4 U1.15
100 4 U1.16
60, 60/1.001 3 U1.17
50 3 U1.18
30, 30/1.001 3 U1.19
25 3 U1.20
24, 24/1.001 3 U1.21
4K,
4:2:0(Y′C′BC′R) 6
y1, y2, cB1, cR1,
y3, y4
120, 120/1.001 4 U1.22
100 4 U1.23
60, 60/1.001 3 U1.24
50 3 U1.25
30, 30/1.001 3 U1.26
25 3 U1.27
24, 24/1.001 3 U1.28
2.2 Division of 8K images into 4K Sub-Images
The division of 8K images into 4K sub-images should be as illustrated in Fig. 2-8. In the line
numbering for each 8K image sample, the uppermost line in the vertical direction should be line
number 1 and the lowermost line should be line number 4320; the leftmost sample in the horizontal
direction should be sample number 0 and the rightmost sample should be sample number 7679.
The numbering for each sample of the 4K sub-images should be done similarly, with the uppermost

66 Rec. ITU-R BT.2077-0
line in the vertical direction as line number 1 and the lowest line as line number 2160, and the
leftmost sample in the horizontal direction as sample number 0 and the rightmost sample as sample
number 3839. The even-numbered samples of the odd lines of the 8K images should be mapped to
4K sub-image 1 and the odd-numbered samples of the odd lines of the 8K images should be
mapped to 4K sub-image 2; the even-numbered samples of the even lines of the 8K images should
be mapped to 4K sub-image 3 and the odd-numbered samples of the even lines of the 8K images
should be mapped to 4K sub-image 4.
FIGURE 2-8
Image division from 8K images to 4K sub-images
2.3 Division of 4K images and 4K sub-images into basic images
The division of 4K images and 4K sub-images into basic images should be as illustrated in Fig. 2-9.
The numbering for each sample of the 4K Images should be done in the same way as for the 4K
sub-images, with the uppermost line in the vertical direction as line number 1 and the lowest line as
line number 2160, and the leftmost sample in the horizontal direction as sample number 0 and the
rightmost sample as sample number 3839. The numbering for each sample of the basic images
should be done similarly, with the uppermost line in the vertical direction as line number 1 and the
lowest line as line number 1080, and the leftmost sample in the horizontal direction as sample
number 0 and the rightmost sample as sample number 1919.
The even-numbered samples of the odd lines of the 4K images and 4K sub-images should be
mapped to basic image 1 and the odd-numbered samples of the odd lines of the 4K images and 4K
sub-images should be mapped to basic image 2; the even-numbered samples of the even lines of the
4K images and 4K sub-images should be mapped to basic image 3 and the odd-numbered samples
of the even lines of the 4K images and 4K sub-images should be mapped to basic image 4.
1
4320
23
0 1 2 7679
C3
C2
C1
8K Image
4Kサブイメージ
C1, C2, C3
:Colour components
Y′, C′B, C′R
G′, B′, R′
4Kサブイメージ4K Sub-Image 1
4Kサブイメージ4Kサブイメージ
4K Sub-Image 2
4Kサブイメージ4Kサブイメージ
4K Sub-Image 3
4Kサブイメージ4Kサブイメージ
4K Sub-Image 4
C3
C2C1
38390
1
2160
C3
C2C1
C3
C2C1
C3
C2C1
1 23 4
5 67 8
9 AB C
D EF G
5 6
7 4E
2AD
19
8C G
3FB

Rec. ITU-R BT.2077-0 67
FIGURE 2-9
Image division of 4K images or 4K sub-image into basic images
3 Basic stream
3.1 Conversion from basic images to basic streams
The method for converting each line when converting basic images to basic streams should be as
shown in Fig. 2-10. Each sample of the basic image is either 10 bits or 12 bits. For the 10 bit case, a
two-bit shift should be done to fill the lowest two bits with “00” to produce a 12-bit word so that the
word for all of the basic streams is 12 bits.
As shown in Fig. 2-10, the one line period of basic stream should consist of a four-word EAV (End
of Active Video) timing reference code, a two-word LN, a two-word CRCC error detection code,
ancillary data or blanking data, a four-word SAV timing reference code, and video data. The sample
numbers of a basic stream should be determined as shown in Table 2-3.
1
2160
0 3839
C3
C2
C1
4K Image /
4K Sub-Image
4Kサブイメージ
C1, C2, C3
:Colour components
Y′, C′B, C′R
G′, B′, R′
4KサブイメージBasic Image 1
4Kサブイメージ4Kサブイメージ
Basic Image 2
4Kサブイメージ4Kサブイメージ
Basic Image 3
4Kサブイメージ4Kサブイメージ
Basic Image 4
C3
C2C1
19190
1
1080
C3
C2C1
C3
C2C1
C3
C2C1
1
1 23 4
2
3
4

68 Rec. ITU-R BT.2077-0
FIGURE 2-10
Line structure of basic stream
TABLE 2-3
Sample numbers of basic stream
Item Symbol
Sample number
120, 120/1.001, 60,
60/1.001, 30 or
30/1.001 Hz frame
frequency
100, 50 or 25 Hz
frame frequency
24 or 24/1.001 Hz
frame frequency
Active line
(video data) D 0-1919
Timing reference
code (EAV) EAV 1 920, 1 921, 1 922, 1 923
Line number data LN LN0 1 924
LN1 1 925
Cyclic redundancy
check codes CRCC
CRCC0 1 926
CRCC1 1 927
Ancillary data or
Blanking data ANC 1 928-2 195 1 928-2 635 1 928-2 745
Timing reference
code (SAV) SAV
2 196, 2 197,
2 198, 2 199
2 636, 2 637,
2 638, 2 639
2 746, 2 747,
2 748, 2 749
19190
1
1080
Ancillary data
or
Blanking data
EAV
4 words
268 words (120, 120/1.001, 60, 60/1.001, 30, 30/1.001 Hz),
708 words (100, 50, 25 Hz),
818 words (24, 24/1.001 Hz)
12 bit/word
4 words 1920 words
SAV Active line EAV
Basic Image
Basic Stream
LN
CR
CC
2 words2 words
1 line period of Basic Stream

Rec. ITU-R BT.2077-0 69
The frame structure of a basic stream should be as shown in Fig. 2-11 and the basic stream line
numbering should be as shown in Table 2-4. A basic stream should comprise 1080-line active frame
and 45-line frame blanking intervals. The samples from the first line of a basic image to the 1080th
line should be assigned to ones from line 42 to line 1121 of the basic stream. The frame blanking
should be assigned to the interval from line 1 to line 41 and from line 1122 to line 1125. The line
structure of the frame blanking should be same as that of the active frame shown in Fig. 2-10, with
a 1920-word region of the active line allocated to the ancillary data or blanking data.
FIGURE 2-11
Frame structure of basic stream
TABLE 2-4
Line numbers of basic stream
Item Line number
Frame blanking 1-41, 1 122-1 125
Active frame 42-1 121
3.2 Timing reference codes (SAV and EAV)
The two timing reference codes are the SAV, which should be placed immediately before the video
data (active line), and the EAV, which should be placed immediately after the video data. The bit
assignments for the SAV and EAV should be as shown in Table 2-5 and the protection bit
assignments should be as shown in Table 2-6.
In Tables 2-5 and 2-6, F is an identification bit for progressive/interlaced (first/second field). The
images in Parts 2 of this Recommendation should be progressive, so the value of F should be fixed
at 0. The V is an identifier bit for the frame blanking and the active video data. The value of V
should be 1 in the frame blanking from line 1 to line 41 and from line 1122 to line 1125; the value
should be 0 in the active video data from line 42 to line 1121. The H is an identifier bit that has a
value of 0 for SAV and 1 for EAV. The values P0 through P3 are parity bits, which are used for one
bit error correction and two bits error detection on the receiving side. The assignment of those bits
should be as shown in Table 2-6.
Active video area
(Basic Image)
42
1121
1
41
1122
1125
Ancillary data or
Blanking data
EAVAncillary data or
Blanking data
Frame blanking
Frame blanking
Active frame
LN
CR
CC
EA
V
SA
V
An
cill
ary
dat
a
or
Bla
nk
ing
dat
a

70 Rec. ITU-R BT.2077-0
TABLE 2-5
Bit assignment for timing reference codes
Word Value
Bit number
b11
(MSB)
b10 b9 b8 b7 b6 b5 b4 b3 b2 b1 b0
(LSB)
1 FFFh 1 1 1 1 1 1 1 1 1 1 1 1
2 000h 0 0 0 0 0 0 0 0 0 0 0 0
3 000h 0 0 0 0 0 0 0 0 0 0 0 0
4 XYZ 1 F V H P3 P2 P1 P0 0 0 0 0
TABLE 2-6
Protection bits for timing reference codes
Bit number b10 b9 b8 b7 b6 b5 b4
Function F V H P3 P2 P1 P0
Bit pattern 0 0 0 0 0 0 0 0
Bit pattern 1 0 0 1 1 1 0 1
Bit pattern 2 0 1 0 1 0 1 1
Bit pattern 3 0 1 1 0 1 1 0
3.3 Line number data
The line numbering of the basic stream should use the line numbers for the basic stream specified in
Fig. 2-11 and Table 2-4 rather than the line numbers of the 8K or 4K image. The line number data
should be represented in binary format using the 11 bits from L0 (LSB) to L10 (MSB). The bit
assignment of line number data LN0 and LN1 should be as shown in Table 2-7. The reserved bits of
Table 2-7 should be set to “0”.

Rec. ITU-R BT.2077-0 71
TABLE 2-7
Bit assignment for line number
Bit number LN0 LN1
b11 (MSB) NOT b10 NOT b10
b10 L6 Reserved
b9 L5 Reserved
b8 L4 Reserved
b7 L3 L10 (MSB)
b6 L2 L9
b5 L1 L8
b4 L0 (LSB) L7
b3 Reserved Reserved
b2 Reserved Reserved
b1 Reserved Reserved
b0 (LSB) Reserved Reserved
3.4 Error detection code data
The basic stream error detection code data should be represented by the 18 bits from CRCC0 to
CRCC17 and is defined as follows.
(1) Error detection code: CRCC (Cyclic Redundancy Check Code)
(2) Polynomial generator equation: C(X) = X18 + X5 + X4 + 1. The initial value is set to 0.
(3) Error detection code generation range:
Start point: The first word after the SAV of the previous line
End point: The last word of the line number data
(4) Error detection code generation sequence:
Should begin with the LSB of the first word of the error detection code generation
range and end with the MSB of the last word in that range.
(5) Bit assignment:
Table 2-8 specifies the bit assignment. CRCC0 is the MSB of the error detection code.
The reserved bits of Table 2-8 should be set to “0”.

72 Rec. ITU-R BT.2077-0
TABLE 2-8
Bit assignment for CRCC
Bit number CRC0 CRC1
b11 (MSB) NOT b10 NOT b10
b10 CRCC8 CRCC17
b9 CRCC7 CRCC16
b8 CRCC6 CRCC15
b7 CRCC5 CRCC14
b6 CRCC4 CRCC13
b5 CRCC3 CRCC12
b4 CRCC2 CRCC11
b3 CRCC1 CRCC10
b2 CRCC0 CRCC9
b1 Reserved Reserved
b0 (LSB) Reserved Reserved
3.5 Ancillary data
The ancillary data should be mapped into the blanking area of basic stream 1 and basic stream 2.
The data format should be in conformance with Recommendation ITU-R BT.1364.
As the ancillary data packet is specified as 10 bits/word, the conversion shown in Fig. 2-12 should
apply. In Fig. 2-12, ADF indicates an ancillary data flag, DID indicates a data identifier word, DBN
indicates a data block number word, SDID indicates second data identifier word, DC indicates a
data count word, UDW indicates a user data word and CS indicates a checksum word.
For the three words of the ADF, “00” should be appended to the lowest two bits of the first word
and “11” should be appended to the lowest two bits of the other two words for conversion to 12-bit
words. From DID through the end of UDW, the lowest two bits should be filled with “00” to
convert to a 12-bit word format. For CS, the lower 11 bits of the sum of the lower 11 bits of the
words from DID to the last UDW should be assigned as b0 (LSB) to b10 of CS, and b11 (MSB)
should be set as the reverse of b10.
FIGURE 2-12
Conversion of ancillary data packet from 10-bit/word to 12-bit/word
ADF
DIDAncillary data
specified in 10 bit/word
DBN
or
SDID
DCCS
UDW
1 word1 word
1 word3 words 0 - 255 words 1 word
11
11
11
11
11
11
11
11
11
11
00
00
00
00
00
11
11
00 Insertion of "00" into lower 2 bits
12 bit/word

Rec. ITU-R BT.2077-0 73
3.6 Audio
Each basic image has the format of 1 920 × 1 080 pixel image of each colour component obtained
by sub-sampling of a 4K image or 4K Sub-Image and should have audio embedded according to
Recommendation ITU-R BT.1365. Y data stream and CB/CR data stream in Recommendation
ITU-R BT.1365 correspond to basic stream 1 and basic stream 2 in Part 2 of this Recommendation,
respectively.
Audio control packets should be multiplexed into the horizontal ancillary data space of line 9 of
basic stream 1 and audio data packets should be into the horizontal ancillary data space of basic
stream 2.
Recommendation ITU-R BT.1365 describes the generation and insertion of audio ancillary data
packets, including audio control packets and audio data packets, for up to 4 audio groups, groups
1 through 4. This allows for up to 16 channels of audio sampled at 48 kHz, or up to 8 channels of
audio sampled at 96 kHz. A further 4 extended audio groups, groups 5, 6, 7 and 8, allowing for up
to 32 channels at 48 kHz or up to 16 channels at 96 kHz, can be inserted using the techniques
described in Recommendation ITU-R BT.1365 with different DID values for the audio data packets
and audio control packets.
The DID values for extended audio data packets should be 1A7h for audio group 5, 2A6h for audio
group 6, 2A5h for audio group 7 and 1A4h for audio group 8.
The DID values for extended audio control packets should be 2A3h for audio group 5, 1A2h for
audio group 6, 1A1h for audio group 7 and 2A0h for audio group 8.
The audio clock phase data as defined in Recommendation ITU-R BT.1365 should be calculated
using a clock frequency of 74.25 (/1.001) MHz for signals with frame frequencies of 30 Hz,
30/1.001 Hz, 25 Hz, 24 Hz and 24/1.001 Hz.
The audio clock phase data as defined in Recommendation ITU-R BT.1365 should be calculated
using a clock frequency of 148.5 (/1.001) MHz for 50 Hz, 60/1.001 Hz and 60 Hz.
The audio clock phase data as defined in Recommendation ITU-R BT.1365 should be calculated
using a clock frequency of 297 (/1.001) MHz for 100 Hz, 120/1.001 Hz and 120 Hz.
3.7 Payload ID
The UDW bit assignment of payload ID packet should be as shown in Table 2-9. The payload ID
packet should be multiplexed once per frame of the basic stream. The recommended location should
be immediately after the CRCC of the basic stream in line 10.
The following payload ID values should apply:
– 4K and 8K should be identified by bits b0 and b1 of word 1 having the following values:
(0h) should be reserved,
(1h) should identify 4K,
(2h) should identify 8K,
(3h) should be reserved;
– CL/NCL flag should be set to (1) for the constant luminance signal coding and should be
set to (0) for the non-constant luminance signal coding;
– picture rate should be set to the value of the UHDTV payload;

74 Rec. ITU-R BT.2077-0
– assignment order of the basic stream channels should correspond to:
Figure 2-13 for 120, 120/1.001, 100 Hz as defined in § 4.1.1,
Figure 2-17 for 60, 60/1.001, 50 Hz as defined in § 4.1.2, and
Figure 2-19 for 30, 30/1.001, 25, 24, 24/1.001 Hz as defined in § 4.1.3;
– sampling structure should be set to the value of the payload being carried;
– assignment order of the 10G link channel number should correspond to:
Figures 2-21 and 2-22 for 8K/Fr (Fr = 120, 120/1.001, 100) as defined in § 4.2.1,
Figure 2-23 for 8K/Fr (Fr = 60, 60/1.001, 50) as defined in § 4.2.2,
Figure 2-24 for 8K/Fr (Fr = 30, 30/1.001, 25, 24, 24/1.001) as defined in § 4.2.3,
Figure 2-25 for 4K/Fr (Fr = 120, 120/1.001, 100) as defined in § 4.2.4,
Figure 2-26 for 4K/Fr (Fr = 60, 60/1.001, 50) as defined in § 4.2.5,
Figure 2-27 for 4K/Fr (Fr = 30, 30/1.001, 25, 24, 24/1.001) as defined in § 4.2.6;
– the bit depth of the sample quantization should be identified by bits b0 and b1 of word 4
having the following values:
(0h) should be reserved,
(1h) should identify quantization using 10 bits per sample,
(2h) should identify quantization using 12 bits per sample,
(3h) should be reserved.

Rec. ITU-R BT.2077-0 75
TABLE 2-9
Bit assignment of payload ID packet
Bit number Word 1 Word 2 Word 3 Word 4
b9 (MSB) NOT b8 NOT b8 NOT b8 NOT b8
b8 EP
(Note 1)
EP EP EP
b7 1 Progressive (1) Channel assignment of
basic stream
CH1 (0h), CH2 (1h),
CH3 (2h), CH4 (3h),
CH5 (4h), CH6 (5h),
CH7 (6h) or CH8 (7h)
10G link
assignment
CH1 (00h) –
CH24 (17h)
b6 0 Progressive (1)
b5 1 Reserved (0)
b4 0 CL (1) or NCL (0) Reserved (0e)
b3 0 Picture rate Sampling structure
identification
b2 1 24/1.001 Hz (2h)
Wide-gamut
colorimetry as per
Recommendation
ITU-R BT.2020 (0)
Reserved (1)
b1 4K/8K 24 Hz (3h)
4:2:2 (Y′C′BC′R) (0h) Bit depth
Reserved (0h) 25 Hz (5h) Reserved (0h)
b0 (LSB)
4K (1h) 30/1.001 Hz (6h)
4:4:4 (Y′C′BC′R) (1h) 10-bit (1h )
8K (2h) 30 Hz (7h) 12-bit (2h)
Reserved (3h) 50 Hz (9h)
4:4:4 (G′B′R′) (2h) Reserved (3h)
60/1.001 Hz (Ah)
60 Hz (Bh) 4:2:0
(Y′C′BC′R) (3h)
100 Hz (Dh)
120/1.001 Hz (Eh)
120 Hz (Fh)
NOTE 1 – EP = Even parity for b0 through b7.
3.8 Blanking data
The blanking data words occurring during blanking intervals that are not used for the timing
reference codes (SAV and EAV), line number data, error detection codes or ancillary data should be
set as listed below.
(1) Basic streams for colour components Y′, G′, B′, R′: 100h
(2) Basic streams for colour components C′B, C′R: 800h

76 Rec. ITU-R BT.2077-0
4 Generation of 10G link signals
4.1 Generating 10G link signals from basic streams
4.1.1 Generating 10G link signals from 120, 120/1.001 or 100 Hz basic streams
The method for converting two 120, 120/1.001 or 100 Hz basic stream to one 10G link signal
should be as shown in Figs. 2-13 to 2-16.
First, two basic streams should be multiplexed word-by-word and converted to a multiplexed data
stream. Stuffing data should be added to the two basic streams as shown in Fig. 2-13. This results in
a data stream that has 5280 words per line period for a frame frequency of 120 Hz and
120/1.001 Hz, or 6336 words per line period for a frame frequency of 100 Hz. That stuffing data,
should be reserved and filled with 100h.
FIGURE 2-13
Multiplexing of two 120, 120/1.001 or 100 Hz basic streams
00
0h
(1)
FF
Fh(1
)
XY
Z(1
)
00
0h
(1)
LN
1(1
)
LN
0(1
)
AN
Ck
(1)
00
0h
(1)
FF
Fh(1
)
XY
Z(1
)
00
0h
(1)
D0
(1)
D1
(1)
D2
(1)
D1
91
8(1
)
D1
91
9(1
)
Basic Stream 1
Basic Stream 2
00
0h
(2)
FF
Fh(2
)
XY
Z(2
)
00
0h
(2)
LN
1(2
)
LN
0(2
)
AN
Ck
(2)
00
0h
(2)
FF
Fh(2
)
XY
Z(2
)
00
0h
(2)
D0
(2)
D1
(2)
D2
(2)
D1
91
8(2
)
D1
91
9(2
)
00
0h
(2)
FF
Fh
(2)
XY
Z(2
)
00
0h
(1)
FF
Fh
(1)
00
0h
(2)
00
0h
(1)
XY
Z(1
)
LN
1(2
)
LN
0(2
)
AN
Ck
(2)
LN
1(1
)
LN
0(1
)
AN
Ck
(1)
00
0h
(2)
FF
Fh
(2)
XY
Z(2
)
00
0h
(1)
FF
Fh
(1)
00
0h
(2)
00
0h
(1)
XY
Z(1
)
D1
(2)
D0
(2)
D1
(1)
D0
(1)
D2
(2)
D2
(1)
U0
Uj
D1
91
9(2
)
D1
91
8(2
)
D1
91
9(1
)
D1
91
8(1
)
Multiplexed
data stream
Multiplexed
EAV
(8 words)Stuffing
(see Table 2-10)
Multiplexed
SAV
(8 words)
12 bit/word
12 bit/word
12 bit/word
Line blanking
EAV
(4 words)
SAV
(4 words)
Active line
(1920 words)
Multiplexed
active line
(3840 words)
5280 words/line (120, 120/1.001 Hz),
6336 words/line (100 Hz)
Multiplexed
LN/CRCC/ANC
(see Table 2-10)
LN/CRCC
/ANC
(see Table 2-3)

Rec. ITU-R BT.2077-0 77
TABLE 2-10
Line structure of a 120, 120/1.001 or 100 Hz multiplexed data stream
Item Number of data words
120 or 120/1.001 Hz frame frequency 100 Hz frame frequency
Multiplexed EAV 8
Multiplexed LN/CRCC/ANC 544 1 424
Stuffing data 880 1 056
Multiplexed SAV 8
Multiplexed active video 3 840
Total word for a line 5 280 6 336
Next, the word-multiplexed data stream should be coded by 8B/10B encoding as specified by ANSI
INCITS 230.
The multiplexed data stream consisting of 12-bit words should be first converted to a byte series as
shown in Fig. 2-14, and then coded as 8B/10B encoded data. The conversion to byte series should
be done in order from the beginning of the active line and every two words (Fig. 2-15). When doing
the 8B/10B coding, the first four bytes of the multiplexed SAV and EAV should be replaced with a
synchronization block (Fig. 2-16). The first two words of the multiplexed SAV should be replaced
with the K28.5 special characters and those of the multiplexed EAV should be replaced with the
K29.7 special characters defined by ANSI INCITS 230, and the successive two words should be
replaced with content IDs. The content ID bit assignment should be as shown in Table 2-11 and the
bit assignment of the system ID, which is part of the content ID, should be as shown in Table 2-12.
The 8B/10B encoding process should start at the first K28.5 special character with a negative
running disparity. The 8B/10B encoding process should be done in accordance with current running
disparity at all the lines that follow.
The 8B/10B encoding converts two 12-bit words of data to three 10-bit words. The
word-multiplexed data stream has 7920 words per line period (10 bit/word) for the 120 Hz and
120/1.001 Hz frame frequencies and 9504 words (10 bits/word) per line period for the 100 Hz
frame frequency.

78 Rec. ITU-R BT.2077-0
FIGURE 2-14
8B/10B encoding of multiplexed data stream
FIGURE 2-15
Data alignment and 8B/10B encoding of 2-word data block
Multiplexed
LN/CRCC/ANCMultiplexed active line
Byte alignment
Multiplexed
LN/CRCC/ANC
Multi-
plexed
SAV
Multiplexed active line
8B/10B encoding
Stuffing
8B/10B encoded data
12 bit/word
8 bit/word
10bit/word
Multiplexed data stream
Replacement with K28.5 special code and
Content ID bytes
Multiplexed EAV Multiplexed SAVStuffing
Replacement with K29.7 special code and
Content ID bytes
Multi-
plexed
EAV
D0(2
):0-1
1
D0(1
):0-1
1
2-word
D0(2
):0-7
D0(2
):8-1
1
D0(1
):4-1
1
D0(1
):0-3
3-word
LSB
MSB 3-word
8B/10B encodingByte alignment
12 bit/word
8 bit/word
10 bit/word

Rec. ITU-R BT.2077-0 79
FIGURE 2-16
Multiplexed SAV and EAV data replacement with synchronization block (120, 120/1.001 or 100 Hz)
TABLE 2-11
Content ID bit assignment
Bit Content ID1 Content ID2
b7 (MSB) Reserved
(0h) Reserved
(0h) b6
b5
System ID
b4
10G link assignment
Ch1 (00h) to Ch24 (17h)
b3
b2
b1
b0 (LSB)
FF
Fh(1
):4
-11
FF
Fh
(2):
0-7
FF
Fh
(2):
8-1
1F
FF
h(1
):0
-3
00
0h
(1):
4-1
1
00
0h
(2):
0-7
00
0h
(2):
8-1
10
00h(1
):0
-3
00
0h
(1):
4-1
1
00
0h
(2):
0-7
00
0h
(2):
8-1
10
00h(1
):0
-3
Co
nte
nt
ID1
K2
8.5
(S
AV
) o
r K
29
.7 (
EA
V)
00
0h
(1):
4-1
1
Co
nte
nt
ID2
00
0h
(2):
8-1
10
00h(1
):0
-3
00
0h
(1):
4-1
1
00
0h
(2):
0-7
00
0h
(2):
8-1
10
00h(1
):0
-3
K2
8.5
(S
AV
) o
r K
29
.7 (
EA
V)
8 bit
LSB
MSB
LSB
MSB
8 bit
Data replacement of
the first 4 bytes

80 Rec. ITU-R BT.2077-0
TABLE 2-12
System ID bit assignment
System ID
(b5 to b0)
System
number
System ID
(b5 to b0)
System
number
System ID
(b5 to b0)
System
number
System ID
(b5 to b0)
System
number
000000 U1.1 001111 U1.16 100000 U2.1 101111 U2.16
000001 U1.2 010000 U1.17 100001 U2.2 110000 U2.17
000010 U1.3 010001 U1.18 100010 U2.3 110001 U2.18
000011 U1.4 010010 U1.19 100011 U2.4 110010 U2.19
000100 U1.5 010011 U1.20 100100 U2.5 110011 U2.20
000101 U1.6 010100 U1.21 100101 U2.6 110100 U2.21
000110 U1.7 010101 U1.22 100110 U2.7 110101 U2.22
000111 U1.8 010110 U1.23 100111 U2.8 110110 U2.23
001000 U1.9 010111 U1.24 101000 U2.9 110111 U2.24
001001 U1.10 011000 U1.25 101001 U2.10 111000 U2.25
001010 U1.11 011001 U1.26 101010 U2.11 111001 U2.26
001011 U1.12 011010 U1.27 101011 U2.12 111010 U2.27
001100 U1.13 011011 U1.28 101100 U2.13 111011 U2.28
001101 U1.14 011100
~
011111
Reserved
101101 U2.14 111100
~
111111
Reserved 001110 U1.15 101110 U2.15
Next, the 8B/10B coded data should be serialized in order from the LSB into the serial stream of
10G link signal. The speed of the 10G link signals generated as described above for 120 Hz frame
frequency is 7920 (words/line) × 10 (bits/word) × 1125 (lines) × 120 (1/second), or 10.692 Gbit/s.
For the frame frequency of 120/1.001 Hz, the speed is 7920 (words/line) × 10 (bits/word) ×
1125 (lines) × 120/1.001 (1/second), or 10.692/1.001 Gbit/s. For the frame frequency of 100 Hz, the
speed is 9504 (words/line) × 10 (bits/word) × 1125 (lines) × 100 (1/seconds), or 10.692 Gbit/s.
4.1.2 Generating 10G link signals from 60, 60/1.001 or 50 Hz basic streams
The method for converting four 60, 60/1.001 or 50 Hz basic streams to one 10G link signal should
be as shown in Figs. 2-17 and 2-18. First, the four basic streams should be converted to a
word-multiplexed data stream by multiplexing word by word. Stuffing data should be added to the
four basic streams as shown in Fig. 2-17. This results in a data stream that has 10 560 words per line
period for a frame frequency of 60 Hz or 60/1.001 Hz, or 12 672 words per line period for a frame
frequency of 50 Hz. The stuffing data should be reserved and filled with 100h.

Rec. ITU-R BT.2077-0 81
FIGURE 2-17
Multiplexing of four 60, 60/1.001 or 50 Hz basic streams
Bas
ic S
trea
m 1
XYZ(2)XYZ(1)
LN0(2)
LN0(4)
ANCk(4)
LN0(3)
ANCk(3)
D0(4)D0(3)D0(2)D0(1)
U0
Uj
D1919(2)
D1919(4)
D1919(1)
D1919(3)
Mu
ltip
lex
ed
dat
a st
ream
Mu
ltip
lex
ed E
AV
(16
wo
rds)
Mu
ltip
lex
ed S
AV
(1
6 w
ord
s)
12
bit
/wo
rd
12
bit
/wo
rd
12
bit
/wo
rd
Lin
e b
lan
kin
g
EA
V
(4 w
ord
s)
SA
V
(4 w
ord
s)
Mu
ltip
lex
ed
acti
ve
lin
e
(76
80
wo
rds)
10
56
0 w
ord
s/li
ne
(60,
60
/1.0
01
Hz)
,
12
67
2 w
ord
s/li
ne
(50
Hz)
12
bit
/wo
rd
12
bit
/wo
rd
000h(1)
FFFh(1)
XYZ(1)
000h(1)
LN0(1)
D1919(1)
000h(2)
FFFh(2)
XYZ(2)
000h(2)
LN0(2)
D1919(2)
000h(3)
FFFh(3)
XYZ(3)
000h(3)
LC0(3)
D1919(3)
000h(4)
FFFh(4)
XYZ(4)
000h(4)
LN0(4)
D1919(4)
ANCk(1)
000h(1)
FFFh(1)
XYZ(1)
000h(1)
D0(1)
D1(1)
ANCk(2)
000h(2)
FFFh(2)
XYZ(2)
000h(2)
D0(2)
D1(2)
ANCk(3)
000h(3)
FFFh(3)
XYZ(3)
000h(3)
D0(3)
D1(3)
ANCk(4)
000h(4)
FFFh(4)
XYZ(4)
000h(4)
D0(4)
D1(4)
FFFh(4)FFFh(3)FFFh(2)FFFh(1)000h(4)000h(3)000h(2)000h(1)000h(4)000h(3)000h(2)000h(1)XYZ(4)XYZ(3)
LN0(1)
ANCk(2)ANCk(1)
XYZ(2)XYZ(1)
FFFh(4)FFFh(3)FFFh(2)FFFh(1)000h(4)000h(3)000h(2)000h(1)000h(4)000h(3)000h(2)000h(1)XYZ(4)XYZ(3)
Act
ive
lin
e
(19
20
wo
rds)
Bas
ic S
trea
m 2
Bas
ic S
trea
m 3
Bas
ic S
trea
m 4
LN
/CR
CC
/AN
C
(see
TA
BL
E 2
-3)
Mu
ltip
lex
ed
LN
/CR
CC
/AN
C
(see
TA
BL
E 2
-13)
Stu
ffin
g
(see
TA
BL
E 2
-13)

82 Rec. ITU-R BT.2077-0
TABLE 2-13
Line structure of a 60, 60/1.001 or 50 Hz multiplexed data stream
Item
Number of data words
60 or 60/1.001 Hz
frame frequency
50 Hz frame
frequency
Multiplexed EAV 16
Multiplexed LN/CRCC/ANC 1088 2848
Stuffing data 1760 2112
Multiplexed SAV 16
Multiplexed active video 7680
Total word for a line 10560 12672
Next, the word-multiplexed data stream should be coded by 8B/10B encoding as specified by ANSI
INCITS 230.
The multiplexed data stream consisting of 12-bit words should be first converted to a byte series
and then coded as 8B/10B encoded data. The conversion to byte series should be done in order from
the beginning of the active data D0(4) and every two words in the same way as shown in Fig. 2-15.
When doing the 8B/10B encoding, the first four bytes of the multiplexed SAV and EAV should be
converted to a synchronization block as shown in Fig. 2-18. The first two words of the multiplexed
SAV should be replaced with the K28.5 special characters and those of the multiplexed EAV should
be replaced with the K29.7 special characters defined by ANSI INCITS 230, and the successive two
words should be replaced with content IDs. The content ID bit assignment should be as shown in
Tables 2-11 and 2-12. The 8B/10B encoding process should start at the first K28.5 special character
with a negative running disparity. The 8B/10B encoding process should be done in accordance with
current running disparity at all the lines that follow.
The 8B/10B encoding converts two 12-bit words of data to three 10-bit words. The
word-multiplexed data stream has 15840 words (10 bits/word) per line period for the 60 Hz and
60/1.001 Hz frame frequencies and 19008 words (10 bits/word) per line period for the 50 Hz frame
frequency.
FIGURE 2-18
Multiplexed SAV and EAV data replacement with synchronization block (60, 60/1.001 or 50 Hz)
FF
Fh(3
):4
-11
FF
Fh
(4):
0-7
FF
Fh
(4):
8-1
1F
FF
h(3
):0
-3
FF
Fh(1
):4
-11
FF
Fh
(2):
0-7
FF
Fh
(2):
8-1
1F
FF
h(1
):0
-3
00
0h
(3):
4-1
1
00
0h
(4):
0-7
00
0h
(4):
8-1
10
00h(3
):0
-3
Co
nte
nt
ID1
K2
8.5
(S
AV
) o
r K
29
.7 (
EA
V)
Co
nte
nt
ID2
K2
8.5
(S
AV
) o
r K
29
.7 (
EA
V)
8 bit
LSB
MSB
LSB
MSB
8 bit
FF
Fh(1
):4
-11
FF
Fh
(2):
8-1
1F
FF
h(1
):0
-3
00
0h
(3):
4-1
1
00
0h
(4):
0-7
00
0h
(4):
8-1
10
00h(3
):0
-3
Data replacement of
the first 4 bytes

Rec. ITU-R BT.2077-0 83
Next, the 8B/10B coded data should be serialized in order from the LSB into the serial stream of
10G link signal. The speed of the 10G link signals generated as described above for the 60 Hz
frame frequency is 15 840 (words/line) × 10 (bits/word) × 1125 (lines) × 60 (1/seconds), or
10.692 Gbit/s. For the frame frequency of 60/1.001 Hz, the speed is 15 840 (words/line) ×
10 (bits/word) × 1125 (lines) × 60/1.001 (1/second), or 10.692/1.001 Gbit/s. For the frame
frequency of 50 Hz, the speed is 19 008 (words/line) × 10 (bits/word) × 1125 (lines) ×
50 (1/seconds), or 10.692 Gbit/s.
4.1.3 Generating 10G link signals from 30, 30/1.001, 25, 24 or 24/1.001 Hz basic streams
The method for converting eight 30, 30/1.001, 25, 24 or 24/1.001 Hz basic streams to one 10G link
signal should be as shown in Figs. 2-19 and 2-20. First, the eight 30 Hz basic streams should be
converted to a word-multiplexed data stream by multiplexing word by word. Stuffing data should
be added to the eight basic streams as shown in Fig. 2-19. This results in a data stream that has
21 120 words for a frame frequency of 30 Hz or 30/1.001 Hz, 25 344 words for a frame frequency
of 25 Hz, and 26 400 words for a frame frequency of 24 Hz or 24/1.001 Hz. The stuffing data
should be reserved and filled with 100h.

84 Rec. ITU-R BT.2077-0
FIGURE 2-19
Multiplexing of eight 30, 30/1.001, 24 or 24/1.001 Hz basic streams
Bas
ic S
trea
m 1
XYZ(2)XYZ(1)
LN0(2)
LN0(8)
ANCk(8)
D0(8)
D0(2)D0(1)
U0
Uj
D1919(2)
D1919(8)
D1919(1)
Mu
ltip
lex
ed
dat
a st
ream
Mu
ltip
lex
ed E
AV
(32
wo
rds)
Mu
ltip
lex
ed
LN
/CR
CC
/AN
C
(see
TA
BL
E 2
-14
)
Mu
ltip
lex
ed S
AV
(3
2 w
ord
s)
12
bit
/wo
rd
12
bit
/wo
rd
12
bit
/wo
rd
Lin
e b
lan
kin
g
EA
V
(4 w
ord
s)
SA
V
(4 w
ord
s)
LN
/CR
CC
/AN
C
(see
TA
BL
E 2
-3)
Mu
ltip
lex
ed
acti
ve
lin
e
(15
36
0 w
ord
s)
21
12
0 w
ord
s/li
ne
(30
, 3
0/1
.00
1 H
z)
25
34
4 w
ord
s/li
ne
(25
Hz)
26
40
0 w
ord
s/li
ne
(24
, 2
4/1
.00
1 H
z)
12
bit
/wo
rd
000h(1)
FFFh(1)
XYZ(1)
000h(1)
LN0(1)
D1919(1)
000h(2)
FFFh(2)
XYZ(2)
000h(2)
LN0(2)
D1919(2)
000h(8)
FFFh(8)
XYZ(8)
000h(8)
LN0(8)
D1919(8)
ANCk(1)
000h(1)
FFFh(1)
XYZ(1)
000h(1)
D0(1)
D1(1)
ANCk(2)
000h(2)
FFFh(2)
XYZ(2)
000h(2)
D0(2)
D1(2)
ANCk(8)
000h(8)
FFFh(8)
XYZ(8)
000h(8)
D0(8)
D1(8)
FFFh(8)
FFFh(2)FFFh(1)000h(8)
000h(2)000h(1)000h(8)
LN0(1)
ANCk(2)ANCk(1)
XYZ(2)XYZ(1)
FFFh(8)
FFFh(2)FFFh(1)000h(8)
000h(2)000h(1)000h(8)
000h(2)000h(1)XYZ(8)
Act
ive
lin
e
(19
20
wo
rds)
Bas
ic S
trea
m 2
Bas
ic S
trea
m 8
000h(2)000h(1)XYZ(8)
Stu
ffin
g
(see
TA
BL
E 2
-14
)

Rec. ITU-R BT.2077-0 85
TABLE 2-14
Line structure of a 30, 30/1.001, 25, 24 or 24/1.001 Hz multiplexed data stream
Item
Number of data words
30 or 30/1.001 Hz
frame frequency
25 Hz frame
frequency
24 or 24/1.001 Hz
frame frequency
Multiplexed EAV 32
Multiplexed LN/CRCC/ANC 2 176 5 696 6 576
Stuffing data 3 520 4 224 4 400
Multiplexed SAV 32
Multiplexed active video 15 360
Total data words per line 21 120 25 344 26 400
Next, the word-multiplexed data stream should be coded by 8B/10B encoding as specified by ANSI
INCITS 230.
The multiplexed data stream consisting of 12-bit words should be first converted to a byte series
and then coded as 8B/10B encoded data. The conversion to byte series should be done in order
from the beginning of the active data D0(8) and every two words, in the same way as shown in
Fig. 2-15. When doing the 8B/10B encoding, the first four bytes of the multiplexed SAV and EAV
should be converted to a synchronization block as shown in Fig. 2-20. The first two words of the
multiplexed SAV should be replaced with the K28.5 special characters and those of the multiplexed
EAV should be replaced with the K29.7 special character defined by ANSI INCITS 230, and the
successive two words should be replaced with content IDs. The content ID bit assignment should be
as shown in Tables 2-11 and 2-12. The 8B/10B encoding process should start at the first K28.5
special character with a negative running disparity. The 8B/10B encoding process should be done in
accordance with current running disparity at all the lines that follow.
The 8B/10B encoding converts two 12-bit words of data to three 10-bit words.
The word-multiplexed data stream has 31 680 words (10 bits/word) per line for frame frequencies
of 30 Hz and 30/1.001 Hz, 38 016 words (10 bits/word) per line for a frame frequency of 25 Hz,
and 39 600 words (10 bits/word) per line for frame frequencies of 24 and 24/1.001 Hz.
FIGURE 2-20
Multiplexed SAV and EAV data replacement with synchronization block (30, 30/1.001, 25, 24 or 24/1.001 Hz)
FF
Fh(7
):4
-11
FF
Fh
(8):
0-7
FF
Fh
(8):
8-1
1F
FF
h(7
):0
-3
FF
Fh(5
):4
-11
FF
Fh
(6):
0-7
FF
Fh
(6):
8-1
1F
FF
h(5
):0
-3
FF
Fh(3
):4
-11
FF
Fh
(4):
0-7
FF
Fh
(4):
8-1
1F
FF
h(3
):0
-3
Co
nte
nt
ID1
K2
8.5
(S
AV
) o
r K
29
.7 (
EA
V)
Co
nte
nt
ID2
K2
8.5
(S
AV
) o
r K
29
.7 (
EA
V)
8 bit
LSB
MSB
LSB
MSB
8 bit
FF
Fh(5
):4
-11
FF
Fh
(6):
8-1
1F
FF
h(5
):0
-3
FF
Fh(3
):4
-11
FF
Fh
(4):
0-7
FF
Fh
(4):
8-1
1F
FF
h(3
):0
-3
Data replacement of
the first 4 bytes

86 Rec. ITU-R BT.2077-0
The 8B/10B coded data should be serialized in order from the LSB into the serial stream of 10G
link signal. The speed of the 10G link signals generated as described above for the 30 Hz frame
frequency is 31 680 (words/line) × 10 (bits/word) × 1125 (lines) × 30 (1/seconds), or 10.692 Gbit/s.
For the frame frequency of 30/1.001 Hz, the speed is 31 680 (words/line) × 10 (bits/word) ×
1125 (lines) × 30/1.001 (1/second), or 10.692/1.001 Gbit/s. For the frame frequency of 25 Hz, the
speed is 38 016 (words/line) × 10 (bits/word) × 1125 (lines) × 25 (1/second), or 10.692 Gbit/s. For
the frame frequency of 24 Hz, the speed is 39 600 (words/line) × 10 (bits/word) × 1125 (lines) ×
24 (1/second), or 10.692 Gbit/s. For the frame frequency of 24/1.001 Hz, the speed is
39 600 (words/line) × 10 (bits/word) × 1125 (lines) × 24/1.001 (1/second), or 10.692/1.001 Gbit/s.
4.2 Mapping of 8K or 4K image to 10G link signals
4.2.1 8K/ FR (Fr = 120, 120/1.001, 100)
The mapping of the 8K/Fr (Fr = 120, 120/1.001, 100) images listed below to the 10G link signals
should be as illustrated in Figs. 2-21 and 2-22.
– U2.1, U2.2 (8K/Fr, G′B′R′, 4:4:4);
– U2.8, U2.9 (8K/Fr, Y′C′BC′R, 4:4:4);
– U2.15, U2.16 (8K/Fr, Y′C′BC′R, 4:2:2);
– U2.22, U2.23 (8K/Fr, Y′C′BC′R, 4:2:0).
The SIp.q (p is an integer greater than or equal to 1 and less than or equal to 4; q is an integer
greater than or equal to 1 and less than or equal to 3) represents the 4K sub-image p for colour
component Cq generated by division of the 8K images and should be mapped as shown in Fig. 2-8.
The BIu.p.q (u is an integer greater than or equal to 1 and less than or equal to 4) represents the
basic image u generated by further division of 4Ks/Fr SIp.q and should be mapped as shown in
Fig. 2-9. BS1/Fr and BS2/Fr respectively represents the Fr Hz basic stream 1 and Fr Hz basic
stream 2 specified in Fig. 2-13. For the 8K/Fr mapping, one 10 GHz link signal should be generated
from the two Fr Hz basic streams. As shown in Fig. 2-7, fewer 4K sub-images should be generated
from the 8K image for 4:2:2 or 4:2:0 (both Y′C′BC′R) than for 4:4:4 (G′B′R′ or Y′C′BC′R). In
Fig. 2-21, the 4K sub-images that are appended with *1 should be generated with 4:4:4 and 4:2:2,
and those appended with *2 should be generated with only 4:4:4.

Rec. ITU-R BT.2077-0 87
FIGURE 2-21
Mapping to 10G links for 8K/Fr (Fr = 120. 120/1.001, 100) with 4:4:4(G′B′R′ or Y′C′BC′R) or 4:2:2 (Y′C′BC′R)
8K, 120Hz8K, 120Hz
8K/Fr
4Ks/Fr
2K/Fr10G Link 1
C1
C2
C3
C1
2K/Fr
2K/Fr
2K/Fr
BS1/Fr
BS1/Fr
BS2/Fr
BS2/Fr10G Link 13
4Ks/Fr
2K/Fr10G Link 2
2K/Fr
2K/Fr
2K/Fr
BS1/Fr
BS1/Fr
BS2/Fr
BS2/Fr10G Link 14
4Ks/Fr
2K/Fr10G Link 3
2K/Fr
2K/Fr
2K/Fr
BS1/Fr
BS1/Fr
BS2/Fr
BS2/Fr10G Link 15
4Ks/Fr
2K/Fr10G Link 4
2K/Fr
2K/Fr
2K/Fr
BS1/Fr
BS1/Fr
BS2/Fr
BS2/Fr10G Link 16
4Ks/Fr
2K/Fr10G Link 5
C2
2K/Fr
2K/Fr
2K/Fr10G Link 17
4Ks/Fr
2K/Fr10G Link 6
2K/Fr
2K/Fr
2K/Fr10G Link 18
4Ks/Fr
2K/Fr10G Link 7
2K/Fr
2K/Fr
2K/Fr10G Link 19
4Ks/Fr
2K/Fr10G Link 8
2K/Fr
2K/Fr
2K/Fr10G Link 20
4Ks/Fr
2K/Fr10G Link 9
C3
2K/Fr
2K/Fr
2K/Fr10G Link 21
4Ks/Fr
2K/Fr10G Link 10
2K/Fr
2K/Fr
2K/Fr10G Link 22
4Ks/Fr
2K/Fr10G Link 11
2K/Fr
2K/Fr
2K/Fr10G Link 23
4Ks/Fr
2K/Fr10G Link 12
2K/Fr
2K/Fr
2K/Fr10G Link 24
C1= G′ or Y′
C2= B′ or C′B
C3= R′ or C′R
*1
4:4:4:*1, *2
4:2:2:*1
BI1.1.1
BI2.1.1
BI3.1.1
BI4.1.1
BI1.2.1
BI2.2.1
BI3.2.1
BI4.2.1
BI1.3.1
BI2.3.1
BI3.3.1
BI4.3.1
BI1.4.1
BI2.4.1
BI3.4.1
BI4.4.1
BI1.1.2
BI2.1.2
BI3.1.2
BI4.1.2
BI1.2.2
BI2.2.2
BI3.2.2
BI4.2.2
BI1.3.2
BI2.3.2
BI3.3.2
BI4.3.2
BI1.4.2
BI2.4.2
BI3.4.2
BI4.4.2
BI1.1.3
BI2.1.3
BI3.1.3
BI4.1.3
BI1.2.3
BI2.2.3
BI3.2.3
BI4.2.3
BI1.3.3
BI2.3.3
BI3.3.3
BI4.3.3
BI1.4.3
BI2.4.3
BI3.4.3
BI4.4.3
SI1.1
SI2.1
SI3.1
SI4.1
SI1.2
SI2.2
SI3.2
SI4.2
SI1.3
SI2.3
SI3.3
SI4.3
BS1/Fr
BS1/Fr
BS2/Fr
BS2/Fr
BS1/Fr
BS1/Fr
BS2/Fr
BS2/Fr
BS1/Fr
BS1/Fr
BS2/Fr
BS2/Fr
BS1/Fr
BS1/Fr
BS2/Fr
BS2/Fr
BS1/Fr
BS1/Fr
BS2/Fr
BS2/Fr
BS1/Fr
BS1/Fr
BS2/Fr
BS2/Fr
BS1/Fr
BS1/Fr
BS2/Fr
BS2/Fr
BS1/Fr
BS1/Fr
BS2/Fr
BS2/Fr
*1
*1
*1
*1
*1
*2
*2
*1
*1
*2
*2
Fr = 120, 120/1.001, 100

88 Rec. ITU-R BT.2077-0
FIGURE 2-22
Mapping to 10G links for 8K/Fr (Fr = 120. 120/1.001, 100) with 4:2:0 (Y′C′BC′R)
4.2.2 8K/Fr (Fr = 60, 60/1.001, 50)
The mapping of the 8K/Fr (Fr = 60, 60/1.001, 50) images listed below to the 10G link signals
should be as illustrated in Fig. 2-23.
– U2.3, U2.4 (8K/Fr, G′B′R′, 4:4:4);
– U2.10, U2.11 (8K/Fr, Y′C′BC′R, 4:4:4);
– U2.17, U2.18 (8K/Fr, Y′C′BC′R, 4:2:2);
– U2.24, U2.25 (8K/Fr, Y′C′BC′R, 4:2:0).
8K, 120Hz8K, 120Hz
8K/Fr
4Ks/Fr
2K/Fr10G Link 1
C1
C2
C3
C1
2K/Fr
2K/Fr
2K/Fr
BS1/Fr
BS1/Fr
BS2/Fr
BS2/Fr10G Link 2
4Ks/Fr
2K/Fr10G Link 3
2K/Fr
2K/Fr
2K/Fr
BS1/Fr
BS1/Fr
BS2/Fr
BS2/Fr10G Link 4
4Ks/Fr
2K/Fr10G Link 5
2K/Fr
2K/Fr
2K/Fr
BS1/Fr
BS1/Fr
BS2/Fr
BS2/Fr10G Link 6
4Ks/Fr
2K/Fr10G Link 7
2K/Fr
2K/Fr
2K/Fr
BS1/Fr
BS1/Fr
BS2/Fr
BS2/Fr10G Link 8
4Ks/Fr
2K/Fr10G Link 9
C2
2K/Fr
2K/Fr
2K/Fr10G Link 10
4Ks/Fr
2K/Fr10G Link 11
C3
2K/Fr
2K/Fr
2K/Fr10G Link 12
C1= Y′
C2= C′B
C3= C′R
BI1.1.1
BI2.1.1
BI3.1.1
BI4.1.1
BI1.2.1
BI2.2.1
BI3.2.1
BI4.2.1
BI1.3.1
BI2.3.1
BI3.3.1
BI4.3.1
BI1.4.1
BI2.4.1
BI3.4.1
BI4.4.1
BI1.1.2
BI2.1.2
BI3.1.2
BI4.1.2
BI1.1.3
BI2.1.3
BI3.1.3
BI4.1.3
SI1.1
SI2.1
SI3.1
SI4.1
SI1.2
SI1.3
BS1/Fr
BS1/Fr
BS2/Fr
BS2/Fr
BS1/Fr
BS1/Fr
BS2/Fr
BS2/Fr
4:2:0
Fr = 120, 120/1.001, 100
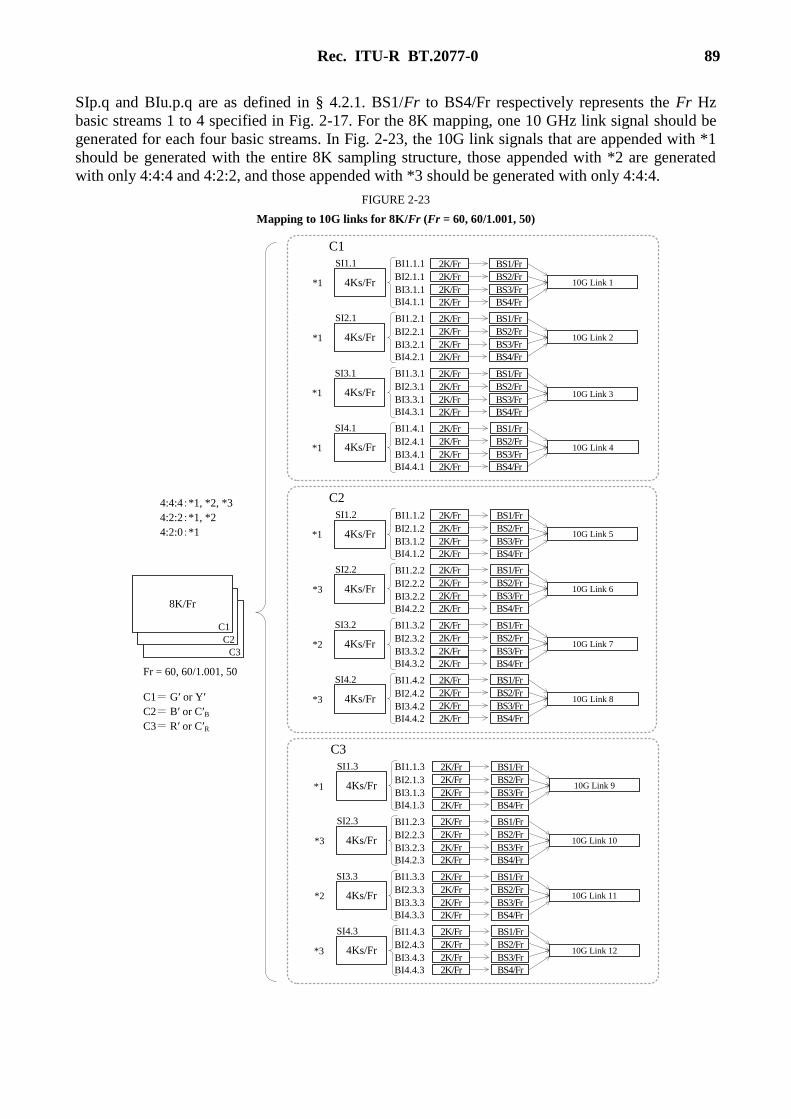
Rec. ITU-R BT.2077-0 89
SIp.q and BIu.p.q are as defined in § 4.2.1. BS1/Fr to BS4/Fr respectively represents the Fr Hz
basic streams 1 to 4 specified in Fig. 2-17. For the 8K mapping, one 10 GHz link signal should be
generated for each four basic streams. In Fig. 2-23, the 10G link signals that are appended with *1
should be generated with the entire 8K sampling structure, those appended with *2 are generated
with only 4:4:4 and 4:2:2, and those appended with *3 should be generated with only 4:4:4.
FIGURE 2-23
Mapping to 10G links for 8K/Fr (Fr = 60, 60/1.001, 50)
8K, 120Hz8K, 120Hz
8K/Fr
4Ks/Fr
2K/Fr
10G Link 1
C1
C2
C3
C1
2K/Fr
2K/Fr
2K/Fr
4Ks/Fr
2K/Fr
10G Link 22K/Fr
2K/Fr
2K/Fr
4Ks/Fr
2K/Fr
10G Link 32K/Fr
2K/Fr
2K/Fr
4Ks/Fr
2K/Fr
10G Link 42K/Fr
2K/Fr
2K/Fr
4Ks/Fr
2K/Fr
10G Link 5
C2
2K/Fr
2K/Fr
2K/Fr
4Ks/Fr
2K/Fr
10G Link 62K/Fr
2K/Fr
2K/Fr
4Ks/Fr
2K/Fr
10G Link 72K/Fr
2K/Fr
2K/Fr
4Ks/Fr
2K/Fr
10G Link 82K/Fr
2K/Fr
2K/Fr
4Ks/Fr
2K/Fr
C3
2K/Fr
2K/Fr
2K/Fr
10G Link 9
4Ks/Fr
2K/Fr
2K/Fr
2K/Fr
2K/Fr
10G Link 10
4Ks/Fr
2K/Fr
10G Link 112K/Fr
2K/Fr
2K/Fr
4Ks/Fr
2K/Fr
10G Link 122K/Fr
2K/Fr
2K/Fr
C1= G′ or Y′
C2= B′ or C′B
C3= R′ or C′R
4:4:4:*1, *2, *3
4:2:2:*1, *2
4:2:0:*1
BI1.1.1
BI2.1.1
BI3.1.1
BI4.1.1
BI1.2.1
BI2.2.1
BI3.2.1
BI4.2.1
BI1.3.1
BI2.3.1
BI3.3.1
BI4.3.1
BI1.4.1
BI2.4.1
BI3.4.1
BI4.4.1
BI1.1.2
BI2.1.2
BI3.1.2
BI4.1.2
BI1.2.2
BI2.2.2
BI3.2.2
BI4.2.2
BI1.3.2
BI2.3.2
BI3.3.2
BI4.3.2
BI1.4.2
BI2.4.2
BI3.4.2
BI4.4.2
BI1.1.3
BI2.1.3
BI3.1.3
BI4.1.3
BI1.2.3
BI2.2.3
BI3.2.3
BI4.2.3
BI1.3.3
BI2.3.3
BI3.3.3
BI4.3.3
BI1.4.3
BI2.4.3
BI3.4.3
BI4.4.3
SI1.1
SI2.1
SI3.1
SI4.1
SI1.2
SI2.2
SI3.2
SI4.2
SI1.3
SI2.3
SI3.3
SI4.3
BS1/Fr
BS2/Fr
BS3/Fr
BS4/Fr
BS1/Fr
BS2/Fr
BS3/Fr
BS4/Fr
BS1/Fr
BS2/Fr
BS3/Fr
BS4/Fr
BS1/Fr
BS2/Fr
BS3/Fr
BS4/Fr
BS1/Fr
BS2/Fr
BS3/Fr
BS4/Fr
BS1/Fr
BS2/Fr
BS3/Fr
BS4/Fr
BS1/Fr
BS2/Fr
BS3/Fr
BS4/Fr
BS1/Fr
BS2/Fr
BS3/Fr
BS4/Fr
BS1/Fr
BS2/Fr
BS3/Fr
BS4/Fr
BS1/Fr
BS2/Fr
BS3/Fr
BS4/Fr
BS1/Fr
BS2/Fr
BS3/Fr
BS4/Fr
BS1/Fr
BS2/Fr
BS3/Fr
BS4/Fr
*1
*1
*1
*1
*1
*3
*2
*3
*1
*3
*2
*3
Fr = 60, 60/1.001, 50

90 Rec. ITU-R BT.2077-0
4.2.3 8K/Fr (Fr = 30, 30/1.001, 25, 24, 24/1.001)
The mapping of the 8K/Fr (Fr = 30, 30/1.001, 25, 24, 24/1.001) images listed below to the 10G link
signals should be as illustrated in Fig. 2-24.
– U2.5, U2.6, U2.7 (8K/Fr, G′B′R′, 4:4:4);
– U2.12, U2.13, U2.14 (8K/Fr, Y′C′BC′R, 4:4:4);
– U2.19, U2.20, U2.21 (8K/Fr, Y′C′BC′R, 4:2:2);
– U2.26, U2.27, U2.28 (8K/Fr, Y′C′BC′R, 4:2:0).
SIp.q and BIu.p.q are as defined in § 4.2.1. BS1/Fr to BS8/Fr respectively represents the Fr Hz
basic streams 1 to 8 specified in Fig. 2-19. For the 8K/Fr mapping, one 10 GHz link signal should
be generated for each eight basic streams. In Fig. 2-24, the 4K sub-images that are appended with
*1 should be generated with the entire 8K sampling structure, those appended with *2 should be
generated with only 4:4:4 and 4:2:2, and those appended with *3 are generated with only 4:4:4.
For the 4:2:0 case, the 4K sub-images appended with *2 should not be generated, so the number of
basic streams generated from the 4K sub-images of the C′B and C′R colour components that are
appended with *1 are less than eight. For that case, basic streams should be generated from basic
images for which the 12-bit data of the entire sample is 800h, and those streams should be assigned
to BS5/Fr, BS6/Fr, BS7/Fr, and BS8/Fr to generate the 10G link signal.

Rec. ITU-R BT.2077-0 91
FIGURE 2-24
Mapping to 10G links for 8K/Fr (Fr = 30, 30/1.001, 25, 24, 24/1.001)
8K, 120Hz8K, 120Hz
8K/Fr
4Ks/Fr
2K/Fr
10G Link 1
C1
C2
C3
C1
2K/Fr
2K/Fr
2K/Fr
4Ks/Fr
2K/Fr
10G Link 2
2K/Fr
2K/Fr
2K/Fr
4Ks/Fr
2K/Fr
2K/Fr
2K/Fr
2K/Fr
4Ks/Fr
2K/Fr
2K/Fr
2K/Fr
2K/Fr
4Ks/Fr
2K/Fr
C2
2K/Fr
2K/Fr
2K/Fr
4Ks/Fr
2K/Fr
2K/Fr
2K/Fr
2K/Fr
4Ks/Fr
2K/Fr
2K/Fr
2K/Fr
2K/Fr
4Ks/Fr
2K/Fr
2K/Fr
2K/Fr
2K/Fr
4Ks/Fr
2K/Fr
C3
2K/Fr
2K/Fr
2K/Fr
4Ks/Fr
2K/Fr
2K/Fr
2K/Fr
2K/Fr
4Ks/Fr
2K/Fr
2K/Fr
2K/Fr
2K/Fr
4Ks/Fr
2K/Fr
2K/Fr
2K/Fr
2K/Fr
C1= G′ or Y′
C2= B′ or C′B
C3= R′ or C′R
4:4:4:*1, *2, *3
4:2:2:*1, *2
4:2:0:*1
BI1.1.1
BI2.1.1
BI3.1.1
BI4.1.1
BI1.2.1
BI2.2.1
BI3.2.1
BI4.2.1
BI1.3.1
BI2.3.1
BI3.3.1
BI4.3.1
BI1.4.1
BI2.4.1
BI3.4.1
BI4.4.1
BI1.1.2
BI2.1.2
BI3.1.2
BI4.1.2
BI1.2.2
BI2.2.2
BI3.2.2
BI4.2.2
BI1.3.2
BI2.3.2
BI3.3.2
BI4.3.2
BI1.4.2
BI2.4.2
BI3.4.2
BI4.4.2
BI1.1.3
BI2.1.3
BI3.1.3
BI4.1.3
BI1.2.3
BI2.2.3
BI3.2.3
BI4.2.3
BI1.3.3
BI2.3.3
BI3.3.3
BI4.3.3
BI1.4.3
BI2.4.3
BI3.4.3
BI4.4.3
SI1.1
SI2.1
SI3.1
SI4.1
SI1.2
SI2.2
SI3.2
SI4.2
SI1.3
SI2.3
SI3.3
SI4.3
BS1/Fr
BS2/Fr
BS3/Fr
BS4/Fr
BS1/Fr
BS2/Fr
BS3/Fr
BS4/Fr
BS5/Fr
BS6/Fr
BS7/Fr
BS8/Fr
BS5/Fr
BS6/Fr
BS7/Fr
BS8/Fr
BS1/Fr
BS2/Fr
BS3/Fr
BS4/Fr
BS1/Fr
BS2/Fr
BS3/Fr
BS4/Fr
BS5/Fr
BS6/Fr
BS7/Fr
BS8/Fr
BS5/Fr
BS6/Fr
BS7/Fr
BS8/Fr
BS1/Fr
BS2/Fr
BS3/Fr
BS4/Fr
BS1/Fr
BS2/Fr
BS3/Fr
BS4/Fr
BS5/Fr
BS6/Fr
BS7/Fr
BS8/Fr
BS5/Fr
BS6/Fr
BS7/Fr
BS8/Fr
*1
*1
*1
*1
*1
*3
*2
*3
*1
*3
*2
*3
10G Link 5
10G Link 6
10G Link 9
10G Link 10
Fr = 30, 30/1.001, 25,
24, 24/1.001

92 Rec. ITU-R BT.2077-0
4.2.4 4K/Fr (Fr = 120, 120/1.001, 100)
The mapping of the 4K/Fr (Fr = 120, 120/1.001, 100) images listed below to the 10G link signals
should be as illustrated in Fig. 2-25.
– U1.1, U1.2 (4K/Fr, G′B′R′, 4:4:4);
– U1.8, U1.9 (4K/Fr, Y′C′BC′R, 4:4:4);
– U1.15, U1.16 (4K/Fr, Y′C′BC′R, 4:2:2);
– U1.22, U1.23 (4K/Fr, Y′C′BC′R, 4:2:0).
The BIu.q (u is an integer greater than or equal to 1 and less than or equal to 4; q is an integer
greater than or equal to 1 and less than or equal to 3) represents basic image u for colour component
Cq generated by dividing the 4K images and should be mapped as shown in Fig. 2-9. BS1/Fr and
BS2/Fr represents the Fr Hz basic streams 1 and 2 that are defined in Fig. 2-13. For the 4K/Fr
mapping, one 10G link signal should be generated for each two Fr Hz basic streams.
For the case of 4:2:0, less than two Fr Hz basic streams should be generated from each CB and CR
colour component of the 4K images. For that case, an Fr Hz basic stream should be generated from
basic images for which the 12-bit data of the entire sample is 800h, and the stream should be
assigned to BS2/Fr to generate the 10G link signal.

Rec. ITU-R BT.2077-0 93
FIGURE 2-25
Mapping to 10G links for 4K/Fr (Fr = 120, 120/1.001, 100)
8K, 120Hz8K, 120Hz
4K/Fr
2K/Fr10G Link 1
C1
C2
C3
C1
2K/Fr
2K/Fr
2K/Fr
BS1/Fr
BS1/Fr
BS2/Fr
BS2/Fr10G Link 2
2K/Fr10G Link 5
C2
2K/Fr
2K/Fr
2K/Fr
BS1/Fr
BS1/Fr
BS2/Fr
BS2/Fr10G Link 6
2K/Fr10G Link 9
C3
2K/Fr
2K/Fr
2K/Fr
BS1/Fr
BS1/Fr
BS2/Fr
BS2/Fr10G Link 10
C1= G′ or Y′
C2= B′ or C′B
C3= R′ or C′R
8K, 120Hz8K, 120Hz
4K/Fr
C1
C2
C3
C1
2K/Fr
C2
2K/Fr
2K/Fr
2K/Fr
BS1/Fr
BS2/Fr
2K/Fr
C3
2K/Fr
2K/Fr
2K/Fr
BS1/Fr
BS2/Fr
C1= Y′
C2= C′B
C3= C′R
8K, 120Hz8K, 120Hz
4K/Fr
C1
C2
C3
C1
2K/Fr
C2
2K/Fr
2K/Fr
2K/Fr
BS1/Fr
2K/Fr
C3
2K/Fr
2K/Fr
2K/Fr
BS1/FrC1= Y′
C2= C′B
C3= C′R
2K/Fr10G Link 1
2K/Fr
2K/Fr
2K/Fr
BS1/Fr
BS1/Fr
BS2/Fr
BS2/Fr10G Link 2
2K/Fr10G Link 1
2K/Fr
2K/Fr
2K/Fr
BS1/Fr
BS1/Fr
BS2/Fr
BS2/Fr10G Link 2
4:4:4
4:2:2
4:2:0
BI1.1
BI2.1
BI3.1
BI4.1
BI1.2
BI2.2
BI3.2
BI4.2
BI1.3
BI2.3
BI3.3
BI4.3
BI1.1
BI2.1
BI3.1
BI4.1
BI1.2
BI3.2
BI1.3
BI3.3
BI1.1
BI2.1
BI3.1
BI4.1
BI1.2
BI1.3
10G Link 5
10G Link 9
10G Link 5
10G Link 9
Fr = 120, 120/1.001, 100
Fr = 120, 120/1.001, 100
Fr = 120, 120/1.001, 100
94 Rec. ITU-R BT.2077-0
4.2.5 4K/Fr (Fr = 60, 60/1.001, 50)
The mapping of the 4K/Fr (Fr = 60, 60/1.001, 50) images listed below to the 10G link signals
should be as illustrated in Fig. 2-26.
– U1.3, U1.4 (4K/Fr, G′B′R′, 4:4:4);
– U1.10, U1.11 (4K/Fr, Y′C′BC′R, 4:4:4);
– U1.17, U1.18 (4K/Fr, Y′C′BC′R, 4:2:2);
– U1.24, U1.25 (4K/Fr, Y′C′BC′R, 4:2:0).
BIu.q is as defined in § 4.2.4. BS1/Fr to BS4/Fr respectively represents the Fr Hz basic stream 1 to
4 specified in Fig. 2-17. For the 4K mapping, one 10 GHz link signal should be generated for each
four basic streams.
For the case of 4:2:2 and 4:2:0, less than four basic streams should be generated from the CB and CR
colour components of the 4K images, so basic streams should be generated from basic images for
which the 12-bit data of the entire sample is 800h, and those streams should be assigned to BS2/Fr
and BS4/Fr for 4:2:2 and to BS2/Fr, BS3/Fr, and BS4/Fr for 4:2:0 to generate the 10G link signal.

Rec. ITU-R BT.2077-0 95
FIGURE 2-26
Mapping to 10G links for 4K/Fr (Fr = 60, 60/1.001, 50)
8K, 120Hz8K, 120Hz
4K/Fr
2K/Fr
10G Link 1
C1
C2
C3
C1
2K/Fr
2K/Fr
2K/Fr
BS1/Fr
BS2/Fr
BS3/Fr
BS4/Fr
2K/Fr
C2
2K/Fr
2K/Fr
2K/Fr
BS1/Fr
BS2/Fr
BS3/Fr
BS4/Fr
2K/Fr
C3
2K/Fr
2K/Fr
2K/Fr
BS1/Fr
BS2/Fr
BS3/Fr
BS4/Fr
C1= G′ or Y′
C2= B′ or C′B
C3= R′ or C′R
8K, 120Hz8K, 120Hz
4K/Fr
C1
C2
C3
C1
2K/Fr
C2
2K/Fr
2K/Fr
2K/Fr
BS1/Fr
BS3/Fr
2K/Fr
C3
2K/Fr
2K/Fr
2K/Fr
BS1/Fr
BS3/Fr
C1= Y′
C2= C′B
C3= C′R
8K, 120Hz8K, 120Hz
4K/Fr
C1
C2
C3
C1
2K/Fr
C2
2K/Fr
2K/Fr
2K/Fr
BS1/Fr
2K/Fr
C3
2K/Fr
2K/Fr
2K/Fr
BS1/FrC1= Y′
C2= C′B
C3= C′R
2K/Fr
2K/Fr
2K/Fr
2K/Fr
BS1/Fr
BS2/Fr
BS3/Fr
BS4/Fr
2K/Fr
2K/Fr
2K/Fr
2K/Fr
BS1/Fr
BS2/Fr
BS3/Fr
BS4/Fr
10G Link 5
10G Link 9
10G Link 1
10G Link 1
4:4:4
4:2:2
4:2:0
BI1.1
BI2.1
BI3.1
BI4.1
BI1.2
BI2.2
BI3.2
BI4.2
BI1.3
BI2.3
BI3.3
BI4.3
BI1.1
BI2.1
BI3.1
BI4.1
BI1.2
BI3.2
BI1.3
BI3.3
BI1.1
BI2.1
BI3.1
BI4.1
BI1.2
BI1.3
10G Link 5
10G Link 9
10G Link 5
10G Link 9
Fr = 60, 60/1.001, 50
Fr = 60, 60/1.001, 50
Fr = 60, 60/1.001, 50

96 Rec. ITU-R BT.2077-0
4.2.6 4K/Fr (Fr = 30, 30/1.001, 25, 24, 24/1.001)
The mapping of the 4K/Fr (Fr = 30, 30/1.001, 25, 24, 24/1.001) images listed below to the 10G link
signals should be as illustrated in Fig. 2-27.
– U1.5, U1.6, U1.7 (4K/Fr, G′B′R′, 4:4:4);
– U1.12, U1.13, U1.14 (4K/Fr, Y′C′BC′R, 4:4:4);
– U1.19, U1.20, U1.21 (4K/Fr, Y′C′BC′R, 4:2:2);
– U1.26, U1.27, U1.28 (4K/Fr, Y′C′BC′R, 4:2:0).
BIu.q is as defined in § 4.2.4. BS1/Fr to BS4/Fr respectively represents the Fr Hz basic streams 1
to 4 specified in Fig. 2-19. One 10 GHz link signal should be generated for each eight basic
streams, but less than eight basic streams should be generated from the respective 4K colour
components, so basic streams should be generated from basic images for which the 12-bit data of
the entire sample is 100h for the colour components Y′, G′, B′, and R′ or 800h for C′B and C′R and
assigned to the unassigned basic stream in Fig. 2-27 to generate the 10G link signal.

Rec. ITU-R BT.2077-0 97
FIGURE 2-27
Mapping to 10G links for 4K/Fr (Fr = 30, 30/1.001, 25, 24, 24/1.001)
8K, 120Hz8K, 120Hz
4K/Fr
2K/Fr
10G Link 1
C1
C2
C3
C1
2K/Fr
2K/Fr
2K/Fr
BS1/Fr
BS2/Fr
BS3/Fr
BS4/Fr
2K/Fr
C2
2K/Fr
2K/Fr
2K/Fr
BS1/Fr
BS2/Fr
BS3/Fr
BS4/Fr
2K/Fr
C3
2K/Fr
2K/Fr
2K/Fr
BS1/Fr
BS2/Fr
BS3/Fr
BS4/Fr
C1= G′ or Y′
C2= B′ or C′B
C3= R′ or C′R
8K, 120Hz8K, 120Hz
4K/Fr
C1
C2
C3
C1
2K/Fr
C2
2K/Fr
2K/Fr
2K/Fr
BS1/Fr
BS3/Fr
2K/Fr
C3
2K/Fr
2K/Fr
2K/Fr
BS1/Fr
BS3/Fr
C1= Y′
C2= C′B
C3= C′R
8K, 120Hz8K, 120Hz
4K/Fr
C1
C2
C3
C1
2K/Fr
C2
2K/Fr
2K/Fr
2K/Fr
BS1/Fr
2K/Fr
C3
2K/Fr
2K/Fr
2K/Fr
BS1/FrC1= Y′
C2= C′B
C3= C′R
2K/Fr
2K/Fr
2K/Fr
2K/Fr
BS1/Fr
BS2/Fr
BS3/Fr
BS4/Fr
2K/Fr
2K/Fr
2K/Fr
2K/Fr
BS1/Fr
BS2/Fr
BS3/Fr
BS4/Fr
10G Link 5
10G Link 9
10G Link 1
10G Link 1
4:4:4
4:2:2
4:2:0
BI1.1
BI2.1
BI3.1
BI4.1
BI1.2
BI2.2
BI3.2
BI4.2
BI1.3
BI2.3
BI3.3
BI4.3
BI1.1
BI2.1
BI3.1
BI4.1
BI1.2
BI3.2
BI1.3
BI3.3
BI1.1
BI2.1
BI3.1
BI4.1
BI1.2
BI1.3
10G Link 5
10G Link 9
10G Link 5
10G Link 9
Fr = 30, 30/1.001, 25,
24, 24/1.001
Fr = 30, 30/1.001, 25,
24, 24/1.001
Fr = 30, 30/1.001, 25,
24, 24/1.001
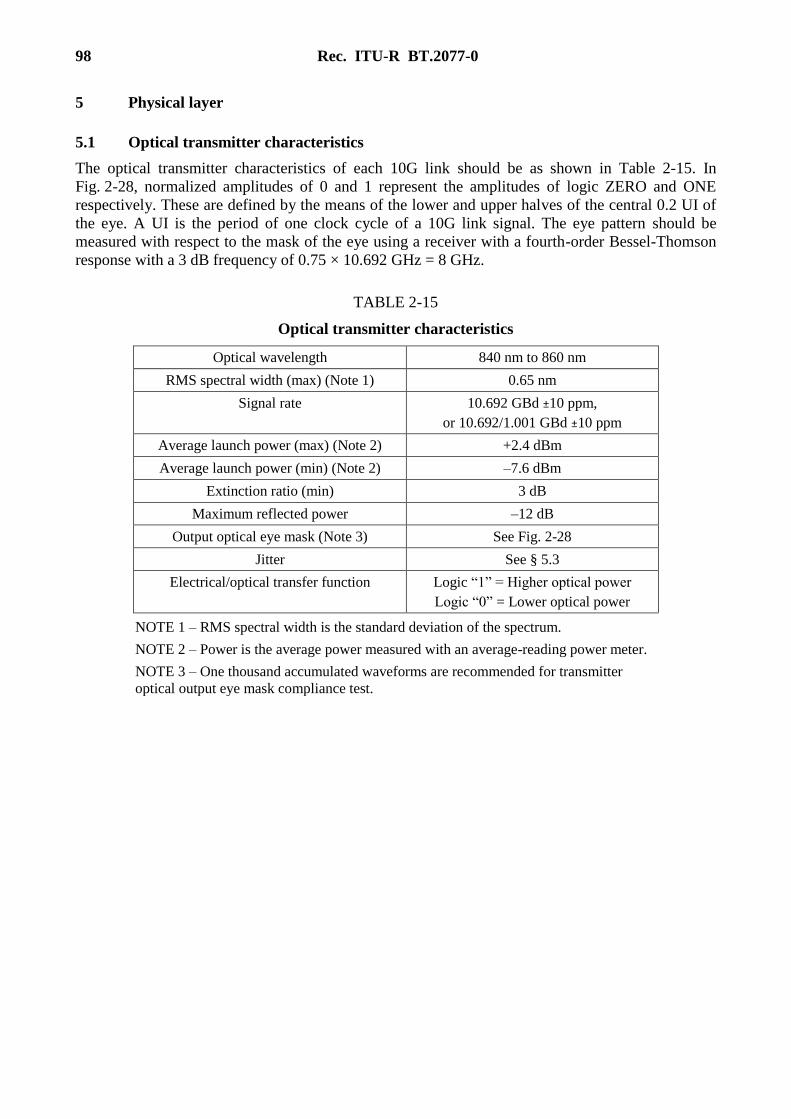
98 Rec. ITU-R BT.2077-0
5 Physical layer
5.1 Optical transmitter characteristics
The optical transmitter characteristics of each 10G link should be as shown in Table 2-15. In
Fig. 2-28, normalized amplitudes of 0 and 1 represent the amplitudes of logic ZERO and ONE
respectively. These are defined by the means of the lower and upper halves of the central 0.2 UI of
the eye. A UI is the period of one clock cycle of a 10G link signal. The eye pattern should be
measured with respect to the mask of the eye using a receiver with a fourth-order Bessel-Thomson
response with a 3 dB frequency of 0.75 × 10.692 GHz = 8 GHz.
TABLE 2-15
Optical transmitter characteristics
Optical wavelength 840 nm to 860 nm
RMS spectral width (max) (Note 1) 0.65 nm
Signal rate 10.692 GBd ±10 ppm,
or 10.692/1.001 GBd ±10 ppm
Average launch power (max) (Note 2) +2.4 dBm
Average launch power (min) (Note 2) –7.6 dBm
Extinction ratio (min) 3 dB
Maximum reflected power –12 dB
Output optical eye mask (Note 3) See Fig. 2-28
Jitter See § 5.3
Electrical/optical transfer function Logic “1” = Higher optical power
Logic “0” = Lower optical power
NOTE 1 – RMS spectral width is the standard deviation of the spectrum.
NOTE 2 – Power is the average power measured with an average-reading power meter.
NOTE 3 – One thousand accumulated waveforms are recommended for transmitter
optical output eye mask compliance test.
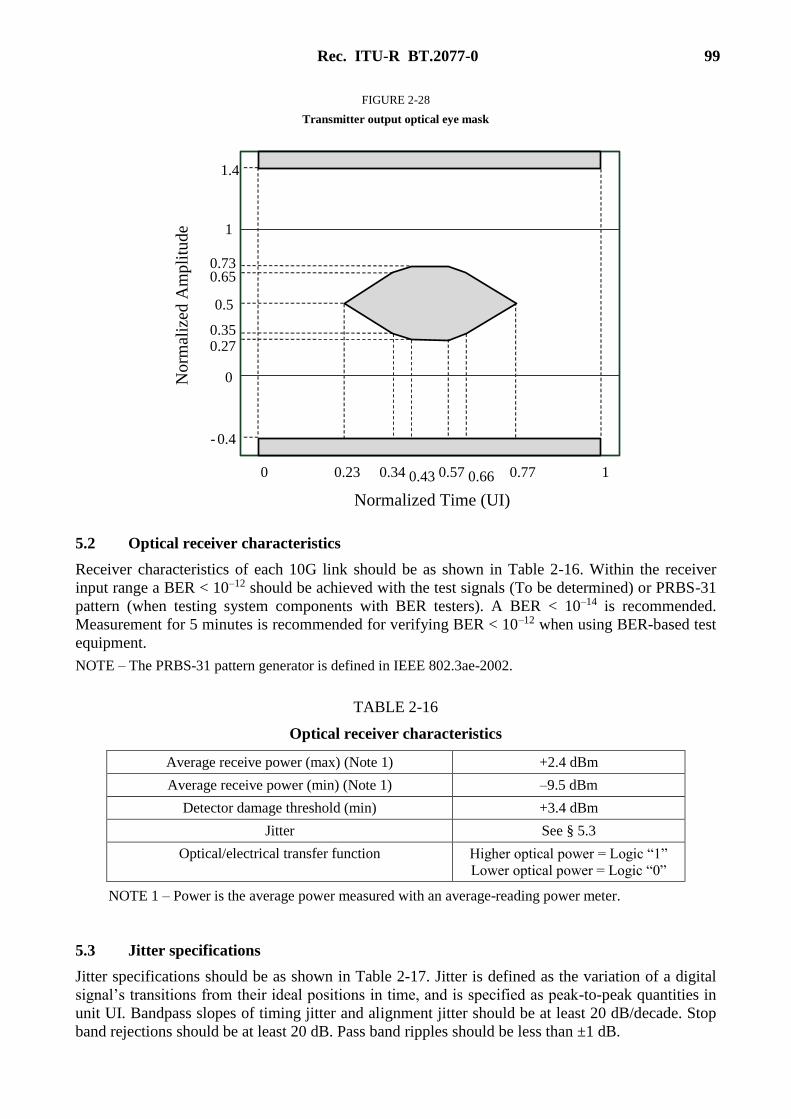
Rec. ITU-R BT.2077-0 99
FIGURE 2-28
Transmitter output optical eye mask
5.2 Optical receiver characteristics
Receiver characteristics of each 10G link should be as shown in Table 2-16. Within the receiver
input range a BER < 10–12 should be achieved with the test signals (To be determined) or PRBS-31
pattern (when testing system components with BER testers). A BER < 10–14 is recommended.
Measurement for 5 minutes is recommended for verifying BER < 10–12 when using BER-based test
equipment.
NOTE – The PRBS-31 pattern generator is defined in IEEE 802.3ae-2002.
TABLE 2-16
Optical receiver characteristics
Average receive power (max) (Note 1) +2.4 dBm
Average receive power (min) (Note 1) –9.5 dBm
Detector damage threshold (min) +3.4 dBm
Jitter See § 5.3
Optical/electrical transfer function Higher optical power = Logic “1”
Lower optical power = Logic “0”
NOTE 1 – Power is the average power measured with an average-reading power meter.
5.3 Jitter specifications
Jitter specifications should be as shown in Table 2-17. Jitter is defined as the variation of a digital
signal’s transitions from their ideal positions in time, and is specified as peak-to-peak quantities in
unit UI. Bandpass slopes of timing jitter and alignment jitter should be at least 20 dB/decade. Stop
band rejections should be at least 20 dB. Pass band ripples should be less than ±1 dB.
Normalized Time (UI)
No
rmal
ized
Am
pli
tude
0
- 0.4
1.4
1
0.5
0.350.27
0.650.73
0 10.23 0.34 0.43 0.57 0.66 0.77

100 Rec. ITU-R BT.2077-0
TABLE 2-17
Jitter specifications
Parameter Value Description
f1 10 Hz Low-frequency specification limit
f2 20 kHz Upper band edge for A1
f3 4 MHz Lower band edge for A2
f4 > 1/10 the clock rate High-frequency specification limit
A1 10 UI Timing jitter:
Sinusoidal jitter amplitude should be less than 2 × 10⁵/
f + 0.1 UI at 20 kHz < f ≤ 4 MHz.
A2 0.15 UI Alignment jitter:
Sinusoidal jitter amplitude should be less than 0.15 UI
at f > 4 MHz.
Error
criterion
BER = 10–12 Criterion for onset of errors
Test signal PRBS-31 or Colour bar Data rate of PRBS-31 should be 10.692 Gbit/s or
10.692/1.001 Gbit/s
NOTE – See Recommendation ITU-R BT.1363-1 for definition of jitter terms.
5.4 Timing difference
The timing difference between 10G link signals should not exceed 400 ns.
5.5 Optical connector
The optical connector characteristics should be as shown in Table 2-18. A receptacle connector with
equipment should be as shown in Fig. 2-29 and the dimensions of the receptacle should be as shown
in Table 2-19. A geometric array of the 24 fibres for the receptacle connector should comply with
IEC 61754-7.
TABLE 2-18
Optical connector characteristics
Number of fibres 24
Fibre type Multi mode fibre
Connection loss Less than 0.75 dB
Insertion/withdrawals More than 5000 times
Equilibrium tensile loading of connectors 250 N
Other requirements Lock mechanism
Dustproof structure

Rec. ITU-R BT.2077-0 101
FIGURE 2-29
Receptacle connector with equipment
ME
CH
AN
ICA
L R
EF
ER
EN
CE
PLA
NE
OP
TIC
AL
RE
FE
RE
NC
E P
LAN
E

102 Rec. ITU-R BT.2077-0
TABLE 2-19
Dimensions of the receptacle connector of equipment
Reference Dimensions
Minimum Maximum
A 0.697 mm 0.699 mm
C 4.597 mm 4.603 mm
D 6.3 mm 6.5 mm
E 10.7 mm 10.8 mm
F 12.2 mm 12.4 mm
G – 9.6 mm
H – 6.4 mm
J 5.7 mm –
K 1.8 mm 2.2 mm
L 4.3 mm 4.5 mm
M 1.7 mm 4.0 mm
N 1.0 mm –
P 9.9 mm 10.1 mm
Q 14.2 mm 14.36 mm
R 9.7 mm –
S 1.95 mm 2.0 mm
T 6.7 mm –
AA 2.4 mm 2.5 mm
AB 4.7 mm 5.1 mm
BA 0 mm 0.4 mm
BB 0.2 mm 0.5 mm
CA 1.6 mm 3.3 mm
FA 16.2 mm –
SA – 0.6 mm
SB – 0.5 mm
PP – 0.45 mm
SSA 29° 31°
SSB 39° 41°

Rec. ITU-R BT.2077-0 103
5.6 Assignment of 10G link signals to a receptacle connector
The assignment of 10G link signals to an output receptacle connector should be as shown in
Fig. 2-30, and the assignment of 10G link signals to an input receptacle connector should be as
shown in Fig. 2-31. Each number in Figs. 2-30 and 2-31 represents the number of a 10G link signal.
Symbol X and Y in Figs. 2-30 and 2-31 correspond to symbol X and Y respectively in Fig. 2-29.
FIGURE 2-30
Assignment of 10G link signals to an output receptacle connector with equipment
FIGURE 2-31
Assignment of 10G link signals to an input receptacle connector with equipment
1 2 3 4 5 6 7 8 9 10 11 12
13 14 15 16 17 18 19 20 21 22 23 24
X
Y
12 11 10 9 8 7 6 5 4 3 2 1
24 23 22 21 20 19 18 17 16 15 14 13
X
Y

104 Rec. ITU-R BT.2077-0
PART 3
1 Definition of terms
4320-line image 7 680 × 4 320 pixel image specified for the UHDTV system
2160-line image 3 840 × 2 160 pixel image specified for the UHDTV system
2160-line Intermediate
sub-image
3 840 × 2 160 pixel image obtained by sub-sampling of a 4320-line
image
1080-line sub-image 1 920 × 1 080-line image obtained by sub-sampling of 2160-line image
or 2160-line intermediate sub-image. Each 1080-line sub-image is
transported in N data streams, where N may be 1, 2, 4 or 8 dependent
on the image structure and frame frequency
4320/Fr 4320-line image with frame frequency of Fr (Fr = 120, 120/1.001, 100,
60, 60/1.001, 50, 30, 30/1.001, 25, 24, 24/1.001)
2160/Fr 2160-line image or intermediate sub-image with frame frequency of Fr
(Fr = 120, 120/1.001, 100, 60, 60/1.001, 50, 30, 30/1.001, 25, 24,
24/1.001)
1080/Fr 1080-line sub-image with frame frequency of Fr (Fr = 120, 120/1.001,
100, 60, 60/1.001, 50, 30, 30/1.001, 25, 24, 24/1.001)
Image structure The structure of the video samples of the source image
(image structure = 4:2:2 10-bit, 4:2:0 10-bit, 4:4:4:4 R′G′B′+A 10-bit,
4:4:4:4 Y′C′BC′R+A 10-bit, 4:4:4 R′G′B′ 12-bit, 4:4:4 Y′C′BC′R 12-bit,
4:2:2:4 Y′C′BC′R+A 12-bit)
Data stream A 10-bit-word multiplexed data stream with a clock rate of 148.5 MHz,
or 148.5/1.001 MHz, which consists of an EAV (end of active video)
timing reference code, a line number (LN), a CRCC
(cyclic redundancy check code) error detection code, ancillary data or
blanking data, an SAV (start of active video) timing reference code,
and video data. Each 1080-line sub-image is transported by N data
streams, where N may be 1, 2, 4 or 8 dependent on the image structure
and frame frequency.
Active line The video sample data words that constitute one line of video data in
a data stream
Active frame 1080 lines that include all active lines
Frame blanking The lines between an active frame and the next active frame
2 Overview of UHDTV mapping into multi-link 6G-SDI, 12G-SDI and 24G-SDI signals
2.1 Mapping for 4320-line images
The mapping of 4320-line images to single or multiple 6G, 12G or 24G link signals is illustrated in
Fig. 3-1.

Rec. ITU-R BT.2077-0 105
FIGURE 3-1
Mapping overview for 4320-line images with 120 Hz, 120/1.001 Hz, 100 Hz, 60 Hz, 60/1.001 Hz, 50 Hz,
30 Hz, 30/1.001 Hz, 24 Hz, or 24/1.001 Hz frame frequency
7680 x 4320 / Fr
3840 x 2160/
Fr
1920 x 1080/ Fr
4320-line Image2160-line Intermediate
Sub Image (1 ~ 4)
1080-line Sub Image
(1 ~ 16)
Data Stream
(1 ~ 16N)
12G-SDI
Link
(1 ~ 2N)
3840 x 2160/
Fr
3840 x 2160/
Fr
3840 x 2160/
Fr
6G-SDI
Link
(1 ~ 4N)
OR
1
2
3
4
5
6
7
8
16N-7
16N-6
16N-5
16N-4
16N-3
16N-2
16N-1
16N
1
1
2N
4N
1920 x 1080/ Fr
1920 x 1080/ Fr
1920 x 1080/ Fr
1920 x 1080/ Fr
1920 x 1080/ Fr
1920 x 1080/ Fr
1920 x 1080/ Fr
1920 x 1080/ Fr
1920 x 1080/ Fr
1920 x 1080/ Fr
1920 x 1080/ Fr
1920 x 1080/ Fr
1920 x 1080/ Fr
1920 x 1080/ Fr
1920 x 1080/ Fr
N = 1, 2, 4, 8
9
10
11
12
13
14
15
16
24G-SDI
Link
(1 ~ N)
OR
16N-15
16N-14
16N-13
16N-12
16N-11
16N-10
16N-9
16N-8N
1
The 4320-line source image is divided to produce four 2160-line intermediate sub-images, each of
which is then further divided to produce sixteen 1080-line sub-images.
Those sixteen 1080-line sub-images are mapped into 16N data streams, each four of which are
combined to one 6G link signal to generate 4N 6G link signals, or each eight of which are combined
to one 12G link signal to generate 2N 12G link signals, or each sixteen of which are combined to
one 24G link signal to generate N 24G link signals.
Table 3-1 lists the number of data streams required for each 4320-line source image format, and the
number of 6G, 12G or 24G links required to transport them.

106 Rec. ITU-R BT.2077-0
TABLE 3-1
4320-line image formats
4 320-line
Source image
structure
Number of
1 080-line
sub-
images
Frame
frequency
(Hz)
1 080-line
sub-image
structure
Number of
data streams
per 1 080-line
sub-image (N)
Number
of data
streams
Number
of 6G
links
Number
of 12G
links
Number
of 24G
links
4:2:2 Y′C′BC′R
10-bit
4:2:0 Y′C′BC′R
10-bit
16
120,
120/1.001 1 4 64 – 1 – 1
4
100 1 4 64 – 1 – 1 4
60, 60/1.001 1 2 32 – 1 4 2
50 1 2 32 – 1 4 2
30, 30/1.001 1 1 16 4 2 1
25 1 1 16 4 2 1
24, 24/1.001 1 1 16 4 2 1
4:4:4 R′G′B′
(+A)
10-bit
4:4:4
Y′C′BC′R(+A)
10-bit
16
120,
120/1.001 II 8 128 – 1 – 1
8
100 II 8 128 – 1 – 1 8
60, 60/1.001 II 4 64 – 1 – 1 4
50 II 4 64 – 1 – 1 4
30, 30/1.001 2 2 32 – 1 4 2
25 2 2 32 – 1 4 2
24, 24/1.001 2 2 32 – 1 4 2
4:4:4 R′G′B′
12-bit
4:4:4 Y′C′BC′R
12-bit
16
120,
120/1.001 III 8 128 – 1 – 1
8
100 III 8 128 – 1 – 1 8
60, 60/1.001 III 4 64 – 1 8 4
50 III 4 64 – 1 8 4
30, 30/1.001 3 2 32 – 1 4 2
25 3 2 32 – 1 4 2
24, 24/1.001 3 2 32 – 1 4 2
4:2:2:4
Y′C′BC′R(+A)
12-bit
16
120,
120/1.001 IV 8 128 – 1 – 1
8
100 IV 8 128 – 1 – 1 8
60, 60/1.001 IV 4 64 – 1 – 1 4
50 IV 4 64 – 1 – 1 4
30, 30/1.001 4 2 32 – 1 4 2
25 4 2 32 – 1 4 2
24, 24/1.001 4 2 32 – 1 4 2
NOTE 1 – Each image frame frequency and image structure has a video payload. For each video payload
there is flexibility in the choice of interface. For example a 4:2:2 10-bit image at 25 Hz has a video payload
which can be transported by a quad-link 6G interface, a dual-link 12G interface or a single link 24G
interface. Where there is no entry in the columns indicating the number of Links required, the interface is
not appropriate for that particular image structure, and an alternative should be selected which does support
the chosen image format. For example a 4:2:2 10-bit image at 60 Hz can be transported by an quad-link 12G
interface or a dual-link 24G interface, but there is no appropriate 6G interface available.

Rec. ITU-R BT.2077-0 107
2.2 Mapping for 2160-line images with 120 Hz, 120/1.001 Hz, 100 Hz, 60 Hz, 60/1.001 Hz,
50 Hz, 30 Hz, 30/1.001 Hz, 24 Hz, or 24/1.001 Hz frame frequency
The mapping of 2160-line images to single or multiple 6G, 12G, or 24G link signals is illustrated in
Fig. 3-2.
FIGURE 3-2
Mapping overview for 2160-line images
3840 x 2160 / Fr
1920 x 1080/
Fr
2160-line Image 1080-line Sub Image
(1 ~ 4)
Data Stream
(1 ~ 4N)
12G-SDI
Link
(1 ~ N/2)
6G-SDI
Link
(1 ~ N)
OR
1
2
3
4
5
6
7
8
4N-7
4N-6
4N-5
4N-4
4N-3
4N-2
4N-1
4N
1
1
N/2
NN = 1, 2, 4, 8
9
10
11
12
13
14
15
16
24G-SDI
Link
(1 ~ N/4)
OR
4N-15
4N-14
4N-13
4N-12
4N-11
4N-10
4N-9
4N-8N/4
1
1920 x 1080/
Fr
1920 x 1080/
Fr
1920 x 1080/
Fr
For 2160-line images the source image is divided to produce four 1080-line sub-images. Those four
1080-line sub-images are mapped into 4N data streams, each four of which are combined to one 6G
link signal to generate N 6G link signals, or each eight of which are combined to one 12G link
signal to generate N/2 12G link signals, or each sixteen of which are combined to one 24G link
signal to generate N/4 24G link signals.

108 Rec. ITU-R BT.2077-0
TABLE 3-2
2160-line image formats
2 160-line
Source image
structure
Number of
1 080-line
sub-images
Frame
frequency
(Hz)
1 080-line
sub-image
structure
Number of
data streams
per 1 080-line
sub-image (N)
Number
of data
streams
Number
of 6G
links
Number
of 12G
links
Number
of 24G
links
4:2:2 Y′C′BC′R
10-bit
or
4:2:0 Y′C′BC′R
10-bit
4
120,
120/1.001 1 4 16 4 2 1
100 1 4 16 4 2 1
60, 60/1.001 1 2 8 2 1 1 2
50 1 2 8 2 1 1 2
30, 30/1.001 1 1 4 1 – 2 1 2
25 1 1 4 1 – 2 1 2
24, 24/1.001 1 1 4 1 – 2 1 2
4:4:4 R′G′B′
(+A)
10-bit
or
4:4:4
Y′C′BC′R(+A)
10-bit
4
120,
120/1.001 II 8 32 –1 4 2
1004 II 8 32 – 1 4 2
60, 60/1.001 II 4 16 4 2 1
50 II 4 16 4 2 1
30, 30/1.001 2 2 8 2 1 1 2
25 2 2 8 2 1 1 2
24, 24/1.001 2 2 8 2 1 1 2
4:4:4 R′G′B′
12-bit
or
4:4:4 Y′C′BC′R
12-bit
4
120,
120/1.001 III 8 32 – 1 4 2
100 III 8 32 –1 4 2
60, 60/1.001 III 4 32 4 2 1
50 III 4 32 4 2 1
30, 30/1.001 3 2 32 2 1 1 2
25 3 2 32 2 1 1 2
24, 24/1.001 3 2 32 2 1 1 2
4:2:2:4
Y′C′BC′R(+A)
12-bit
4
120,
120/1.001 IV 8 32 – 1 4 2
100 IV 8 32 – 1 4 2
60, 60/1.001 IV 4 32 4 2 1
50 IV 4 32 4 2 1
30, 30/1.001 4 2 32 2 1 1 2
25 4 2 32 2 1 1 2
24, 24/1.001 4 2 32 2 1 1 2
NOTE 1 – Each image frame frequency and image structure has a video payload. For each video payload
there is flexibility in the choice of interface. For example a 4:4:4 12-bit image at 60 Hz has a video payload
which can be transported by a quad-link 6G interface, a dual-link 12G interface or a single link 24G
interface. Where there is no entry in the columns indicating the number of Links required, the interface is
not appropriate for that particular image structure, and an alternative should be selected which does support
the chosen image format. For example a 4:4:4 12-bit image at 120 Hz can be transported by an quad-link
12G interface or a dual-link 24G interface, but there is no appropriate 6G interface available.
NOTE 2 – In some cases the maximum capacity of the interface exceeds the requirement of the image. For
example a 4:2:2 10-bit image at 50 Hz can be transported by a single link 12G interface, but does not require
the data rate of a 24G interface. In this case the 12G signal would be transported over the 24G infrastructure
at 12G. Similarly a 6G signal would be transported over the 12G or 24G infrastructure at 6G.

Rec. ITU-R BT.2077-0 109
NOTE: Interface selection (Informative)
Where there is a choice of interfaces for a particular image format the choice can be made based on
the infrastructure available. Choice of infrastructure can be made taking into consideration
economic and operational factors, including other image formats to be transported using the same
infrastructure and the maximum cable length as indicated in Table 1 of this Recommendation.
A 6G infrastructure will support all 2160-line image formats with the exception of 100 Hz to
120 Hz inclusive 4:4:4 10-bit or 12-bit image formats by using single-, dual- or quad-link
interfaces. Support for 4320-line image formats is limited to 4:2:2 or 4:2:0 10-bit formats at up to
30 Hz frame frequency.
A 12G infrastructure will support all 2160-line image formats and 4320-line 4:2:2 or 4:2:0 10-bit
image formats at up to 60 Hz frame frequency by using single-, dual- or quad-link interfaces.
A 24G infrastructure will support all 2160-line and 4320-line formats by using single-, dual-, quad-
or octal-link interfaces.
The choice of infrastructure does not exclude interoperability with equipment or exchange using a
different choice. Simple interoperability between different choices of infrastructure may be enabled
by the use of gearbox devices, as described in Attachment 2 to Part 3.
3 Image division into 1080-line sub-images
3.1 Division of 4320-line image into 4 × 2160-line intermediate sub-images
The 4320-line source image division into four 2160-line intermediate sub-images uses the 2-sample
interleave division process.
Figure 3-3 shows 2-sample interleave division of a 4320-line image into four 2160-line images.
Even lines of the 4320-line source image should be divided into 2160-line intermediate
sub-images 1 and 2 as per two consecutive horizontal samples, and odd lines should be divided into
2160-line intermediate sub-images 3 and 4 as per two consecutive horizontal samples.

110 Rec. ITU-R BT.2077-0
FIGURE 3-3
2-sample interleave division of 4320-line image into 2160-line images
2160-line Intermediate Sub-Image 1
1 1 1 12 2 2 2
3 3 3 34 4 4 4
2-sample interleave division
1 1 1 12 2 2 2
3 3 3 34 4 4 4
1 1 1 12 2 2 2
3 3 3 34 4 4 4
0 3839
0
2159
2160-line Intermediate Sub-Image 20 3839
0
2159
9 9 9 910 10 10 10
11 11 11 1112 12 12 12
9 9 9 910 10 10 10
11 11 11 1112 12 12 12
9 9 9 910 10 10 10
11 11 11 1112 12 12 12
0 3839
2159
12 12 12 1214 14 14 14
15 15 15 1516 16 16 16
12 12 12 1214 14 14 14
15 15 15 1516 16 16 16
12 12 12 1314 14 14 14
15 15 15 1516 16 16 16
0 3839
0
2159
5 5 5 56 6 6 6
7 7 7 78 8 8 8
5 5 5 56 6 6 6
7 7 7 78 8 8 8
5 5 5 56 6 6 6
7 7 7 78 8 8 8
4320-line Source Image
1 1
3 3
2 2
4 4
0 7679
0
4319
5 5 6 6 1 1 2 25 5 6 6
7 7 8 8 3 3 4 47 7 8 8
9 9 9 912 12 12 1210 10 10 1014 14 14 14
11 11 11 1115 15 15 1512 12 12 1216 16 16 16
1 1
3 3
2 2
4 4
5 5 6 6 1 1 2 25 5 6 6
7 7 8 8 3 3 4 47 7 8 8
9 9 9 912 12 12 1210 10 10 1014 14 14 14
11 11 11 1115 15 15 1512 12 12 1216 16 16 16
1 1
3 3
2 2
4 4
5 5 6 6 1 1 2 25 5 6 6
7 7 8 8 3 3 4 47 7 8 8
9 9 9 912 12 12 1210 10 10 1014 14 14 14
11 11 11 1115 15 15 1512 12 12 1216 16 16
0
2160-line Intermediate Sub-Image 3
2160-line Intermediate Sub-Image 4
16
The 2160-line intermediate sub-images have the same image structure as the 4320-line source
image with the exception of 4:2:0 source images. In this case:
– The 0 components of the 4:2:0 (even-numbered samples on odd-numbered lines of
unassigned C′BC′R) system image data should be assigned 200h (512(10)) in case of a 10-bit
system and 800h (2048(10)) in case of a 12-bit system. The resulting intermediate
sub-images 1 and 2 will thus have a 4:2:2 image structure with the all of the C′B and C′R
components from the source image, and intermediate sub-images 3 and 4 will have a 4:2:2
image structure with the C′B and C′R components assigned 200h in the case of a 10-bit
system or 800h in the case of a 12-bit system.
See Attachment 1 to Part 3 “Image Division by Image Structure” for details.
3.2 Division of 2160-line image or intermediate sub-image into 4 × 1080-line sub-images
The 2160-line image is divided into four 1080-line sub-images using 2-sample interleave division.
Figure 3-4 shows 2-sample interleave division of a 2160-line image into four 1080-line images.
Even lines of the 2160-line image should be divided into 1080-line sub-images 1 and 2 as per two
consecutive horizontal samples, and odd lines should be divided into 1080-line sub-images 3 and 4
as per two consecutive horizontal samples.

Rec. ITU-R BT.2077-0 111
FIGURE 3-4
2-sample interleave division of 2160-line image into 1080-line images
Sub Image 1
0
03839/
4095
2159
1 21 2 1 21 2
3 43 4 3 43 4
1 21 2 1 21 2
3 43 4 3 43 4
1 21 2 1 21 2
3 43 4 3 43 4
2 Sample Interleave
Division2160 line Source Image or
Intermediate Sub Image 0
0
1079
1919/
2047
Sub Image 2
Sub Image 3
Sub Image 4
1080 line Sub Image
For 4320-line source images, 2160-line intermediate sub-image 1 should be divided to 1080-line
sub-images 1 to 4 inclusive.
Similarly 2160-line intermediate sub-image 2 should be divided to 1080-line sub-images 5 to 8
inclusive.
Similarly 2160-line intermediate sub-image 3 should be divided to 1080-line sub-images 9 to 12
inclusive.
Similarly 2160-line intermediate sub-image 4 should be divided to 1080-line sub-images 13 to 16
inclusive.
The 1080-line sub-images have the same image structure as the 4320-line source image or the
2160-line source image, with the exception of 4:2:0 source images. In this case:
– For 2160-line intermediate sub-images originating from a 4:2:0 4320-line source image, the
C′B and C′R components of 2160-line intermediate sub-images 3 and 4 are assigned 200h
(512(10)) in case of a 10-bit system and 800h (2048(10)) in case of a 12-bit system.
The resulting 1080-line sub-images 1 to 8 inclusive will thus have a 4:2:2 image structure
with the all of the C′B and C′R components from the source image, and 1080-line
sub-images 9 to 16 inclusive will have a 4:2:2 image structure with the C′B and C′R
components assigned 200h in the case of a 10-bit system or 800h in the case of a 12-bit
system.
– For 2160-line source images, the 0 components of the 4:2:0 (even-numbered samples on
odd-numbered lines of unassigned C′BC′R) system image data should be assigned 200h
(512(10)) in case of a 10-bit system and 800h (2048(10)) in case of a 12-bit system. The
resulting 1080-line sub-images 1 and 2 will thus have a 4:2:2 image structure with the all of
the C′B and C′R components from the source image, and 1080-line sub-images 3 and 4 will
have a 4:2:2 image structure with the C′B and C′R components assigned 200h in the case of
a 10-bit system or 800h in the case of a 12-bit system.
See Attachment 1 to Part 3 “Image Division by Image Structure” for informative details.

112 Rec. ITU-R BT.2077-0
4 Data stream
The frame structure of a data stream is shown in Fig. 3-5 and the data stream word numbering
within each line is shown in Table 3-4. A data stream comprises a 1080-line active frame and a
45-line frame blanking interval.
The 1080 lines from the sub-image are assigned to lines from line 42 to line 1121 of the data
stream. The frame blanking is assigned to the interval from line 1 to line 41 and from line 1122 to
line 1125. The structure of the frame blanking has the same line structure as shown in Table 3-4,
with the active line region allocated to ancillary data or blanking data.
FIGURE 3-5
Frame structure of data stream
Active video area
( From Sub Image(
42
1121
1
41
1122
1125
Ancillary data or
Blanking data
EAVAncillary data or
Blanking data
Frame
blanking
Frame
blanking
Active frameLN
CR
CC
EA
V
SA
V
An
cill
ary
da
ta
or
Bla
nkin
g d
ata
TABLE 3-3
Line numbers of data stream
Item Line number
Frame blanking 1-41, 1 122-1 125
Active frame 42-1 121

Rec. ITU-R BT.2077-0 113
TABLE 3-4
Word numbers of data stream lines
Item Symbol
Word number
120 or
120/1.001
Hz frame
frequency
100 Hz
frame
frequency
60 or
60/1.001 Hz
frame
frequency
50 Hz
frame
frequency
30 or
30/1.001
Hz frame
frequency
25 Hz
frame
frequency
24 or
24/1.001 Hz
frame
frequency
Active line
(video
data)
D 0-959 0-1 919 0-3 839
Timing
reference
code
(EAV)
EAV 960-963 1 920-1 923 3 840-3 843*1
3 840-3 847*2
Line
number
data
LN
LN0 964 1 924 3 844*1
3 848-3 849*2
LN1 965 1 925 3 845*1
3 850-3 851*2
Cyclic
redundancy
check
codes
CRCC
CRCC0 966 1 926 3 846*1
3 852-3 853*2
CRCC1 967 1 927 3 847*1
3 854-3 855*2
Ancillary
data or
Blanking
data
ANC 968-1
095
968-1
315
1 928-
2 195
1 928-
2 635
3 848-
4 395*1
3 856-
4 391*2
3 848-
5 275*1
3 856-
5 271*2
3 848-
5 495*1
3 856-
5 491*2
Timing
reference
code
(SAV)
SAV 1 096-1
099
1 316-
1 319
2 196-
2 199
2 636-
2 639
4 396-
4 399*1
4 392-
4 399*2
5 276-
5 279*1
5 272-
5 279*2
5 496-
5 499*1
5 492-
5 499*2
NOTE 1 – For all image structures except Image Structure 1.
NOTE 2 – For Image Structure 1.
4.1 100, 120/1.001 and 120 Hz images
Each sub-image is mapped into N data streams. N may be equal to four or eight according to the
image structure.
Each data stream has an active video container of size 960 × 1080 words at the source frame
frequency.
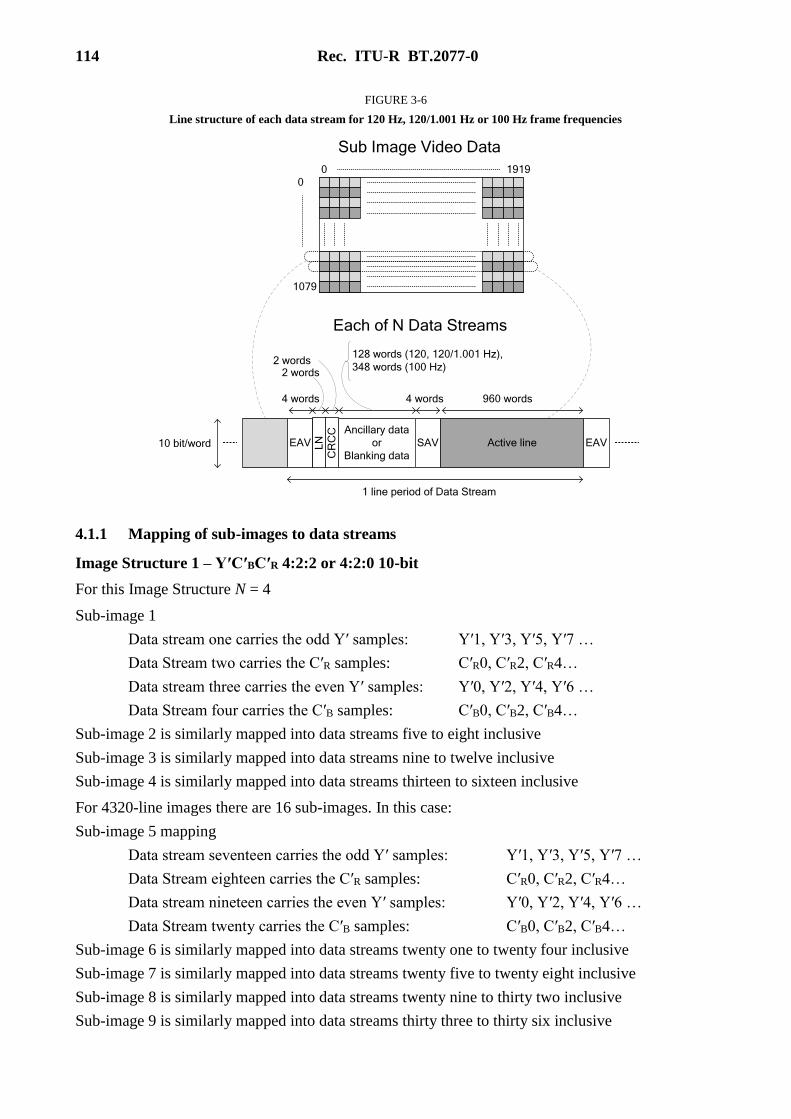
114 Rec. ITU-R BT.2077-0
FIGURE 3-6
Line structure of each data stream for 120 Hz, 120/1.001 Hz or 100 Hz frame frequencies
19190
0
1079
Ancillary data
or
Blanking data
EAV
4 words
128 words (120, 120/1.001 Hz),
348 words (100 Hz)
10 bit/word
4 words 960 words
SAV Active line EAV
Sub Image Video Data
Each of N Data StreamsL
N
CR
CC
2 words2 words
1 line period of Data Stream
4.1.1 Mapping of sub-images to data streams
Image Structure 1 – Y′C′BC′R 4:2:2 or 4:2:0 10-bit
For this Image Structure N = 4
Sub-image 1
Data stream one carries the odd Y′ samples: Y′1, Y′3, Y′5, Y′7 …
Data Stream two carries the C′R samples: C′R0, C′R2, C′R4…
Data stream three carries the even Y′ samples: Y′0, Y′2, Y′4, Y′6 …
Data Stream four carries the C′B samples: C′B0, C′B2, C′B4…
Sub-image 2 is similarly mapped into data streams five to eight inclusive
Sub-image 3 is similarly mapped into data streams nine to twelve inclusive
Sub-image 4 is similarly mapped into data streams thirteen to sixteen inclusive
For 4320-line images there are 16 sub-images. In this case:
Sub-image 5 mapping
Data stream seventeen carries the odd Y′ samples: Y′1, Y′3, Y′5, Y′7 …
Data Stream eighteen carries the C′R samples: C′R0, C′R2, C′R4…
Data stream nineteen carries the even Y′ samples: Y′0, Y′2, Y′4, Y′6 …
Data Stream twenty carries the C′B samples: C′B0, C′B2, C′B4…
Sub-image 6 is similarly mapped into data streams twenty one to twenty four inclusive
Sub-image 7 is similarly mapped into data streams twenty five to twenty eight inclusive
Sub-image 8 is similarly mapped into data streams twenty nine to thirty two inclusive
Sub-image 9 is similarly mapped into data streams thirty three to thirty six inclusive

Rec. ITU-R BT.2077-0 115
Sub-image 10 is similarly mapped into data streams thirty seven to forty inclusive
Sub-image 11 is similarly mapped into data streams forty one to forty four inclusive
Sub-image 12 is similarly mapped into data streams forty five to forty eight inclusive
Sub-image 13 is similarly mapped into data streams forty nine to fifty two inclusive
Sub-image 14 is similarly mapped into data streams fifty three to fifty six inclusive
Sub-image 15 is similarly mapped into data streams fifty seven to sixty inclusive
Sub-image 16 is similarly mapped into data streams sixty one to sixty four inclusive
Image Structure II – RGB 4:4:4 or 4:4:4:4 10-bit
For this Image Structure N = 8
Sub-image 1
Data stream one carries odd G′ samples: G′1, G′3, G′5…
Data stream two carries even R′ samples: R′0, R′2, R′4…
Data stream three carries even G′ samples: G′0, G′2, G′4…
Data stream four carries even B′ samples: B′0, B′2, B′4…
Data stream five carries odd A values: A1, A3, A5…
Data stream six carries odd R′ samples: R′1, R′3, R′5…
Data stream seven carries even A values: A0, A2, A4…
Data stream eight carries odd B′ samples: B′1, B′3, B′5…
Sub-image 2 is similarly mapped into data streams nine to sixteen inclusive
Sub-image 3 is similarly mapped into data streams seventeen to twenty four inclusive
Sub-image 4 is similarly mapped into data streams twenty five to thirty two inclusive
For 4 320-line images there are 16 sub images. In this case:
Sub image 5 mapping
Data stream thirty three carries odd G′ samples: G′1, G′3, G′5…
Data stream thirty four carries even R′ samples: R′0, R′2, R′4…
Data stream thirty five carries even G′ samples: G′0, G′2, G′4…
Data stream thirty six carries even B′ samples: B′0, B′2, B′4…
Data stream thirty seven carries odd A values: A1, A3, A5…
Data stream thirty eight carries odd R′ samples: R′1, R′3, R′5…
Data stream thirty nine carries even A values: A0, A2, A4…
Data stream forty carries odd B′ samples: B′1, B′3, B′5…
Sub image 6 is similarly mapped into data streams forty one to forty eight four inclusive
Sub image 7 is similarly mapped into data streams forty nine to fifty six inclusive
Sub image 8 is similarly mapped into data streams fifty seven to sixty four inclusive
Sub image 9 is similarly mapped into data streams sixty five to seventy two inclusive
Sub image 10 is similarly mapped into data streams seventy three to eighty inclusive
Sub image 11 is similarly mapped into data streams eighty one to eighty eight inclusive
Sub image 12 is similarly mapped into data streams eighty nine to ninety six inclusive
Sub image 13 is similarly mapped into data streams ninety seven to one hundred four inclusive

116 Rec. ITU-R BT.2077-0
Sub image 14 is similarly mapped into data streams one hundred five to one hundred twelve
inclusive
Sub image 15 is similarly mapped into data streams one hundred thirteen to one hundred twenty
inclusive
Sub image 16 is similarly mapped into data streams one hundred twenty one to one hundred twenty
eight inclusive
Image Structure III – R′G′B′ 4:4:4 12-bit
For this Image Structure N = 8
Sub-image 1
Data stream one carries the 10 MSBs of odd G′ samples: G′1:2-11, G′3:2-11, G′5:2-11…
Data stream two carries the 10 MSBs of even R′ samples: R′0:2-11, R′2:2-11, R′4:2-11…
Data stream three carries the 10 MSBs of even G′ samples: G′0:2-11, G′2:2-11, G′4:2-11…
Data stream four carries the 10 MSBs of even B′ samples: B′0:2-11, B′2:2-11, B′4:2-11…
Data stream five carries the 2 LSBs of odd R′G′B′ samples: R′G′B′1:0-1, R′G′B′3:0-1,
R′G′B′5:0-1…
Data stream six carries the 10 MSBs of odd R′ samples: R′1:2-11, R′ 3:2-11, R′5:2-11…
Data stream seven carries the 2 LSBs of even R′G′B′ samples: R′G′B′0:0-1, R′G′B′2:0-1,
R′G′B′4:0-1…
Data stream eight carries the 10 MSBs of odd B′ samples: B′1:2-11, B′ 3:2-11, B′5:2-11…
Sub-image 2 is similarly mapped into data streams nine to sixteen inclusive
Sub-image 3 is similarly mapped into data streams seventeen to twenty four inclusive
Sub-image 4 is similarly mapped into data streams twenty five to thirty two inclusive
For 4 320-line images there are 16 sub images. In this case:
Sub image 5 mapping
Data stream thirty three carries the 10 MSBs of odd G′ samples: G′1:2-11, G′3:2-11,
G′5:2-11….
Data stream thirty four carries the 10 MSBs of even R′ samples: R′0:2-11, R′2:2-11,
R′4:2-11…
Data stream thirty five carries the 10 MSBs of even G′ samples: G′0:2-11, G′2:2-11,
G′4:2-11…
Data stream thirty six carries the 10 MSBs of even B′ samples: B′0:2-11, B′2:2-11,
B′4:2-11…
Data stream thirty seven carries the 2 LSBs of odd R′G′B′ samples: R′G′B′1:0-1,
R′G′B′3:0-1, R′G′B′5:0-1 ….
Data stream thirty eight carries the 10 MSBs of odd R′ samples: R′1:2-11, R′ 3:2-11,
R′5:2-11 …
Data stream thirty nine carries the 2 LSBs of even R′G′B′ samples: R′G′B′0:0-1,
R′G′B′2:0-1, R′G′B′4:0-1 ….
Data stream forty carries the 10 MSBs of odd B′ samples: B′1:2-11, B′3:2-11, B′5:2-
11 …
Sub image 6 is similarly mapped into data streams forty one to forty eight four inclusive
Sub image 7 is similarly mapped into data streams forty nine to fifty six inclusive

Rec. ITU-R BT.2077-0 117
Sub image 8 is similarly mapped into data streams fifty seven to sixty four inclusive
Sub image 9 is similarly mapped into data streams sixty five to seventy two inclusive
Sub image 10 is similarly mapped into data streams seventy three to eighty inclusive
Sub image 11 is similarly mapped into data streams eighty one to eighty eight inclusive
Sub image 12 is similarly mapped into data streams eighty nine to ninety six inclusive
Sub image 13 is similarly mapped into data streams ninety seven to one hundred four inclusive
Sub image 14 is similarly mapped into data streams one hundred five to one hundred twelve
inclusive
Sub image 15 is similarly mapped into data streams one hundred thirteen to one hundred twenty
inclusive
Sub image 16 is similarly mapped into data streams one hundred twenty one to one hundred twenty
eight inclusive
Image Structure IV – Y′C′BC′R+A 4:2:2:4 12-bit
For this Image Structure N = 8
Sub-image 1
Data stream one carries the 10 MSBs of odd Y′ samples: Y′1:2-11, Y′3:2-11,
Y′5:2-11…
Data stream two carries the 10 MSBs of even C′R samples: C′R0:2-11, C′R2:2-11,
C′R4:2-11…
Data stream three carries the 10 MSBs of even Y′ samples: Y′0:2-11, Y′2:2-11,
Y′4:2-11…
Data stream four carries the 10 MSBs of even C′B samples: C′B0:2-11, C′B2:2-11,
C′B4:2-11…
Data stream five carries the 2 LSBs of odd Y′ samples: Y′1:0-1, Y′3:0-1, Y′5:0-1…
Data stream six carries the odd A samples: A1, A3, A5…
Data stream seven carries the 2 LSBs of even Y′C′BC′R samples: Y′C′BC′R0:0-1,
Y′C′BC′R2:0-1, Y′C′BC′R4:0-1…
Data stream eight carries the even A values: A0, A2, A4…
Sub-image 2 is similarly mapped into data streams nine to sixteen inclusive
Sub-image 3 is similarly mapped into data streams seventeen to twenty four inclusive
Sub-image 4 is similarly mapped into data streams twenty five to thirty two inclusive
For 4 320-line images there are 16 sub images. In this case:
Sub image 5 mapping
Data stream thirty three carries the 10 MSBs of odd Y′ samples: Y′1:2-11, Y′3:2-11,
Y′5:2-11….
Data stream thirty four carries the 10 MSBs of even C′R samples: C′R0:2-11, C′R2:2-11,
C′R4:2-11…
Data stream thirty five carries the 10 MSBs of even Y′ samples: Y′0:2-11, Y′2:2-11,
Y′4:2-11…
Data stream thirty six carries the 10 MSBs of even C′B samples: C′B0:2-11, C′B2:2-11,
C′B4:2-11…

118 Rec. ITU-R BT.2077-0
Data stream thirty seven carries the 2 LSBs of odd Y′ samples: Y′1:0-1, Y′3:0-1,
Y′5:0-1 ….
Data stream thirty eight carries the odd A samples: A1, A3, A5…
Data stream thirty nine carries the 2 LSBs of even Y′C′BC′R samples: Y′C′BC′R0:0-1,
Y′C′BC′R2:0-1, Y′C′BC′R4:0-1….
Data stream forty carries the even A values: A0, A2, A4 …
Sub image 6 is similarly mapped into data streams forty one to forty eight four inclusive
Sub image 7 is similarly mapped into data streams forty nine to fifty six inclusive
Sub image 8 is similarly mapped into data streams fifty seven to sixty four inclusive
Sub image 9 is similarly mapped into data streams sixty five to seventy two inclusive
Sub image 10 is similarly mapped into data streams seventy three to eighty inclusive
Sub image 11 is similarly mapped into data streams eighty one to eighty eight inclusive
Sub image 12 is similarly mapped into data streams eighty nine to ninety six inclusive
Sub image 13 is similarly mapped into data streams ninety seven to one hundred four inclusive
Sub image 14 is similarly mapped into data streams one hundred five to one hundred twelve
inclusive
Sub image 15 is similarly mapped into data streams one hundred thirteen to one hundred twenty
inclusive
Sub image 16 is similarly mapped into data streams one hundred twenty one to one hundred twenty
eight inclusive
4.2 50, 60/1.001 and 60 Hz images
Each sub-image is mapped into N data streams. N may be equal to two or four according to the
image structure.
Each data stream has an active video container of size 1920 × 1080 words at the source frame
frequency.

Rec. ITU-R BT.2077-0 119
FIGURE 3-7
Line structure of each Data Stream for 60 Hz, 60/1.001 Hz and 50 Hz frame frequencies
19190
0
1079
Ancillary data
or
Blanking data
EAV
4 words
268 words (120, 60, 60/1.001 Hz),
708 words (50 Hz),
10 bit/word
4 words 1920 words
SAV Active line EAV
Sub Image Video Data
Each of N Data Streams
LN
CR
CC
2 words2 words
1 line period of Data Stream
4.2.1 Mapping of sub-images to data streams
Image Structure 1 – Y′C′BC′R 4:2:2 or 4:2:0 10-bit
For this Image Structure N = 2
Sub-image 1
Data stream one carries the Y′ samples: Y′0, Y′1, Y′2, Y′3…
Data stream two carries the C′B and C′R samples: C′B0, C′R0, C′B2, C′R2…
Sub-image 2 is similarly mapped into data streams three and four
Sub-image 3 is similarly mapped into data streams five and six
Sub-image 4 is similarly mapped into data streams seven and eight
For 4320-line images there are 16 sub-images. In this case:
Sub-image 5 mapping:
Data stream nine carries the Y′ samples: Y′0, Y′1, Y′2, Y′3…
Data stream ten carries the C′B and C′R samples: C′B0, C′R0, C′B2, C′R2…
Sub-image 6 is similarly mapped into data streams eleven and twelve
Sub-image 7 is similarly mapped into data streams thirteen and fourteen
Sub-image 8 is similarly mapped into data streams fifteen and sixteen
Sub-image 9 is similarly mapped into data streams seventeen and eighteen
Sub-image 10 is similarly mapped into data streams nineteen and twenty
Sub-image 11 is similarly mapped into data streams twenty one and twenty two
Sub-image 12 is similarly mapped into data streams twenty three and twenty four

120 Rec. ITU-R BT.2077-0
Sub-image 13 is similarly mapped into data streams twenty five and twenty six
Sub-image 14 is similarly mapped into data streams twenty seven and twenty eight
Sub-image 15 is similarly mapped into data streams twenty nine and thirty
Sub-image 16 is similarly mapped into data streams thirty one and thirty two
Image Structure II – R′G′B′ 4:4:4 or 4:4:4:4 10-bit
For this Image Structure N = 4
Sub-image 1
Data stream one carries the G′ samples: G′0, G′1, G′2, G′3…
Data stream two carries even B′ and R′ samples: B′0, R′0, B′2, R′2…
Data stream three carries the A values: A0, A1, A2, A3…
Data stream four carries odd B′ and R′ samples: B′1, R′1, B′3, R′3…
Sub-image 2 is similarly mapped into data streams five to eight inclusive
Sub-image 3 is similarly mapped into data streams nine to twelve inclusive
Sub-image 4 is similarly mapped into data streams thirteen to sixteen inclusive
For 4320-line images there are 16 sub-images. In this case:
Sub-image 5 mapping:
Data stream seventeen carries the G′ samples: G′0, G′1, G′2, G′3…
Data stream eighteen carries even B′ and R′ samples: B′0, R′0, B′2, R′2…
Data stream nineteen carries the A values: A0, A1, A2, A3…
Data stream twenty carries odd B′ and R′ samples: B′1, R′1, B′3, R′3…
Sub-image 6 is similarly mapped into data streams twenty one to twenty four inclusive
Sub-image 7 is similarly mapped into data streams twenty five to twenty eight inclusive
Sub-image 8 is similarly mapped into data streams twenty nine to thirty two inclusive
Sub-image 9 is similarly mapped into data streams thirty three to thirty six inclusive
Sub-image 10 is similarly mapped into data streams thirty seven to forty inclusive
Sub-image 11 is similarly mapped into data streams forty one to forty four inclusive
Sub-image 12 is similarly mapped into data streams forty five to forty eight inclusive
Sub-image 13 is similarly mapped into data streams forty nine to fifty two inclusive
Sub-image 14 is similarly mapped into data streams fifty three to fifty six inclusive
Sub-image 15 is similarly mapped into data streams fifty seven to sixty inclusive
Sub-image 16 is similarly mapped into data streams sixty one to sixty four inclusive
For the 4:4:4 (Y′C′BC′R) and the 4:4:4:4 (Y′C′BC′R+A)/10-bit images, the image data are conveyed
as above except that:
The G′ samples are replaced with Y′ samples.
The B′ samples are replaced with C′B samples.
The R′ samples are replaced with C′R samples.
If Alpha samples are not present they are replaced with the value 040h.

Rec. ITU-R BT.2077-0 121
Image Structure III – R′G′B′ 4:4:4 12-bit
For this Image Structure N = 4
Sub-image 1
Data stream one carries the 10 MSBs of the G′ samples: G′0:2-11, G′1:2-11,
G′2:2-11, G′3:2-11…
Data stream two carries the 10 MSBs of even B′ and R′ samples: B′0:2-11, R′0:2-11,
B′2:2-11, R′2:2-11…
Data stream three carries the 2 LSBs of the R′G′B′ samples: R′G′B′0:0-1,
R′G′B′1:0-1, R′G′B′2:0-1…
Data stream four carries the 10 MSBs of odd B′ and R′ samples: B′1:2-11, R′1:2-11,
B′3:2-11, R′3:2-11…
Sub-image 2 is similarly mapped into data streams five to eight inclusive
Sub-image 3 is similarly mapped into data streams nine to twelve inclusive
Sub-image 4 is similarly mapped into data streams thirteen to sixteen inclusive
For 4320-line images there are 16 sub-images. In this case:
Sub-image 5 mapping
Data stream seventeen carries the 10 MSBs of the G′ samples: G′0:2-11,
G′1:2-11, G′2:2-11, G′3:2-11…
Data stream eighteen carries the 10 MSBs of even B′ and R′ samples: B′0:2-11,
R′0:2-11, B′ 2:2-11, R′2:2-11…
Data stream nineteen carries the 2 LSBs of the R′G′B′ samples: R′G′B′0:0-1,
R′G′B′1:0-1, R′G′B′2:0-1…
Data stream twenty carries the 10 MSBs of odd B′ and R′ samples: B′1:2-11,
R′1:2-11, B′3:2-11, R′3:2-11…
Sub-image 6 is similarly mapped into data streams twenty one to twenty four inclusive
Sub-image 7 is similarly mapped into data streams twenty five to twenty eight inclusive
Sub-image 8 is similarly mapped into data streams twenty nine to thirty two inclusive
Sub-image 9 is similarly mapped into data streams thirty three to thirty six inclusive
Sub-image 10 is similarly mapped into data streams thirty seven to forty inclusive
Sub-image 11 is similarly mapped into data streams forty one to forty four inclusive
Sub-image 12 is similarly mapped into data streams forty five to forty eight inclusive
Sub-image 13 is similarly mapped into data streams forty nine to fifty two inclusive
Sub-image 14 is similarly mapped into data streams fifty three to fifty six inclusive
Sub-image 15 is similarly mapped into data streams fifty seven to sixty inclusive
Sub-image 16 is similarly mapped into data streams sixty one to sixty four inclusive

122 Rec. ITU-R BT.2077-0
Image Structure IV – Y′C′BC′R+A 4:2:2:4 12-bit
For this Image Structure N = 4
Sub-image 1
The 2 LSBs of odd C′B and C′R samples should be “00” for this Image Structure.
Data stream one carries the 10 MSBs of the Y′ samples: Y′0:2-11,
Y′1:2-11, Y′2:2-11, Y′3:2-11…
Data stream two carries the 10 MSBs of even C′B and C′R samples: C′B0:2-11,
C′R0:2-11, C′B2:2-11, C′R2:2-11
Data stream three carries the 2 LSBs of Y′C′BC′R samples: Y′C′BC′R0:0-1,
Y′C′BC′R1:0-1, Y′C′BC′R2:0-1, Y′C′BC′R3:0-1…
Data stream four carries the even A values: A0, A1, A2, A3…
Sub-image 2 is similarly mapped into data streams five to eight inclusive
Sub-image 3 is similarly mapped into data streams nine to twelve inclusive
Sub-image 4 is similarly mapped into data streams thirteen to sixteen inclusive
For 4320-line images there are 16 sub-images. In this case:
Sub-image 5 mapping:
Data stream seventeen carries the 10 MSBs of the Y′ samples: Y′0:2-11,
Y′1:2-11, Y′2:2-11, Y′3:2-11…
Data stream eighteen carries the 10 MSBs of even C′B and C′R samples: C′B0:2-11,
C′R0:2-11, C′B2:2-11, C′R2:2-11
Data stream nineteen carries the 2 LSBs of Y′C′BC′R samples: Y′C′BC′R0:0-1,
Y′C′BC′R1:0-1, Y′C′BC′R2:0-1, Y′C′BC′R3:0-1…
Data stream twenty carries the even A values: A0, A1, A2, A3...
Sub-image 6 is similarly mapped into data streams twenty one to twenty four inclusive
Sub-image 7 is similarly mapped into data streams twenty five to twenty eight inclusive
Sub-image 8 is similarly mapped into data streams twenty nine to thirty two inclusive
Sub-image 9 is similarly mapped into data streams thirty three to thirty six inclusive
Sub-image 10 is similarly mapped into data streams thirty seven to forty inclusive
Sub-image 11 is similarly mapped into data streams forty one to forty four inclusive
Sub-image 12 is similarly mapped into data streams forty five to forty eight inclusive
Sub-image 13 is similarly mapped into data streams forty nine to fifty two inclusive
Sub-image 14 is similarly mapped into data streams fifty three to fifty six inclusive
Sub-image 15 is similarly mapped into data streams fifty seven to sixty inclusive
Sub-image 16 is similarly mapped into data streams sixty one to sixty four inclusive
4.3 24/1.001, 24, 25, 30/1.001, and 30 Hz images
Each sub-image is mapped into N data streams. N may be equal to one or two according to the
image structure.
Each data stream has an active video container of size 3840 × 1080 words at the source frame
frequency.
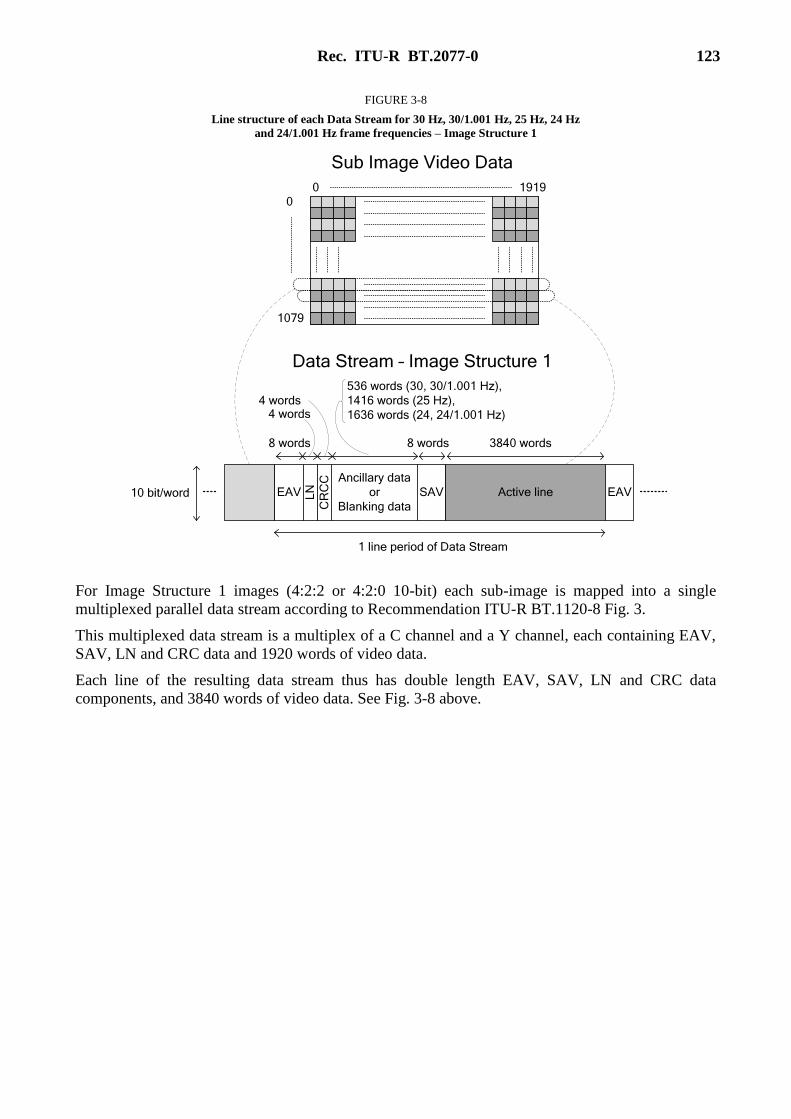
Rec. ITU-R BT.2077-0 123
FIGURE 3-8
Line structure of each Data Stream for 30 Hz, 30/1.001 Hz, 25 Hz, 24 Hz
and 24/1.001 Hz frame frequencies – Image Structure 1
19190
0
1079
Ancillary data
or
Blanking data
EAV
8 words
536 words (30, 30/1.001 Hz),
1416 words (25 Hz),
1636 words (24, 24/1.001 Hz)
10 bit/word
8 words 3840 words
SAV Active line EAV
Sub Image Video Data
Data Stream – Image Structure 1
LN
CR
CC
4 words4 words
1 line period of Data Stream
For Image Structure 1 images (4:2:2 or 4:2:0 10-bit) each sub-image is mapped into a single
multiplexed parallel data stream according to Recommendation ITU-R BT.1120-8 Fig. 3.
This multiplexed data stream is a multiplex of a C channel and a Y channel, each containing EAV,
SAV, LN and CRC data and 1920 words of video data.
Each line of the resulting data stream thus has double length EAV, SAV, LN and CRC data
components, and 3840 words of video data. See Fig. 3-8 above.

124 Rec. ITU-R BT.2077-0
FIGURE 3-9
Line structure of each Data Stream for 30 Hz, 30/1.001 Hz, 25 Hz, 24 Hz and
24/1.001 Hz frame frequencies – Image Structures 2, 3 and 4
19190
0
1079
Ancillary data
or
Blanking data
EAV
4 words
548 words (30, 30/1.001 Hz),
1428 words (25 Hz),
1648 words (24, 24/1.001 Hz)
10 bit/word
4 words 3840 words
SAV Active line EAV
Sub Image Video Data
Each of N Data Streams
Image Structures 2, 3, 4
LN
CR
CC
2 words2 words
1 line period of Data Stream
For Image Structures 2, 3 and 4, each data stream contains a single instance of EAV, SAV, LN and
CRC per line, together with the video data as defined in § 4.3.1 below. As each active video line
part of the data stream consists of a multiplex of two components, each line contains 3840 words of
video. See Fig. 3-9 above.
4.3.1 Mapping of sub-images to data streams
Image Structure 1 – Y′C′BC′R 4:2:2 or 4:2:0 10-bit
For this Image Structure N = 1
Sub-image 1
Data stream one carries all samples: C′B0, Y′0, C′R0, Y′1, C′B2, Y′2, C′R2, Y′3…
Sub-image 2 is similarly mapped into data stream two
Sub-image 3 is similarly mapped into data stream three
Sub-image 4 is similarly mapped into data streams four
For 4320-line images there are 16 sub-images. In this case:
Sub-image 5 mapping:
Data stream five carries all samples: C′B0, Y′0, C′R0, Y′1, C′B2, Y′2, C′R2, Y′3…
Sub-image 6 is similarly mapped into data stream six
Sub-image 7 is similarly mapped into data stream seven
Sub-image 8 is similarly mapped into data stream eight
Sub-image 9 is similarly mapped into data stream nine
Rec. ITU-R BT.2077-0 125
Sub-image 10 is similarly mapped into data stream ten
Sub-image 11 is similarly mapped into data stream eleven
Sub-image 12 is similarly mapped into data stream twelve
Sub-image 13 is similarly mapped into data stream thirteen
Sub-image 14 is similarly mapped into data stream fourteen
Sub-image 15 is similarly mapped into data stream fifteen
Sub-image 16 is similarly mapped into data stream sixteen
Image Structure 2 – R′G′B′ 4:4:4 or 4:4:4:4 10-bit
For this Image Structure N = 2
Sub-image 1
Data stream one carries the G′ and R′ samples: G′0, R′0, G′1, R′1, G′2, R′2…
Data stream two carries the A values and B′ samples: A0, B′0, A1, B′1, A2, B′2…
Sub-image 2 is similarly mapped into data streams three and four
Sub-image 3 is similarly mapped into data streams five and six
Sub-image 4 is similarly mapped into data streams seven and eight
For 4320-line images there are 16 sub-images. In this case:
Sub-image 5 mapping:
Data stream nine carries the G′ and R′ samples: G′0, R′0, G′1, R′1, G′2, R′2…
Data stream ten carries the A values and B′ samples: A0, B′0, A1, B′1, A2, B′2…
Sub-image 6 is similarly mapped into data streams eleven and twelve
Sub-image 7 is similarly mapped into data streams thirteen and fourteen
Sub-image 8 is similarly mapped into data streams fifteen and sixteen
Sub-image 9 is similarly mapped into data streams seventeen and eighteen
Sub-image 10 is similarly mapped into data streams nineteen and twenty
Sub-image 11 is similarly mapped into data streams twenty one and twenty two
Sub-image 12 is similarly mapped into data streams twenty three and twenty four
Sub-image 13 is similarly mapped into data streams twenty five and twenty six
Sub-image 14 is similarly mapped into data streams twenty seven and twenty eight
Sub-image 15 is similarly mapped into data streams twenty nine and thirty
Sub-image 16 is similarly mapped into data streams thirty one and thirty two
For the 4:4:4 (Y′C′BC′R) and the 4:4:4:4 (Y′C′BC′R+A)/10-bit images, the image data are conveyed
as above except that:
The G′ samples are replaced with Y′ samples.
The B′ samples are replaced with C′B samples.
The R′ samples are replaced with C′R samples.
If Alpha samples are not present they are replaced with the value 040h.
Image Structure 3 – R′G′B′ 4:4:4 12-bit
For this Image Structure N = 2
Bit b9 in every word is the complement of b8. The lists and table below describe Bits b8 – b0

126 Rec. ITU-R BT.2077-0
Sub-image 1
Data stream one carries six bits of the R′G′B′ samples: R′G′B′0:11-9,
R′G′B′0:5-3, R′G′B′1:11-9, R′G′B′1:5-3...
Data stream two carries the remaining six bits of the R′G′B′ samples: R′G′B′0:8-6,
R′G′B′0:2-0, R′G′B′1:8-6, R′G′B′1:2-0…
TABLE 3-5
R′G′B′ (i):x-y Bit structure mapping into data words of the virtual interface
Bit number
Data stream B9 B8 B7 B6 B5 B4 B3 B2 B1 B0
Data stream one first
word of sample (i)
B8 R′ (i):11-9 G′ (i):11-9 B′ (i):11-9
Data stream one
second word
of sample (i)
B8
R′ (i):5-3 G′ (i):5-3 B′ (i):5-3
Data stream two first
word of sample (i)
B8 R′ (i):8-6 G′ (i):8-6 B′ (i):8-6
Data stream two
second word
of sample (i)
B8
R′ (i):2-0 G′ (i):2-0 B′ (i):2-0
Sub-image 2 is similarly mapped into data streams three and four
Sub-image 3 is similarly mapped into data streams five and six
Sub-image 4 is similarly mapped into data streams seven and eight
For 4320-line images there are 16 sub-images. In this case:
Sub-image 5 mapping:
Data stream nine carries six bits of the R′G′B′ samples: R′G′B′0:11-9, R′G′B′0:5-3,
R′G′B′1:11-9, R′G′B′1:5-3...
Data stream ten carries the remaining six bits of the R′G′B′ samples: R′G′B′0:8-6,
R′G′B′0:2-0, R′G′B′1:8-6, R′G′B′1:2-0…
Sub-image 6 is similarly mapped into data streams eleven and twelve
Sub-image 7 is similarly mapped into data streams thirteen and fourteen
Sub-image 8 is similarly mapped into data streams fifteen and sixteen
Sub-image 9 is similarly mapped into data streams seventeen and eighteen
Sub-image 10 is similarly mapped into data streams nineteen and twenty
Sub-image 11 is similarly mapped into data streams twenty one and twenty two
Sub-image 12 is similarly mapped into data streams twenty three and twenty four
Sub-image 13 is similarly mapped into data streams twenty five and twenty six
Sub-image 14 is similarly mapped into data streams twenty seven and twenty eight
Sub-image 15 is similarly mapped into data streams twenty nine and thirty
Sub-image 16 is similarly mapped into data streams thirty one and thirty two

Rec. ITU-R BT.2077-0 127
Image Structure 4 – Y′C′BC′R+A 4:2:2:4 12-bit
For this Image Structure N = 2
Bit b9 in every word is the complement of b8. The lists and table below describe Bits b8 – b0
Sub-image 1
Data stream one:
Bits b8 – b6: A0:11-9, A0:5-3, A1:11-9, A1:5-3...
Bits b5 – b0: Y′0:11-6, Y′0:5-0, Y′1:11-6, Y′1:5-0...
Data stream two:
Bits b8 – b6: A0:8-6, A0:2-0, A1:8-6, A1:2-0...
Bits b5 – b0: C′B 0:11-6, C′B 0:5-0, C′R 0:11-6, C′R 0:5-0...
TABLE 3-6
Y′(2i+r):x-y and A(2i+r):x-y Bit structure mapping into data words of the virtual interface
Bit number
Data stream 9 8 7 6 5 4 3 2 1 0
Data stream one first
word of sample (2i)
B:8 A (2i):11-9 Y′ (2i):11-6
Data stream one second
word of sample (2i)
B:8 A (2i):5-3 Y′ (2i):5-0
Data stream one first
word of sample (2i+1)
B:8 A (2i+1):11-9 Y′ (2i+1):11-6
Data stream one second
word of sample (2i+1)
B:8 A (2i+1):5-3 Y′ (2i+1):5-0
Data stream two first
word of sample (2i)
B:8 A (2i):8-6 C′B (2i):11-6
Data stream two second
word of sample (2i)
B:8 A (2i):2-0 C′B (2i):5-0
Data stream two first
word of sample (2i+1)
B:8 A (2i+1):8-6 C′R (2i):11-6
Data stream two second
word of sample (2i+1)
B:8 A (2i+1):2-0 C′R (2i):5-0
Sub-image 2 is similarly mapped into data streams three and four
Sub-image 3 is similarly mapped into data streams five and six
Sub-image 4 is similarly mapped into data streams seven and eight

128 Rec. ITU-R BT.2077-0
For 4320-line images there are 16 sub-images. In this case:
Sub-image 5 mapping:
Data stream nine:
Bits b8 – b6: A0:11-9, A0:5-3, A1:11-9, A1:5-3...
Bits b5 – b0: Y′0:11-6, Y′0:5-0, Y′1:11-6, Y′1:5-0...
Data stream ten:
Bits b8 – b6: A0:8-6, A0:2-0, A1:8-6, A1:2-0...
Bits b5 – b0: C′B 0:11-6, C′B 0:5-0, C′R 0:11-6, C′R 0:5-0...
Sub-image 6 is similarly mapped into data streams eleven and twelve
Sub-image 7 is similarly mapped into data streams thirteen and fourteen
Sub-image 8 is similarly mapped into data streams fifteen and sixteen
Sub-image 9 is similarly mapped into data streams seventeen and eighteen
Sub-image 10 is similarly mapped into data streams nineteen and twenty
Sub-image 11 is similarly mapped into data streams twenty one and twenty two
Sub-image 12 is similarly mapped into data streams twenty three and twenty four
Sub-image 13 is similarly mapped into data streams twenty five and twenty six
Sub-image 14 is similarly mapped into data streams twenty seven and twenty eight
Sub-image 15 is similarly mapped into data streams twenty nine and thirty
Sub-image 16 is similarly mapped into data streams thirty one and thirty two
4.5 Timing reference codes (SAV and EAV)
The two timing reference codes are the SAV, which is placed immediately before the video data
(active line), and the EAV, which is placed immediately after the video data. The bit assignments
for the SAV and EAV are as defined in Recommendation ITU-R BT.1120-8 Table 5.
The protection bit assignments are as defined in Recommendation ITU-R BT.1120-8 Table 6.
In Recommendation ITU-R BT.1120-8 Tables 5 and 6, F is an identification bit for
progressive/interlaced (first/second field).
The images in Part 3 of this Recommendation are all progressive, so the value of F is fixed at 0.
The V is an identifier bit for the frame blanking and the active video data. The value of V is 1 in
the frame blanking from line 1 to line 41 and from line 1122 to line 1125; the value is 0 in the active
video data from line 42 to line 1121. The H is an identifier bit that has a value of 0 for SAV and
1 for EAV. The values P0 through P3 are parity bits, which are used for one bit error correction and
two bits error detection on the receiving side. The assignment of those bits is defined as shown in
Recommendation ITU-R BT.1120-8 Table 6.
4.6 Line number data
The line numbering of the data stream uses the line numbers as defined in Recommendation
ITU-R BT.1120-8 section 4.1.3. The line numbers refer to the sub-image rather than to the
4320-line or 2160-line source image.
4.7 Error detection code data
The data stream error detection code data is represented by the 18 bits from CRCC0 to CRCC17
and is as defined in Recommendation ITU-R BT.1120-8, § 4.1.4.

Rec. ITU-R BT.2077-0 129
4.8 Ancillary data
Recommendation ITU-R BT.1364 describes the format and protocol for the use of ancillary data
packets.
The format of ancillary data packets for use with this interface should conform to Recommendation
ITU-R BT.1364.
Protocol for the use of ancillary data space in this interface should conform to Recommendation
ITU-R BT.1364 with the following exceptions:
For all source images other than Image Structure 1 images with 30 Hz, 30/1.001 Hz, 25 Hz, 24 Hz
and 24/1.001 Hz frame frequencies, the recommendations relating to the luminance channel should
refer to odd-numbered data streams and the recommendations relating to the colour-difference
channel should refer to even-numbered data streams
For all source images other than Image Structure 1 images with 30 Hz, 30/1.001 Hz, 25 Hz, 24 Hz
and 24/1.001 Hz frame frequencies, unless otherwise stated, the ancillary data should be
preferentially mapped into data stream one first and any remaining data should then be mapped onto
data stream three; then into data stream five and so on up to the limit of the number of data streams
in the interface.
For Image Structure 1 images with 30 Hz, 30/1.001 Hz, 25 Hz, 24 Hz and 24/1.001 Hz frame
frequencies, unless otherwise stated, the ancillary data should be preferentially mapped into the
luminance channel of data stream one first, and any remaining data should then be mapped into the
luminance channel of data stream two; then data stream three and so on up to the limit of the
number of data streams in the interface.
Data space requirements and locations for each data service are defined by their respective
application documents. In some cases it is required by specific applications that ancillary data be
mapped into all of the data streams in the interface (e.g. payload ID.)
4.9 Audio
Each sub-image has the format of a 1080-line HDTV image and should have audio embedded
according to Recommendation ITU-R BT.1365.
Recommendation ITU-R BT.1365 describes the generation and insertion of audio ancillary data
packets, including audio control packets and audio data packets, for up to 4 audio groups, groups
1 through 4. This allows for up to 16 channels of audio sampled at 48 kHz, or up to 8 channels of
audio sampled at 96 kHz.
A further 4 extended audio groups, groups 5, 6, 7 and 8, allowing for up to 32 channels at 48 kHz or
up to 16 channels at 96 kHz, can be inserted using the techniques described in Recommendation
ITU-R BT.1365 with different DID values for the audio data packets and audio control packets.
The DID values for extended audio data packets should be 1A7h for audio group 5, 2A6h for audio
group 6, 2A5h for audio group 7 and 1A4h for audio group 8.
The DID values for extended audio control packets should be 2A3h for audio group 5, 1A2h for
audio group 6, 1A1h for audio group 7 and 2A0h for audio group 8.
The audio clock phase data as defined in Recommendation ITU-R BT.1365 should be calculated
using a clock frequency of 74.25 (/1.001) MHz for signals with frame frequencies of 30 Hz,
30/1.001 Hz, 25 Hz, 24 Hz and 24/1.001 Hz.
The audio clock phase data as defined in Recommendation ITU-R BT.1365 should be calculated
using a clock frequency of 148.5 (/1.001) MHz for all other signals.

130 Rec. ITU-R BT.2077-0
4.9.1 Transport of the maximum number of audio channels
Audio should be embedded preferentially into data stream pair one/two. Any additional audio that
cannot fit into data stream pair one/two should be embedded into data stream pair three/four.
Similarly, further additional audio should be embedded into data stream pair five/six, and so on up
to the limit of the number of data streams in the interface.
For Image Structure 1 images with 30 Hz, 30/1.001 Hz, 25 Hz, 24 Hz and 24/1.001 Hz frame
frequencies, audio should be embedded preferentially into data stream one. Any additional audio
that cannot fit into data stream one should be embedded into data stream two. Similarly, further
additional audio should be embedded into data stream three, and so on up to the limit of the number
of data streams in the interface.
4.9.2 Audio copy between links
Alternatively, audio signals may be copied between data stream pairs, in order to allow that each
physical 6G-SDI or 12G-SDI link carries a copy of the embedded audio. In this case:
A block of data stream pairs should be allocated for original audio.
The block may consist of:
Data stream pair one/two OR
Data stream pairs one/two and three/four OR
Data streams one/two, three/four, five/six and seven/eight.
Within this block, audio should be embedded preferentially into data stream pair one/two. Any
additional audio that cannot fit into data stream pair one/two should be embedded into data stream
pair three/four if present. Similarly, further additional audio should be embedded into data stream
pair five/six, and finally into data stream pair seven/eight.
Audio in the block should be copied into equal sized blocks up to the limit of the number of data
streams in the interface.
For example:
– If data stream pairs one/two and three/four are allocated for original audio, and the interface
contains a total of sixteen data streams, then
• Data stream pair five/six carries a copy of the audio from data stream pair one/two, and
data stream pair seven/eight carries a copy of the audio from data stream pair
three/four.
• Data stream pair nine/ten carries a copy of the audio from data stream pair one/two, and
data stream pair eleven/twelve carries a copy of the audio from data stream pair
three/four.
• Data stream pair thirteen/fourteen carries a copy of the audio from data stream pair
one/two, and data stream pair fifteen/sixteen carries a copy of the audio from data
stream pair three/four.
The audio copy status of each data stream should be signalled in the payload ID. See § 4.10.
NOTE – Audio copy reduces the number of channels that can be transported by the interface.
4.10 Payload ID
Every data stream should contain a payload ID packet. This should be a type 2 ancillary data packet
with DID value of 41h, SDID value of 01h and four UDW words. The recommended location is
immediately after the error detection code data in line 10.

Rec. ITU-R BT.2077-0 131
The UDW bit assignment of payload ID packet is shown in Table 3-7. The payload ID packet must
be multiplexed once per frame of each data stream.
TABLE 3-7
Payload identifier definitions
Bit
number Word 1 Word 2 Word 3 Word 4
b7
See
Table 3-8
Progressive
transport (1)
Aspect ratio
16:9 (1) or Unknown (0) 6G, 12G or 24G link
assignment
Link1 (0h) – Link 8 (7h) b6
Progressive
picture (1)
Horizontal sampling
1920 (0) or 20485 (1)
b5 Reserved (0) Colorimetry
Recommendation
ITU-R BT.7096 (0h)
Reserved (1h)
Recommendation
ITU-R BT.2020 (2h)
Reserved (3h)
b4
Non-constant
luminance (0)
Constant
luminance (1)
Reserved (0)
b3
Picture rate
See
Table 3-9
Sampling structure
identification
See
Table 3-10
Reserved (0)
b2
Audio copy status:
Audio in this data stream
carries additional channels (0)
Audio in this data stream is
copied (1)
b1 Bit depth
10-bit (1h)
12-bit (2h)
Other values are Reserved
b0
TABLE 3-8
Word 1 assignment
Image
format
Transport interface
Single
6G
Dual
6G
Quad
6G
Single
12G
Dual
12G
Quad
12G
Single
24G
Dual
24G
Quad
24G
Octal
24G
4 320-line C4h D0h D2h DFh E1h E3h F1h
2 160-line C0h C2h C5h CEh D1h D3h E0h E2h – –
5 This bit should be set to “0” for all formats in Part 3 of this Recommendation. 6 Not permitted in this Recommendation.

132 Rec. ITU-R BT.2077-0
TABLE 3-9
Picture rate
Value Picture rate Value Picture rate Value Picture rate Value Picture rate
0h Not defined 1h 96/1.0017 2h 24/1.001 3h 24
4h 48/1.0017 5h 25 6h 30/1.001 7h 30
8h 487 9h 50 Ah 60/1.001 Bh 60
Ch 967 Dh 100 Eh 120/1.001 Fh 120
TABLE 3-10
Sampling structure
Value Sampling Value Sampling Value Sampling Value Sampling
0h 4:2:2
(Y′C′BC′R) 1h
4:4:4
(Y′C′BC′R) 2h
4:4:4
(R′G′B′) 3h
4:2:0
(Y′C′BC′R)
4h 4:2:2:4
(Y′C′BC′R+A) 5h
4:4:4:4
(Y′C′BC′R+A) 6h
4:4:4:4
(R′G′B′+A) 7h Reserved
8h 4:2:2:4
(Y′C′BC′R+D) 9h
4:4:4:4
(Y′C′BC′R+D) Ah
4:4:4:4
(R′G′B′+D) Bh Reserved
Ch Reserved Dh Reserved Eh Reserved Fh Reserved
4.11 Blanking data
The blanking data words occurring during blanking intervals that are not used for the timing
reference codes (SAV and EAV), line number data, error detection codes or ancillary data should be
set as listed below.
(1) Data stream samples for colour components Y′, R′, G′, B′, 10-bit or 10 MSBs of 12-bit:
040h
(2) Data stream samples for colour components C′B, C′R, 10-bit or 10 MSBs of 12-bit: 200h
(3) Data stream samples for colour components Y′, R′, G′, B′, C′B, C′R 2 LSBs of 12-bit: 200h
(4) Data stream values for component A: 040h
(5) Data stream samples for R′G′B′ 12-bit: 11-9 combined values: 200h
(6) Data stream samples for R′G′B′ 12-bit: 8-6 combined values: 224h
(7) Data stream samples for R′G′B′ 12-bit: 5-3 combined values: 200h
(8) Data stream samples for R′G′B′ 12-bit: 2-0 combined values: 200h
(9) Data stream samples for Y′C′BC′R 12-bit: 11-9 combined values: 104h
(10) Data stream samples for Y′C′BC′R 12-bit: 8-6 combined values: 220h
(11) Data stream samples for Y′C′BC′R 12-bit: 5-3 combined values: 200h
(12) Data stream samples for Y′C′BC′R 12-bit: 2-0 combined values: 200h
7 Not permitted in this Recommendation.

Rec. ITU-R BT.2077-0 133
5 Generation of 6G link signals
5.1 6G-SDI 10-bit Multiplex
See Tables 3-1 and 3-2 for data stream requirements for each source image format.
Prior to serialization:
For signals where the virtual interface requires four or more data streams:
Data streams one through four should be multiplexed word-by-word into a 6G-SDI 10-bit
interface.
The 10-bit interface should consist of a word multiplex of data streams one through four,
in the order data stream four, data stream two, data stream three, data stream one … etc.
For signals where the virtual interface requires eight or more data streams:
Data streams five through eight should be multiplexed word-by-word into a 6G-SDI 10-bit
interface.
The 10-bit interface should consist of a word multiplex of data streams five through eight,
in the order data stream eight, data stream six, data stream seven, data stream five … etc.
For signals where the virtual interface requires twelve or more data streams:
Data streams nine through twelve should be multiplexed word-by-word into a 6G-SDI
10-bit interface.
The 10-bit interface should consist of a word multiplex of data streams nine through twelve,
in the order data stream twelve, data stream ten, data stream eleven, data stream nine … etc.
For signals where the virtual interface requires sixteen data streams:
Data streams thirteen through sixteen should be multiplexed word-by-word into a 6G-SDI
10-bit interface.
The 10-bit interface should consist of a word multiplex of data streams thirteen through
sixteen, in the order data stream sixteen, data stream fourteen, data stream fifteen, data
stream thirteen … etc.
The 10-bit parallel interfaces so produced should have an interface frequency of 594 MHz
or 594/1.001 MHz.
5.1.1 Type 1 and Type 2 10-bit Parallel Interfaces
As shown in Table 3-4 and Fig. 3-8, data streams for 30 Hz, 30/1.001 Hz, 25 Hz, 24 Hz and
24/1.001 Hz frame frequencies images with Image Structure 1 (4:2:2 or 4:2:0 10-bit) have a line
structure with double length EAV, SAV, LN and CRC data components. These data streams, when
multiplexed, result in a Type 2 10-bit parallel interface. Figure 3-11 shows the Type 2 10-bit
parallel interface.
All other images use a Type 1 10-bit parallel interface. Figure 3-10 shows the Type 1 10-bit parallel
interface.

134 Rec. ITU-R BT.2077-0
FIGURE 3-10
6G-SDI 10-bit Multiplex – Type 1
6G-SDI 10-bit multiplex
Data Stream one
Data Stream two
Data Stream three
Data Stream four
40-bit Virtual Interface
EA
V 3
FF
EA
V 0
00
EA
V 0
00
LN
1
CR
C0
CR
C1
EA
V X
YZ
Blanking Code Words or Optional Ancillary
Data
SA
V 3
FF
SA
V 0
00
SA
V 0
00
SA
V X
YZ
Digital Active Line
EA
V 3
FF
EA
V 0
00
EA
V 0
00
LN
1
CR
C0
CR
C1
EA
V X
YZ
Blanking Code Words or Optional Ancillary
Data
SA
V 3
FF
SA
V 0
00
SA
V 0
00
SA
V X
YZ
Digital Active Line
EA
V 3
FF
EA
V 0
00
EA
V 0
00
LN
1
CR
C0
CR
C1
EA
V X
YZ
Blanking Code Words or Optional Ancillary
Data
SA
V 3
FF
SA
V 0
00
SA
V 0
00
SA
V X
YZ
Digital Active Line
EA
V 3
FF
EA
V 0
00
EA
V 0
00
LN
1
CR
C0
CR
C1
EA
V X
YZ
Blanking Code Words or Optional Ancillary
Data
SA
V 3
FF
SA
V 0
00
SA
V 0
00
SA
V X
YZ
Digital Active Line
LN
0L
N0
LN
0L
N0
EA
V 3
FF
EA
V 3
FF
EA
V 3
FF
EA
V 3
FF
EA
V 0
00
EA
V 0
00
EA
V 0
00
EA
V 0
00
EA
V 0
00
EA
V 0
00
EA
V 0
00
EA
V 0
00
EA
V X
YZ
EA
V X
YZ
EA
V X
YZ
EA
V X
YZ
LN
1
LN
1
LN
1
LN
1
Data Stream four
Data Stream two
Data Stream three
Data Stream one
LN
0
LN
0
LN
0
LN
0
FIGURE 3-11
6G-SDI 10-bit Multiplex – Type 2
6G-SDI 10-bit multiplex
Data Stream one
Data Stream two
Data Stream three
Data Stream four
40-bit Virtual Interface
LN
1
CR
C0
CR
C1
Blanking Code Words or Optional
Ancillary Data
SA
V 3
FF
SA
V 0
00
SA
V 0
00
SA
V X
YZ
Digital Active Line
LN
1
CR
C0
CR
C1
Blanking Code Words or Optional
Ancillary Data
SA
V 3
FF
SA
V 0
00
SA
V 0
00
SA
V X
YZ
Digital Active Line
LN
1
CR
C0
CR
C1
Blanking Code Words or Optional
Ancillary Data
SA
V 3
FF
SA
V 0
00
SA
V 0
00
SA
V X
YZ
Digital Active Line
LN
1
CR
C0
CR
C1
Blanking Code Words or Optional
Ancillary Data
SA
V 3
FF
SA
V 0
00
SA
V 0
00
SA
V X
YZ
Digital Active Line
LN
0L
N0
LN
0L
N0
EA
V 3
FF
EA
V 3
FF
EA
V 3
FF
EA
V 3
FF
EA
V 0
00
EA
V 0
00
EA
V 0
00
EA
V 0
00
EA
V 0
00
EA
V 0
00
EA
V 0
00
EA
V 0
00
EA
V X
YZ
EA
V X
YZ
EA
V X
YZ
EA
V X
YZ
LN
1
LN
1
LN
1
LN
1
Data Stream four
Data Stream two
Data Stream three
Data Stream one
LN
0
LN
0
LN
0
LN
0
EA
V 3
FF
EA
V 0
00
EA
V 0
00
EA
V X
YZ
EA
V 3
FF
EA
V 0
00
EA
V 0
00
EA
V X
YZ
EA
V 3
FF
EA
V 0
00
EA
V 0
00
EA
V X
YZ
EA
V 3
FF
EA
V 0
00
EA
V 0
00
EA
V X
YZ
LN
0L
N0
LN
0L
N0
CR
C1
CR
C1
CR
C1
CR
C1
CR
C0
CR
C0
CR
C0
CR
C0
LN
1L
N1
LN
1L
N1
EA
V X
YZ
EA
V X
YZ
EA
V X
YZ
EA
V X
YZ
EA
V 0
00
EA
V 0
00
EA
V 0
00
EA
V 0
00
EA
V 0
00
EA
V 0
00
EA
V 0
00
EA
V 0
00
EA
V 3
FF
EA
V 3
FF
EA
V 3
FF
EA
V 3
FF
SA
V X
YZ
SA
V X
YZ
SA
V X
YZ
SA
V X
YZ
SA
V 0
00
SA
V 0
00
SA
V 0
00
SA
V 0
00
SA
V 0
00
SA
V 0
00
SA
V 0
00
SA
V 0
00
SA
V 3
FF
SA
V 3
FF
SA
V 3
FF
SA
V 3
FF
EA
V 3
FF
EA
V 3
FF
EA
V 3
FF
EA
V 3
FF
EA
V 0
00
EA
V 0
00
EA
V 0
00
EA
V 0
00
EA
V 0
00
EA
V 0
00
EA
V 0
00
EA
V 0
00
LN
1
LN
1
LN
1
LN
1
LN
0
LN
0
LN
0
LN
0
EA
V X
YZ
EA
V X
YZ
EA
V X
YZ
EA
V X
YZ

Rec. ITU-R BT.2077-0 135
Each 6G-SDI 10-bit multiplexed interface should then be serialized to create a 6G-SDI serial
interface.
The 6G-SDI 10-bit multiplexed interface made up of data streams one through four should be
serialized as 6G-SDI serial Link 1.
The 6G-SDI 10-bit multiplexed interface made up of data streams five through eight should be
serialized as 6G-SDI serial Link 2.
The 6G-SDI 10-bit multiplexed interface made up of data streams nine through twelve should be
serialized as 6G-SDI serial Link 3.
The 6G-SDI 10-bit multiplexed interface made up of data streams thirteen through sixteen should
be serialized as 6G-SDI serial Link 4.
5.2 6G-SDI serial interface
5.2.1 Sync-bit insertion
Repeating patterns of 3FFh or 000h in the 6G-SDI 10-bit parallel multiplex can result in a long run
of ones and zeros feeding the scrambling polynomial.
To prevent long runs of ones and zeros, the 10-bit parallel multiplex data stream should be modified
such that the two least significant bits, of repeated 3FFh or 000h code words should be replaced by
the sync-bit values of 10b for 000h words and 01b for 3FFh words.
To ensure synchronization and word alignment can be reliably achieved in the receiver, one
complete sequence of preambles – 3FFh 000h 000h – should be retained without modification as
shown in Fig. 3-12.
This Sync-bit insertion process should be reversed in the receiver restoring the original 3FFh and
000h data patterns.

136 Rec. ITU-R BT.2077-0
FIGURE 3-12
Sync-bit insertion process
EA
V 3
FE
(C
)
EA
V 3
FE
(C
)
EA
V 3
FE
(C
)
EA
V 3
FE
(C
)
EA
V 3
FE
(Y
)
EA
V 3
FE
(Y
)
EA
V 3
FE
(Y
)
EA
V 3
FF
(Y
)
EA
V 0
00
(C
)
EA
V 0
00
(C
)
EA
V 0
02
(C
)
EA
V 0
02
(C
)
EA
V 0
02
(Y
)
EA
V 0
02
(Y
)
EA
V 0
02
(Y
)
EA
V 0
02
(Y
)
EA
V 0
02
(C
)
EA
V 0
02
(C
)
EA
V 0
02
(C
)
EA
V 0
02
(C
)
EA
V 0
02
(Y
)
EA
V 0
02
(Y
)
EA
V 0
02
(Y
)
EA
V 0
02
(Y
)
EA
V X
YZ
(C
)
EA
V X
YZ
(C
)
EA
V X
YZ
(C
)
EA
V X
YZ
(C
)
EA
V X
YZ
(Y
)
EA
V X
YZ
(Y
)
EA
V X
YZ
(Y
)
EA
V X
YZ
(Y
)
LN
0 (
C)
LN
0 (
C)
LN
0 (
C)
LN
0 (
C)
0000000000 0000000000
20 “0's”
Worst-case run of zeros
Into scrambler
LS
b
MS
b
01000000000100000000 01000000001111111111
3FF, 000, 000 sequence left intact for framing
10-bit Muliplex after sync bit
insertion
10111111111011111111
Worst-case run of ones
18 “1's”
10-bit word:
3FDh
1
1
1
1
1
1
1
1
0
1
0
0
0
0
0
0
0
0
1
0
10-bit word:
002h
MSb
LSb
0
0
0
0
0
0
0
0
0
0
10-bit word:
000h
0
1
1
0
Two LSb’s
replaced with:
1
1
1
1
1
1
1
1
1
1
10-bit word:
3FFh
MSb
LSb
TRS / AFD Preambles after
Sync-bit insertion
5.2.2 Channel coding and serialization
The channel coding and serializing should be according to Recommendation ITU-R BT.1120-8
§ 4.2.2 “Serializing” and § 4.2.3 “Channel coding”
5.2.3 Serial clock
The serial clock frequency should be ten times the 10-bit parallel interface frequency. I.e. 5.94 GHz
or 5.94/1.001 GHz.
5.2.4 Inter link delay
In the cases where an image is transported over multiple 6G links, the timing difference between the
EAV/SAV of any 6G link to any other 6G link should not exceed 250 ns at the source.
6 Generation of 12G link signals
6.1 12G-SDI 10-bit Multiplex
See Tables 3-1 and 3-2 for data stream requirements for each source image format
Prior to serialization:

Rec. ITU-R BT.2077-0 137
For signals where the virtual interface requires eight or more data streams:
Data streams one through eight should be multiplexed word-by-word into a 12G-SDI 10-bit
interface.
The 10-bit interface should consist of a word multiplex of data streams one through eight,
in the order data stream eight, data stream four, data stream six, data stream two, data
stream seven, data stream three, data stream five, data stream one … etc.
For signals where the virtual interface requires sixteen or more data streams:
Data streams nine through sixteen should be multiplexed word-by-word into a 12G-SDI
10-bit interface.
The 10-bit interface should consist of a word multiplex of data streams nine through
sixteen, in the order data stream sixteen, data stream twelve, data stream fourteen, data
stream ten, data stream fifteen data stream eleven, data stream thirteen data stream nine …
etc.
For signals where the virtual interface requires twenty four or more data streams:
Data streams seventeen through twenty four should be multiplexed word-by-word into a
12G-SDI 10-bit interface.
The 10-bit interface should consist of a word multiplex of data streams seventeen through
twenty four, in the order data stream twenty four, data stream twenty, data stream twenty
two, data stream eighteen, data stream twenty three, data stream nineteen, data stream
twenty one data stream seventeen … etc.
For signals where the virtual interface requires thirty two or more data streams:
Data streams twenty five through thirty two should be multiplexed word-by-word into
a 12G-SDI 10-bit interface.
The 10-bit interface should consist of a word multiplex of data streams twenty five through
thirty two, in the order data stream thirty two, data stream twenty eight, data stream thirty,
data stream twenty six, data stream thirty one, data stream twenty seven, data stream twenty
nine, data stream twenty five … etc.
The 10-bit parallel interfaces so produced should have an interface frequency of 1 188 MHz
or 1 188/1.001 MHz.
6.1.1 Type 1 and Type 2 10-bit parallel interfaces
As shown in Table 3-4 and Fig. 3-8, data streams for 30 Hz, 30/1.001 Hz, 25 Hz, 24 Hz and
24/1.001 Hz frame frequencies images with Image Structure 1 (4:2:2 or 4:2:0 10-bit) have a line
structure with double length EAV, SAV, LN and CRC data components. These data streams, when
multiplexed, result in a Type 2 10-bit parallel interface. Figure 3-14 shows the Type 2 10-bit
parallel interface.
All other images use a Type 1 10-bit parallel interface. Figure 3-13 shows the Type 1 10-bit parallel
interface.

138 Rec. ITU-R BT.2077-0
FIGURE 3-13
12G-SDI 10-bit Multiplex – Type 1
12G-SDI 10-bit multiplex
Data Stream one
Data Stream two
Data Stream three
Data Stream four
80-bit Virtual Interface
EA
V 3
FF
EA
V 3
FF
EA
V 3
FF
EA
V 3
FF
EA
V 0
00
EA
V 0
00
EA
V 0
00
EA
V 0
00
EA
V 0
00
EA
V 0
00
EA
V 0
00
EA
V 0
00
EA
V X
YZ
EA
V X
YZ
EA
V X
YZ
EA
V X
YZ
LN
1
LN
1
LN
1
LN
1
Data Stream four
Data Stream two
Data Stream three
Data Stream one
EA
V 3
FF
EA
V 0
00
EA
V 0
00
LN
1
CR
C0
CR
C1
EA
V X
YZ
Blanking Code Words or Optional Ancillary
Data
SA
V 3
FF
SA
V 0
00
SA
V 0
00
SA
V X
YZ
Digital Active Line
EA
V 3
FF
EA
V 0
00
EA
V 0
00
LN
1
CR
C0
CR
C1
EA
V X
YZ
Blanking Code Words or Optional Ancillary
Data
SA
V 3
FF
SA
V 0
00
SA
V 0
00
SA
V X
YZ
Digital Active Line
EA
V 3
FF
EA
V 0
00
EA
V 0
00
LN
1
CR
C0
CR
C1
EA
V X
YZ
Blanking Code Words or Optional Ancillary
Data
SA
V 3
FF
SA
V 0
00
SA
V 0
00
SA
V X
YZ
Digital Active Line
EA
V 3
FF
EA
V 0
00
EA
V 0
00
LN
1
CR
C0
CR
C1
EA
V X
YZ
Blanking Code Words or Optional Ancillary
Data
SA
V 3
FF
SA
V 0
00
SA
V 0
00
SA
V X
YZ
Digital Active Line
Data Stream five
Data Stream six
Data Stream seven
Data Stream eight
EA
V 3
FF
EA
V 0
00
EA
V 0
00
LN
1
CR
C0
CR
C1
EA
V X
YZ
Blanking Code Words or Optional Ancillary
Data
SA
V 3
FF
SA
V 0
00
SA
V 0
00
SA
V X
YZ
Digital Active Line
EA
V 3
FF
EA
V 0
00
EA
V 0
00
LN
1
CR
C0
CR
C1
EA
V X
YZ
Blanking Code Words or Optional Ancillary
Data
SA
V 3
FF
SA
V 0
00
SA
V 0
00
SA
V X
YZ
Digital Active Line
EA
V 3
FF
EA
V 0
00
EA
V 0
00
LN
1
CR
C0
CR
C1
EA
V X
YZ
Blanking Code Words or Optional Ancillary
Data
SA
V 3
FF
SA
V 0
00
SA
V 0
00
SA
V X
YZ
Digital Active Line
EA
V 3
FF
EA
V 0
00
EA
V 0
00
LN
1
CR
C0
CR
C1
EA
V X
YZ
Blanking Code Words or Optional Ancillary
Data
SA
V 3
FF
SA
V 0
00
SA
V 0
00
SA
V X
YZ
Digital Active Line
Data Stream eight
Data Stream six
Data Stream seven
Data Stream five
LN
0L
N0
LN
0L
N0
LN
0L
N0
LN
0L
N0
LN
0
LN
0
LN
0
LN
0
LN
1
LN
1
LN
1
LN
1
LN
0
LN
0
LN
0
LN
0
EA
V X
YZ
EA
V X
YZ
EA
V X
YZ
EA
V X
YZ
EA
V 0
00
EA
V 0
00
EA
V 0
00
EA
V 0
00
EA
V 0
00
EA
V 0
00
EA
V 0
00
EA
V 0
00
EA
V 3
FF
EA
V 3
FF
EA
V 3
FF
EA
V 3
FF

Rec. ITU-R BT.2077-0 139
FIGURE 3-14
12G-SDI 10-bit Multiplex – Type 2
12G-SDI 10-bit multiplex
Data Stream one
Data Stream two
Data Stream three
Data Stream four
80-bit Virtual Interface
EA
V 3
FF
EA
V 3
FF
EA
V 3
FF
EA
V 3
FF
EA
V 0
00
EA
V 0
00
EA
V 0
00
EA
V 0
00
EA
V 0
00
EA
V 0
00
EA
V 0
00
EA
V 0
00
EA
V X
YZ
EA
V X
YZ
EA
V X
YZ
Data Stream four
Data Stream two
Data Stream three
Data Stream one
Data Stream five
Data Stream six
Data Stream seven
Data Stream eight
Data Stream eight
Data Stream six
Data Stream seven
Data Stream five
EA
V 0
00
EA
V 0
00
EA
V 0
00
EA
V 0
00
EA
V 0
00
EA
V 0
00
EA
V 0
00
EA
V 0
00
EA
V 3
FF
EA
V 3
FF
EA
V 3
FF
EA
V 3
FF
LN
1
CR
C0
CR
C1
Blanking Code Words or Optional
Ancillary Data
SA
V 3
FF
SA
V 0
00
SA
V 0
00
SA
V X
YZ
Digital Active Line
LN
1
CR
C0
CR
C1
Blanking Code Words or Optional
Ancillary Data
SA
V 3
FF
SA
V 0
00
SA
V 0
00
SA
V X
YZ
Digital Active Line
LN
1
CR
C0
CR
C1
Blanking Code Words or Optional
Ancillary Data
SA
V 3
FF
SA
V 0
00
SA
V 0
00
SA
V X
YZ
Digital Active Line
LN
1
CR
C0
CR
C1
Blanking Code Words or Optional
Ancillary Data
SA
V 3
FF
SA
V 0
00
SA
V 0
00
SA
V X
YZ
Digital Active Line
LN
0L
N0
LN
0L
N0
EA
V 3
FF
EA
V 0
00
EA
V 0
00
EA
V X
YZ
EA
V 3
FF
EA
V 0
00
EA
V 0
00
EA
V X
YZ
EA
V 3
FF
EA
V 0
00
EA
V 0
00
EA
V X
YZ
EA
V 3
FF
EA
V 0
00
EA
V 0
00
EA
V X
YZ
LN
0L
N0
LN
0L
N0
CR
C1
CR
C1
CR
C1
CR
C1
CR
C0
CR
C0
CR
C0
CR
C0
LN
1L
N1
LN
1L
N1
EA
V X
YZ
EA
V X
YZ
EA
V X
YZ
EA
V X
YZ
EA
V 0
00
EA
V 0
00
EA
V 0
00
EA
V 0
00
EA
V 0
00
EA
V 0
00
EA
V 0
00
EA
V 0
00
EA
V 3
FF
EA
V 3
FF
EA
V 3
FF
EA
V 3
FF
SA
V X
YZ
SA
V X
YZ
SA
V X
YZ
SA
V X
YZ
SA
V 0
00
SA
V 0
00
SA
V 0
00
SA
V 0
00
SA
V 0
00
SA
V 0
00
SA
V 0
00
SA
V 0
00
SA
V 3
FF
SA
V 3
FF
SA
V 3
FF
SA
V 3
FF
LN
1
CR
C0
CR
C1
Blanking Code Words or Optional
Ancillary Data
SA
V 3
FF
SA
V 0
00
SA
V 0
00
SA
V X
YZ
Digital Active Line
LN
1
CR
C0
CR
C1
Blanking Code Words or Optional
Ancillary Data
SA
V 3
FF
SA
V 0
00
SA
V 0
00
SA
V X
YZ
Digital Active Line
LN
1
CR
C0
CR
C1
Blanking Code Words or Optional
Ancillary DataS
AV
3F
F
SA
V 0
00
SA
V 0
00
SA
V X
YZ
Digital Active Line
LN
1
CR
C0
CR
C1
Blanking Code Words or Optional
Ancillary Data
SA
V 3
FF
SA
V 0
00
SA
V 0
00
SA
V X
YZ
Digital Active Line
LN
0L
N0
LN
0L
N0
EA
V 3
FF
EA
V 0
00
EA
V 0
00
EA
V X
YZ
EA
V 3
FF
EA
V 0
00
EA
V 0
00
EA
V X
YZ
EA
V 3
FF
EA
V 0
00
EA
V 0
00
EA
V X
YZ
EA
V 3
FF
EA
V 0
00
EA
V 0
00
EA
V X
YZ
LN
0L
N0
LN
0L
N0
CR
C1
CR
C1
CR
C1
CR
C1
CR
C0
CR
C0
CR
C0
CR
C0
LN
1L
N1
LN
1L
N1
EA
V X
YZ
EA
V X
YZ
EA
V X
YZ
EA
V X
YZ
EA
V 0
00
EA
V 0
00
EA
V 0
00
EA
V 0
00
EA
V 0
00
EA
V 0
00
EA
V 0
00
EA
V 0
00
EA
V 3
FF
EA
V 3
FF
EA
V 3
FF
EA
V 3
FF
SA
V X
YZ
SA
V X
YZ
SA
V X
YZ
SA
V X
YZ
SA
V 0
00
SA
V 0
00
SA
V 0
00
SA
V 0
00
SA
V 0
00
SA
V 0
00
SA
V 0
00
SA
V 0
00
SA
V 3
FF
SA
V 3
FF
SA
V 3
FF
SA
V 3
FF
EA
V 3
FF
EA
V 3
FF
EA
V 3
FF
EA
V 3
FF
EA
V 3
FF
EA
V 3
FF
EA
V 3
FF
EA
V 3
FF
EA
V 0
00
EA
V 0
00
EA
V 0
00
EA
V 0
00
EA
V 0
00
EA
V 0
00
EA
V 0
00
EA
V 0
00
EA
V 0
00
EA
V 0
00
EA
V 0
00
EA
V 0
00
EA
V 0
00
EA
V 0
00
EA
V 0
00
EA
V 0
00
Each 12G-SDI 10-bit multiplexed interface should then be serialized to create a 12G-SDI serial
interface.
The 12G-SDI 10-bit multiplexed interface made up of data streams one through eight should be
serialized as 12G-SDI serial Link 1.
The 12G-SDI 10-bit multiplexed interface made up of data streams nine through sixteen should be
serialized as 12G-SDI serial Link 2.
The 12G-SDI 10-bit multiplexed interface made up of data streams seventeen through twenty four
should be serialized as 12G-SDI serial Link 3.
The 12G-SDI 10-bit multiplexed interface made up of data streams twenty five through thirty two
should be serialized as 12G-SDI serial Link 4.
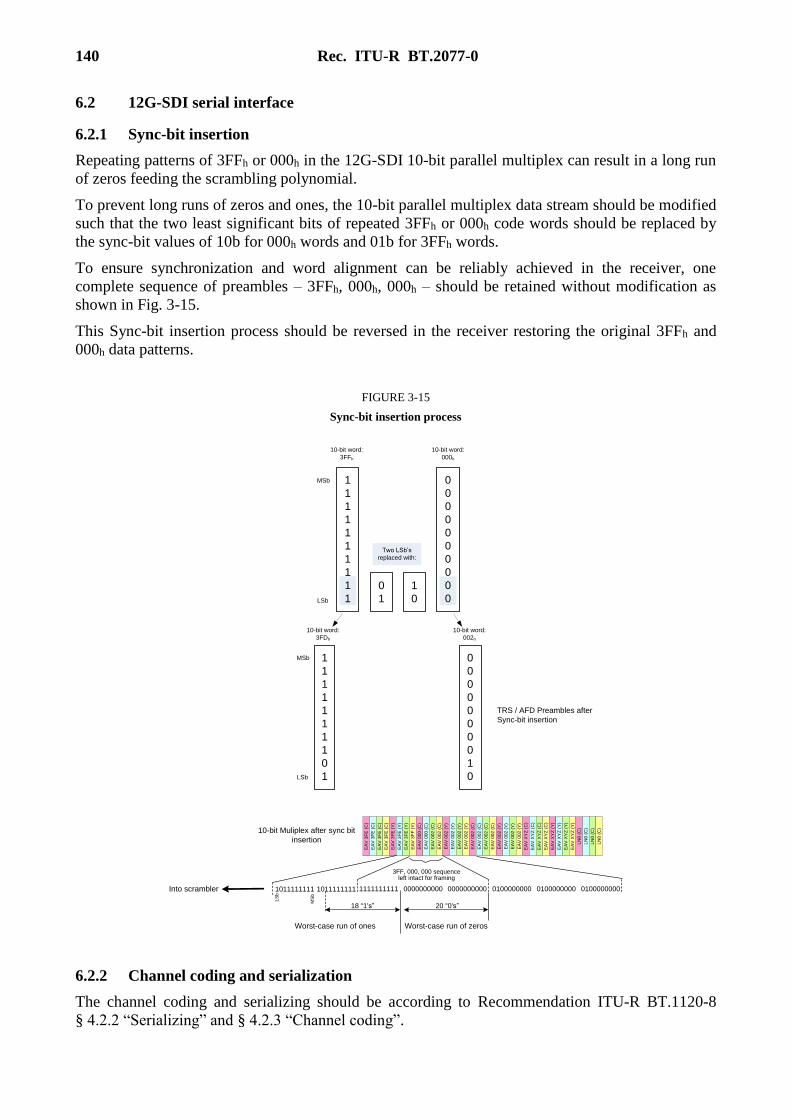
140 Rec. ITU-R BT.2077-0
6.2 12G-SDI serial interface
6.2.1 Sync-bit insertion
Repeating patterns of 3FFh or 000h in the 12G-SDI 10-bit parallel multiplex can result in a long run
of zeros feeding the scrambling polynomial.
To prevent long runs of zeros and ones, the 10-bit parallel multiplex data stream should be modified
such that the two least significant bits of repeated 3FFh or 000h code words should be replaced by
the sync-bit values of 10b for 000h words and 01b for 3FFh words.
To ensure synchronization and word alignment can be reliably achieved in the receiver, one
complete sequence of preambles – 3FFh, 000h, 000h – should be retained without modification as
shown in Fig. 3-15.
This Sync-bit insertion process should be reversed in the receiver restoring the original 3FFh and
000h data patterns.
FIGURE 3-15
Sync-bit insertion process
EA
V 3
FE
(C
)
EA
V 3
FE
(C
)
EA
V 3
FE
(C
)
EA
V 3
FE
(C
)
EA
V 3
FE
(Y
)
EA
V 3
FE
(Y
)
EA
V 3
FE
(Y
)
EA
V 3
FF
(Y
)
EA
V 0
00
(C
)
EA
V 0
00
(C
)
EA
V 0
02
(C
)
EA
V 0
02
(C
)
EA
V 0
02
(Y
)
EA
V 0
02
(Y
)
EA
V 0
02
(Y
)
EA
V 0
02
(Y
)
EA
V 0
02
(C
)
EA
V 0
02
(C
)
EA
V 0
02
(C
)
EA
V 0
02
(C
)
EA
V 0
02
(Y
)
EA
V 0
02
(Y
)
EA
V 0
02
(Y
)
EA
V 0
02
(Y
)
EA
V X
YZ
(C
)
EA
V X
YZ
(C
)
EA
V X
YZ
(C
)
EA
V X
YZ
(C
)
EA
V X
YZ
(Y
)
EA
V X
YZ
(Y
)
EA
V X
YZ
(Y
)
EA
V X
YZ
(Y
)
LN
0 (
C)
LN
0 (
C)
LN
0 (
C)
LN
0 (
C)
0000000000 0000000000
20 “0's”
Worst-case run of zeros
Into scrambler
LS
b
MS
b
01000000000100000000 01000000001111111111
3FF, 000, 000 sequence left intact for framing
10-bit Muliplex after sync bit
insertion
10111111111011111111
Worst-case run of ones
18 “1's”
10-bit word:
3FDh
1
1
1
1
1
1
1
1
0
1
0
0
0
0
0
0
0
0
1
0
10-bit word:
002h
MSb
LSb
0
0
0
0
0
0
0
0
0
0
10-bit word:
000h
0
1
1
0
Two LSb’s
replaced with:
1
1
1
1
1
1
1
1
1
1
10-bit word:
3FFh
MSb
LSb
TRS / AFD Preambles after
Sync-bit insertion
6.2.2 Channel coding and serialization
The channel coding and serializing should be according to Recommendation ITU-R BT.1120-8
§ 4.2.2 “Serializing” and § 4.2.3 “Channel coding”.

Rec. ITU-R BT.2077-0 141
6.2.3 Serial clock
The serial clock frequency should be ten times the 10-bit parallel interface frequency.
I.e. 11.88 GHz or 11.88/1.001 GHz.
6.2.4 Inter link delay
In the cases where an image is transported over multiple 12G links, the timing difference between
the EAV / SAV of any 12G link to any other 12G link should not exceed 250 ns at the source.
7 Generation of 24G link signals
7.1 24G-SDI 10-bit Multiplex
See Tables 3-1 and 3-2 for data stream requirements for each source image format.
Prior to serialization:
For signals where the virtual interface requires sixteen or more data streams:
Data streams one through sixteen should be multiplexed word-by-word into a 24G-SDI
10-bit interface.
The 10-bit interface should consist of a word multiplex of data streams one through sixteen,
in the order data stream sixteen, data stream eight, data stream twelve, data stream four,
data stream fourteen, data stream six, data stream ten, data stream two, data stream fifteen,
data stream seven, data stream eleven, data stream three, data stream thirteen, data stream
five, data stream nine, data stream one … etc.
For signals where the virtual interface requires thirty two or more data streams:
Data streams seventeen through thirty two should be multiplexed word-by-word into a
24G-SDI 10-bit interface.
The 10-bit interface should consist of a word multiplex of data streams seventeen through
thirty two, in the order data stream thirty two, data stream twenty four, data stream twenty
eight, data stream twenty, data stream thirty, data stream twenty two, data stream twenty
six, data stream eighteen, data stream thirty one, data stream twenty three, data stream
twenty seven, data stream nineteen, data stream twenty nine, data stream twenty one, data
stream twenty five, data stream seventeen … etc.
For signals where the virtual interface requires forty eight or more data streams:
Data streams thirty three through forty eight should be multiplexed word-by-word into
a 24G-SDI 10-bit interface.
The 10-bit interface should consist of a word multiplex of data streams thirty three through
forty eight, in the order data stream forty eight, data stream forty, data stream forty two,
data stream thirty six, data stream forty six, data stream thirty eight, data stream forty two,
data stream thirty four, data stream forty nine, data stream thirty nine, data stream forty
three, data stream thirty five, data stream forty five, data stream thirty seven, data stream
forty one, data stream thirty three … etc.
For signals where the virtual interface requires sixty four or more data streams:
Data streams forty nine through sixty four should be multiplexed word-by-word into a
24G-SDI 10-bit interface.
The 10-bit interface should consist of a word multiplex of data streams forty nine through
sixty four, in the order data stream sixty four, data stream fifty six, data stream sixty, data
stream fifty two, data stream sixty two, data stream fifty four, data stream fifty eight, data

142 Rec. ITU-R BT.2077-0
stream fifty, data stream sixty three, data stream fifty five, data stream fifty nine, data
stream fifty one, data stream sixty one, data stream fifty three, data stream fifty seven, data
stream forty nine … etc.
The 10-bit parallel interfaces so produced should have an interface frequency of 2376 MHz
or 2376/1.001 MHz.
7.1.1 Type 1 and Type 2 10-bit parallel interfaces
As shown in Table 3-4 and Fig. 3-8, data streams for 30 Hz, 30/1.001 Hz, 25 Hz, 24 Hz and
24/1.001 Hz frame frequencies images with Image Structure 1 (4:2:2 or 4:2:0 10-bit) have a line
structure with double length EAV, SAV, LN and CRC data components. These data streams, when
multiplexed, result in a Type 2 10-bit parallel interface. Figure 3-17 shows the Type 2 10-bit
parallel interface.
All other images use a Type 1 10-bit parallel interface. Figure 3-16 shows the Type 1 10-bit parallel
interface.

Rec. ITU-R BT.2077-0 143
FIGURE 3-16
24G-SDI 10-bit Multiplex – Type 1
Data Stream one
Data Stream two
Data Stream three
Data Stream four
160-bit Virtual Interface
EA
V 3
FF
EA
V 0
00
EA
V 0
00
LN
1
CR
C0
CR
C1
EA
V X
YZ
Blanking Code Words or Optional Ancillary
Data
SA
V 3
FF
SA
V 0
00
SA
V 0
00
SA
V X
YZ
Digital Active Line
EA
V 3
FF
EA
V 0
00
EA
V 0
00
LN
1
CR
C0
CR
C1
EA
V X
YZ
Blanking Code Words or Optional Ancillary
Data
SA
V 3
FF
SA
V 0
00
SA
V 0
00
SA
V X
YZ
Digital Active Line
EA
V 3
FF
EA
V 0
00
EA
V 0
00
LN
1
CR
C0
CR
C1
EA
V X
YZ
Blanking Code Words or Optional Ancillary
Data
SA
V 3
FF
SA
V 0
00
SA
V 0
00
SA
V X
YZ
Digital Active Line
EA
V 3
FF
EA
V 0
00
EA
V 0
00
LN
1
CR
C0
CR
C1
EA
V X
YZ
Blanking Code Words or Optional Ancillary
Data
SA
V 3
FF
SA
V 0
00
SA
V 0
00
SA
V X
YZ
Digital Active Line
Data Stream
thirteen
Data Stream fourteen
Data Stream fifteen
Data Stream sixteen
EA
V 3
FF
EA
V 0
00
EA
V 0
00
LN
1
CR
C0
CR
C1
EA
V X
YZ
Blanking Code Words or Optional Ancillary
Data
SA
V 3
FF
SA
V 0
00
SA
V 0
00
SA
V X
YZ
Digital Active Line
EA
V 3
FF
EA
V 0
00
EA
V 0
00
LN
1
CR
C0
CR
C1
EA
V X
YZ
Blanking Code Words or Optional Ancillary
Data
SA
V 3
FF
SA
V 0
00
SA
V 0
00
SA
V X
YZ
Digital Active Line
EA
V 3
FF
EA
V 0
00
EA
V 0
00
LN
1
CR
C0
CR
C1
EA
V X
YZ
Blanking Code Words or Optional Ancillary
Data
SA
V 3
FF
SA
V 0
00
SA
V 0
00
SA
V X
YZ
Digital Active Line
EA
V 3
FF
EA
V 0
00
EA
V 0
00
LN
1
CR
C0
CR
C1
EA
V X
YZ
Blanking Code Words or Optional Ancillary
Data
SA
V 3
FF
SA
V 0
00
SA
V 0
00
SA
V X
YZ
Digital Active Line
LN
0L
N0
LN
0L
N0
LN
0L
N0
LN
0L
N0
24G UHD-SDI 10-bit multiplex
Data Stream two
EA
V 3
FF
EA
V 3
FF
EA
V 3
FF
EA
V 3
FF
EA
V 0
00
EA
V 0
00
EA
V 0
00
EA
V 0
00
EA
V 0
00
EA
V 0
00
EA
V 0
00
EA
V 0
00
EA
V X
YZ
EA
V X
YZ
EA
V X
YZ
EA
V X
YZ
LN
0
EA
V X
YZ
EA
V X
YZ
EA
V X
YZ
EA
V X
YZ
EA
V 0
00
EA
V 0
00
EA
V 0
00
EA
V 0
00
EA
V 0
00
EA
V 0
00
EA
V 0
00
EA
V 0
00
EA
V 3
FF
EA
V 3
FF
EA
V 3
FF
EA
V 3
FF
Data Stream ten
Data Stream six
Data Stream fourteen
Data Stream four
Data Stream twelve
Data Stream eight
Data Stream sixteen
Data Stream one
Data Stream nine
Data Stream five
Data Stream thirteen
Data Stream three
Data Stream eleven
Data Stream fifteen
Data Stream seven
EA
V 3
FF
EA
V 3
FF
EA
V 3
FF
EA
V 3
FF
EA
V 3
FF
EA
V 3
FF
EA
V 3
FF
EA
V 3
FF
EA
V 0
00
EA
V 0
00
EA
V 0
00
EA
V 0
00
EA
V 0
00
EA
V 0
00
EA
V 0
00
EA
V 0
00
EA
V 0
00
EA
V 0
00
EA
V 0
00
EA
V 0
00
EA
V 0
00
EA
V 0
00
EA
V 0
00
EA
V 0
00
EA
V X
YZ
EA
V X
YZ
EA
V X
YZ
EA
V X
YZ
EA
V X
YZ
EA
V X
YZ
EA
V X
YZ
EA
V X
YZ
LN
0
LN
0
LN
0
LN
0
LN
0
LN
0
LN
0

144 Rec. ITU-R BT.2077-0
FIGURE 3-17
24G-SDI 10-bit Multiplex – Type 2
Data Stream one
Data Stream two
Data Stream three
Data Stream four
160-bit Virtual Interface
EA
V 3
FF
EA
V 0
00
EA
V 0
00
LN
1
CR
C0
CR
C1
EA
V X
YZ
Blanking Code Words or
Optional Ancillary Data
SA
V 3
FF
SA
V 0
00
SA
V 0
00
SA
V X
YZ
Digital Active LineE
AV
3F
F
EA
V 0
00
EA
V 0
00
LN
1
CR
C0
CR
C1
EA
V X
YZ
Blanking Code Words or
Optional Ancillary Data
SA
V 3
FF
SA
V 0
00
SA
V 0
00
SA
V X
YZ
Digital Active Line
EA
V 3
FF
EA
V 0
00
EA
V 0
00
LN
1
CR
C0
CR
C1
EA
V X
YZ
Blanking Code Words or
Optional Ancillary Data
SA
V 3
FF
SA
V 0
00
SA
V 0
00
SA
V X
YZ
Digital Active Line
EA
V 3
FF
EA
V 0
00
EA
V 0
00
LN
1
CR
C0
CR
C1
EA
V X
YZ
Blanking Code Words or
Optional Ancillary Data
SA
V 3
FF
SA
V 0
00
SA
V 0
00
SA
V X
YZ
Digital Active Line
Data Stream thirteen
Data Stream fourteen
Data Stream fifteen
Data Stream sixteen
LN
0
LN
0L
N0
LN
0
24G UHD-SDI 10-bit multiplex
Data Stream two
EA
V 3
FF
EA
V 3
FF
EA
V 3
FF
EA
V 3
FF
EA
V 0
00
EA
V 0
00
EA
V 0
00
EA
V 0
00
EA
V 0
00
EA
V 0
00
EA
V 0
00
EA
V 0
00
EA
V 0
00
EA
V 0
00
EA
V 0
00
EA
V 0
00
EA
V 0
00
EA
V 0
00
EA
V 0
00
EA
V 0
00
EA
V 3
FF
EA
V 3
FF
EA
V 3
FF
EA
V 3
FF
Data Stream ten
Data Stream six
Data Stream fourteen
Data Stream four
Data Stream twelve
Data Stream eight
Data Stream sixteen
Data Stream one
Data Stream nine
Data Stream five
Data Stream thirteen
Data Stream three
Data Stream eleven
Data Stream fifteen
Data Stream seven
EA
V 3
FF
EA
V 3
FF
EA
V 3
FF
EA
V 3
FF
EA
V 3
FF
EA
V 3
FF
EA
V 3
FF
EA
V 3
FF
EA
V 0
00
EA
V 0
00
EA
V 0
00
EA
V 0
00
EA
V 0
00
EA
V 0
00
EA
V 0
00
EA
V 0
00
EA
V 0
00
EA
V 0
00
EA
V 0
00
EA
V 0
00
EA
V 0
00
EA
V 0
00
EA
V 0
00
EA
V 0
00
EA
V 3
FF
EA
V 0
00
EA
V 0
00
EA
V X
YZ
LN
0
CR
C1
CR
C0
LN
1
CR
C1
CR
C0
LN
1
EA
V 3
FF
EA
V 0
00
EA
V 0
00
EA
V X
YZ
LN
0
SA
V X
YZ
SA
V 0
00
SA
V 0
00
SA
V 3
FF
SA
V X
YZ
SA
V 0
00
SA
V 0
00
SA
V 3
FF
EA
V 3
FF
EA
V 0
00
EA
V 0
00
EA
V X
YZ
LN
0
CR
C1
CR
C0
LN
1
EA
V 3
FF
EA
V 0
00
EA
V 0
00
EA
V X
YZ
LN
0
CR
C1
CR
C0
LN
1
SA
V X
YZ
SA
V 0
00
SA
V 0
00
SA
V 3
FF
SA
V X
YZ
SA
V 0
00
SA
V 0
00
SA
V 3
FF
EA
V 3
FF
EA
V 0
00
EA
V 0
00
LN
1
CR
C0
CR
C1
EA
V X
YZ
Blanking Code Words or
Optional Ancillary Data
SA
V 3
FF
SA
V 0
00
SA
V 0
00
SA
V X
YZ
Digital Active Line
EA
V 3
FF
EA
V 0
00
EA
V 0
00
LN
1
CR
C0
CR
C1
EA
V X
YZ
Blanking Code Words or
Optional Ancillary Data
SA
V 3
FF
SA
V 0
00
SA
V 0
00
SA
V X
YZ
Digital Active Line
EA
V 3
FF
EA
V 0
00
EA
V 0
00
LN
1
CR
C0
CR
C1
EA
V X
YZ
Blanking Code Words or
Optional Ancillary Data
SA
V 3
FF
SA
V 0
00
SA
V 0
00
SA
V X
YZ
Digital Active Line
EA
V 3
FF
EA
V 0
00
EA
V 0
00
LN
1
CR
C0
CR
C1
EA
V X
YZ
Blanking Code Words or
Optional Ancillary Data
SA
V 3
FF
SA
V 0
00
SA
V 0
00
SA
V X
YZ
Digital Active Line
LN
0
LN
0L
N0
LN
0
EA
V 3
FF
EA
V 0
00
EA
V 0
00
EA
V X
YZ
LN
0
CR
C1
CR
C0
LN
1
CR
C1
CR
C0
LN
1
EA
V 3
FF
EA
V 0
00
EA
V 0
00
EA
V X
YZ
LN
0
SA
V X
YZ
SA
V 0
00
SA
V 0
00
SA
V 3
FF
SA
V X
YZ
SA
V 0
00
SA
V 0
00
SA
V 3
FF
EA
V 3
FF
EA
V 0
00
EA
V 0
00
EA
V X
YZ
LN
0
CR
C1
CR
C0
LN
1
EA
V 3
FF
EA
V 0
00
EA
V 0
00
EA
V X
YZ
LN
0
CR
C1
CR
C0
LN
1
SA
V X
YZ
SA
V 0
00
SA
V 0
00
SA
V 3
FF
SA
V X
YZ
SA
V 0
00
SA
V 0
00
SA
V 3
FF
EA
V 3
FF
EA
V 3
FF
EA
V 3
FF
EA
V 3
FF
EA
V 3
FF
EA
V 3
FF
EA
V 3
FF
EA
V 3
FF
EA
V 3
FF
EA
V 3
FF
EA
V 3
FF
EA
V 3
FF
EA
V 3
FF
EA
V 3
FF
EA
V 3
FF
EA
V 3
FF
EA
V 0
00
EA
V 0
00
EA
V 0
00
EA
V 0
00
EA
V 0
00
EA
V 0
00
EA
V 0
00
EA
V 0
00
Each 24G-SDI 10-bit multiplexed interface should then be serialized to create a 24G-SDI serial
interface.
The 24G-SDI 10-bit multiplexed interface made up of data streams one through sixteen should be
serialized as 24G-SDI serial Link 1.
The 24G-SDI 10-bit multiplexed interface made up of data streams seventeen through thirty two
should be serialized as 24G-SDI serial Link 2.
The 24G-SDI 10-bit multiplexed interface made up of data streams thirty three through forty eight
should be serialized as 24G-SDI serial Link 3.

Rec. ITU-R BT.2077-0 145
The 24G-SDI 10-bit multiplexed interface made up of data streams forty nine through sixty four
should be serialized as 24G-SDI serial Link 4.
7.2 24G-SDI serial interface
7.2.1 Sync-bit insertion
Repeating patterns of 3FFh or 000h in the 24G-SDI 10-bit parallel multiplex can result in a long run
of zeros feeding the scrambling polynomial.
To prevent long runs of zeros and ones, the 10-bit parallel multiplex data stream should be modified
such that the two least significant bits of repeated 3FFh or 000h code words should be replaced by
the sync-bit values of 10b for 000h words and 01b for 3FFh words.
To ensure synchronization and word alignment can be reliably achieved in the receiver, one
complete sequence of preambles – 3FFh, 000h, 000h – should be retained without modification as
shown in Fig. 3-15.
This Sync-bit insertion process should be reversed in the receiver restoring the original 3FFh and
000h data patterns.
FIGURE 3-18
Sync-bit insertion process
EA
V 3
FE
(C
)
EA
V 3
FE
(C
)
EA
V 3
FE
(C
)
EA
V 3
FE
(C
)
EA
V 3
FE
(Y
)
EA
V 3
FE
(Y
)
EA
V 3
FE
(Y
)
EA
V 3
FF
(Y
)
EA
V 0
00
(C
)
EA
V 0
00
(C
)
EA
V 0
02
(C
)
EA
V 0
02
(C
)
EA
V 0
02
(Y
)
EA
V 0
02
(Y
)
EA
V 0
02
(Y
)
EA
V 0
02
(Y
)
EA
V 0
02
(C
)
EA
V 0
02
(C
)
EA
V 0
02
(C
)
EA
V 0
02
(C
)
EA
V 0
02
(Y
)
EA
V 0
02
(Y
)
EA
V 0
02
(Y
)
EA
V 0
02
(Y
)
EA
V X
YZ
(C
)
EA
V X
YZ
(C
)
EA
V X
YZ
(C
)
EA
V X
YZ
(C
)
EA
V X
YZ
(Y
)
EA
V X
YZ
(Y
)
EA
V X
YZ
(Y
)
EA
V X
YZ
(Y
)
LN
0 (
C)
LN
0 (
C)
LN
0 (
C)
LN
0 (
C)
0000000000 0000000000
20 “0's”
Worst-case run of zeros
Into scrambler
LS
b
MS
b
01000000000100000000 01000000001111111111
3FF, 000, 000 sequence left intact for framing
10-bit Muliplex after sync bit
insertion
10111111111011111111
Worst-case run of ones
18 “1's”
10-bit word:
3FDh
1
1
1
1
1
1
1
1
0
1
0
0
0
0
0
0
0
0
1
0
10-bit word:
002h
MSb
LSb
0
0
0
0
0
0
0
0
0
0
10-bit word:
000h
0
1
1
0
Two LSb’s
replaced with:
1
1
1
1
1
1
1
1
1
1
10-bit word:
3FFh
MSb
LSb
TRS / AFD Preambles after
Sync-bit insertion

146 Rec. ITU-R BT.2077-0
7.2.2 Channel coding and serialization
The channel coding and serializing should be according to Recommendation ITU-R BT.1120-8
§ 4.2.2 “Serializing” and § 4.2.3 “Channel coding”.
7.2.3 Serial clock
The serial clock frequency should be ten times the 10-bit parallel interface frequency.
I.e. 23.76 GHz or 23.76/1.001 GHz.
7.2.4 Inter link delay
In the cases where an image is transported over multiple 24G links, the timing difference between
the EAV / SAV of any 24G link to any other 24G link should not exceed 250 ns at the source.
8 Coaxial cable interface
8.1 Generator signal levels and specifications
These specifications are defined for measurement of the serial output of a source derived from a
parallel domain signal.
The output of the generator should be measured across a 75-ohm resistive load connected through
one meter coaxial cable and 75 ohm BNC connectors8 meeting the requirements defined in § 8.2.
Figure 3-19 depicts the measurement dimensions for amplitude, rise-time and overshoot.
The generator should have an unbalanced output circuit with a source impedance of 75 ohms and
should meet the return loss requirements defined in Table 3-12.
FIGURE 3-19
Waveform measurement Dimensions
The peak-to-peak signal amplitude should be 800 mV ± 10%.
The dc offset, as defined by the mid-amplitude point of the signal, should be nominally
0.0 V ± 0.5 V.
For a 6G interface the rise and fall times, determined between the 20% and 80% amplitude points
should be no greater than 80 ps and should not differ by more than 30 ps.
8 BNC connector refers to a connector which meets the mechanical specifications of IEC 61196-8 Annex A
and the electrical specifications reflected in Part 3 of this Recommendation.

Rec. ITU-R BT.2077-0 147
For a 12G interface the rise and fall times, determined between the 20% and 80% amplitude points
should be no greater than 45 ps and should not differ by more than 18 ps.
For a 24G interface the rise and fall times, determined between the 20% and 80% amplitude points
should be no greater than 28 ps and should not differ by more than 8 ps.
Overshoot of the rising and falling edges of the waveform should not exceed 10% of the amplitude.
Output amplitude excursions due to signals with a significant dc component occurring for a
horizontal line (pathological stress signal) should not exceed 50 mV above or below the average
peak-to-peak signal envelope.
The jitter in the timing of the transitions of the data signal should have the values shown in
Table 3-11 for compliance with Part 3 of this Recommendation.
1 UI corresponds to 1/fc. Specification of jitter and jitter measurements methods should comply
with Recommendation ITU-R BT.1363 – Jitter specifications and methods for jitter measurement
of bit-serial signals conforming to Recommendations ITU-R BT.656, ITU-R BT.799 and
ITU-R BT.1120.
TABLE 3-11
Jitter specifications
Parameter Value Description
6G 12G 24G
F1 10 Hz 10 Hz 10 Hz Timing jitter lower band edge
(low frequency specification limit)
F3 100 KHz 100 KHz 100 KHz Alignment Jitter lower band edge
F4 > 1/10th
the clock
rate (>594
MHz)
> 1/10th
the clock rate
(>1188 MHz)
> 1/10th
the clock rate
(>2356 MHz)
Upper band edge
A1 4 UI
(673 psec)
8 UI
(673 psec)
16 UI
(673 psec)
Timing jitter expressed in unit interval
A2 0.3 UI
(56 psec)
0.3 UI
(28 psec)
0.3 UI
(14 psec)
Alignment jitter
Test Signal Colour bar
test signal
Colour bar
test signal
Colour bar
test signal
Colour bar is chosen as a non-stressing test
signal for jitter measurements.
8.2 Receiver signal levels and specifications
The receiver of the serial interface signal should present an impedance of 75 ohms and should meet
the return loss requirements defined in § 8.2.1.
Receivers operating with input cable losses in the range of up to 40 dB at one-half the clock
frequency are typical; however, receivers designed to work with greater or lesser signal attenuation
are acceptable.
8.2.1 Return loss 6G interface
The generator and receiver unbalanced circuit should have a return loss that complies with the
diagram of Fig. 3-20 in accordance with the parameters enumerated in Table 3-12.

148 Rec. ITU-R BT.2077-0
FIGURE 3-20
Return loss 6G
Frequency
F2F1
B0
F0
Re
turn
Lo
ss
B1
F3
B2
TABLE 3-12
Return loss parameters 6G
Parameter Value Description
F0 5 MHz Return loss lower band edge
F1 1.485 GHz Return loss transition lower band edge
F2 3 GHz Return loss transition upper band edge
F3 6G Hz Return loss upper band edge
B0 −15 dB Return loss f0 to f1
B1 −10 dB Return loss f1 to f2
B2 −7 dB Return loss f2 to f3
8.2.2 Return loss 12G interface
The generator and receiver unbalanced circuit should have a return loss that complies with
the diagram of Fig. 3-21 in accordance with the parameters enumerated in Table 3-13.

Rec. ITU-R BT.2077-0 149
FIGURE 3-21
Return loss 12G
Frequency
F2F1
B0
F0
Re
turn
Lo
ss
B1
F3
B2
F4
B3
TABLE 3-13
Return loss parameters 12G
Parameter Value Description
F0 5 MHz Return loss lower band edge
F1 1.485 GHz Return loss transition lower band edge
F2 3 GHz Return loss mid band edge
F3 6 GHz Return loss mid band upper edge
F4 12 GHz Return loss upper band edge
B0 −15 dB Return loss f0 to f1
B1 −10 dB Return loss f1 to f2
B2 −7 dB Return loss f2 to f3
B3 −4 dB Return loss f3 to f4
8.2.3 Return loss 24G interface
The generator and receiver unbalanced circuit should have a return loss that complies with
the diagram of Fig. 3-22 in accordance with the parameters enumerated in Table 3-14.

150 Rec. ITU-R BT.2077-0
FIGURE 3-22
Return loss 24G
Frequency
F2F1
B0
F0
Re
turn
Lo
ss
B1
F3
B2
B3
F4 F5
B4
TABLE 3-14
Return loss parameters 24G
Parameter Value Description
F0 5 MHz Return loss lower band edge
F1 1.485 GHz Return loss transition lower band edge
F2 3 GHz Return loss mid band edge
F3 6 GHz Return loss mid band upper edge
F4 12 GHz Return loss upper mid band upper edge
F5 24 GHz Return loss upper band edge
B0 −15 dB Return loss f0 to f1
B1 −10 dB Return loss f1 to f2
B2 −7 dB Return loss f2 to f3
B3 −4 dB Return loss f3 to f4
B4 −2 dB Return loss f4 to f5
9 Optical interface
Recommendation ITU-R BT.1367 provides information relating to the use of single and multi-mode
fibre optical cable carrying the serial data defined in Recommendations ITU-R BT.656,
ITU-R BT.799 and ITU-R BT.1120 (270 Mbit/s through 2.97 Gbit/s).
This section expands Recommendation ITU-R BT. 1367 for carrying the 6G, 12G and 24G serial
data defined in the coaxial cable section above.
Physical packaging and connectors for transmitter and receiver units
The Optical interface should be compliant with the Tx and Rx unit optical domain connectors and
Polish requirements as defined in Recommendation ITU-R BT.1367.
Rec. ITU-R BT.2077-0 151
In accordance with Recommendation ITU-R BT.1367, the preferred Tx and Rx unit optical domain
connectors and their mating input and output cable sections should be LC/PC.
9.1 Transmitter unit
The transmitter unit should be compliant with the low-power (short-haul), medium-power (medium-
haul) and high-power (long-haul) link parameters defined in Recommendation ITU-R BT.1367 with
the following exceptions:
– Rise and fall times – measured following a fourth-order Bessel-Thompson filter with a 3 dB
point at 0.75 × data rate – should be as specified in the coaxial cable section above for the
electrical rise / fall time requirements.
– Maximum Intrinsic jitter (optical) should be as specified in the coaxial cable section above.
– Maximum spectral line width between half power points for single mode low power 6G and
12G links should be 4 nm.
– Maximum spectral line width between half power points for single mode 24G links at all
power levels should be 1 nm.
– Maximum optical power for medium power 6G and 12G links should be +0.5 dBm.
– Maximum optical power for medium power 24G links should be +3 dBm.
– Minimum optical power for medium power 24G links should be –1 dBm.
9.1.1 Transmitter unit labelling
The transmitter unit labelling should be compliant with the transmitter unit labelling requirements
as defined in Recommendation ITU-R BT.1367 with the following exceptions:
– The element <signal type> should support the following additional value:
“E” to indicate support for 6G signals
“F” to indicate support for 12G signals
“G” to indicate support for 24G signals
9.2 Receiver unit
The receiver unit should be compliant with the requirements as defined in Recommendation
ITU-R BT.1367 with the following exceptions:
– The receiver unit output electrical signal should be compliant with the coaxial cable section
above when receiving an optical signal in accordance with Recommendation
ITU-R BT.1367 Table 2 – Optical receiver input signal specifications.
– Maximum jitter should be as specified in the coaxial cable section above.
– The minimum input power as defined in Recommendation ITU-R BT.1367 Table 2 –
Optical receiver input signal specifications should be:
• −14 dBm for 6G
• −14 dBm for 12G
• −9 dBm for 24G
– The minimum input overload power as defined in Recommendation ITU-R BT.1367
Table 2 – Optical receiver input signal specifications should be +0.5 dBm for optical
receivers compliant with Part 3 of this Recommendation.

152 Rec. ITU-R BT.2077-0
9.2.2 Receiver unit labelling
The receiver unit labelling should be compliant with the receiver unit labelling requirements as
defined in Recommendation ITU-R BT.1367 with the following exceptions:
• The element <signal type> should support the following additional value:
“E” to indicate support for 6G signals
“F” to indicate support for 12G signals
“G” to indicate support for 24G signals
Optical fibre circuit and connector specifications
For compliance with Part 3 of this Recommendation, optical fibre circuits and connectors, deployed
in an optical SDI network, should be selected in accordance with the specifications (Fibre types and
connector return loss), defined in Recommendation ITU-R BT.1367.
9.2.3 Selection of wavelengths9
For single link or multi-link using multiple fibres with single wavelength per fibre:
– Nominal central wavelength for single mode fibre: 1311 nm
– Nominal central wavelength for multimode fibre: 850 nm.
For multi-link using CWDM:
TABLE 3-15
Recommended nominal central wavelengths
Number
of links
λ for
Link 1
λ for
Link 2
λ for
Link 3
λ for
Link 4
λ for
Link 5
λ for
Link 6
λ for
Link 7
λ for
Link 8
Dual 1 551 1 531 – – – – – –
Quad 1 551 1 531 1 571 1 511 – – – –
Octal 1 551 1 531 1 571 1 511 1 591 1 491 1 611 1 471
9 These links are generally used for point-to-point connections within a facility and users or manufacturers
may choose to use alternative wavelengths.
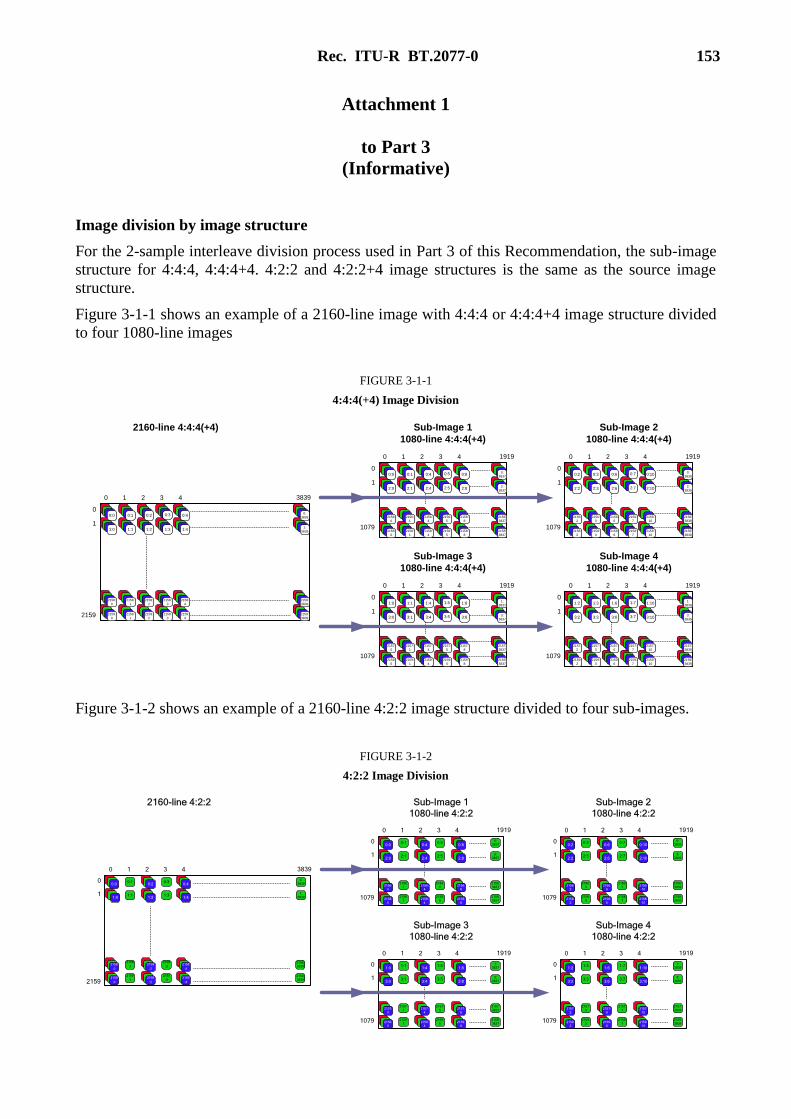
Rec. ITU-R BT.2077-0 153
Attachment 1
to Part 3
(Informative)
Image division by image structure
For the 2-sample interleave division process used in Part 3 of this Recommendation, the sub-image
structure for 4:4:4, 4:4:4+4. 4:2:2 and 4:2:2+4 image structures is the same as the source image
structure.
Figure 3-1-1 shows an example of a 2160-line image with 4:4:4 or 4:4:4+4 image structure divided
to four 1080-line images
FIGURE 3-1-1
4:4:4(+4) Image Division
Sub-Image 1
1080-line 4:4:4(+4)
2160-line 4:4:4(+4) Sub-Image 2
1080-line 4:4:4(+4)
1:0 1:1 1:2 1:3
0:0 0:1 0:2 0:30
3839
2159
0
1:4
0:4
0
19190
1079
1 2 3 4
1
1 2 3 4
1
2159:
0
2159:
1
2159:
2
2159:
3
2159:
4
2158:
0
2158:
1
2158:
2
2158:
3
2158:
4
0:0 0:1 0:4 0:5 0:8
2:0 2:1 2:4 2:5 2:8
2156:
0
2156:
1
2156:
4
2156:
5
2156:
8
2158:
0
2158:
1
2158:
4
2158:
5
2158:
8
Sub-Image 3
1080-line 4:4:4(+4)
Sub-Image 4
1080-line 4:4:4(+4)
0
19190
1079
1 2 3 4
1
0:2 0:3 0:6 0:7 0:10
2:2 2:3 2:6 2:7 2:10
2156:
2
2156:
3
2156:
6
2156:
7
2156:
10
2158:
2
2158:
3
2158:
6
2158:
7
2158:
10
0
19190
1079
1 2 3 4
1
0
19190
1079
1 2 3 4
1
1:0 1:1 1:4 1:5 1:8
3:0 3:1 3:4 3:5 3:8
2157:
0
2157:
1
2157:
4
2157:
5
2157:
8
2159:
0
2159:
1
2159:
4
2159:
5
2159:
8
2159:
3839
2158:
3839
1:
3839
0:
3839
0:
3837
2:
3837
2156:
3837
2158:
3837
1:
3837
3:
3837
2157:
3837
2159:
3837
0:
3839
2:
3839
2156:
3839
2158:
3839
1:2 1:3 1:6 1:7 1:10
3:2 3:3 3:6 3:7 3:10
2157:
2
2157:
3
2157:
6
2157:
7
2157:
10
2159:
2
2159:
3
2159:
6
2159:
7
2159:
10
1:
3839
3:
3839
2157:
3839
2159:
3839
Figure 3-1-2 shows an example of a 2160-line 4:2:2 image structure divided to four sub-images.
FIGURE 3-1-2
4:2:2 Image Division
Sub-Image 1
1080-line 4:2:2
2160-line 4:2:2 Sub-Image 2
1080-line 4:2:2
0:1 0:30:0 0:2
1:1 1:31:0 1:2
0
3839
2159
0
0:4
1:4
0:1 0:50
19190
1079
2158
:1
2158
:32158
:0
2158
:2
2159
:1
2159
:32159
:0
2159
:2
2158
:4
2159
:4
1 2 3 4
1
1 2 3 4
1
0:0 0:4 0:8
Sub-Image 3
1080-line 4:2:2
Sub-Image 4
1080-line 4:2:2
0
19190
1079
1 2 3 4
1
19190 1 2 3 4
0
19190
1079
1 2 3 4
1
0:
3839
1:
3839
2159:
3839
0:
3837
2:1 2:52:0 2:4 2:8
2:
3837
2156:
1
2156:
52156:
0
2156:
4
2156:
8
2156:
3837
2158:
1
2158:
52158:
0
2158:
4
2158:
8
2158:
3837
0:3 0:70:2 0:6 0:10
0:
3839
2:3 2:72:2 2:6 2:10
2:
3839
2156:
3
2156:
72156:
2
2156:
6
2156:
10
2156:
3839
2158:
3
2158:
72158:
2
2158:
6
2158:
10
2158:
3839
1:1 1:51:0 1:4 1:8
0
1079
1
1:
3837
3:1 3:53:0 3:4 3:8
3:
3837
2157:
1
2157:
52157:
0
2157:
4
2157:
8
2157:
3837
2159:
1
2159:
52159:
0
2159:
4
2159:
8
2159:
3837
1:3 1:71:2 1:6 1:10
1:
3839
3:3 3:73:2 3:6 3:10
3:
3839
2157:
3
2157:
72157:
2
2157:
6
2157:
10
2157:
3839
2159:
3
2159:
72159:
2
2159:
6
2159:
10
2159:
3839
2158:
3839

154 Rec. ITU-R BT.2077-0
As the 2-sample interleave division process assigns alternate lines to different sub-images, source
images with a 4:2:0 image structure do not result in sub-images with a 4:2:0 image structure.
The even lines in the source image contain Y and C components, with the odd lines having Y
components only.
The 2-sample division process results in sub-images 1 and 2 having Y and C components in a 4:2:2
image structure, and sub-images 3 and 4 having Y components only.
Figure 3-1-3 shows an example of a 2160-line 4:2:0 image structure divided to four sub-images.
FIGURE 3-1-3
4:2:0 Image Division
Sub-Image 1
1080-line 4:2:2
2160-line 4:2:0 Sub-Image 2
1080-line 4:2:2
0:1 0:30:0 0:2
1:0 1:1 1:2 1:3
0
3839
2159
0
0:4
1:4
0:1 0:50
19190
1079
2158
:1
2158
:32158
:0
2158
:2
2159
:0
2159
:1
2159
:2
2159
:3
2158
:4
2159
:4
1 2 3 4
1
1 2 3 4
1
0:0 0:4 0:8
Sub-Image 3
1080-line 4:0:0
Sub-Image 4
1080-line 4:0:0
0
19190
1079
1 2 3 4
1
19190 1 2 3 4
0
19190
1079
1 2 3 4
1
0:
3839
1:
3839
2158:
3839
2159:
3839
0:
3837
2:1 2:52:0 2:4 2:8
2:
3837
2156:
1
2156:
52156:
0
2156:
4
2156:
8
2156:
3837
2158:
1
2158:
52158:
0
2158:
4
2158:
8
2158:
3837
0:3 0:70:2 0:6 0:10
0:
3839
2:3 2:72:2 2:6 2:10
2:
3839
2156:
3
2156:
72156:
2
2156:
6
2156:
10
2156:
3839
2158:
3
2158:
72158:
2
2158:
6
2158:
10
2158:
3839
1:0 1:1 1:4 1:5 1:8 0
1079
1
1:
3837
3:0 3:1 3:4 3:5 3:83:
3837
2157
:0
2157
:1
2157
:4
2157
:5
2157
:8
2157:
3837
2159
:0
2159
:1
2159
:4
2159
:5
2159
:8
2159:
3837
1:2 1:3 1:6 1:7 1:101:
3839
3:2 3:3 3:6 3:7 3:103:
3839
2157
:3
2157
:3
2157
:6
2157
:7
2157
:10
2157:
3839
2159
:2
2159
:3
2159
:6
2159
:7
2159
:10
2159:
3839
The resulting sub-images will all be transported in a 4:2:2 multiplex. The missing C components in
the multiplex are assigned the data values which represent zero colour-difference. These are 200h in
the case of a 10-bit system or 800h in the case of a 12-bit system.
In the case of 4320-line source images, the division shown in Fig. 3-1-3 takes place when the 4320-
line image is divided to four 2160-line intermediate sub-images, so that 2160-line intermediate sub-
images 1 and 2 have 4:2:2 C components and 2160-line intermediate sub-images 3 and 4 have their
C components assigned the zero colour-difference values. When the 2160-line intermediate sub-
images are each divided to four 1080-line sub-images:
– 1080-line sub-images 1 to 4 inclusive, which are divided from 2160-line intermediate
sub-image 1, and 1080-line sub-images 5 to 8 inclusive, which are divided from 2160-line
intermediate sub-image 2, contain all of the C components from the 4320-line source image
in a 4:2:2 image structure
– 1080-line sub-images 9 to 12 inclusive, which are divided from 2160-line intermediate
sub-image 3, and 1080-line sub-images 13 to 16 inclusive, which are divided from
2160-line intermediate sub-image 4, contain all of the zero colour-difference value C
components.
Rec. ITU-R BT.2077-0 155
Attachment 2
to Part 3
(Informative)
The use of a gearbox to convert between interfaces
As shown in Figs. 3-1 and 3-2, a source image is mapped to a number of data streams, and these
data streams are then multiplexed to one or more 6 Gb/s links at four data streams per link, or to one
or more 12 Gb/s links at eight data streams per link, or to one or more 24 Gb/s links at 16 data
streams per link.
The virtual interface for each image format, including all video ancillary and audio data, is identical
except for the PID values, which have a different Byte 1 to reflect the output interface type and a
different Byte 4 to indicate the link number.
A simple device to take in, for example, a quad-link 6G interface signal and output a single link
24G interface signal is clearly possible. This device is called a gearbox.
The functions of the gearbox are:
1) To multiplex two or four inputs to a single output or to demultiplex a single input to two or
four outputs.
2) To modify Byte 1 of the PID to indicate the output interface type.
3) To modify Byte 4 of the PID to indicate the number of the output link.
This gearbox could be a separate device, or could be incorporated in the processing equipment’s or
exchange equipment’s inputs or outputs.
______________