Embed Size (px)
Citation preview
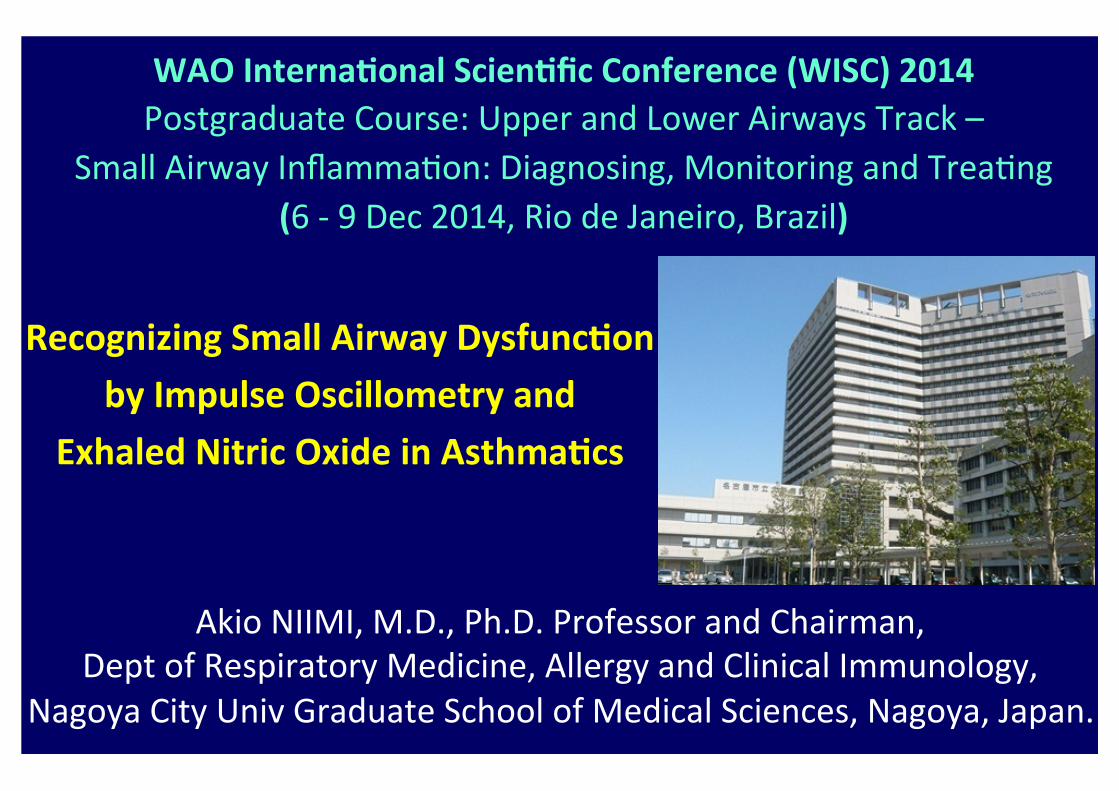
WAO Interna+onal Scien+fic Conference (WISC) 2014 Postgraduate Course: Upper and Lower Airways Track –
Small Airway Inflamma?on: Diagnosing, Monitoring and Trea?ng (6 -‐ 9 Dec 2014, Rio de Janeiro, Brazil)�
Recognizing Small Airway Dysfunc+on by Impulse Oscillometry and
Exhaled Nitric Oxide in Asthma+cs�
Akio NIIMI, M.D., Ph.D. Professor and Chairman, Dept of Respiratory Medicine, Allergy and Clinical Immunology,�
Nagoya City Univ Graduate School of Medical Sciences, Nagoya, Japan.�

Alveolar sac
Alveolar duct
Terminal bronchiole
Lobar bronchi
Diameter (mm) 2 1 0.5 0.1
Genera+on from�Tr.� 1 2 3 4 5 6 7 8 9 10 11 12 13 14 15 16 17 18 19 20 21 22 23
��������������������������������������������������
Respiratory bronchioles Bronchioles Bronchi
Main bronch
i
Trachea
Transitory-‐respiratory zone Conduc+ve zone��������������
Branching of Lower Airways
Large Airways Small Airways Internal diameter of 2 mm
Asthma used to be considered a disease of large airways, but importance of small airways has recently been recognized. �

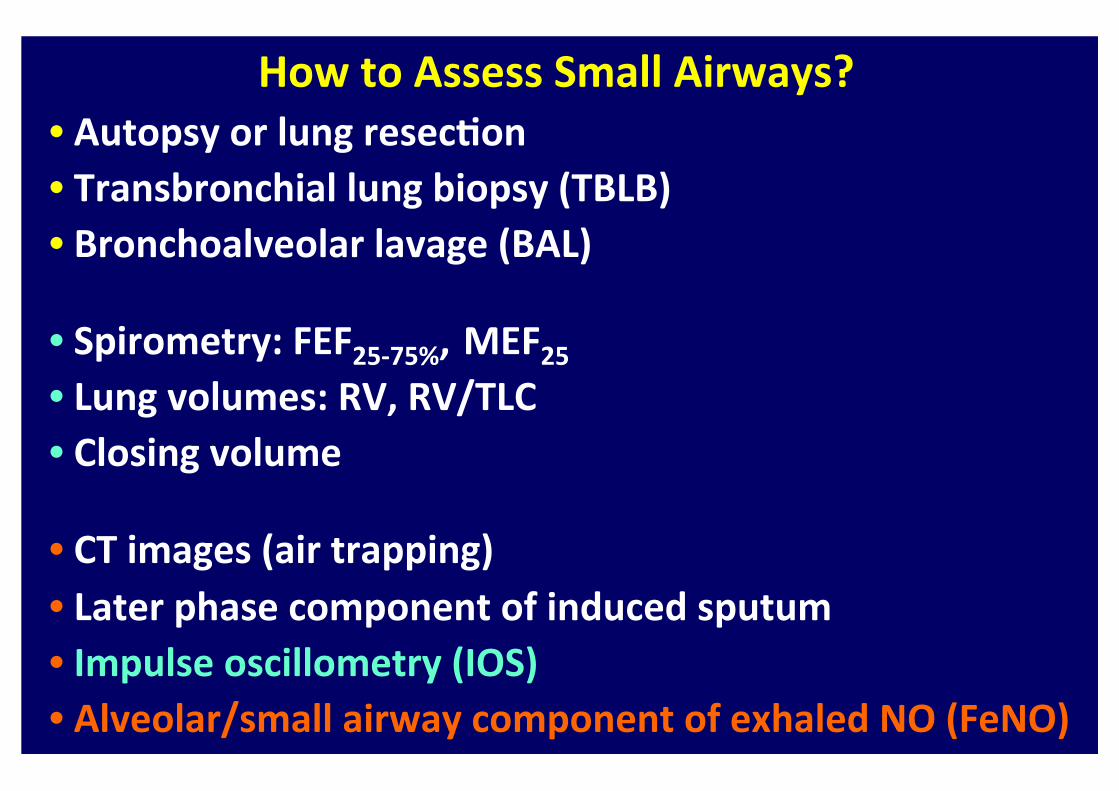
How to Assess Small Airways? • Autopsy or lung resec+on • Transbronchial lung biopsy (TBLB) • Bronchoalveolar lavage (BAL)
• Spirometry: FEF25-‐75%, MEF25 • Lung volumes: RV, RV/TLC • Closing volume
• CT images (air trapping) • Later phase component of induced sputum • Impulse oscillometry (IOS) • Alveolar/small airway component of exhaled NO (FeNO)

AIRWAY RESISTANCE
• The relationship between pressure and flow tells us about airway resistance.
Pressure
Flow
Low Resistance High Resistance
Airway Resistance �

What Value Is It ?
• FEV1, MEF etc are all RESULTS of airways resistance.
• Why measure the result when you can measure the cause.
• Airway resistance changes BEFORE changes are seen in Spirometry

MasterScreen IOS® (Erich Jaeger, Germany)
Impulse Oscillometry (IOS) �
The basic principle is to measure the rela?on between pressure waves applied external to the respiratory system, and the resul?ng respiratory airflow. �
pressure wave generator�
pneumotachograph (to measures airflow) �mouthpiece�
Cheeks supported with hand to avoid upper airway shun?ng�
resistor�
transducer�

The Principle of IOS�
Zrs= P/V � = R (resistance) + jX (reactance) �
Smith H, et al. Eur Respir Mon 2005
Mathema?cal manipula?on (i.e. Fourier transform) enables measurement of resistance (R) and reactance (X) at each frequency. �
External pressure wave generator produces ar?ficial impulse-‐shaped test signals of mul?-‐frequency.
Pneumotachograph and transducer�measures airway opening pressure and airflow, to calculate respiratory impedance (Zrs). �
mouthpiece�
resistor�

78
臨床病理レビュー 特集 第 151 号
Oscillometry System(Jaeger® MasterScreen IOS、フクダ産業社:以下 IOSと記す)4)について解説する。
I. IOS機器の構成 図3に IOS機器の構成を示す。IOSは、インパルス発生器(Loudspeaker)、流量計(Pneumotachograph)とマウスピースの部分が測定系の主要部位であり、これらを制御し、得られたデータを解析したり、
保存したりするパーソナルコンピューター及びソフトウエアとからなる。
Ⅱ. 測定方法と原理 基本的な測定原理は、従来の強制オシレーション法と同様であるが、被験者に負荷するシグナルが、インパルス(パルス波)である点が大きな特徴である。
図 1 強制オシレーション法の装置の基本的な模式図Pao: 口腔内圧(airway opening pressure), V : 気流量(airflow)(文献2)より引用、改変。
バクテリアフィルター
気流計
マウスピース
Pao バイアスフロー
拡声器
・V
図 2 オシレーション法の原理低周波数から高周波数までの複数の成分を含むオシレーションシグナルを負荷した場合、系が線形なら、測定された圧力(P)と気流量(V)とからフーリエ変換により各周波数のレジスタンスとリアクタンスを求めることができる。
+
+
+
複数の周波数の波
負荷するシグナル(forced scillation)
呼吸器系(respiratory system)
測定された圧と気流量
各周波数での圧と気流量
各周波数でのレジスタンスとリアクタンスResistanceReactance
ResistanceReactance
・V
・V
・V
P
P
P
Time
Time
Time
・
09平井先生.indd 7809平井先生.indd 78 2014/02/19 16:44:562014/02/19 16:44:56
Presented by Medical*Online
Mul+ple frequency wave �
Forced oscilla+on
Measured pressure and flow �
R and X at each frequency �
Pressure and flow at each frequency�
The Principle of IOS�
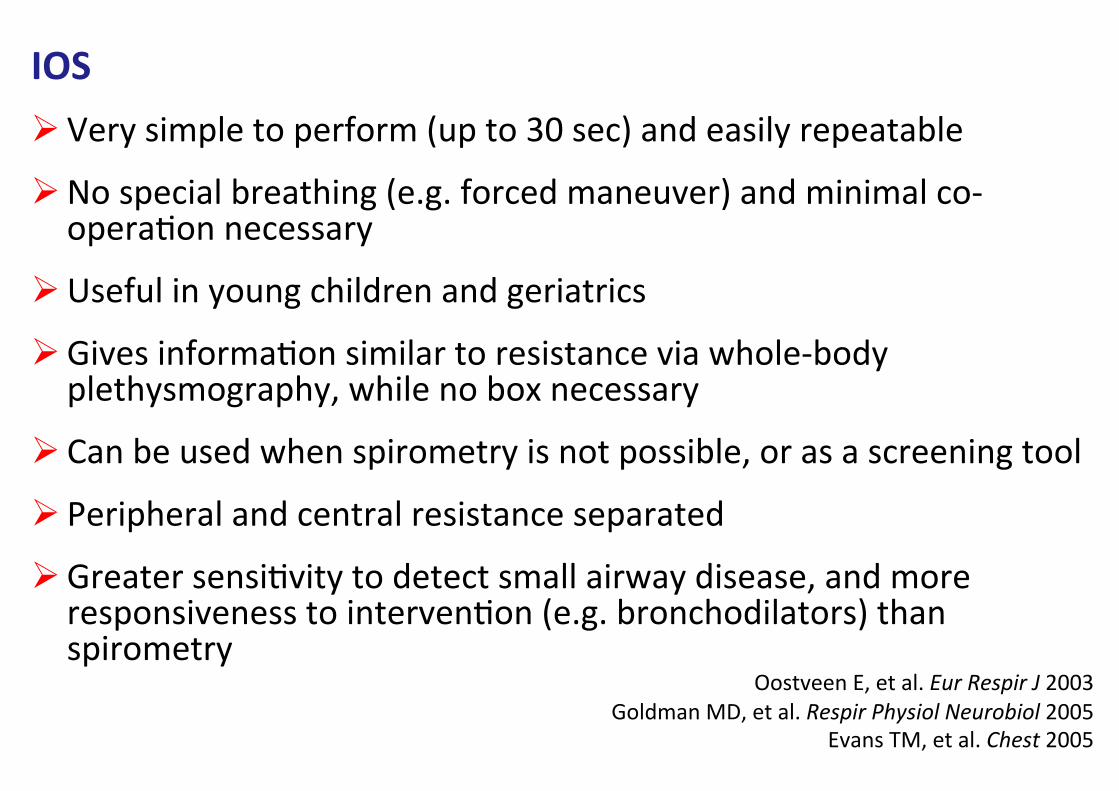
IOS Ø Very simple to perform (up to 30 sec) and easily repeatable
Ø No special breathing (e.g. forced maneuver) and minimal co-‐opera?on necessary
Ø Useful in young children and geriatrics Ø Gives informa?on similar to resistance via whole-‐body plethysmography, while no box necessary
Ø Can be used when spirometry is not possible, or as a screening tool
Ø Peripheral and central resistance separated Ø Greater sensi?vity to detect small airway disease, and more responsiveness to interven?on (e.g. bronchodilators) than spirometry
Oostveen E, et al. Eur Respir J 2003 Goldman MD, et al. Respir Physiol Neurobiol 2005
Evans TM, et al. Chest 2005�

-‐first ambulant examina?on with mouth piece -‐
W. Kamin. I. Bieber, H. Trübel (1995)
total number 60 40 20
correctly measured examina?on failed
total
2 years 3 years 4 years 5 years
IOS in Pre-‐School Children

Examples of IOS Measurements
Hirai T et al. 2003
Healthy
COPD Mild Asthma Frequency dependency�
Reactance (X: right axis)
Resistance (R: lel axis)
Frequency(F)

Normal Resistance Peripheral ResistanceCentral Resistance
Resistance �
Normal� Small airway disease �
Large airway disease �
R5↑ � R20→ � R5↑ � R20↑ �

Impulse Penetration
Fast Impulses
20Hz
Slow Impulses
5Hz
Impulse Penetration
Fast Impulses
20Hz
Slow Impulses
5HzSlow Impulses (5 Hz)� Fast Impulses (20 Hz) �
R5: CENTRAL and PERIPHERAL AIRWAYS R20: CENTRAL AIRWAYS

Lung Reactance ü Reactance is how the alveoli, diaphragm, chest wall, all react to the pressure wave.
ü Namely, it reflects “how expandable they are”.
ü Low reactance means there is liole stretch and recoil of the lungs (e.g. COPD).
ü Low reactance also results from restric?ve lung diseases (e.g. idiopathic pulmonary fibrosis [IPF]).

X5 : Reactance at 5Hz

COPD…

Central Airway Obstruction

Restrictive Lung Disease

m Detec+on and differen+a+on of restric+ve diseases only in higher degree of disease or with VC-‐manoeuvre. m A further differen+a+on between distal obstruc+on and distal restric+on becomes possible with addi+onal determina+on of VC (Spirometry) or TLC (Body Plethysmography).
m However, this is not very difficult clinically.
Limits of Oscillometry
COPD � IPF�

Asthma Intelligence Graph
(reversal films) �

Asthma Intelligence

Provocation/Dilation• Pre Bronchodilator Post Bronchodilator
Visually Impressive, and Persuasive, to the Pa+ents �

Fres and AX
• Fres = Resonance FrequencyWhere the reactance crosses zero
• AX = Reactance AreaThe area under the reactance curve
Fres
They are considered to reflect small airway disease, in the absence of restric?ve diseases. �

Rela+ng small airways to asthma control by using impulse oscillometry in children
Yixin Shi, MS Anna S. Aledia, BS Ahramahzd V. Tatavoosian, BS Shruthi Vijayalakshmi Stanley P. Galant, MD
Steven C. George, MD, PhD
J Allergy Clin Immunol 2012;129:671-‐678

Representa+ve Indices of IOS
Shi Y et al. J Allergy Clin Immunol 2012
R5-‐R20�
(Simplis?cally speaking,) : considered indices of small airways�
There is some controversy/debate as to whether this is also the case for R5 – R20. �

Demographics for Different Asthma Status
Asthma status P value*
Healthy (n=14)
Controlled (n=57)
Uncontrolled (n=44)
Healthy vs controlled
Healthy vs uncontrolled
Controlled vs uncontrolled
Age (y) 13 12 11 .69 .68 .40
Male/female sex (%) 36/64 51/49 59/41 .32 .13 .42
Height (cm) 156 154 151 .70 .23 .25
Weight (kg) 50 51 54 .91 .55 .28
Body mass index (kg/m2) 20.9 20.8 23.8 .76 .029 .009
Atopic (%) 0 77 77 <.0001 <.0001 .88
Medication step (%), noncompliant/1/2/3/4
27/12/35/21/5
27/18/34/16/5
.53
Demographic measurements are presented as medians. The Mann-‐Whitney U test was applied to detect the group difference between healthy subjects versus subjects with controlled asthma, healthy subjects versus subjects with uncontrolled asthma, and subjects with controlled asthma versus subjects with uncontrolled asthma. �
Shi Y et al. J Allergy Clin Immunol 2012

IOS Indices (pre-‐BD, post-‐BD, and pre/post change) and Asthma Control Resistance
12
10
8
6
4
2
0 R5-‐20 (cmH 2O-‐L
-‐1・s)�
R20 (cmH 2O-‐L
-‐1・s)�
R5 (cmH 2O-‐L
-‐1・s)� Healthy (n=14)
Controlled asthma (n=57) Uncontrolled asthma (n=44)�
*P < 0.05 and **P < 0.01 by Mann-‐Whitney U test: �
12
10
8
6
4
2
0
12
10
8
6
4
2
0
Pre Post Change
Pre Post Change
** **
** *
** **
Pre Post Change
** ** **
** * **
Shi Y et al. J Allergy Clin Immunol 2012

Reactance
40
30
20
10
0
AX (cmH 2O-‐L
-‐1)�
X5 (cmH 2O-‐L
-‐1・s)�
Fres (H
z)�
1
0
-1
-2
-3
-4
30
25
20
15
10
5
0
Pre Post Change
** **
** **
** **
Pre Post Change
** **
** ** *
*
Pre Post Change
** **
** **
** **
CONCLUSION: Uncontrolled asthma is associated with small airways dysfunc?on, and IOS might be a reliable and noninvasive method to assess asthma control in children.
IOS Indices (pre-‐BD, post-‐BD, and pre/post change) and Asthma Control
Healthy (n=14) Controlled asthma (n=57) Uncontrolled asthma (n=44)�
*P < 0.05 and **P < 0.01 by Mann-‐Whitney U test: �
Shi Y et al. J Allergy Clin Immunol 2012

Cavalcan?a JV et al. Respir Med 2006
Asthma Severity and Frequency Dependency of Rrs and Xrs�
Frequency dependency of Rrs and Xrs, which may manifest as ↑R5-‐R20, becomes evident even in asthma+c pa+ents as the severity increases.�

Rela+onship between Small Airway Func+on and Health Status, Dyspnea and Disease Control in Asthma�
Takeda T, Oga T, Niimi A et al. Respira=on 2009
IOS and Clinical Outcomes in Asthma Respiration 3
tance from 5 to 35 Hz (X5–X35) and frequency of resonance, which represents the point at which the usually negative reactance reaches 0, measured in Hertz. In the present study, we used respi-ratory resistance at 5 and 20 Hz (R5 and R20) as indices of total and proximal airway resistance, respectively, and considered the fall in resistance from 5 to 20 Hz (R5–R20) as a surrogate for the resistance of peripheral airways, as reported previously [10, 12, 16, 17, 31, 32] . Moreover, reactance at 5 Hz (X5), which may be deter-mined by homogenous distribution of ventilation, effective ven-tilation capacity, and compliance of the lung and chest wall, was also considered representative of peripheral airway abnormalities such as those caused by inflammation [10, 12, 17, 33] .
Statistical Analysis Results are expressed as means 8 standard deviation. Rela-
tionships between different outcome measurements were ana-lyzed using Pearson’s correlation coefficient tests. For ordinal variables such as the BDI, we performed additional correlations using Spearman’s rank correlation coefficient tests to confirm that values for these correlations were compatible with Pearson’s correlation coefficients. We then chose to present all results as Pearson’s correlation coefficients for ease of comprehension and comparison across relationships [28] . Forward and backward stepwise multiple regression analyses were performed to identify variables that could best predict health status, dyspnea and dis-ease control, using pulmonary function indices and medications as independent variables. Independent variables including the daily doses of inhaled corticosteroids were used as continuous variables, except that the categoric variables such as use of long-acting ! 2 -agonists, leukotriene modifiers and theophylline were coded as 1 (administered) or 0 (not administered) for the analysis. Values of p ! 0.05 were considered statistically significant.
Results
Subject characteristics are presented in table 1 . Among the 65 patients, 58 had never smoked. Severity of asthma was intermittent (step 1) in 7 patients, mild persistent (step 2) in 20, moderate persistent (step 3) in 28, and se-vere persistent (step 4) in 10, based on the classification according to the Global Initiative for Asthma guidelines [34] .
Table 2 shows correlation coefficients between health status, dyspnea and disease control and pulmonary func-tion and medications. Regarding health status, the over-all score for the AQLQ and the total score for the SGRQ significantly but weakly correlated with FEV 1 (correla-tion coefficient, r = 0.33 and 0.35), moderately correlated with R20 (r = 0.54 and 0.51), R5–R20 (r = 0.50 and 0.50) and X5 (r = 0.49 and 0.48), and weakly to moderately cor-related with dose of inhaled corticosteroid and adminis-tration of theophylline (r = 0.35–0.41). Regarding dys-pnea, the BDI moderately correlated with FEV 1 , R20, R5–R20 and X5 (r = 0.41–0.57) and weakly correlated with administration of theophylline (r = 0.32). Regarding dis-ease control, the ACQ score moderately correlated with FEV 1 , R20, R5–R20 and X5 (r = 0.43–0.55), and weakly to moderately correlated with dose of inhaled corticoste-roid and administration of long-acting ! 2 -agonists, leu-kotriene modifiers and theophylline (r = 0.28–0.46).
Gender, female/male 37/28Age, years 55.2817.4Severity of asthma, step 1/2/3/4 7/20/28/10Medication
Inhaled corticosteroids, administered/not administered 58/7Doses of inhaled corticosteroids1, "g/day 3958239Long-acting !2-agonists, administered/not administered 29/36Leukotriene modifiers, administered/not administered 20/45Theophylline, administered/not administered 8/57
FEV1, liters 2.2780.97FEV1, % predicted 88.7820.8R20, kPa s l–1 0.3380.12R5–R20, kPa s l–1 0.08680.141X5, kPa s l–1 –0.17480.228AQLQ overall (1–7) 5.5781.15SGRQ total (0–100) 27.0820.0BDI (0–12) 9.882.1ACQ (0–6) 1.0481.01
Numbers in parentheses indicate theoretical score ranges. 1 Doses of inhaled corticosteroids were converted into the equivalent dose of flutica-
sone propionate.
Table 1. Characteristics of 65 patients with asthma
Characteris+cs of 65 asthma+c pa+ents �
AQLQ: Asthma Quality of Life Ques?onnaire, SGRQ: St. George’s Respiratory Ques?onnaire BDI: Baseline Dyspnea Index, ACQ: Asthma Control Ques?onnaire �

Rela+onship between Small Airway Func+on and Health Status, Dyspnea and Disease Control in Asthma�
Takeda T, Oga T, Niimi A et al. Respira=on 2009
Takeda et al. Respiration 4
Table 3 shows the results of stepwise multiple regres-sion analyses performed to identify which variables of pulmonary function or medications could predict health status, dyspnea and disease control. Regarding health status, R20, X5 and dose of inhaled corticosteroid sig-nificantly accounted for the AQLQ (r 2 = 0.21, 0.12 and 0.10, respectively). R20, R5–R20 and administration of theophylline and long-acting ! 2 -agonists significantly accounted for the SGRQ (r 2 = 0.18, 0.11, 0.10 and 0.07, re-spectively). Regarding dyspnea, R20 and R5–R20 signifi-cantly explained the BDI (r 2 = 0.13 and 0.24, respectively).
Regarding disease control, FEV 1 , X5 and administration of theophylline significantly accounted for the ACQ score (r 2 = 0.19, 0.16 and 0.12, respectively).
Discussion
We assessed relationships between proximal and pe-ripheral airway function and health status, dyspnea and disease control of patients with asthma, using the differ-ent instruments of IOS and spirometry. We demonstrat-
AQLQoverall
SGRQtotal
BDI ACQ
FEV1 0.33 –0.35 0.41 –0.55R20 –0.54 0.51 –0.49 0.43R5–R20 –0.50 0.50 –0.57 0.55X5 0.49 –0.48 0.54 –0.53Daily doses of inhaled corticosteroidsa –0.36 0.35 – 0.42Use of long-acting !2-agonistsb – 0.31 – 0.28Use of leukotriene modifiersb – – – 0.33Use of theophyllineb –0.35 0.41 –0.32 0.46
Missing data (–) indicate that no statistically significant relationships were identi-fied.
a Doses of inhaled corticosteroids were converted into the equivalent dose of flutica-sone propionate.
b Use of long-acting !2-agonists, leukotriene modifiers or theophylline was coded as 1 (administered) or 0 (not administered) for the analysis.
Table 2. Correlation coefficients between pulmonary function and medications and health status, dyspnea and disease control
Independent variables AQLQ overall
SGRQ total
BDI ACQ
FEV1 – – – 0.19R20 0.21 0.18 0.13 –R5–R20 – 0.11 0.24 –X5 0.12 – – 0.16Daily doses of inhaled corticosteroidsa 0.10 – – –Use of long-acting !2-agonistsb – 0.07 – –Use of leukotriene modifiersb – – – –Use of theophyllineb – 0.10 – 0.12Cumulative r2 0.43 0.46 0.37 0.47
Missing data (–) indicate that independent variables were not statistically significant. All values represent the coefficient of determination (r2).
a Doses of inhaled corticosteroids were converted into the equivalent dose of flutica-sone propionate.
b Use of long-acting !2-agonists, leukotriene modifiers or theophylline was coded as 1 (administered) or 0 (not administered) for the analysis.
Table 3. Results of stepwise multiple regression analyses to predict health status, dyspnea and disease control
Values indicate correla?on coefficients. Missing data (–) indicate that no sta?s?cally significant rela?onships were iden?fied. �
Correla+on coefficients between pulmonary func+on and medica+ons and health status, dyspnea and disease control (univariate analysis) �

Rela+onship between Small Airway Func+on and Health Status, Dyspnea and Disease Control in Asthma�
Takeda T, Oga T, Niimi A et al. Respira=on 2009
Takeda et al. Respiration 4
Table 3 shows the results of stepwise multiple regres-sion analyses performed to identify which variables of pulmonary function or medications could predict health status, dyspnea and disease control. Regarding health status, R20, X5 and dose of inhaled corticosteroid sig-nificantly accounted for the AQLQ (r 2 = 0.21, 0.12 and 0.10, respectively). R20, R5–R20 and administration of theophylline and long-acting ! 2 -agonists significantly accounted for the SGRQ (r 2 = 0.18, 0.11, 0.10 and 0.07, re-spectively). Regarding dyspnea, R20 and R5–R20 signifi-cantly explained the BDI (r 2 = 0.13 and 0.24, respectively).
Regarding disease control, FEV 1 , X5 and administration of theophylline significantly accounted for the ACQ score (r 2 = 0.19, 0.16 and 0.12, respectively).
Discussion
We assessed relationships between proximal and pe-ripheral airway function and health status, dyspnea and disease control of patients with asthma, using the differ-ent instruments of IOS and spirometry. We demonstrat-
AQLQoverall
SGRQtotal
BDI ACQ
FEV1 0.33 –0.35 0.41 –0.55R20 –0.54 0.51 –0.49 0.43R5–R20 –0.50 0.50 –0.57 0.55X5 0.49 –0.48 0.54 –0.53Daily doses of inhaled corticosteroidsa –0.36 0.35 – 0.42Use of long-acting !2-agonistsb – 0.31 – 0.28Use of leukotriene modifiersb – – – 0.33Use of theophyllineb –0.35 0.41 –0.32 0.46
Missing data (–) indicate that no statistically significant relationships were identi-fied.
a Doses of inhaled corticosteroids were converted into the equivalent dose of flutica-sone propionate.
b Use of long-acting !2-agonists, leukotriene modifiers or theophylline was coded as 1 (administered) or 0 (not administered) for the analysis.
Table 2. Correlation coefficients between pulmonary function and medications and health status, dyspnea and disease control
Independent variables AQLQ overall
SGRQ total
BDI ACQ
FEV1 – – – 0.19R20 0.21 0.18 0.13 –R5–R20 – 0.11 0.24 –X5 0.12 – – 0.16Daily doses of inhaled corticosteroidsa 0.10 – – –Use of long-acting !2-agonistsb – 0.07 – –Use of leukotriene modifiersb – – – –Use of theophyllineb – 0.10 – 0.12Cumulative r2 0.43 0.46 0.37 0.47
Missing data (–) indicate that independent variables were not statistically significant. All values represent the coefficient of determination (r2).
a Doses of inhaled corticosteroids were converted into the equivalent dose of flutica-sone propionate.
b Use of long-acting !2-agonists, leukotriene modifiers or theophylline was coded as 1 (administered) or 0 (not administered) for the analysis.
Table 3. Results of stepwise multiple regression analyses to predict health status, dyspnea and disease control
Values represent the coefficient of determina?on (r2). Missing data (–) indicate that independent variables were not sta?s?cally significant.
Results of stepwise mul+ple regression analyses to predict health status, dyspnea and disease control (mul+variate analysis) �
Large and small airways independently contribute to asthma pathophysiology e.g. QOL, dyspnea and disease control. �

adherence to therapy, increased side effects, and decreasedresponsiveness to medication.3
Different clinical measurements have been used to evaluate thepathophysiology of asthma. Computed tomography (CT) has beenused to assess large airway wall remodeling6,7 and small airwayinvolvement (ie, air trapping)8,9 in patients with asthma. Impulseoscillation (IOS) is a noninvasive method of measuring respiratoryresistance (R) and reactance (X), which could differentiate largefrom small airway disease.10e13 Further, induced sputum cell dif-ferentials14 and exhaled nitric oxide (FeNO)15 levels have been usedto assess airway inflammation profiles.
The process of aging is normally associated with various age-related structural changes in the respiratory system. Withadvancing age, elastic fibers in the lung parenchyma decrease.These changes can alter the elastic properties of the airways,resulting in a loss of elastic recoil.16 Thus, in elderly patients, smallairways can tend to collapse during expiration, possibly leading toair trapping and an increase in residual volume (RV). Elderly pa-tients with asthma are assumed to have more prominent smallairway disease, although evidence for this is lacking. Moreover,aging may affect immunologic and inflammatory profiles in pa-tients with asthma. Airway neutrophilia may be more predominantin elderly patients with asthma than in the nonelderly,17,18 althoughconflicting evidence exists showing that sputum cellular profilesare similar in young and elderly patients with asthma.19
Because comprehensive studies on elderly asthma, addressingits physiologic, radiologic, and immunologic features, are scarce,these pathophysiologic characteristics of elderly asthma wereinvestigated using spirometry, CT, IOS, induced sputum, FeNO, andIgE measurements and compared with results in nonelderly pa-tients with asthma.
Methods
Subjects
Study subjects were retrospectively selected from 136 patientswith stable asthma who underwent chest multidetector raw CT forresearch purposes20,21 at the outpatient clinic at Kyoto UniversityHospital from February 2006 through October 2009. The inclusioncriteria of this study were as follows: (1) diagnosis of asthma ac-cording to American Thoracic Society criteria22; (2) clinically stabledisease that had been fully controlled for at least 1 month23 at thetime of examinations; (3) never smoker or ex-smoker who hadsmoked for less than 5 pack-years but had stopped smoking morethan 12 months before study entry; (4) treatment with inhaledcorticosteroids (ICSs) for at least 3 months; and (5) absence of otherrespiratory diseases, including evidence of emphysema, on CT im-ages. According to the inclusion criteria, 112 patients were eligiblefor this study (Table 1). Elderly patients were defined as those olderthan 65 years, based on the World Health Organization statement.1
In this study, the subject’s age was determined at the time of CTexamination. The following clinical examinations were performedin each subject during follow-up: spirometry (n ! 112, 100%), IOS(n ! 111, 99.1%), induced sputum (n ! 76, 67.9%), airway respon-siveness test (n ! 79, 70.5%), FeNO (n ! 110, 98.2%), peripheralblood cell differentials (n ! 112, 100%), and serum total IgE andallergen specific IgE (n ! 112, 100%). However, to maintain theintegrity of the clinical data to be analyzed in this retrospectivestudy, only the data obtained within 4 weeks of the date of CTmeasurement were used. As a result, the number and percentage ofsubjects for whom these data were available were decreased ineach group as specified in Tables 2 to 6. The frequency of diseaseexacerbation, classified as that requiring systemic corticosteroids orhospitalization,24 was counted for the 12 months before and afterthe CT examination. This study was approved by the ethics com-mittee of Kyoto University (approval number E-189 and C-147).
Written informed consent was obtained from all subjects forparticipation in this study.
Outcome Measurements
Pulmonary function testsPre-bronchodilator values of forced vital capacity (FVC), force
expiration volume in 1 second (FEV1), and mid-forced expiratoryflow (FEF25-75) were examined using a ChestGraph HI-701spirometer (Chest MI, Inc, Tokyo, Japan). The ratio of RV to totallung capacity (TLC), which is considered to reflect air trapping, alsowas measured using a CHESTAC-8800 (Chest MI, Inc). To excludethe effects of age and physique on pulmonary function tests, thepredicted values of FVC and FEV1, which were quoted from thepublication of the Japanese Respiratory Society,25 were used forcomparisons between elderly and nonelderly patients with asthma.The predicted values of FEF25-75 and RV/TLC were calculated fromother published equations.26
CT measurementsEach subject underwent multidetector raw CT (Aquilion 64;
Toshiba Medical Systems, Tokyo, Japan) as described previously.7,27
To evaluate large airway wall dimensions, 3 parameters wereanalyzed: airway wall area (WA) corrected as a percentage of totalwall area (WA%), WA normalized for body surface area (WA/BSA;square millimeters per square meter), and normalized absolute
Table 1Subject characteristicsa
Elderly patientswith asthma (>65 y)
Nonelderly patientswith asthma ("65 y)
Pvalue
Patients 45 67Men/women 11/34 21/46 NSAge (y) 73.1 # 5.3 48.6 # 12.9 <.001Disease duration (y) 12.7 # 16.2 8.0 # 10.5 NSExacerbations per year 0 (0e2.5) 0 (0e3) NSSeverity (step 1/2/3/4)b 0/12/16/17 0/23/31/13 NSSmoking, ex/never 1/44 12/55 .01Pack-years 0.11 # 0.75 0.34 # 1.1 NSDose of ICS (mg/d;equivalent to CFC-BDP)
800 (400e3,200) 800 (200e2,400) NS
BMI (kg/m2) 23.0 # 3.5 23.5 # 4.1 NSAllergic rhinitis, present 11 (24) 36 (54) .002Atopic dermatitis, present 1 (2) 6 (9) NS
Abbreviations: BMI, body mass index; CFC-BDP, chlorofluorocarbon-11/12-beclomethasone dipropionate; ICS, inhaled corticosteroid; NS, not significant.aData are expressed as number (percentage) or median (range), except for age,disease duration, pack-years, and BMI, which are presented as mean # SD.bThe clinical severity of asthma was defined by patient symptoms and lung functionon current therapy as step 1 (intermittent), step 2 (mild persistent), step 3 (mod-erate persistent), or step 4 (severe persistent), according to the 2005 criteria of theGlobal Initiative for Asthma.
Table 2Comparison of pulmonary function tests between elderly and nonelderly patientswith asthmaa
Elderly patientswith asthma (>65 y)
Nonelderly patientswith asthma ("65 y)
Pvalue
Spirometry 41 (91) 63 (94)FVC (%pred) 91.0 (46.4e135) 97.6 (58.7e141) NSFEV1 (%pred) 81.2 (40.8e133) 88.8 (34.7e112) .02FEV1/FVC 0.718 (0.440e0.896) 0.784 (0.409e0.934) .001FEF25-75 (%pred) 50.9 (14.2e148) 78.6 (9.6e152) .03
Lung volume measurement 37 (82) 57 (85)RV/TLC (%pred) 110 (81.3e187) 109 (67.1e258) NS
Abbreviations: FEF25-75, mid-forced expiratory flow; FEV1, forced expiratory volumein 1 second; FVC, forced vital capacity; NS, not significant; %pred, percentage ofpredicted value; RV/TLC, ratio of residual volume to total lung capacity.aData are presented as number (percentage) or median (range).
H. Inoue et al. / Ann Allergy Asthma Immunol xxx (2014) 1e72
Pathophysiological Characteris+cs of Asthma in the Elderly: A Comprehensive Study
�
Inoue H, Niimi A, et al. Ann Allergy Asthma Immunol 2014�

adherence to therapy, increased side effects, and decreasedresponsiveness to medication.3
Different clinical measurements have been used to evaluate thepathophysiology of asthma. Computed tomography (CT) has beenused to assess large airway wall remodeling6,7 and small airwayinvolvement (ie, air trapping)8,9 in patients with asthma. Impulseoscillation (IOS) is a noninvasive method of measuring respiratoryresistance (R) and reactance (X), which could differentiate largefrom small airway disease.10e13 Further, induced sputum cell dif-ferentials14 and exhaled nitric oxide (FeNO)15 levels have been usedto assess airway inflammation profiles.
The process of aging is normally associated with various age-related structural changes in the respiratory system. Withadvancing age, elastic fibers in the lung parenchyma decrease.These changes can alter the elastic properties of the airways,resulting in a loss of elastic recoil.16 Thus, in elderly patients, smallairways can tend to collapse during expiration, possibly leading toair trapping and an increase in residual volume (RV). Elderly pa-tients with asthma are assumed to have more prominent smallairway disease, although evidence for this is lacking. Moreover,aging may affect immunologic and inflammatory profiles in pa-tients with asthma. Airway neutrophilia may be more predominantin elderly patients with asthma than in the nonelderly,17,18 althoughconflicting evidence exists showing that sputum cellular profilesare similar in young and elderly patients with asthma.19
Because comprehensive studies on elderly asthma, addressingits physiologic, radiologic, and immunologic features, are scarce,these pathophysiologic characteristics of elderly asthma wereinvestigated using spirometry, CT, IOS, induced sputum, FeNO, andIgE measurements and compared with results in nonelderly pa-tients with asthma.
Methods
Subjects
Study subjects were retrospectively selected from 136 patientswith stable asthma who underwent chest multidetector raw CT forresearch purposes20,21 at the outpatient clinic at Kyoto UniversityHospital from February 2006 through October 2009. The inclusioncriteria of this study were as follows: (1) diagnosis of asthma ac-cording to American Thoracic Society criteria22; (2) clinically stabledisease that had been fully controlled for at least 1 month23 at thetime of examinations; (3) never smoker or ex-smoker who hadsmoked for less than 5 pack-years but had stopped smoking morethan 12 months before study entry; (4) treatment with inhaledcorticosteroids (ICSs) for at least 3 months; and (5) absence of otherrespiratory diseases, including evidence of emphysema, on CT im-ages. According to the inclusion criteria, 112 patients were eligiblefor this study (Table 1). Elderly patients were defined as those olderthan 65 years, based on the World Health Organization statement.1
In this study, the subject’s age was determined at the time of CTexamination. The following clinical examinations were performedin each subject during follow-up: spirometry (n ! 112, 100%), IOS(n ! 111, 99.1%), induced sputum (n ! 76, 67.9%), airway respon-siveness test (n ! 79, 70.5%), FeNO (n ! 110, 98.2%), peripheralblood cell differentials (n ! 112, 100%), and serum total IgE andallergen specific IgE (n ! 112, 100%). However, to maintain theintegrity of the clinical data to be analyzed in this retrospectivestudy, only the data obtained within 4 weeks of the date of CTmeasurement were used. As a result, the number and percentage ofsubjects for whom these data were available were decreased ineach group as specified in Tables 2 to 6. The frequency of diseaseexacerbation, classified as that requiring systemic corticosteroids orhospitalization,24 was counted for the 12 months before and afterthe CT examination. This study was approved by the ethics com-mittee of Kyoto University (approval number E-189 and C-147).
Written informed consent was obtained from all subjects forparticipation in this study.
Outcome Measurements
Pulmonary function testsPre-bronchodilator values of forced vital capacity (FVC), force
expiration volume in 1 second (FEV1), and mid-forced expiratoryflow (FEF25-75) were examined using a ChestGraph HI-701spirometer (Chest MI, Inc, Tokyo, Japan). The ratio of RV to totallung capacity (TLC), which is considered to reflect air trapping, alsowas measured using a CHESTAC-8800 (Chest MI, Inc). To excludethe effects of age and physique on pulmonary function tests, thepredicted values of FVC and FEV1, which were quoted from thepublication of the Japanese Respiratory Society,25 were used forcomparisons between elderly and nonelderly patients with asthma.The predicted values of FEF25-75 and RV/TLC were calculated fromother published equations.26
CT measurementsEach subject underwent multidetector raw CT (Aquilion 64;
Toshiba Medical Systems, Tokyo, Japan) as described previously.7,27
To evaluate large airway wall dimensions, 3 parameters wereanalyzed: airway wall area (WA) corrected as a percentage of totalwall area (WA%), WA normalized for body surface area (WA/BSA;square millimeters per square meter), and normalized absolute
Table 1Subject characteristicsa
Elderly patientswith asthma (>65 y)
Nonelderly patientswith asthma ("65 y)
Pvalue
Patients 45 67Men/women 11/34 21/46 NSAge (y) 73.1 # 5.3 48.6 # 12.9 <.001Disease duration (y) 12.7 # 16.2 8.0 # 10.5 NSExacerbations per year 0 (0e2.5) 0 (0e3) NSSeverity (step 1/2/3/4)b 0/12/16/17 0/23/31/13 NSSmoking, ex/never 1/44 12/55 .01Pack-years 0.11 # 0.75 0.34 # 1.1 NSDose of ICS (mg/d;equivalent to CFC-BDP)
800 (400e3,200) 800 (200e2,400) NS
BMI (kg/m2) 23.0 # 3.5 23.5 # 4.1 NSAllergic rhinitis, present 11 (24) 36 (54) .002Atopic dermatitis, present 1 (2) 6 (9) NS
Abbreviations: BMI, body mass index; CFC-BDP, chlorofluorocarbon-11/12-beclomethasone dipropionate; ICS, inhaled corticosteroid; NS, not significant.aData are expressed as number (percentage) or median (range), except for age,disease duration, pack-years, and BMI, which are presented as mean # SD.bThe clinical severity of asthma was defined by patient symptoms and lung functionon current therapy as step 1 (intermittent), step 2 (mild persistent), step 3 (mod-erate persistent), or step 4 (severe persistent), according to the 2005 criteria of theGlobal Initiative for Asthma.
Table 2Comparison of pulmonary function tests between elderly and nonelderly patientswith asthmaa
Elderly patientswith asthma (>65 y)
Nonelderly patientswith asthma ("65 y)
Pvalue
Spirometry 41 (91) 63 (94)FVC (%pred) 91.0 (46.4e135) 97.6 (58.7e141) NSFEV1 (%pred) 81.2 (40.8e133) 88.8 (34.7e112) .02FEV1/FVC 0.718 (0.440e0.896) 0.784 (0.409e0.934) .001FEF25-75 (%pred) 50.9 (14.2e148) 78.6 (9.6e152) .03
Lung volume measurement 37 (82) 57 (85)RV/TLC (%pred) 110 (81.3e187) 109 (67.1e258) NS
Abbreviations: FEF25-75, mid-forced expiratory flow; FEV1, forced expiratory volumein 1 second; FVC, forced vital capacity; NS, not significant; %pred, percentage ofpredicted value; RV/TLC, ratio of residual volume to total lung capacity.aData are presented as number (percentage) or median (range).
H. Inoue et al. / Ann Allergy Asthma Immunol xxx (2014) 1e72
Inoue H, Niimi A, et al. Ann Allergy Asthma Immunol 2014�
Pathophysiological Characteris+cs of Asthma in the Elderly: A Comprehensive Study
�

wall thickness (T/OBSA; millimeters per meter)7 at the right apicalsegmental bronchus and right posterior basal segmental bronchus,fromwhich tangential views of the bronchus were available. At fullinspiration, consecutive slices of the 2 bronchi were automaticallymeasured and averaged. To assess air trapping, the percentage oflow-attenuation areas (LAA%; <!960 HU) and mean lung density(MLD) at full inspiration and full expiration were analyzed.9 Theratios of full expiration to full inspiration (E/I ratio) for LAA% andMLD also were evaluated. A higher E/I ratio indicates more prom-inent small airway involvement.9 Spirometrically gated CT,28 whichanalyzes full-inspiratory and full-expiratory lung fields by moni-toring a patient’s spirometric status, was performed in 47 subjects.The other subjects were carefully instructed by technicians tobreathe in deeply for a full inspiration and to breathe outcompletely for a full expiration.9
IOS measurementsRespiratory impedance was measured using a Jaeger Master-
Screen IOS (Jaeger/Toennies, Hochberg, Germany) according tostandard recommendations.29 Rectangular mechanical pulses,including the entire frequency spectrum, were generated andapplied to the subject’s airway through a mouthpiece with a cheeksupport. Impedance measurements included resistances at fre-quencies from 5 to 35 Hz (R5 to R35), reactance at frequencies from
5 to 35 Hz (X5 to X35), and frequency of resonance (Fres), whichrepresents the point at which the usually negative reactance rea-ches 0. AX was defined as the integrated area between 5 Hz andFres. It is assumed that respiratory resistances at 5 Hz (R5) and 20Hz (R20) reflect total airway resistance and large airway resistance,respectively.10
Several previous studies adopted the decrease in resistancefrom 5 to 20 Hz as representing frequency dependency (R5eR20)and X5, AX, and Fres as indices of small airway abnormalities.10e13
The authors previously reported that R5eR20 and AX correlatedwith the conventional parameters of small airway obstruction,namely FEF25-75 and RV/TLC.11 Hence, they used R5eR20, X5, AX,and Fres as indices of small airway disease. To exclude the potentialeffects of age or physique on IOS measurements,30,31 they alsoevaluated the ratio of R5eR20 to R5 ([R5eR20]/R5) as an alterna-tive index of small airway disease.
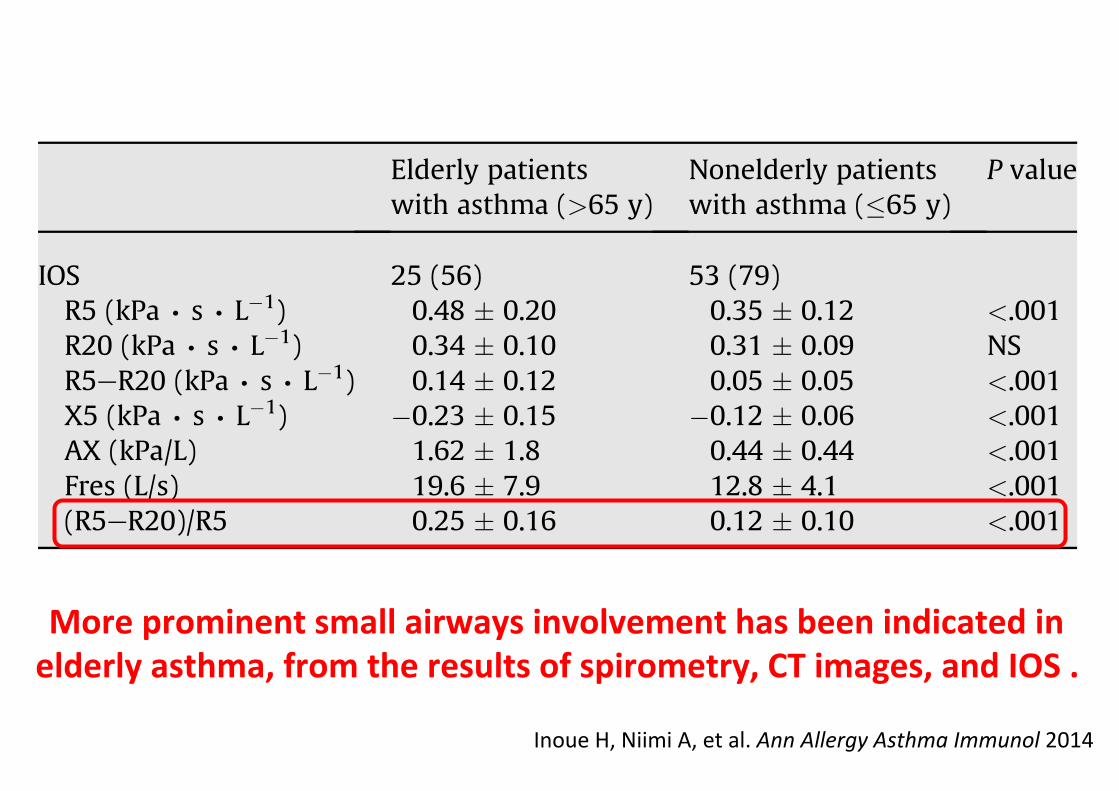
Table 4Comparison of IOS measurements between elderly and nonelderly patients withasthmaa
Elderly patientswith asthma (>65 y)
Nonelderly patientswith asthma ("65 y)
P value
IOS 25 (56) 53 (79)R5 (kPa ∙ s ∙ L!1) 0.48 # 0.20 0.35 # 0.12 <.001R20 (kPa ∙ s ∙ L!1) 0.34 # 0.10 0.31 # 0.09 NSR5eR20 (kPa ∙ s ∙ L!1) 0.14 # 0.12 0.05 # 0.05 <.001X5 (kPa ∙ s ∙ L!1) !0.23 # 0.15 !0.12 # 0.06 <.001AX (kPa/L) 1.62 # 1.8 0.44 # 0.44 <.001Fres (L/s) 19.6 # 7.9 12.8 # 4.1 <.001(R5eR20)/R5 0.25 # 0.16 0.12 # 0.10 <.001
Abbreviations: AX, integrated area between 5 Hz and frequency of resonance; Fres,frequency of resonance; IOS, impulse oscillation; NS, not significant; R5, resistanceat 5 Hz; R20, resistance at 20 Hz; X5, reactance at 5 Hz.aData are presented as number (percentage) or mean # SD.
Table 5Comparisons of FeNO levels, peripheral blood cell differentials, induced sputum celldifferentials, and AHR between elderly and nonelderly patients with asthmaa
Elderly patientswith asthma(>65 y)
Nonelderly patientswith asthma("65 y)
Pvalue
FeNO 32 (71) 53 (79)FeNO (ppb) 24.6 (5.9e98.6) 26.9 (10.3e110) NS
Induced sputum cell differentials 24 (53) 35 (52)Eosinophils (%) 0.5 (0e32.5) 1.5 (0e54.8) NSNeutrophils (%) 67.0 (32.8e98.5) 59.5 (4e94.3) NS
Inflammatory subtypesb
E/N/P/M 4/8/5/7 13/9/5/8 NSBlood cell differentials 45 (100) 67 (100)Eosinophils (%) 3.6 (0.4e25.9) 3.6 (0.1e25.9) NSNeutrophils (%) 59.9 (37.4e80.8) 56.2 (36.3e82.9) NS
AHR measurements 26 (58) 40 (60)Dmin (U) 3.6 (0.09e50) 8.2 (0.15e50) NSSRrs (cmH2O ∙ L!1 ∙ s!1 ∙ min!1) 1.38 (0.28e5.19) 1.49 (0.39e13.6) NS
Abbreviations: AHR, airway hyperresponsiveness; Dmin, cumulative dose ofmethacholine at inflection point at which respiratory resistance began to increase;E, eosinophilic; FeNO, exhaled nitric oxide; M, mixed granulocytic; N, neutrophilic;NS, not significant; P, pauci-granulocytic; ppb, parts per billion; SRrs, slope ofdoseeresponse curve for methacholine and respiratory resistance.aData are presented as number (percentage) or median (range). For eosinophils andneutrophils, median percentages (range) are listed.bSubjects were classified as having 1 of 4 inflammatory subtypes by induced sputumcell differentials: eosinophilic (eosinophils $1.0%, neutrophils <61%), neutrophilic(eosinophils <1.0%, neutrophils $61%), pauci-granulocytic (eosinophils <1.0%,neutrophils <61%), or mixed granulocytic (eosinophils $1.0%, neutrophils $61%).
Table 6Comparisons of IgE and atopic status between elderly and nonelderly patients withasthmaa
Elderly patientswith asthma (>65 y)
Nonelderly patientswith asthma ("65 y)
Pvalue
Patients 45 (100) 67 (100)Serum total IgE (IU/mL) 91 (5e2,100) 210 (5e8,700) .006$1 positive specific IgE 22 (49) 50 (75) .005Positive rates of individual
specific IgECat dander 2 (4.4) 12 (17.9) .03Dog dander 1 (2.3) 14 (20.9) .005House dust 12 (27.3) 34 (50.8) .01Mites (Dermatophagoides
pteronyssinus)13 (28.9) 34 (50.8) .02
Japanese cedar pollen 9 (20.0) 40 (59.7) <.001Mixed Gramineae pollens 4 (8.9) 16 (23.9) .04Mixed weed pollens 0 (0.0) 5 (7.5) NSMixed molds 1 (2.2) 7 (10.5) NSTrichophyton 5 (11.4) 7 (10.5) NS
Abbreviation: NS, not significant.aData are presented as number (percentage) or median (range).
Table 3Comparison of computed tomographic measurements between elderly andnonelderly patients with asthmaa
Elderly patients withasthma (>65 y)
Nonelderly patientswith asthma ("65 y)
P value
Central airway wallthickness
45 (100) 67 (100)
WA% 61.7 (52.9e70.9) 57.6 (49.0e70.3) <.001WA/BSA (mm2/m2) 16.1 (10.3e22.4) 14.7 (9.2e19.8) .01T/OBSA (mm/m) 1.10 (0.90e1.40) 1.01 (0.75e1.21) <.001
Small airway involvement 41 (91) 60 (90)Full inspirationLAA% 16.5 (3.8e28.8) 16.7 (5.1e27.6) NSMLD (HU) !853 (!881 to !722) !853 (!901 to !777) NS
Full expirationLAA% 7.0 (1.5e21.0) 5.1 (0.4e17.9) .002MLD (HU) !771 (!861 to !658) !748 (!847 to !607) .003
E/I ratioLAA% E/I 0.46 (0.18e0.91) 0.33 (0.03e0.67) <.001MLD E/I 0.91 (0.84e0.99) 0.88 (0.72e0.95) <.001
Abbreviations: BSA, body surface area; E, expiration; I, inspiration; LAA%, percentageof low-attenuation area; MLD, mean lung density; NS, not significant; T, airway wallthickness;WA, airway wall area;WA%, airwaywall area corrected as a percentage oftotal wall area.aData are presented as number (percentage) or median (range).
H. Inoue et al. / Ann Allergy Asthma Immunol xxx (2014) 1e7 3
Inoue H, Niimi A, et al. Ann Allergy Asthma Immunol 2014�
Pathophysiological Characteris+cs of Asthma in the Elderly: A Comprehensive Study
�
0.08�
0.05�

Scans at deep inspira?on & deep expira?on at 3 loca?ons as indicated above • LAA% (% of area <-‐ 960 HU) • Mean lung density (MLD, HU) • Exp. and insp. (E/I) ra?o of LAA% & MLD
Scan at deep inspira?on Automa?c analysis of cross-‐sec?on of rt B1
• Total outer area (Ao) • Internal luminal area (Ai) • Wall area (WA); Ao -‐ Ai • %Wall area (WA%); (WA/Ao) × 100
Bifurca?on �4cm above�
4cm below�
Chest CT Measurements�
Luminal area (Ai) �
Wall area (WA: Ao-‐Ai) �
Total airway area (Ao) �
Central Airways (airway dimensions)� Peripheral Airways(air trapping)�
Niimi A et al. AJRCCM 2000 Niimi A et al. AJRCCM 2003
Ueda T, Niimi A et al. J Allergy Ciin Immunol 2006
Absolute thickness (T) �

Inoue H, Niimi A, et al. Ann Allergy Asthma Immunol 2014�
wall thickness (T/OBSA; millimeters per meter)7 at the right apicalsegmental bronchus and right posterior basal segmental bronchus,fromwhich tangential views of the bronchus were available. At fullinspiration, consecutive slices of the 2 bronchi were automaticallymeasured and averaged. To assess air trapping, the percentage oflow-attenuation areas (LAA%; <!960 HU) and mean lung density(MLD) at full inspiration and full expiration were analyzed.9 Theratios of full expiration to full inspiration (E/I ratio) for LAA% andMLD also were evaluated. A higher E/I ratio indicates more prom-inent small airway involvement.9 Spirometrically gated CT,28 whichanalyzes full-inspiratory and full-expiratory lung fields by moni-toring a patient’s spirometric status, was performed in 47 subjects.The other subjects were carefully instructed by technicians tobreathe in deeply for a full inspiration and to breathe outcompletely for a full expiration.9
IOS measurementsRespiratory impedance was measured using a Jaeger Master-
Screen IOS (Jaeger/Toennies, Hochberg, Germany) according tostandard recommendations.29 Rectangular mechanical pulses,including the entire frequency spectrum, were generated andapplied to the subject’s airway through a mouthpiece with a cheeksupport. Impedance measurements included resistances at fre-quencies from 5 to 35 Hz (R5 to R35), reactance at frequencies from
5 to 35 Hz (X5 to X35), and frequency of resonance (Fres), whichrepresents the point at which the usually negative reactance rea-ches 0. AX was defined as the integrated area between 5 Hz andFres. It is assumed that respiratory resistances at 5 Hz (R5) and 20Hz (R20) reflect total airway resistance and large airway resistance,respectively.10
Several previous studies adopted the decrease in resistancefrom 5 to 20 Hz as representing frequency dependency (R5eR20)and X5, AX, and Fres as indices of small airway abnormalities.10e13
The authors previously reported that R5eR20 and AX correlatedwith the conventional parameters of small airway obstruction,namely FEF25-75 and RV/TLC.11 Hence, they used R5eR20, X5, AX,and Fres as indices of small airway disease. To exclude the potentialeffects of age or physique on IOS measurements,30,31 they alsoevaluated the ratio of R5eR20 to R5 ([R5eR20]/R5) as an alterna-tive index of small airway disease.
Table 4Comparison of IOS measurements between elderly and nonelderly patients withasthmaa
Elderly patientswith asthma (>65 y)
Nonelderly patientswith asthma ("65 y)
P value
IOS 25 (56) 53 (79)R5 (kPa ∙ s ∙ L!1) 0.48 # 0.20 0.35 # 0.12 <.001R20 (kPa ∙ s ∙ L!1) 0.34 # 0.10 0.31 # 0.09 NSR5eR20 (kPa ∙ s ∙ L!1) 0.14 # 0.12 0.05 # 0.05 <.001X5 (kPa ∙ s ∙ L!1) !0.23 # 0.15 !0.12 # 0.06 <.001AX (kPa/L) 1.62 # 1.8 0.44 # 0.44 <.001Fres (L/s) 19.6 # 7.9 12.8 # 4.1 <.001(R5eR20)/R5 0.25 # 0.16 0.12 # 0.10 <.001
Abbreviations: AX, integrated area between 5 Hz and frequency of resonance; Fres,frequency of resonance; IOS, impulse oscillation; NS, not significant; R5, resistanceat 5 Hz; R20, resistance at 20 Hz; X5, reactance at 5 Hz.aData are presented as number (percentage) or mean # SD.
Table 5Comparisons of FeNO levels, peripheral blood cell differentials, induced sputum celldifferentials, and AHR between elderly and nonelderly patients with asthmaa
Elderly patientswith asthma(>65 y)
Nonelderly patientswith asthma("65 y)
Pvalue
FeNO 32 (71) 53 (79)FeNO (ppb) 24.6 (5.9e98.6) 26.9 (10.3e110) NS
Induced sputum cell differentials 24 (53) 35 (52)Eosinophils (%) 0.5 (0e32.5) 1.5 (0e54.8) NSNeutrophils (%) 67.0 (32.8e98.5) 59.5 (4e94.3) NS
Inflammatory subtypesb
E/N/P/M 4/8/5/7 13/9/5/8 NSBlood cell differentials 45 (100) 67 (100)Eosinophils (%) 3.6 (0.4e25.9) 3.6 (0.1e25.9) NSNeutrophils (%) 59.9 (37.4e80.8) 56.2 (36.3e82.9) NS
AHR measurements 26 (58) 40 (60)Dmin (U) 3.6 (0.09e50) 8.2 (0.15e50) NSSRrs (cmH2O ∙ L!1 ∙ s!1 ∙ min!1) 1.38 (0.28e5.19) 1.49 (0.39e13.6) NS
Abbreviations: AHR, airway hyperresponsiveness; Dmin, cumulative dose ofmethacholine at inflection point at which respiratory resistance began to increase;E, eosinophilic; FeNO, exhaled nitric oxide; M, mixed granulocytic; N, neutrophilic;NS, not significant; P, pauci-granulocytic; ppb, parts per billion; SRrs, slope ofdoseeresponse curve for methacholine and respiratory resistance.aData are presented as number (percentage) or median (range). For eosinophils andneutrophils, median percentages (range) are listed.bSubjects were classified as having 1 of 4 inflammatory subtypes by induced sputumcell differentials: eosinophilic (eosinophils $1.0%, neutrophils <61%), neutrophilic(eosinophils <1.0%, neutrophils $61%), pauci-granulocytic (eosinophils <1.0%,neutrophils <61%), or mixed granulocytic (eosinophils $1.0%, neutrophils $61%).
Table 6Comparisons of IgE and atopic status between elderly and nonelderly patients withasthmaa
Elderly patientswith asthma (>65 y)
Nonelderly patientswith asthma ("65 y)
Pvalue
Patients 45 (100) 67 (100)Serum total IgE (IU/mL) 91 (5e2,100) 210 (5e8,700) .006$1 positive specific IgE 22 (49) 50 (75) .005Positive rates of individual
specific IgECat dander 2 (4.4) 12 (17.9) .03Dog dander 1 (2.3) 14 (20.9) .005House dust 12 (27.3) 34 (50.8) .01Mites (Dermatophagoides
pteronyssinus)13 (28.9) 34 (50.8) .02
Japanese cedar pollen 9 (20.0) 40 (59.7) <.001Mixed Gramineae pollens 4 (8.9) 16 (23.9) .04Mixed weed pollens 0 (0.0) 5 (7.5) NSMixed molds 1 (2.2) 7 (10.5) NSTrichophyton 5 (11.4) 7 (10.5) NS
Abbreviation: NS, not significant.aData are presented as number (percentage) or median (range).
Table 3Comparison of computed tomographic measurements between elderly andnonelderly patients with asthmaa
Elderly patients withasthma (>65 y)
Nonelderly patientswith asthma ("65 y)
P value
Central airway wallthickness
45 (100) 67 (100)
WA% 61.7 (52.9e70.9) 57.6 (49.0e70.3) <.001WA/BSA (mm2/m2) 16.1 (10.3e22.4) 14.7 (9.2e19.8) .01T/OBSA (mm/m) 1.10 (0.90e1.40) 1.01 (0.75e1.21) <.001
Small airway involvement 41 (91) 60 (90)Full inspirationLAA% 16.5 (3.8e28.8) 16.7 (5.1e27.6) NSMLD (HU) !853 (!881 to !722) !853 (!901 to !777) NS
Full expirationLAA% 7.0 (1.5e21.0) 5.1 (0.4e17.9) .002MLD (HU) !771 (!861 to !658) !748 (!847 to !607) .003
E/I ratioLAA% E/I 0.46 (0.18e0.91) 0.33 (0.03e0.67) <.001MLD E/I 0.91 (0.84e0.99) 0.88 (0.72e0.95) <.001
Abbreviations: BSA, body surface area; E, expiration; I, inspiration; LAA%, percentageof low-attenuation area; MLD, mean lung density; NS, not significant; T, airway wallthickness;WA, airway wall area;WA%, airwaywall area corrected as a percentage oftotal wall area.aData are presented as number (percentage) or median (range).
H. Inoue et al. / Ann Allergy Asthma Immunol xxx (2014) 1e7 3
Inoue H, Niimi A, et al. Ann Allergy Asthma Immunol 2014�
More prominent small airways involvement has been indicated in elderly asthma, from the results of spirometry, CT images, and IOS . �

IOS Provides an Effec+ve Measure of Lung Dysfunc+on in 4-‐Year-‐Old Children at Risk for Persistent Asthma�
Marooa A, et al. J Allergy Clin Immunol 2003
Bronchodilator reversibility of IOS indices may involve diagnos+c value in asthma.�
�� Asthma (n=28) No asthma (n=45) P ΔFEV1 (%) 4.0 (-‐7.0-‐18.0) 6.5 (-‐1.0-‐18.0) .28 ΔFVC (%) 5.0 (-‐7.0-‐13.0) 8.0 (-‐1.0-‐18.0) .13 ΔFEV1/FVC (%) 0 (0-‐2.0) 0 (0-‐0) .18 ΔFEF25-‐75 (%) 48.0 (21-‐65) 33.0 (10-‐50) .15 �� �� �� ��ΔR5 (%) 26.9 (17.1-‐39.2) � 17.0 (9.9-‐32.8) � .02 ΔR10 (%) 23.6 (15.0-‐31.1) � 15.6 (9.7-‐25.4) � .03 ΔX5 (%) 35.8 (21.7-‐48.3) 27.8 (6.1-‐38.7) .09 ΔX10 (%) 46.2 (37.3-‐56.4) 41.0 (12.7-‐51.7) .09 ΔRf (%) 15.2 (8.6-‐26.7) 11.9 (6.3-‐19.7) .25

of 320 mg HFA-BDP daily for 12 weeks had greater benefits on closingvolume, closing capacity, and mid-forced expiratory flow (FEF25–75%)than the addition of 330 mg CFC-fluticasone (MMAD 2.4 mm) daily[10]. Moreover, 4 weeks’ treatment with 200 mg HFA-BDP dailyresulted in greater improvement of air trapping on HRCT assessedafter methacholine inhalation than 200 mg CFC-BDP daily [11].Furthermore, 680 mg HFA-flunisolide (MMAD 1.2 mm) daily for 6weeks attenuated eosinophilic inflammation of large and smallairways as assessed by endobronchial and transbronchial biopsies[12]. However, the differential and progressive effects of ICS on largeand small airways remain poorly known, in part because of meth-odological limitations of previous studies. The invasiveness ofbiopsy and the radiation exposure associated with CT precluderepeated measurements over time. Dose–response studies of ICShave indicated that small airways may require longer-term treat-ment to obtain maximal effect [13], but evidence is lacking [14].
The impulse oscillometry system (IOS) is a non-invasive, effort-independent and thus repeatable measure to assess airwayfunction [15]. IOS has a potential to examine respiratory resistance(R) and respiratory reactance (X) of large and small airwaysseparately [15], and it is more sensitive to therapeutic interventionthan spirometry [16]. Here we compared HFA-BDP and CFC-BDP interms of the progressive effect of 12 weeks’ treatment on pulmo-nary function in asthmatic patients as assessed by IOS. Spirometry,lung volumes, and the two components of airway responsiveness,airway sensitivity and reactivity, were also examined.
2. Materials and methods
2.1. Subjects
We consecutively enrolled 48 ICS-naı̈ve adults with mild-to-moderate asthma, who were referred to our asthma clinic of KyotoUniversity. Asthma was diagnosed according to the AmericanThoracic Society criteria [17]. The patients were lifetimenonsmokers or had smoked <5 pack-years and had quit for >12months. None had a history or abnormal chest X-ray findingssuggestive of concomitant respiratory disease.
This study was approved by the Ethics Committee at ourinstitution, and written informed consent was obtained from allpatients.
2.2. Study design
This was a 12-week, randomized, open-label study to comparethe effects of HFA-BDP (QVAR, Schering-Plough, Tokyo, Japan) andCFC-BDP (ALDECIN, Schering-Plough, Tokyo, Japan). Baseline char-acteristics were assessed during a one-week run-in period duringwhich patients were allowed to use only short-acting b2-agonists.Patients were then randomly assigned to receive either HFA-BDP(400 mg daily) or CFC-BDP (800 mg daily) [18] at a ratio of 2:1 [19].This was due to an ethical reason based on the predominance in theefficacy of HFA-BDP over that of CFC-BDP already shown by severalstudies [20,21]. Other than ICS, on-demand use of b2-agonists waspermitted but was withheld for 6 h before measurements. IOS andspirometry measurements were repeated at 4, 8, and 12 weeks,while lung volume measurement, methacholine challenge andsymptom questionnaires [11] were repeated at 12 weeks (Fig. 1).Pre-bronchodilator lung function values were used for analysis.
2.3. Conventional pulmonary function tests
Forced expiratory volume in one second (FEV1), mid-forcedexpiratory flow (FEF25–75%), peak expiratory flow (PEF), residualvolume (RV), and RV/total lung capacity (TLC) were measured.
2.4. Methacholine challenge
Airway responsiveness was examined by continuous inhalationof methacholine and simultaneous measurement of R (Asto-graph!, Chest, Tokyo, Japan) [22,23]. The parameters of airwaysensitivity (Dmin) and airway reactivity (SRrs) were measuredseparately [7,23].
2.5. Impulse oscillometry system
Respiratory impedance was measured using a JaegerMasterScreen IOS! (Erich Jaeger, Hoechberg, Germany), accordingto standard recommendations [24]. Rectangular mechanicalimpulses containing the whole frequency spectrum were applied tothe respiratory system through a mouthpiece during quietbreathing. The resulting pressure and volume signals were analyzedfor amplitude and phase differences to determine R and X of the totalrespiratory system. Impedance measurements included R and Xfrom 5 to 35 Hz (R5–R35 and X5–X35) and frequency of resonance,which represents the point at which the usually negative reactancereaches 0. Pressure oscillations at frequencies >15 Hz are severelydamped out before reaching peripheral airways, while those atfrequencies <10–15 Hz penetrate much further into the lungperiphery [15]. We used R5, R20, and R5–R20 as indices of total,large, and small airway resistance, respectively [15,25–27]. In addi-tion, integrated area of low-frequency X (AX) was examined asa sensitive measure of small airways obstruction [15,25–27].
The primary outcome of the study was defined as the variationof IOS indices associated with treatment. The secondary outcomeincluded the variation of spirometry indices, lung volume indices,airway responsiveness and symptoms before and after treatment,and correlations of treatment-related changes among variables.Moreover, to confirm the validity of R20, and R5–R20 and AX asmeasures of large and small airways, respectively, correlationsbetween these IOS indices and conventional measures of large(PEF) and small airways (FEF25–75%, RV, and RV/TLC) wereanalyzed.
2.6. Statistical analysis
Values are presented as means (SD) or medians (range).Comparisons between groups were made with the Mann–WhitneyU-test. All paired within-subject data were analyzed using theWilcoxon signed-rank test. Effect of treatment at each time pointwas compared between groups with an unpaired t-test by
Methacholinechallenge
Symptom
questionnaire
Lung volume
Spirometry
IOS
0 12 wk
HFA-BDP
CFC-BDP200 µg bid
400 µg bid
8 wk4 wk
Run inperiod
-1 wk
Fig. 1. Study design. HFA-BDP! hydrofluoroalkane-134a beclomethasone dipropio-nate; CFC-BDP! chlorofluorocarbon-11/12-BDP; IOS! impulse oscillometry system.
M. Yamaguchi et al. / Pulmonary Pharmacology & Therapeutics 22 (2009) 326–332 327
Yamaguchi M, Niimi A et al. Pulm Pharmacol Ther 2009
Effect of Inhaled Cor+costeroids on Small Airways in Asthma: Inves+ga+on Using IOS�
(MMAD* 1.1 μm) *Mass median aerodynamic diameter
(MMAD* 3.5 μm) Mild-to-moderate pts who were inhaled steroid naıve�

examining percent changes from baseline. Relationships amongdata were analyzed with Spearman’s or Pearson’s correlationcoefficients as appropriate. Values were considered significant atp< 0.05.
3. Results
Eight patients (four assigned to receive HFA-BDP) were lost tofollow-up before the end of the 12-week treatment period, and twopatients had asthma exacerbations requiring oral corticosteroidsdue to respiratory infection, both of whom were allocated to receiveHFA-BDP. Therefore, 38 patients were included in the final analysis.
3.1. Baseline characteristics
Baseline characteristics of patients are shown in Table 1. The twotreatment groups did not differ significantly with respect to eitherclinical or functional parameters.
3.2. Correlation between IOS indices and conventionalfunctional measures
Correlations between IOS indices and conventional measures oflarge and small airways were examined in the original 48 patients(Table 2). R20 was moderately correlated with PEF but not withFEF25–75%, RV, or RV/TLC. In sharp contrast, R5–R20 and AX weremoderately correlated with FEF25–75%, RV, and RV/TLC but not withPEF.
3.3. Effect of treatment at 12 weeks
R5 and R20 improved significantly in both groups, but thedegree of improvement did not differ significantly between thetwo treatments. R5–R20 decreased significantly in the HFA-BDPgroup only, while AX improved significantly in both groups. Meanchange from baseline was significantly greater in the HFA-BDPgroup than in the CFC-BDP group for both R5–R20 and AX (Table 3,Fig. 2-1 and -2).
All symptom scores and use of b2-agonists decreased in allpatients, but the degree of improvement was similar betweentreatments (Table 3). FEV1 and FEF25–75% increased significantly inboth groups, but again to similar degrees. Dmin increased signifi-cantly with HFA-BDP and only marginally with CFC-BDP, but thedegree of increase was similar between treatments. The change inthe CFC-BDP group might have failed to reach significance becauseof the smaller sample size. RV, RV/TLC, and SRrs were notsignificantly affected by either treatment.
3.4. Correlations with change of airway sensitivity
Since airway hypersensitivity was significantly attenuated withHFA-BDP treatment, correlations between changes in airwaysensitivity and those in IOS indices were analyzed. In the HFA-BDPgroup, changes in Dmin were negatively correlated with those inAX (Fig. 3) but not those in R5 (r! 0.03, p! 0.91), R20 (r! 0.19,p! 0.37), or R5–R20 (r!"0.22, p! 0.29). No such correlationswere found in the CFC-BDP group for AX (Fig. 3) or other IOS indices(data not shown).
Correlation between changes in Dmin and the baselinecharacteristics of patients were also examined in the HFA-BDPgroup. Significant or marginal relationships were found for baselinevalues of FEV1 (% pred) (r!"0.49, p! 0.015), FEF25"75% (% pred)(r!"0.64, p! 0.0007), RV (% pred) (r! 0.45, p! 0.033), R5(r! 0.47, p! 0.023), R5–R20 (r! 0.71, p< 0.0001), AX (r! 0.72,p< 0.0001), and age (r! 0.39, p! 0.068), but not for R20 (r! 0.09,p! 0.69) or other indices including symptom scores (data notshown).
3.5. Time course of IOS and spirometry indices
Percent changes in spirometry and IOS indices from baseline to4, 8, and 12 weeks are plotted in Fig. 4. The improvement in FEV1,FEF25–75%, and R20 had almost plateaued at 4 weeks in both groups.In contrast, although R5–R20 and AX had almost stabilized at 4weeks in the CFC-BDP group, they continued to improve until 12weeks in the HFA-BDP group. When the two groups werecompared, change of R5–R20 and AX achieved significance at12 weeks but did not at 4 or 8 weeks.
As for within-group analysis, almost all indices of IOS andspirometry improved significantly at 4 weeks in both groups as
Table 1Baseline characteristics of the two treatment groups.
HFA-BDP (n! 26) CFC-BDP (n! 12) p
Female/male 20/6 8/4 0.50Age (years) 43 (18) 46 (19) 0.74Asthma duration (months) 48 (97) 54 (92) 0.66Atopica/non-atopic 19/7 7/5 0.36Symptomsb
Wheeze (0–5) 4 (1–5) 4 (1–5) 0.33Shortness of breath (0–5) 3 (1–5) 4 (0–5) 0.62Sleep disturbance (0–4) 2 (1–4) 3 (0–4) 0.58
b2-agonist use (puffs/day) 2 (0–10) 1 (0–5) 0.93FEV1/FVC (%) 77.8 (9.3) 75.2 (5.4) 0.38FEV1 (% pred) 89.0 (15.5) 85.5 (9.0) 0.48FEF25–75% (% pred) 66.5 (20.5) 69.3 (26.9) 0.53PEF (% pred) 88.6 (21.1) 83.5 (14.6) 0.48RV (% pred) 122.3 (23.8) 135.3 (22.1) 0.12RV/TLC (%) 35.1 (8.6) 32.0 (8.1) 0.32R5 (kPa sL"1) 0.42 (0.17) 0.42 (0.11) 0.48R20 (kPa sL"1) 0.34 (0.11) 0.34 (0.08) 0.51R5–R20 (kPa sL"1) 0.09 (0.09) 0.08 (0.05) 0.66AX (kPa L"1) 0.85 (1.15) 0.63 (0.52) 0.51Dmin (units) 4.4 (10.0) 6.2 (14.6) 0.92SRrs (cmH2O/L/s/min) 1.82 (1.01) 1.77 (1.20) 0.78
a Atopy was defined by the presence of specific serum IgE antibodies against atleast one common inhalant allergen.
b The symptom questionnaire included wheeze and shortness of breath on a scaleof 0 (none) to 5 (symptoms very severe and interfering with normal daily activities)and sleep disturbance caused by nocturnal asthma symptoms on a scale of 0 (none)to 4 (asthma preventing sleep). HFA-BDP! hydrofluoroalkane-134a beclometha-sone dipropionate; CFC-BDP! chlorofluorocarbon-11/12-BDP; FEF25–75%!mid-forced expiratory flow; PEF! peak expiratory flow; RV! residual volume;TLC! total lung capacity; R5! respiratory resistance at 5 Hz; R20! respiratoryresistance at 20 Hz; AX! integrated area of low-frequency reactance;Dmin! cumulative dose of inhaled methacholine at the inflection point at whichrespiratory resistance begins to increase (a marker of airway sensitivity);SRrs! slope of the methacholine-respiratory resistance dose–response curve(a marker of airway reactivity).
Table 2Correlation coefficients between IOS indices (R20, R5–R20, and AX) and spirometryand lung volume indices of large and small airways.
PEF (L/s) FEF25–75% (L/s) RV (L) RV/TLC (%)
R20 (kPa sL"1) "0.52z "0.23 0.08 0.13R5–R20 (kPa sL"1) "0.26 "0.40* 0.51z 0.49yAX (kPa L"1) "0.24 "0.44* 0.49y 0.42*
PEF! peak expiratory flow; FEF25–75%!mid-forced expiratory flow; RV! residualvolume; TLC! total lung capacity; R20! respiratory resistance at 20 Hz;R5! respiratory resistance at 5 Hz; AX! integrated area of low-frequencyreactance.Data were obtained from the baseline measurements of the original 48 patients.*p< 0.005, yp< 0.001, and zp< 0.0005. Significant results are presented in boldface.
M. Yamaguchi et al. / Pulmonary Pharmacology & Therapeutics 22 (2009) 326–332328
Yamaguchi M, Niimi A et al. Pulm Pharmacol Ther 2009

BDP-‐HFA 400μg
�
BDP-‐CFC 800μg Before 12 wks�
Effect of Small Par+cle ICS on Small Airways (AX of IOS)�
-‐1.2
-‐0.8
-‐0.4
0
0.4
0.8
1
-‐1.2
-‐0.8
-‐0.4
0
0.4
0.8
1
p=0.048 p=0.007 p<0.0001
(Log (kPa L-‐1))
Yamaguchi M, Niimi A et al. Pulm Pharmacol Ther 2009
Before 12 wks�

Effect on FEV1�p=0.71
p=0.042
1
1.5
2
2.5
3
3.5
4
4.5 (L) p=0.006
1
1.5
2
2.5
3
3.5
4
4.5 (L)
BDP-‐HFA 400μg
�
BDP-‐CFC 800μg Before 12 wks� Before 12 wks�

Pre 4W 8W 12W
R5-‐R20
-‐60
-‐40
-‐20
0
10 (%)
p=0.03
p=0.08 p=0.17
R20
-‐20
-‐15
-‐10
-‐5
0
Pre 4W 8W 12W
(%)
p=0.86 p=0.71 p=0.67
Pre 4W 8W 12W
R5
-‐20
-‐15
-‐10
-‐5
0
(%)
p=0.63 p=0.78
p=0.38
AX
-‐50
-‐40
-‐30
-‐20
-‐10
0
Pre 4W 8W 12W
(%)
p=0.007
p=0.31 p=0.14
Pre 4W 8W 12W 0
10
20
30
40
50 FEV1 (%)
p=0.76 p=0.45
p=0.43
Pre 4W 8W 12W 0
10
20
30
40
50 (%)
MMF
p=0.14 p=0.13 p=0.14
Serial Changes of IOS and Spirometry�
HFA-‐BDP CFC-‐BDP
Yamaguchi M, Niimi A et al. Pulm Pharmacol Ther 2009

Summary of IOS Ø Very simple to perform and easily repeatable
Ø No special breathing or co-‐opera?on necessary Ø Peripheral and central resistance separated Ø More responsive to interven?on (e.g. bronchodilators and inhaled steroids) than spirometry
Ø May be more specifically useful for assessing small airway for pathophysiological relevance and treatment responsiveness
How to Assess Small Airways? • Autopsy or lung resec+on • Transbronchial lung biopsy (TBLB) • Bronchoalveolar lavage (BAL)
• Spirometry: FEF25-‐75%, MEF25 • Lung volumes: RV, RV/TLC • Closing volume
• CT images (air trapping) • Later phase component of induced sputum • Impulse oscillometry (IOS) • Alveolar/small airway component of exhaled NO (FeNO)

FeNO Measurement
For NIOX MINOTM marketed in Japan, only fixed flow (50 ml/s ) is available. �
�
Variable flows available�
• Simple and noninvasive way to assess allergic inflamma?on • Useful for asthma diagnosis and management • Standard flow is 50 ml/s (FeNO50) • Alveolar NO (CANO) requires NO measurement at addi?onal different higher (100 – 300 ml/s) flow(s): NO measured at higher flows reflects rela?vely more of alveolar than central airway NO which may be bypassed �
Trumpet model considering axial back diffusion*
Kerckx et al. J Appl Physiol 2008 Condorelli et al. J Appl Physiol 2007
松本 久子 761
図 1. Two compartment model に基づく単位時間(s)あたりの呼気NOの動態(左図)とCANO算出法(右図).
CANO×V・
気道壁から産生されるNO量/sJawNO=J’awNO(nl/s),高呼出フロー時
呼出NO量/s=CENO×V・
肺胞領域から産生されるNO量/s
呼出フロー(V・), /secl
q・=J’awNO+CANO×V・
(高呼出フロー時)
0.2 0.4 0 0.6
nl/sec
q・ (呼出NO量)
J’awNO
おいて,BAL中好酸球比率 10)や好酸球陽イオン蛋白質値 11)との相関も示されており,現在ではCANOが好酸球性末梢気道炎症の間接的指標の代表として位置づけられる.尚,従来CANOの算出に はTsoukias と George に よ る two compart-ment model1)12)が主に用いられてきたが,2007 年にトランペット型拡散モデルによる補正法 13)14)が報告され,後者で算出された補正CANOが真の末梢気道・肺胞領域の好酸球性炎症の間接的指標と認識されている.本稿では喘息と関連疾患の診療における呼気中
NO肺胞成分測定の有用性について,モデルの原理にも触れながら概説する.
呼気中NO肺胞成分の算出法
1)Two compartment model(図 1)i)Tsoukias らのモデル 1)12)
1998 年 Tsoukias と George は,①息こらえにより口元でのNO濃度(FeNOと同義であるが,原著に従いCENOと記す)(ppb)が急激に上昇する,②CENOは呼出フロー(!,ml"s)が速い程低い,③単位時間あたりに呼出されるNO量(原著ではENOだが#,nl"s と記す)はCENO×!で示される,といった事象から,呼気中のNOが中枢気道と末梢気道・肺胞領域由来のNOから構成される
と推定し,呼気NOの動態をシミュレートするモデルを報告した.すなわち呼出NOは末梢にやや広がりのある筒状の気道由来NOと,容量可変性のある末梢気道・肺胞領域由来のNOからなるとする two compartment model である.呼出NO量(#)はCENO×!で示されるが,
two compartment model に基づくと,#は気道壁由来のNO量(JawNO,pl"s)と肺胞領域で産生されるNO量の和でもある.JawNOは呼出フローが 100ml"s 以上の場合,その最大値であるJ’awNOで平衡に達する.また肺胞領域で単位時間あたりに産生されるNO量は CANOと!の積であり,高呼出フロー下では,#=J’awNO+CANO×! (1)
が成り立つ.従ってCANOを得るには,100ml"s以上の複数のフローでCENOを得,!を x軸に,#(=CENO×!)を y軸にとってプロットし,複数のプロットが載る直線を求めればよい.直線の傾きがCANOで,その切片が J’awNOに相当する(図 1).50ml"s の フ ロ ー で 測 定 し たCENO(FeNO50)の 50%以上は中枢気道壁由来のNOを反映し,J’awNOと強い相関がある.尚,Sievers社などの固定NO測定装置では口元の抵抗を変えることで呼出フローの変更が可能だが,携帯機器であるNIOXMINOⓇでの測定は 50ml"s に限定
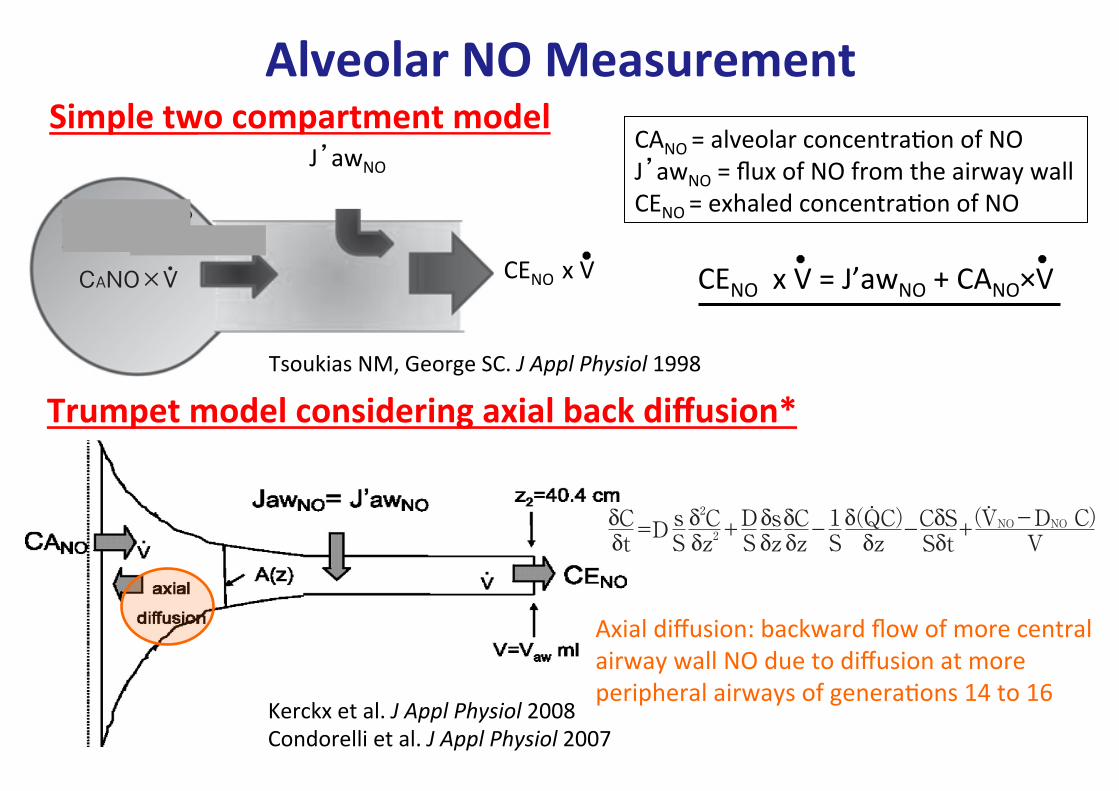
Alveolar NO Measurement�Simple two compartment model
J’awNO
CENO x V �
Tsoukias NM, George SC. J Appl Physiol 1998�
CANO = alveolar concentra?on of NO J’awNO = flux of NO from the airway wall CENO = exhaled concentra?on of NO
Axial diffusion: backward flow of more central airway wall NO due to diffusion at more peripheral airways of genera?ons 14 to 16 �
CENO x V = J’awNO + CANO×V �松本 久子 763
拡散がある場合,FeNOは低下しCANOは見かけ上高くなることが示された.彼らは 50ml!s 以上のフローを許容し,補正CANO算出の簡易式として(CANO-0.08×FeNO)!0.92 を提唱している.
δCδt
δ(QC)δz
(VNO-DNO C)V
CδSSδt
δ2Cδz2
sS
1S
δsδz
δCδz
DS=D + +- -
..
Condorelli ら 14)は定常状態での対流・拡散方程式を,対流と拡散の比率や短・長軸方向の拡散の比率などを用いて解いている.Condorelli らが提示する補正式の内,100―250ml!s 内の複数フローで測定する式が最も当てはまりがよく(r2=0.98),補正 CANO=傾き-切片!740 で算出される.ここで傾き,切片はTsoukias らのモデルの直線の傾き,切片である.Kerckx らのモデル,CondorelliらのモデルともFeNOの 6から 8%が CANOに混入するとし 14),両モデルで算出される補正CANO値はほぼ同等とされる 18).
喘息関連疾患における呼気中NO肺胞成分
1)喘息i)呼気中肺胞成分NO濃度と病態との関係A)補正前CANO(以後 CANOと略す)2001 年 Lehtimäki らは吸入ステロイド(inhaled
corticosteroids;ICS)未治療喘息例のCANOは健常人と差がなく,CANOよりも中枢気道壁由来NO産生量(J’awNO)が喘息病態を反映すると報告した 19)が,翌年には夜間喘息例において,日中に評価したCANOが健常人よりも上昇していることを報告した 20).その後,ICS 治療下喘息例,特に難治例で健常人に比しCANOが上昇し,経口ステロイド投与により減少することが示される 10)21)
など,喘息の重症化にCANO高値で表される末梢気道炎症が関与し,ICS 治療下でも同部に炎症が残存することが明らかにされた.2006 年 Gelb らは中等量の ICS と長時間作用型気管支拡張薬(long acting be-ta2 agonist;LABA)で安定している喘息 44 例について,18 カ月間に生じる増悪の予測因子を前向きに検討し,一秒量低下と独立して,FeNOの上昇とCANOの上昇が増悪のリスクになることを示した 22).ICS と LABAによる治
療下でもCANO高値例は 20%に存在する 23).CANOを求めることで末梢気道炎症優位型のフェノタイプや末梢気道炎症残存例を検出でき,治療介入に役立つ可能性がある.非侵襲的に求められるCANOは,小児喘息の末
梢気道炎症の把握に特に有用である.CANOは小児喘息例のコントロール状態を反映し 24),有症状の軽症例では無症状例と比べ,中間呼気流量や一秒量は同等でも,有意にCANOが高い 25).運動誘発性喘息例では非誘発性喘息例や健常例に比し有意にCANOが高く,CANOが高い程,運動負荷時の末梢気道径の変化が大きい 26).CANOと生理学的指標との関係をみると,成人
喘息においてCANOは不均等換気の指標である⊿N2と相関し,特に重症例では機能的残気量や残気率と強い相関がある 27).不均等換気は,多呼吸洗い出し法により conducting airway 領域の不均等換気(Scond)と肺胞領域の不均等換気(Sacin)に分けて評価できる.Verbanck らは安定期の成人喘息例,特に中から高用量 ICS治療下例においてCANOが Sacin と相関することを示し,末梢気道における炎症と機能異常の関係を明らかにした 18).小児喘息例では,CANOは中間呼気流量と相関し 11),成人気道との解剖学的・生理学的な差異を反映するのか,Scond・Sacin の両者と相関する 28).小児重症喘息例で胸部CT上の気道壁の厚さを
評価した検討では,壁厚は J’awNOと相関するもののCANOとの相関は認めない 29).B)補正 CANOCANOと対照的に,現時点では成人喘息例での
補正CANOは健常人と差がなく 14)重症度との関連もみられない 7).小児喘息 107 例・成人喘息 93例を検討した多施設研究にて,補正CANOと喘息コントロール状態の間に関連はなかった 30).筆者らの検討でも,治療下安定期喘息例において,補正CANOは末梢気流閉塞や⊿N2と相関するものの重症度や喘息コントロール状態との関連は認めていない(第 61 回日本アレルギー学会秋季学術大会で発表).2010 年 Gelb らは,成人喘息 15 例の増悪前後の検討で,CANOや補正 J’awNOは増悪と

Baseline data ���%FEV1 -‐0.18 -‐0.03 -‐0.12 ���%FEF25-‐75% -‐0.09 -‐0.05 -‐0.10 ���R20 0.22 -‐0.17 -‐0.05 ���R5-‐R20 0.35† -‐0.09 0.11 ���X5 -‐0.31* -‐0.05 -‐0.19 ���AX 0.35† -‐0.03 0.14 Reversibility with β-‐agonist ���ΔFEV1 0.35† -‐0.01 0.09 ���ΔFEF25-‐75% 0.31* 0.09 0.21 ���ΔR20 -‐0.23 -‐0.01 -‐0.01 ���Δ(R5-‐R20) -‐0.22 0.05 0.01 ���ΔX5 -‐0.24* -‐0.16 -‐0.25* ���ΔAX -‐0.31* -‐0.16 -‐0.10
CANO(TMAD) �J’awNO FeNO50
*p≤0.05, † p<0.01 CANO(TMAD)=CANO considering back diffusion
Matsumoto H, Niimi A et al. Respira=on 2011
Correla+on Coefficients between FeNO and Lung Func+on Indices 一A Study of 70 Stable Asthma+cs一�

Clinical Paserns in Asthma Based on Proximal and Distal Airway Nitric Oxide Categories
• 179 pediatric asthma (10 [6-‐17] yo) classified by J’awNO and CANO
• FEV1 was equivalent among 4 grps • ACT (Asthma Control Test) was sig. worse in grps III & IV vs I & II • Asthma related risks (exacerba?ons or admissions) were also sig. worse in grps III & IV
Conclusions: Ø Small airways inflamma+on is associated with poor asthma control. Ø Phenotyping with the FeNO categories may be relevant.
Puckeo et al. Respir Res 2010
n=27
n=19
n=66
n=67

Wilcoxon signed-rank test was used, as appropriate. To assess as-sociations between variables, Pearson or Spearman correlationcoefficients were determined, as appropriate. P values less than .05were considered significant.
For detailed information, see the Methods section in this arti-cle’s eMethods.
Results
Patient Characteristics
Thirty-one adult patients with severe refractory asthma wereenrolled. Six of these patients were enrolled in the authors’ previousstudy.25 All patients completed 16weeks of treatment. Atweek 16, 3patients preferred to discontinue treatment, and at week 32, 1 pa-tient preferred to discontinue andanother patientwas lost to follow-up. Thus, 26 patients completed 48 weeks of treatment (Fig 1). Thebaseline characteristics of these 31 patients are listed in Table 1. Allpatients had poorly controlled asthma (mean ACQ score 2.0 ! 1.0)despite receiving very high-dose ICS and concomitant controllermedications (Table 1). High-dose ICS was delivered with 2 differentdevices for 21 patients. Of the 31 patients, 26 (84%) had allergicrhinitis, 12 (39%) had chronic rhinosinusitis, 11 (35%) had gastro-esophageal reflux, and 10 (32%) had psychological disorders. Psy-chological disorders were diagnosed and optimally treated bypsychiatrists. Of the 10 patients with psychological disorders, 7 pa-tientswere diagnosedwith depression, 2with panic disorders, and 1with hyperventilation syndrome.
There were no differences in clinical characteristics among the26 patients who completed the 48 weeks of treatment and the 5patients who discontinued treatment (P > .10 for all comparisons;data not shown).
Not all patients could complete eNO measurements, pulmonaryfunction, methacholine airway hyperresponsiveness, inducedsputum, and CT measurements because of impaired pulmonaryfunction, dyspnea, or difficulty with breath holding (Table 1).
Questionnaire Scores
With omalizumab treatment, health status and asthma controlsignificantly improved (Table 2). For the 26 patients who completed48 weeks of treatment, SGRQ scores in all 3 domains (symptoms,activities, and impact) and total scores, AQLQ scores in all 4
Figure 1. Flowchart for study patients.
Table 1Baseline patient characteristics and medication use (n " 31)a
Age (y) 55 ! 16Men/women 10/21Body mass index (kg/m2) 25.0 ! 5.3Total serum IgE (IU/mL) 102 (5e660)Duration of asthma (y) 16.2 ! 13.9Never smoker/ex-smoker 18/13FEV1 (% predicted) 93.5 ! 23.6Exacerbation in previous yearUnscheduled physicians visits (d) 8.4 ! 20.4Events requiring systemic corticosteroids for #3 d (times) 5.7 ! 8.7Hospitalization (times) 0.5 ! 1.3
Sputum eosinophil proportions (%) 8.3 ! 16.9Sputum neutrophil proportions (%) 61.4 ! 26.0Dmin (units) 4.5 ! 6.4SRrs (cmH2O/L/s/min) 1.6 ! 1.2Inhaled corticosteroid dose (mg/d)b 1,432 ! 581Concomitant controller medicationsLong-acting b2 agonistsc 30 (97)Leukotriene receptor antagonists 31 (100)Sustained-release theophylline 24 (77)Antiallergic medications other than leukotriene
receptor antagonists19 (61)
Long-acting anticholinergics 16 (52)Oral corticosteroids 9 (29)Oral corticosteroid dose (mg/d)d 8.4 ! 7.8Mean number of concomitant medications 3.9 ! 1.0
Patients who completed each testExhaled NO analysis 27 (87)Pulmonary function 29 (94)Methacholine airway hyperresponsiveness 17 (55)Induced sputum 26 (84)Computed tomography 21 (68)
Abbreviations: Dmin, cumulative dose of inhaled methacholine at inflection pointwhere respiratory resistance begins to increase; FEV1, forced expiratory volume in 1second; NO, nitric oxide; SRrs, slope of methacholine and respiratory resistancedoseeresponse curve.aValues are presented as mean ! SD, median (range), or number (percentage).bEquivalent to fluticasone propionate.cOne patient could not use a long-acting b2 agonist because of side effects.dEquivalent to prednisolone.
Table 2Changes from baseline and 16 weeks in SGRQ, AQLQ, and ACQ scoresa
Questionnaireand domain
Baseline(n " 31)
Baselinevs 16 wk(n " 31)
16 vs 48 wk(n " 26)
Baselinevs 48 wk(n " 26)
SGRQSymptoms 65.7 ! 24.1 $10.08b $12.45c $22.49d
Activities 51.6 ! 27.8 $4.31 $12.04b $14.41d
Impact 40.6 ! 23.4 $9.81c $9.70c $19.08d
Total 48.1 ! 23.1 $4.88b $14.81c $18.24d
AQLQSymptoms 4.3 ! 1.6 0.97d 0.66c 1.74d
Activities 4.1 ! 1.4 0.59b 0.48c 1.07d
Emotions 4.4 ! 1.6 0.86c 0.42b 1.29d
Environment 4.5 ! 1.7 0.62b 0.47b 1.09d
Overall 4.2 ! 1.4 0.81c 0.50b 1.36d
ACQTotal 2.0 ! 1.0 $0.62c $0.37b $1.11d
Abbreviations: ACQ, Asthma Control Questionnaire; AQLQ, Asthma Quality of LifeQuestionnaire; SGRQ, St George’s Respiratory Questionnaire.aValues at baseline are presented as mean ! SD. Values at 16 and 48 weeks areaverage changes in score from baseline values.bP < .05 compared with baseline by paired t test.cP < .01 compared with baseline by paired t test.dP < .001 compared with baseline by paired t test.
T. Tajiri et al. / Ann Allergy Asthma Immunol xxx (2014) 1e6 3
Comprehensive Efficacy of Omalizumab for Severe Refractory Asthma: a Time-‐ Series Observa+onal Study�
Tajiri T, Niimi A et al. Ann Allergy Asthma Immunol 2014�
・31 pts with refractory asthma ・Various clinical indices examined at baseline and at 16 wks and 48 wks of omalizumab �

domains (symptoms, environment, emotions, and activities) andoverall scores, and ACQ total scores significantly and continuouslyimproved throughout the 48 weeks. In addition, clinically benefi-cial improvements were achieved in the SGRQ (!"4 points),15
AQLQ (#0.5 points),16 and ACQ (!"0.5 points),17 even at 16weeks, and these improved further at 48 weeks.
Asthma Exacerbation Rates
Rates of unscheduled physician visits (Fig 2A) and asthma ex-acerbations that required systemic corticosteroids for at least 3days (Fig 2B) significantly decreased during the 48 weeks oftreatment compared with these rates during the 48 weeks beforetreatment. Rate of hospitalization tended to decrease from 0.4$ 0.9times during the 48 weeks before treatment to 0.2 $ 0.8 timesduring the 48 weeks of treatment (P % .06).
eNO levels
The FeNO50 and CANO levels were measured repeatedly for 24and 18 patients, respectively, throughout the 48weeks of treatmentwith omalizumab. The FeNO50 levels decreased significantly from50.2 $ 60.1 ppb at baseline to 35.9 $ 41.7 ppb at 16 weeks and to31.4 $ 28.4 ppb at 48 weeks (P % .0003 and .031, respectively, bypaired t test; Fig 3A). The CANO levels did not change much (4.3 $2.9 ppb at baseline to 4.0 $ 5.0 ppb at 16 weeks) but decreasedsignificantly to 3.2 $ 3.0 ppb at 48 weeks (P % .023 by paired t test;Fig 3B).
Pulmonary Function and Methacholine Challenge
For the 26 patients who completed the 48 weeks of treatment, 6discontinued daily PEF monitoring, 1 patient could not performpulmonary function tests, and 12 could not perform amethacholinechallenge.
The PEF values in the morning and evening improved signifi-cantly from 341 $ 127 and 344 $ 124 L/min, respectively, at base-line to 373$134 and 376$ 132 L/min at 16 weeks and to 398$ 129and 398 $ 129 L/min at 48 weeks (P < .01 for all comparisons bypaired t test; Fig 4). The difference in PEF values from 16 to 48weeks was significant for the evening measurements (P % .031),whereas it was marginal for the morning measurements (P % .054).
Vital capacity improved significantly from baseline to 16 weeks(P % .041 by paired t test). VC, FEV1, FEF25-75, nitrogen single-breathwashout curve, R5, and R20 tended to improve at 48 weeks
compared with baseline values (.05 < P< .10 for all comparisons bypaired t test; Table 3).
Methacholine airway sensitivity described by Dmin changedfrom 12.5 $ 18.8 units at baseline to 17.4 $ 19.0 units at 16 weeksand to 19.7 $ 21.2 units at 48 weeks, although these changes werestatistically insignificant (P > .10 for the 2 comparisons by paired ttest). Airway reactivity did not change (data not shown).
Induced Sputum Results
Sputum eosinophil proportions decreased insignificantly from8.3 $ 16.9% at baseline to 3.5 $ 6.0% at 16 weeks (n % 23, P > .10 bypaired t test) but decreased significantly to 5.1 $ 8.3% at 48 weeks(n % 22, P % .048 by paired t test). Sputum neutrophil proportionsdid not change (data not shown).
CT Analysis
Of the 26 patients who completed 48 weeks of treatment, 17underwent CT measurements. For 3 patients, airway dimensionswere not analyzed because a tangential view of the apicalsegmental bronchus of the right upper lobewas not available owingto variations in airway branching. WA% decreased significantlyfrom 62.0 $ 7.2% at baseline to 57.1 $ 6.2% at 48 weeks (P % .002by paired t test; Table 4). The WA/body surface area (BSA) ratiotended to decrease. The Ai/BSA ratio increased significantly from
Figure 2. Changes from 48 weeks before treatment to 48 weeks after treatment in(A) the rate of unscheduled physician visits and (B) the rate of asthma exacerbationsthat required systemic corticosteroids for at least 3 days. Each point represents asingle patient and values indicate means.
Figure 3. Changes from baseline to 48 weeks of treatment in (A) fractional exhalednitric oxide at 50-mL/s levels and (B) alveolar nitric oxide levels. *P < .05, **P < .01compared with baseline values. Values and bars indicate means and SDs.
Figure 4. Changes from baseline to 48 weeks of treatment in peak expiratory flowvalues in themorning and evening. **P< .001 comparedwith baseline values. Valuesand bars indicate means and SDs.
T. Tajiri et al. / Ann Allergy Asthma Immunol xxx (2014) 1e64
Tajiri T, Niimi A et al. Ann Allergy Asthma Immunol 2014�
PEF Values�

domains (symptoms, environment, emotions, and activities) andoverall scores, and ACQ total scores significantly and continuouslyimproved throughout the 48 weeks. In addition, clinically benefi-cial improvements were achieved in the SGRQ (!"4 points),15
AQLQ (#0.5 points),16 and ACQ (!"0.5 points),17 even at 16weeks, and these improved further at 48 weeks.
Asthma Exacerbation Rates
Rates of unscheduled physician visits (Fig 2A) and asthma ex-acerbations that required systemic corticosteroids for at least 3days (Fig 2B) significantly decreased during the 48 weeks oftreatment compared with these rates during the 48 weeks beforetreatment. Rate of hospitalization tended to decrease from 0.4$ 0.9times during the 48 weeks before treatment to 0.2 $ 0.8 timesduring the 48 weeks of treatment (P % .06).
eNO levels
The FeNO50 and CANO levels were measured repeatedly for 24and 18 patients, respectively, throughout the 48weeks of treatmentwith omalizumab. The FeNO50 levels decreased significantly from50.2 $ 60.1 ppb at baseline to 35.9 $ 41.7 ppb at 16 weeks and to31.4 $ 28.4 ppb at 48 weeks (P % .0003 and .031, respectively, bypaired t test; Fig 3A). The CANO levels did not change much (4.3 $2.9 ppb at baseline to 4.0 $ 5.0 ppb at 16 weeks) but decreasedsignificantly to 3.2 $ 3.0 ppb at 48 weeks (P % .023 by paired t test;Fig 3B).
Pulmonary Function and Methacholine Challenge
For the 26 patients who completed the 48 weeks of treatment, 6discontinued daily PEF monitoring, 1 patient could not performpulmonary function tests, and 12 could not perform amethacholinechallenge.
The PEF values in the morning and evening improved signifi-cantly from 341 $ 127 and 344 $ 124 L/min, respectively, at base-line to 373$134 and 376$ 132 L/min at 16 weeks and to 398$ 129and 398 $ 129 L/min at 48 weeks (P < .01 for all comparisons bypaired t test; Fig 4). The difference in PEF values from 16 to 48weeks was significant for the evening measurements (P % .031),whereas it was marginal for the morning measurements (P % .054).
Vital capacity improved significantly from baseline to 16 weeks(P % .041 by paired t test). VC, FEV1, FEF25-75, nitrogen single-breathwashout curve, R5, and R20 tended to improve at 48 weeks
compared with baseline values (.05 < P< .10 for all comparisons bypaired t test; Table 3).
Methacholine airway sensitivity described by Dmin changedfrom 12.5 $ 18.8 units at baseline to 17.4 $ 19.0 units at 16 weeksand to 19.7 $ 21.2 units at 48 weeks, although these changes werestatistically insignificant (P > .10 for the 2 comparisons by paired ttest). Airway reactivity did not change (data not shown).
Induced Sputum Results
Sputum eosinophil proportions decreased insignificantly from8.3 $ 16.9% at baseline to 3.5 $ 6.0% at 16 weeks (n % 23, P > .10 bypaired t test) but decreased significantly to 5.1 $ 8.3% at 48 weeks(n % 22, P % .048 by paired t test). Sputum neutrophil proportionsdid not change (data not shown).
CT Analysis
Of the 26 patients who completed 48 weeks of treatment, 17underwent CT measurements. For 3 patients, airway dimensionswere not analyzed because a tangential view of the apicalsegmental bronchus of the right upper lobewas not available owingto variations in airway branching. WA% decreased significantlyfrom 62.0 $ 7.2% at baseline to 57.1 $ 6.2% at 48 weeks (P % .002by paired t test; Table 4). The WA/body surface area (BSA) ratiotended to decrease. The Ai/BSA ratio increased significantly from
Figure 2. Changes from 48 weeks before treatment to 48 weeks after treatment in(A) the rate of unscheduled physician visits and (B) the rate of asthma exacerbationsthat required systemic corticosteroids for at least 3 days. Each point represents asingle patient and values indicate means.
Figure 3. Changes from baseline to 48 weeks of treatment in (A) fractional exhalednitric oxide at 50-mL/s levels and (B) alveolar nitric oxide levels. *P < .05, **P < .01compared with baseline values. Values and bars indicate means and SDs.
Figure 4. Changes from baseline to 48 weeks of treatment in peak expiratory flowvalues in themorning and evening. **P< .001 comparedwith baseline values. Valuesand bars indicate means and SDs.
T. Tajiri et al. / Ann Allergy Asthma Immunol xxx (2014) 1e64
Tajiri T, Niimi A et al. Ann Allergy Asthma Immunol 2014�
FeNO Values �FeNO50� CANO �

12.0 ! 6.1 mm2/m2 at baseline to 12.1 ! 4.0 mm2/m2 at 48 weeks(P" .025 by paired t test). The Ao/BSA ratio did not changewith thistreatment. The decrease in WA% was significantly associated withthe decrease in FeNO50 levels (r " 0.52, P " .003) and sputumeosinophil proportions (r" 0.40, P" .026). Similarly, the increase inthe Ai/BSA ratio was significantly associated with the decrease inFeNO50 levels (r " #0.42, P " .019) and sputum eosinophil pro-portions (r " #0.39, P " .031).
Parameters of lung density did not change with this treatment(Table 4).
Discussion
To the best of the authors’ knowledge, this is the first compre-hensive study to demonstrate that omalizumab exerts anti-inflammatory effects on small airways in addition to its severalknown clinical effects. In addition, the authors showed that a longerterm (48 weeks) of omalizumab treatment reversed remodeledairways in parallel with a decrease in airway eosinophilic inflam-mation in patients with the most severe asthma.
Omalizumab has various clinical and anti-inflammatory effectsin patients with asthma. Omalizumab treatment has been found tosignificantly decrease asthma exacerbations and asthma medi-cations3e5 and improve AQLQ scores4,5 and spirometric indices.3,5
Its use also has been found to decrease FeNO levels26 and sputumor bronchial tissue eosinophils,6 all of which reflect inflammationof relatively large airways. In agreement with these studies, theauthors confirmed the improvements of several indices, includingAQLQ scores, FeNO50 levels, and sputum eosinophil proportions.Moreover, the authors demonstrated a significant decrease in CANOlevels, which reflect inflammation of small airways and alveolarregions.18 Therefore, the present study’s findings suggest thatomalizumab may have at least anti-inflammatory effects on smallairways and alveolar regions in addition to large airways, whichcould be clinically relevant because small airways are consideredimportant targets for managing severe asthma.24,27
Airway remodeling is one of the cardinal features of asthma.Conventional therapies, including ICS, are not generally consideredto consistently reverse the remodeled airway. Several studies haveshown that high-dose ICS attenuates basement membrane thick-ening28 or vascularity,29 mostly in mild to moderate asthma.However, there are conflicting results.30 Moreover, the effects of ICSon airway-wall thickening are limited in long-standing asthma.10
Immunoglobulin E is central to allergic airway inflammation thatis associatedwith airway remodeling. Therefore, omalizumabwouldbe expected to reverse airway remodeling.11 However, there havebeen only a few reports on the effects of omalizumab on airwayremodeling or airway-wall thickening.12,13 In a bronchial biopsystudy, the thickness of the reticular basement membrane wasdecreased after a year of treatment with omalizumab in patientswith severe asthma on ICS (1,781.82 ! 532.58 mg/d; inhalers notspecified) and long-acting b2 agonists (n " 11).12 In another study,airway-wall thickening as assessed byCTwas significantly decreasedby as soon as 16 weeks in patients who were treated with ICS (791.4! 246.4 mg/d of fluticasone propionate equivalent), long-acting b2agonists, and other asthma medications (n " 14).13 In the latterstudy, FEV1markedly improved (1.32! 0.60 to 1.53! 0.56 L, P< .05).
In the present study, airway-wall thickening as assessed by CTdecreased at 48 weeks (but not at 16 weeks) of omalizumabtreatment in patients with more severe asthma on higher-dose ICS(1,432 ! 581 mg/d of fluticasone propionate equivalent) and moreconcomitant controller medications (mean number 3.9 ! 1.0) thanthose in the previous 2 studies.12,13 Considering that mean PEFvalues continuously improved throughout the 48 weeks of treat-ment, the decrease in airway-wall thickening with omalizumabmay have gradually occurred throughout the 48 weeks in thepresent study. Intervention studies of ICS treatment have shownthat spirometric parameters usually reach maximal improvementswithin a fewmonths, whereas attenuation of airway remodeling asexamined by bronchial biopsy (ie, reticular basement membranethickening) can take up to 1 year.28 The latter finding is consistentwith the present CT findings. This suggests that there may beimprovements in airway remodeling and in airway inflammationwith omalizumab. The degree of airway-wall thickening (WA/BSA " 18.6 ! 8.2 mm2/m2) in the present study was comparable tothat (19.9! 5.0 mm2/m2) in patients with severe persistent asthmain the authors’ previous study,8 but it was much greater than that
Table 4Effects of omalizumab on computed tomographic indicesa
Time points
Baseline 16 wkb 48 wk P valuec
Airway dimensions 21 21 14WA (mm2) 30.3 ! 12.6 29.5 ! 12.5 26.0 ! 7.6 .09WA/BSA (mm2/m2) 18.6 ! 8.2 18.1 ! 7.9 11.0 ! 3.3 .09WA% 62.0 ! 7.2 60.6 ! 7.3 57.1 ! 6.2 .002Ao (mm2) 49.7 ! 21.7 48.9 ! 21.5 45.6 ! 13.1 .51Ao/BSA (mm2/m2) 30.6 ! 13.8 30.1 ! 13.5 27.9 ! 7.2 .54Ai (mm2) 19.5 ! 9.8 19.4 ! 9.9 19.6 ! 6.6 .024Ai/BSA (mm2/m2) 12.0 ! 6.1 12.0 ! 6.2 12.1 ! 4.0 .025
Lung density 24 24 17LAA% of inspiratory
scans22.2 ! 7.6 22.4 ! 6.5 24.8 ! 5.1 .07
LAA% of expiratoryscans
9.8 ! 4.9 10.4 ! 6.6 9.9 ! 4.6 .43
E/I ratio of LAA% 0.51 ! 0.51 0.46 ! 0.27 0.39 ! 0.15 .89MLD of inspiratory
scans (HU)#859.7 ! 35.6 #863.4 ! 28.4 #874.0 ! 16.9 .10
MLD of expiratoryscans (HU)
#761.6 ! 58.9 #762.6 ! 62.6 #764.8 ! 50.3 .71
E/I ratio of MLD 0.89 ! 0.06 0.88 ! 0.06 0.87 ! 0.05 .78
Abbreviations: Ai, luminal area; Ao, outer area of bronchus; BSA, body surface area;E/I ratio, percentage of low-attenuation area to lung area and mean lung density oninspiratory and expiratory computed tomographic scans and the ratios of thesevalues at expiration to the respective values at inspiration; LAA%, percentage of low-attenuation area to lung area; MLD, mean lung density; WA%, percentage of wallarea equal to wall area divided by outer area of bronchus multiplied by 100; WA,wall area.aValues are presented as number of patients or mean ! SD.bP > .05 for all indices compared with baseline by paired t test.cP value for baseline vs 48 weeks by paired t test.
Table 3Effects of omalizumab on pulmonary functiona
Variables Time points
Baseline(n " 29)
16 wk(n " 29)
48 wk(n " 25)
Pvalueb
Pulmonary functionVC (L) 3.02 ! 0.73 3.13 ! 0.75c 3.05 ! 0.61 .07FVC (L) 2.93 ! 0.68 3.02 ! 0.71 2.96 ! 0.61 .41FEV1 (L/s) 2.17 ! 0.53 2.25 ! 0.56 2.24 ! 0.55 .09FEF25-75 (L/s) 1.86 ! 1.01 1.85 ! 1.03 1.89 ! 1.13 .09RV/TLC (%) 32.1 ! 8.1 31.2 ! 5.6 30.7 ! 6.3 .61DN2 2.52 ! 2.85 2.17 ! 1.95 1.78 ! 1.37 .06
Impulse oscillometryR5 (kPa/L/s) 0.41 ! 0.23 0.40 ! 0.22 0.36 ! 0.20 .06R20 (kPa/L/s) 0.30 ! 0.10 0.29 ! 0.09 0.28 ! 0.10 .07R5#R20 (kPa/L/s) 0.11 ! 0.15 0.11 ! 0.15 0.08 ! 0.12 .16AX (kPa/L) 1.13 ! 1.96 1.19 ! 2.09 0.91 ! 1.68 .47
Abbreviations: AX, integrated area of low-frequency reactance; DN2, slope of phase3 of nitrogen single-breath washout curve; FEF25-75, forced expiratory flow at 25% to75%; FEV1, forced expiratory volume in 1 second; FVC, forced vital capacity; R20,respiratory resistance at 20 Hz; R5, respiratory resistance at 5 Hz; R5#R20, differ-ence in respiratory resistance between 5 and 20 Hz; RV, residual volume; TLC, totallung capacity; VC, vital capacity.aValues are presented as mean ! SD.bP values for baseline vs 48 weeks by paired t test.cP < .05 compared with baseline by paired t test.
T. Tajiri et al. / Ann Allergy Asthma Immunol xxx (2014) 1e6 5
Tajiri T, Niimi A et al. Ann Allergy Asthma Immunol 2014�
Pulmonary Func+on Results�

12.0 ! 6.1 mm2/m2 at baseline to 12.1 ! 4.0 mm2/m2 at 48 weeks(P" .025 by paired t test). The Ao/BSA ratio did not changewith thistreatment. The decrease in WA% was significantly associated withthe decrease in FeNO50 levels (r " 0.52, P " .003) and sputumeosinophil proportions (r" 0.40, P" .026). Similarly, the increase inthe Ai/BSA ratio was significantly associated with the decrease inFeNO50 levels (r " #0.42, P " .019) and sputum eosinophil pro-portions (r " #0.39, P " .031).
Parameters of lung density did not change with this treatment(Table 4).
Discussion
To the best of the authors’ knowledge, this is the first compre-hensive study to demonstrate that omalizumab exerts anti-inflammatory effects on small airways in addition to its severalknown clinical effects. In addition, the authors showed that a longerterm (48 weeks) of omalizumab treatment reversed remodeledairways in parallel with a decrease in airway eosinophilic inflam-mation in patients with the most severe asthma.
Omalizumab has various clinical and anti-inflammatory effectsin patients with asthma. Omalizumab treatment has been found tosignificantly decrease asthma exacerbations and asthma medi-cations3e5 and improve AQLQ scores4,5 and spirometric indices.3,5
Its use also has been found to decrease FeNO levels26 and sputumor bronchial tissue eosinophils,6 all of which reflect inflammationof relatively large airways. In agreement with these studies, theauthors confirmed the improvements of several indices, includingAQLQ scores, FeNO50 levels, and sputum eosinophil proportions.Moreover, the authors demonstrated a significant decrease in CANOlevels, which reflect inflammation of small airways and alveolarregions.18 Therefore, the present study’s findings suggest thatomalizumab may have at least anti-inflammatory effects on smallairways and alveolar regions in addition to large airways, whichcould be clinically relevant because small airways are consideredimportant targets for managing severe asthma.24,27
Airway remodeling is one of the cardinal features of asthma.Conventional therapies, including ICS, are not generally consideredto consistently reverse the remodeled airway. Several studies haveshown that high-dose ICS attenuates basement membrane thick-ening28 or vascularity,29 mostly in mild to moderate asthma.However, there are conflicting results.30 Moreover, the effects of ICSon airway-wall thickening are limited in long-standing asthma.10
Immunoglobulin E is central to allergic airway inflammation thatis associatedwith airway remodeling. Therefore, omalizumabwouldbe expected to reverse airway remodeling.11 However, there havebeen only a few reports on the effects of omalizumab on airwayremodeling or airway-wall thickening.12,13 In a bronchial biopsystudy, the thickness of the reticular basement membrane wasdecreased after a year of treatment with omalizumab in patientswith severe asthma on ICS (1,781.82 ! 532.58 mg/d; inhalers notspecified) and long-acting b2 agonists (n " 11).12 In another study,airway-wall thickening as assessed byCTwas significantly decreasedby as soon as 16 weeks in patients who were treated with ICS (791.4! 246.4 mg/d of fluticasone propionate equivalent), long-acting b2agonists, and other asthma medications (n " 14).13 In the latterstudy, FEV1markedly improved (1.32! 0.60 to 1.53! 0.56 L, P< .05).
In the present study, airway-wall thickening as assessed by CTdecreased at 48 weeks (but not at 16 weeks) of omalizumabtreatment in patients with more severe asthma on higher-dose ICS(1,432 ! 581 mg/d of fluticasone propionate equivalent) and moreconcomitant controller medications (mean number 3.9 ! 1.0) thanthose in the previous 2 studies.12,13 Considering that mean PEFvalues continuously improved throughout the 48 weeks of treat-ment, the decrease in airway-wall thickening with omalizumabmay have gradually occurred throughout the 48 weeks in thepresent study. Intervention studies of ICS treatment have shownthat spirometric parameters usually reach maximal improvementswithin a fewmonths, whereas attenuation of airway remodeling asexamined by bronchial biopsy (ie, reticular basement membranethickening) can take up to 1 year.28 The latter finding is consistentwith the present CT findings. This suggests that there may beimprovements in airway remodeling and in airway inflammationwith omalizumab. The degree of airway-wall thickening (WA/BSA " 18.6 ! 8.2 mm2/m2) in the present study was comparable tothat (19.9! 5.0 mm2/m2) in patients with severe persistent asthmain the authors’ previous study,8 but it was much greater than that
Table 4Effects of omalizumab on computed tomographic indicesa
Time points
Baseline 16 wkb 48 wk P valuec
Airway dimensions 21 21 14WA (mm2) 30.3 ! 12.6 29.5 ! 12.5 26.0 ! 7.6 .09WA/BSA (mm2/m2) 18.6 ! 8.2 18.1 ! 7.9 11.0 ! 3.3 .09WA% 62.0 ! 7.2 60.6 ! 7.3 57.1 ! 6.2 .002Ao (mm2) 49.7 ! 21.7 48.9 ! 21.5 45.6 ! 13.1 .51Ao/BSA (mm2/m2) 30.6 ! 13.8 30.1 ! 13.5 27.9 ! 7.2 .54Ai (mm2) 19.5 ! 9.8 19.4 ! 9.9 19.6 ! 6.6 .024Ai/BSA (mm2/m2) 12.0 ! 6.1 12.0 ! 6.2 12.1 ! 4.0 .025
Lung density 24 24 17LAA% of inspiratory
scans22.2 ! 7.6 22.4 ! 6.5 24.8 ! 5.1 .07
LAA% of expiratoryscans
9.8 ! 4.9 10.4 ! 6.6 9.9 ! 4.6 .43
E/I ratio of LAA% 0.51 ! 0.51 0.46 ! 0.27 0.39 ! 0.15 .89MLD of inspiratory
scans (HU)#859.7 ! 35.6 #863.4 ! 28.4 #874.0 ! 16.9 .10
MLD of expiratoryscans (HU)
#761.6 ! 58.9 #762.6 ! 62.6 #764.8 ! 50.3 .71
E/I ratio of MLD 0.89 ! 0.06 0.88 ! 0.06 0.87 ! 0.05 .78
Abbreviations: Ai, luminal area; Ao, outer area of bronchus; BSA, body surface area;E/I ratio, percentage of low-attenuation area to lung area and mean lung density oninspiratory and expiratory computed tomographic scans and the ratios of thesevalues at expiration to the respective values at inspiration; LAA%, percentage of low-attenuation area to lung area; MLD, mean lung density; WA%, percentage of wallarea equal to wall area divided by outer area of bronchus multiplied by 100; WA,wall area.aValues are presented as number of patients or mean ! SD.bP > .05 for all indices compared with baseline by paired t test.cP value for baseline vs 48 weeks by paired t test.
Table 3Effects of omalizumab on pulmonary functiona
Variables Time points
Baseline(n " 29)
16 wk(n " 29)
48 wk(n " 25)
Pvalueb
Pulmonary functionVC (L) 3.02 ! 0.73 3.13 ! 0.75c 3.05 ! 0.61 .07FVC (L) 2.93 ! 0.68 3.02 ! 0.71 2.96 ! 0.61 .41FEV1 (L/s) 2.17 ! 0.53 2.25 ! 0.56 2.24 ! 0.55 .09FEF25-75 (L/s) 1.86 ! 1.01 1.85 ! 1.03 1.89 ! 1.13 .09RV/TLC (%) 32.1 ! 8.1 31.2 ! 5.6 30.7 ! 6.3 .61DN2 2.52 ! 2.85 2.17 ! 1.95 1.78 ! 1.37 .06
Impulse oscillometryR5 (kPa/L/s) 0.41 ! 0.23 0.40 ! 0.22 0.36 ! 0.20 .06R20 (kPa/L/s) 0.30 ! 0.10 0.29 ! 0.09 0.28 ! 0.10 .07R5#R20 (kPa/L/s) 0.11 ! 0.15 0.11 ! 0.15 0.08 ! 0.12 .16AX (kPa/L) 1.13 ! 1.96 1.19 ! 2.09 0.91 ! 1.68 .47
Abbreviations: AX, integrated area of low-frequency reactance; DN2, slope of phase3 of nitrogen single-breath washout curve; FEF25-75, forced expiratory flow at 25% to75%; FEV1, forced expiratory volume in 1 second; FVC, forced vital capacity; R20,respiratory resistance at 20 Hz; R5, respiratory resistance at 5 Hz; R5#R20, differ-ence in respiratory resistance between 5 and 20 Hz; RV, residual volume; TLC, totallung capacity; VC, vital capacity.aValues are presented as mean ! SD.bP values for baseline vs 48 weeks by paired t test.cP < .05 compared with baseline by paired t test.
T. Tajiri et al. / Ann Allergy Asthma Immunol xxx (2014) 1e6 5
Tajiri T, Niimi A et al. Ann Allergy Asthma Immunol 2014�
CT Imaging Results�
CANO, as well as FeNO50, values improved with 48 wks of omalizumab, indica+ng significant effects on small airways inflamma+on, but the results of CT and IOS studies was inconsistent. �
Conclusions �
Ø U+lity of noninvasive small airway measurements, focusing IOS and alveolar NO, has been discussed.
Ø They are likely useful tools�for the assessment of small airways in asthma, and show�mutual correla+ons with each other, although they are modest.
Ø However, it seems more likely that these and other measures of small airways may be considered supplemental, rather than compe++ve, to each other.
�


![Shaping New Perspectives on Pulmonary Function · Galant et al., AAAI 2017 “Monitoring small airway function by [Oscillometry] can be useful in identifying patients who are at risk](https://img.pdfslide.us/doc/110x75/5e8c027ef35db341eb1cc827/shaping-new-perspectives-on-pulmonary-function-galant-et-al-aaai-2017-aoemonitoring.jpg)