Embed Size (px)
Citation preview
UNIVERSITY OF TWENTE
BACHELOR THESIS
Recognition of Metal Cations with surfaceimmobilized Crown Ether functionalized
Poly(ferrocenylsilane)
Author:
Maike BRAND
Supervisors:
Bram ZOETEBIER, MSc
Dr. Mark A. HEMPENIUS
Chair:
Prof. dr. Julius VANCSO
June 30, 2015

Abstract
For the design of an electrochemical sensor, a functionalized benzo-18-crown-6 is required for the at-
tachment to iodopropyl-functionalized poly(ferrocenylsilane) (PFS). Various acylation reactions were
investigated, as this was the crucial step in view of obtaining a clean product of hydroxyl-functionalized
benzo-18-crown-6. The different reactions were carried out at 50°C or room temperature using solid cata-
lysts and acids. The acylation performed at room temperature using Eaton’s reagent as catalyst yielded 69%
of 4’-acetylbenzo-18-crown-6 without by-products. 4’-Hydroxybenzo-18-crown-6 could be obtained after
the Baeyer-Villiger oxidation and hydrolysis, with 17% of unfunctionalized crown ether starting material
present. The electrochemical sensor, consisting of 4’-aminobenzo-18-crown-6 attached to a PFS-modified
gold substrate, was successfully tested since it responded to very low potassium ion concentrations in
aqueous solution.
Contents
1 Introduction 1
2 Theory 3
2.1 Redox properties of ferrocene . . . . . . . . . . . . . . . . . . . . . . . . . . . . . . . . . . . . . . 3
2.2 Host-Guest complexes . . . . . . . . . . . . . . . . . . . . . . . . . . . . . . . . . . . . . . . . . . 6
2.3 Electrochemical sensor . . . . . . . . . . . . . . . . . . . . . . . . . . . . . . . . . . . . . . . . . 7
2.4 Nuclear Magnetic Resonance Spectroscopy . . . . . . . . . . . . . . . . . . . . . . . . . . . . . 8
2.5 Fourier Transform Infrared Spectroscopy . . . . . . . . . . . . . . . . . . . . . . . . . . . . . . . 8
2.6 Grazing Angle FTIR . . . . . . . . . . . . . . . . . . . . . . . . . . . . . . . . . . . . . . . . . . . . 9
2.7 Contact Angle Measurement . . . . . . . . . . . . . . . . . . . . . . . . . . . . . . . . . . . . . . 9
2.8 Gel Permeation Chromatography . . . . . . . . . . . . . . . . . . . . . . . . . . . . . . . . . . . 9
3 Experimental 10
3.1 Successful synthesis route for disubstituted hydroxy crown ether . . . . . . . . . . . . . . . . . 11
3.1.1 Synthesis of 4’-acetylbenzo-18-crown-6 (crude product) . . . . . . . . . . . . . . . . . . 12
3.1.2 Synthesis of 4’-acetatobenzo-18-crown-6 (crude product) . . . . . . . . . . . . . . . . . 12
3.1.3 Synthesis of 4’hydroxybenzo-18-crown-6 (crude product) . . . . . . . . . . . . . . . . . 12
3.2 Alternative routes for the synthesis of the crown ether . . . . . . . . . . . . . . . . . . . . . . . 12
3.2.1 Mild Friedel-Crafts acylation using Cyanuric Chloride and AlCl31 . . . . . . . . . . . . 13
3.2.2 Solvent free Friedel-Crafts acylation using Zinc Oxide (ZnO) as a catalyst2 . . . . . . . 13
3.3 Successful synthesis of 4’-hydroxybenzo-18-crown-6 3 . . . . . . . . . . . . . . . . . . . . . . . 14
3.3.1 Synthesis of 4’-acetylbenzo-18-crown-6 . . . . . . . . . . . . . . . . . . . . . . . . . . . 14
3.3.2 Synthesis of 4’-acetatobenzo-18-crown-6 . . . . . . . . . . . . . . . . . . . . . . . . . . . 14
3.3.3 Synthesis of 4’-hydroxybenzo-18-crown-6 . . . . . . . . . . . . . . . . . . . . . . . . . . 15
3.4 Synthesis of iodopropyl-functionalized PFS . . . . . . . . . . . . . . . . . . . . . . . . . . . . . 15
3.5 Synthesis of benzo-18-crown-6-functionalized PFS (4’-aminobenzo-18-crown-6)4 . . . . . . 16

3.6 Synthesis of benzo-18-crown-6-functionalized PFS (4’-hydroxybenzo-18-crown-6) . . . . . . 16
3.7 Preparation of gold substrates for electrochemical measurements5 . . . . . . . . . . . . . . . 17
3.7.1 Formation of cysteamine self-assembled monolayers (SAMs) . . . . . . . . . . . . . . . 17
3.7.2 Surface attachment of PFS chains . . . . . . . . . . . . . . . . . . . . . . . . . . . . . . . 17
3.7.3 Attachment of 4’-aminobenzo-18-crown-6 to PFS modified substrates . . . . . . . . . 17
4 Results and Discussion 18
5 Conclusion 29
6 Outlook 30
Appendices 35
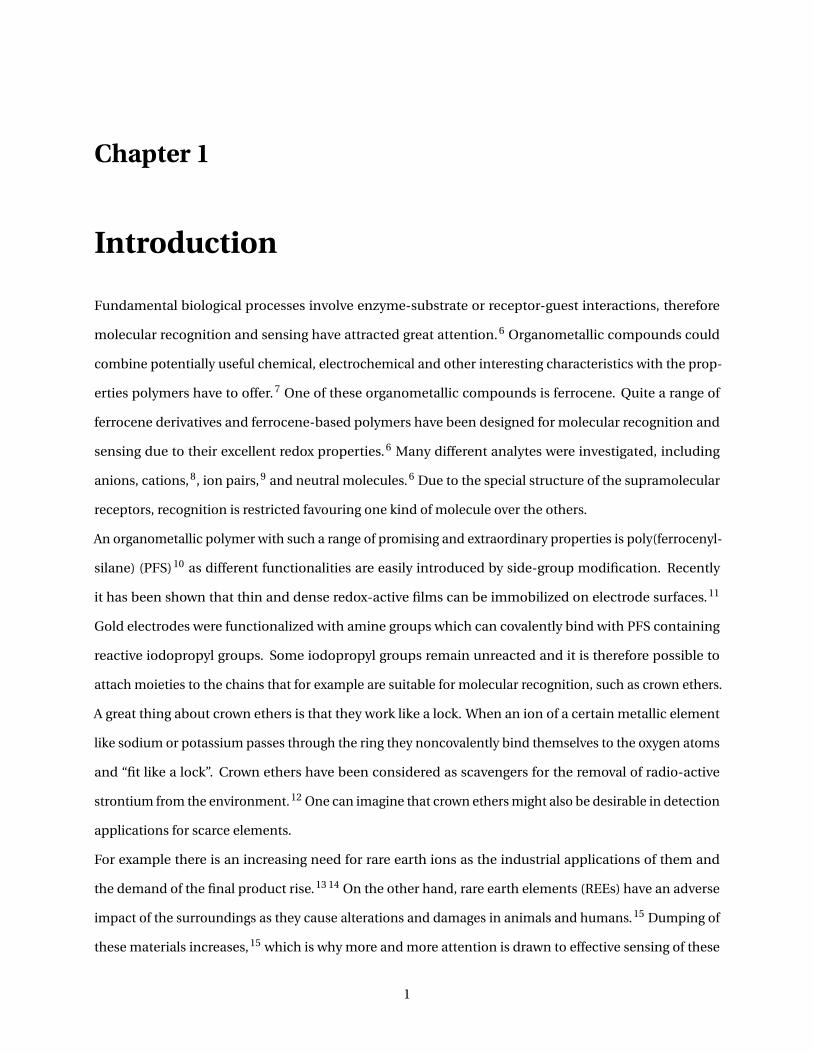
Chapter 1
Introduction
Fundamental biological processes involve enzyme-substrate or receptor-guest interactions, therefore
molecular recognition and sensing have attracted great attention.6 Organometallic compounds could
combine potentially useful chemical, electrochemical and other interesting characteristics with the prop-
erties polymers have to offer.7 One of these organometallic compounds is ferrocene. Quite a range of
ferrocene derivatives and ferrocene-based polymers have been designed for molecular recognition and
sensing due to their excellent redox properties.6 Many different analytes were investigated, including
anions, cations, 8, ion pairs, 9 and neutral molecules. 6 Due to the special structure of the supramolecular
receptors, recognition is restricted favouring one kind of molecule over the others.
An organometallic polymer with such a range of promising and extraordinary properties is poly(ferrocenyl-
silane) (PFS)10 as different functionalities are easily introduced by side-group modification. Recently
it has been shown that thin and dense redox-active films can be immobilized on electrode surfaces.11
Gold electrodes were functionalized with amine groups which can covalently bind with PFS containing
reactive iodopropyl groups. Some iodopropyl groups remain unreacted and it is therefore possible to
attach moieties to the chains that for example are suitable for molecular recognition, such as crown ethers.
A great thing about crown ethers is that they work like a lock. When an ion of a certain metallic element
like sodium or potassium passes through the ring they noncovalently bind themselves to the oxygen atoms
and “fit like a lock”. Crown ethers have been considered as scavengers for the removal of radio-active
strontium from the environment. 12 One can imagine that crown ethers might also be desirable in detection
applications for scarce elements.
For example there is an increasing need for rare earth ions as the industrial applications of them and
the demand of the final product rise. 13 14 On the other hand, rare earth elements (REEs) have an adverse
impact of the surroundings as they cause alterations and damages in animals and humans. 15 Dumping of
these materials increases, 15 which is why more and more attention is drawn to effective sensing of these
1

substances. For the application of preconcentration16 of environmental samples this topic is of great
importance as well, as this is a good way to store radioactive waste17 in a smaller volume. For a range of
crown ether designs, recognition and sensing of different metal cations has been successful. 9 17 18
Electrochemical sensing will be the technique of choice as it is a low cost method which shows high
selectivity and efficiency. The peak current that is generated during measurement can be quantitatively
related to metal ions in the analyte. Therefore this method is able to determine the presence of a whole
range of metal ions as each kind of ion shows a characteristic position of the peak current.
In this study we explore the possibility of attaching a benzannulated crown ether, benzo-18-crown-6
(B18C6), bearing a phenolic hydroxyl group to iodopropyl-functionalized PFS. 4’-Hydroxybenzo-18-crown-
6 needs to be synthesized first. Furthermore, the provided iodopropyl-functionalized PFS contains
about 5% of chloropropyl-functionalized PFS which will be converted into iodo-moieties to have a fully
iodopropyl-substituted polymer at our disposal. This polymer will be attached to gold electrode surfaces.
After immobilization of this functional PFS polymer at electrode surfaces, remaining iodopropyl groups
will be used to bind crown ether moieties to the surface-anchored PFS chains. The influence of metal
cations on the redox behaviour of the PFS-Crown ether films will be explored using cyclic voltammetry as
electrochemical technique, in order to establish whether these PFS-crown ether films can be used as an
electrochemical sensor for metal ions.
This report starts with a theoretical part where the different characterization and measuring techniques
will be introduced and explained shortly, followed by an overview of the different reactions. The results
will be presented and discussed in the next part and conclusions will be drawn from that. The report will
be concluded with some recommendations.
2
Chapter 2
Theory
In this chapter some basic principles will be explained starting with the redox properties of ferrocene
and cyclic voltammetry, followed by the principles of host-guest complexes, the surface immobilization
of PFS on gold substrates, while the last part will be on the various characterization techniques used to
characterize the reaction products.
2.1 Redox properties of ferrocene
Electrochemistry is used to investigate the behaviour of electrochemical systems. The study of chemical
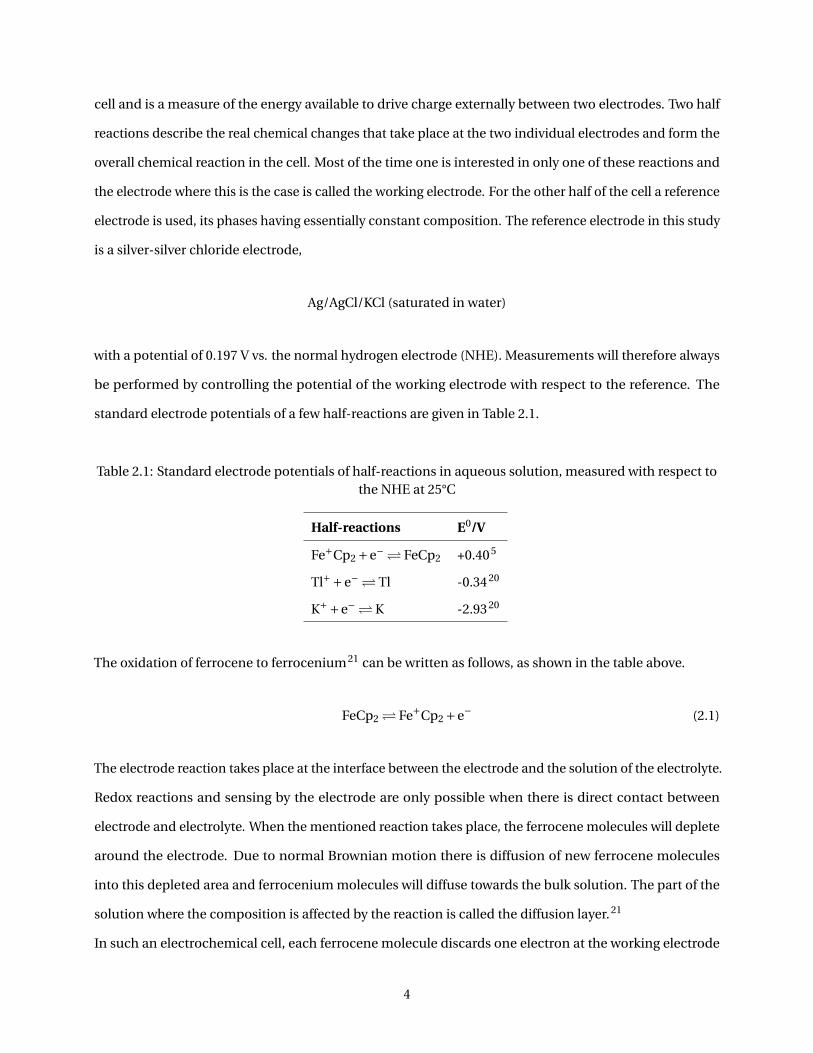
changes due to the passage of an electric current is the part that is of interest for this report. Ferrocene is
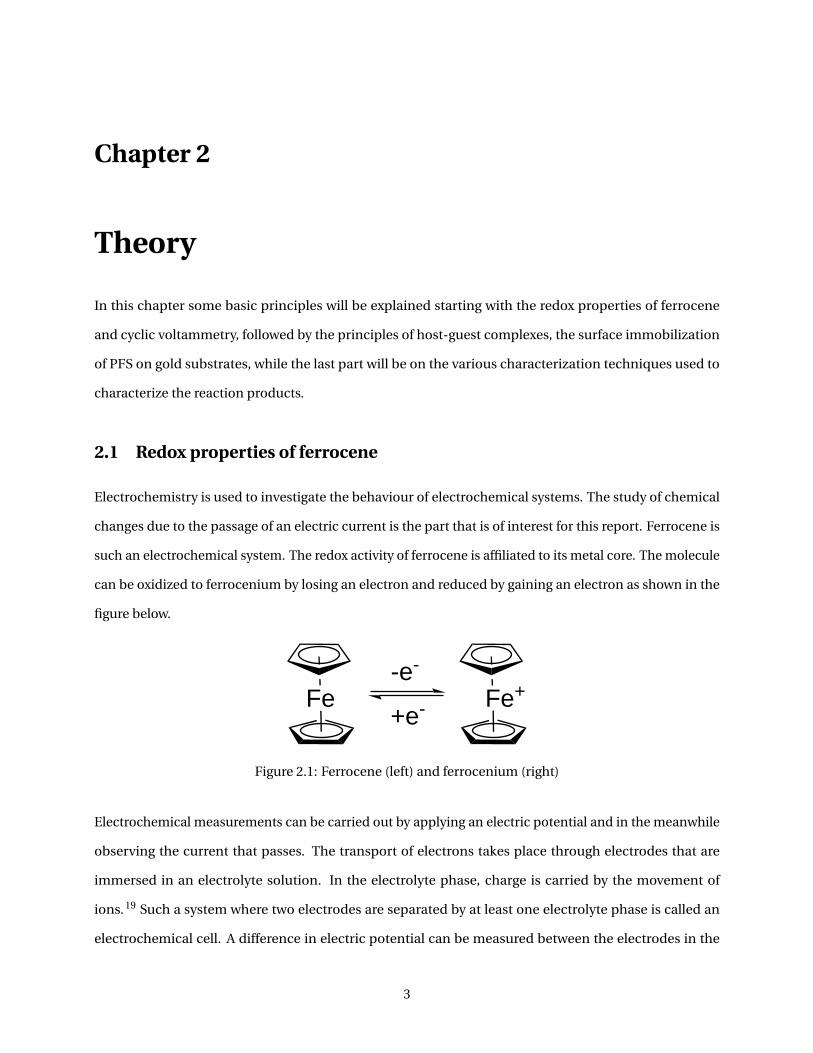
such an electrochemical system. The redox activity of ferrocene is affiliated to its metal core. The molecule
can be oxidized to ferrocenium by losing an electron and reduced by gaining an electron as shown in the
figure below.
Fe Fe+-e-
+e-
Figure 2.1: Ferrocene (left) and ferrocenium (right)
Electrochemical measurements can be carried out by applying an electric potential and in the meanwhile
observing the current that passes. The transport of electrons takes place through electrodes that are
immersed in an electrolyte solution. In the electrolyte phase, charge is carried by the movement of
ions.19 Such a system where two electrodes are separated by at least one electrolyte phase is called an
electrochemical cell. A difference in electric potential can be measured between the electrodes in the
3
cell and is a measure of the energy available to drive charge externally between two electrodes. Two half
reactions describe the real chemical changes that take place at the two individual electrodes and form the
overall chemical reaction in the cell. Most of the time one is interested in only one of these reactions and
the electrode where this is the case is called the working electrode. For the other half of the cell a reference
electrode is used, its phases having essentially constant composition. The reference electrode in this study
is a silver-silver chloride electrode,
Ag/AgCl/KCl (saturated in water)
with a potential of 0.197 V vs. the normal hydrogen electrode (NHE). Measurements will therefore always
be performed by controlling the potential of the working electrode with respect to the reference. The
standard electrode potentials of a few half-reactions are given in Table 2.1.
Table 2.1: Standard electrode potentials of half-reactions in aqueous solution, measured with respect tothe NHE at 25°C
Half-reactions E0/V
Fe+Cp2 +e− FeCp2 +0.40 5
Tl++e− Tl -0.34 20
K++e− K -2.93 20
The oxidation of ferrocene to ferrocenium 21 can be written as follows, as shown in the table above.
FeCp2 Fe+Cp2 +e− (2.1)
The electrode reaction takes place at the interface between the electrode and the solution of the electrolyte.
Redox reactions and sensing by the electrode are only possible when there is direct contact between
electrode and electrolyte. When the mentioned reaction takes place, the ferrocene molecules will deplete
around the electrode. Due to normal Brownian motion there is diffusion of new ferrocene molecules
into this depleted area and ferrocenium molecules will diffuse towards the bulk solution. The part of the
solution where the composition is affected by the reaction is called the diffusion layer. 21
In such an electrochemical cell, each ferrocene molecule discards one electron at the working electrode
4
while being oxidized. These electrons will pass through the external circuit back into the solution at the
counter electrode. The power that is applied forces the electrons onto species that are present in the
solution at the second electrode. As a result, reduction of ferrocenium molecules occurs to the same
extent as oxidation of ferrocene takes place at the working electrode. The direction of the electron flow is
determined by the way the external circuit is applied. Therefore one can have a reducing, as well as an
oxidizing current, i.e., cathodic or anodic. As electrode reactions occur on a stoichiometric basis, the flow
of electrons at an electrode is directly proportional to the rate of the reaction. 21
Cyclic voltammetry (CV) is a powerful technique to study polymer films containing electro-active material.
With this method the potential of the working electrode is linearly varied between two values relative to
the reference. One run is defined as the change from the first value to the second value and back. The most
important parameters in this measurement are the anodic and cathodic peak currents and the anodic and
cathodic peak potentials. The anodic peak current is related to oxidation and the cathodic peak current to
reduction.
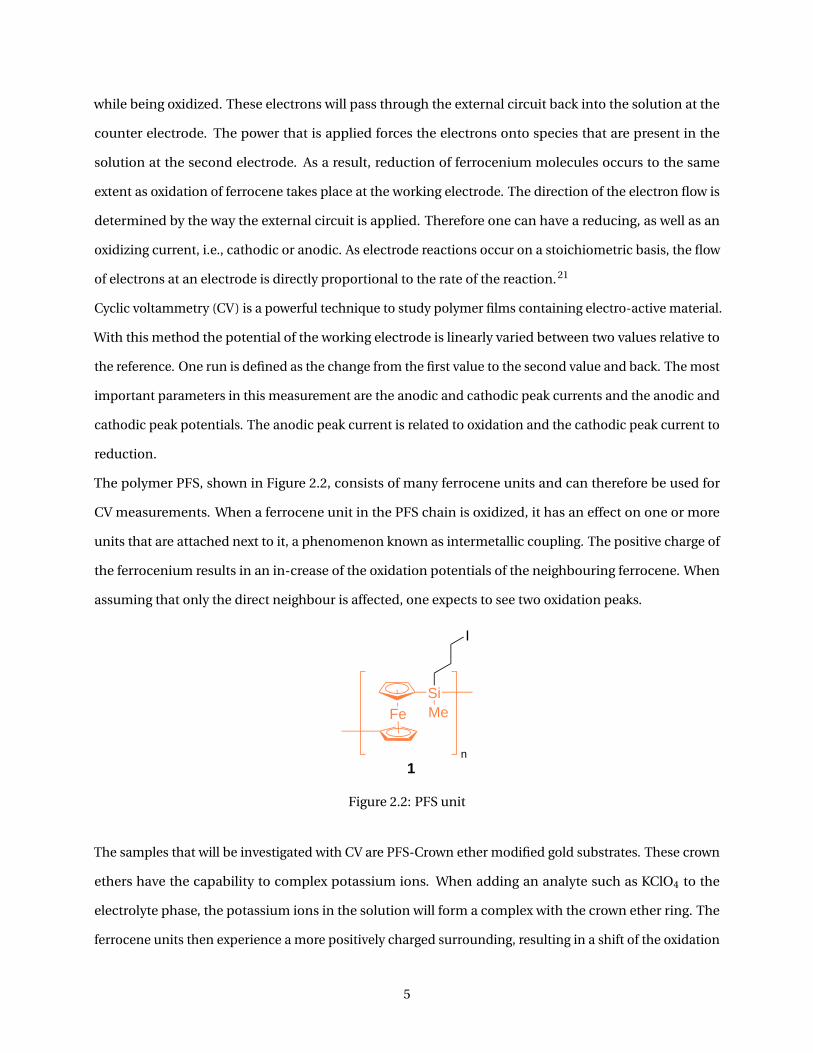
The polymer PFS, shown in Figure 2.2, consists of many ferrocene units and can therefore be used for
CV measurements. When a ferrocene unit in the PFS chain is oxidized, it has an effect on one or more
units that are attached next to it, a phenomenon known as intermetallic coupling. The positive charge of
the ferrocenium results in an in-crease of the oxidation potentials of the neighbouring ferrocene. When
assuming that only the direct neighbour is affected, one expects to see two oxidation peaks.
FeSiMe
I
n1
Figure 2.2: PFS unit
The samples that will be investigated with CV are PFS-Crown ether modified gold substrates. These crown
ethers have the capability to complex potassium ions. When adding an analyte such as KClO4 to the
electrolyte phase, the potassium ions in the solution will form a complex with the crown ether ring. The
ferrocene units then experience a more positively charged surrounding, resulting in a shift of the oxidation
5
peak to a higher voltage as oxidation will become more difficult.
The relation22, given in equation 2.2, allows us to determine the surface coverage Γ (mol cm−2), the
number of moles present at the surface per unit area, which is the number of ferrocene units that are
attached to the functionalized gold surface. At the same time this provides an estimate of the number of
crown ethers that are attached to the PFS chains, Figure 2.3, as one PFS repeat unit can bear one crown
ether molecule.
Γ= Q
nFA(2.2)
The number of electrons, n, that transfer per reaction is in the case of ferrocene one electron, F is the
Faraday constant (F = 96485 C mol−1) and A is electrode surface area (cm2). The charge Q involved in the
electrochemical process (C) is linearly related to the peak current, I (A) and can be calculated from the
relation22 given in equation 2.3,
I = dQ
dt(2.3)
These equations are used to calculate the surface coverage of the substrates, so the concentration of the
analyte can be adjusted to the number of crown ethers attached through PFS chains on the electrode
surface (Figure 2.3).
2.2 Host-Guest complexes
Noncovalent inter- and intramolecular interactions are the principles where host-guest complexes are
based on. Host and guest molecules may form complexes, making use of for instance polar, hydrophobic
or hydrogen bonding interactions. For many host guest complexes, a match is required between the size
of the host and the guest molecule.
In the case of the employed crown ether, 18-crown-6, there are six oxygen atoms present in the ring
structure, all of them possessing two lone electron pairs. These electrons can interact with positively
charged species, for example metal ions. The size of a metal ion and the crown cavity plays a crucial role in
the formation of a host-guest complex. In this study the polyether ring 18-crown-6 is used. As the size
of the crown cavity is fixed, with a size of 2.6-3.2 Å,23 selection needs to be done at the side of the guest
species. This is because the ability of selective encapsulation has been explained in terms of optimal size
6
matching between the crown cavity and guest species. 24 Selective capturing of K+ ions has been proven to
be successful. 24
2.3 Electrochemical sensor
Gold electrodes have been modified with covalently immobilized PFS chains and used as electrochemical
sensor for ascorbic acid, a water-soluble vitamin.5 The approach of this study was to design a different
electrochemical sensor for metal ions based on surface-anchored PFS chains on gold substrates. The
difference will be the attachment of a host molecule to these chains for the capturing of metal ions.
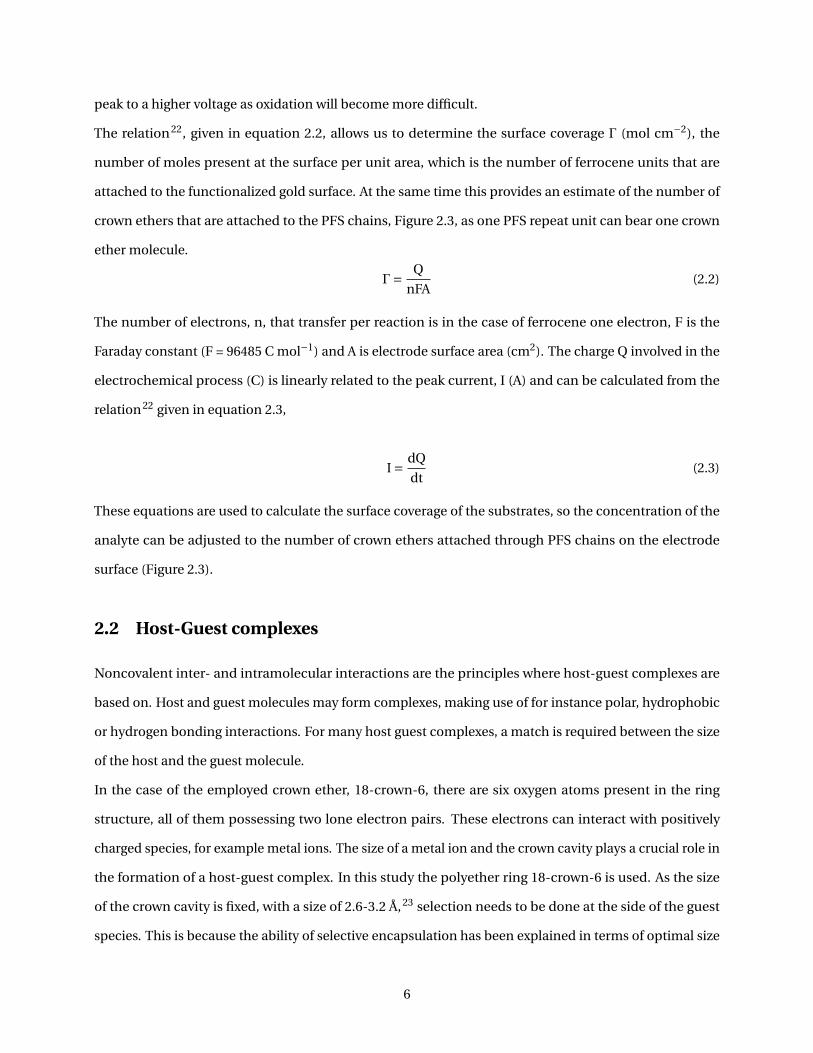
The chemically modified electrodes were fabricated by a simple “grafting to” method. The gold substrates
were treated with cysteamine to form an amine-terminated monolayer. Iodopropyl-functionalized PFS
was then attached by amination of these side groups. Not all iodopropyl groups are involved in surface
anchoring. Remaining iodopropyl groups are available to react with 4’-aminobenzo-16-crown-6 to form
the desired PFS-crown ether film, immobilized at the electrode surface. A schematic representation of
these steps is given in Figure 2.3.
AuS
NH2
S
NH2
S
NH2
AuHS-(CH2)2-NH2
AuS
NH
S
NH2
HS
NH2
grafting to
I
I I
II
I
FeSiMe
I
n1
I
AuS
NH
S
NH2
S
NH2I
I I
NHI
I
HNOO
O
O
O
OO
O
O O
O
O
grafting to
Figure 2.3: Schematic representation of the covalent surface-attachment of PFS chains (1) on a goldsubstrate
The “grafting to” method for the attachment of the PFS-I chains and the crown ethers will be explained in
more detail in the experimental part.
7
2.4 Nuclear Magnetic Resonance Spectroscopy
Nuclear Magnetic Resonance (NMR) is a very useful technique to identify structures of chemical com-
pounds. This spectroscopy method examines the magnetic properties of nuclei of hydrogen atoms which
are incorporated within the chemical structure. So, only molecules of which the nuclei contain a spin can
be analyzed with NMR. 25
When a molecule containing a spin is placed in a magnetic field, the nuclei can orient in the same or in the
opposite direction of the external magnetic field. The difference between the α-spin state, which is lower
in energy, and the β-spin state, which is higher in energy, ∆E, depends on the strength of the field. 26
When a nucleus absorbs radio frequency (rf) energy with the same energy as ∆E, the spin flips and emits
a signal which can be detected by the NMR spectrometer. The chemical shift, spin-spin coupling and
integration of the signals are the most important aspects of the structure analysis using NMR. 27 28 Chemical
shifts are caused by shielding effects. Deshielding of the nucleus, which is caused by electron withdrawing
groups, results in a higher chemical shift. Nuclei being close together have an influence of each other’s
effective magnetic field, resulting in a characteristic splitting pattern when the nuclei are nonequivalent. 28
The integral reveals information about the number of protons that contribute to the signal.
2D NMR can be used to identify which carbon signals correspond with which proton signals.
2.5 Fourier Transform Infrared Spectroscopy
Infrared (IR) spectroscopy is based on absorption and transmission of light by a molecule. Chemical
compounds can absorb specific wavelengths causing excitation of the molecular structure to different
vibrational modes. Stretch vibrations occur along bonds and change the bond lengths, whereas bending
vibrations change the bond angles. Absorption of characteristic bands can take place when the frequency
of the infrared light is between 4000 and 600 cm−1.29 The resulting IR spectrum gives the percentage of
absorption or transmission as a function of the wavenumber.
With Fourier Transform Infrared (FTIR) spectroscopy a special mathematical treatment of spectral data is
involved. 30
8

2.6 Grazing Angle FTIR
For the analysis of monolayers an often used technique is Grazing Angle FTIR.31 Part of an incident
radiation beam is reflected off the surface of a thin layer and the other part travels as a refracted beam
through the film and reflects off a reflective substrate back through the layer. 32 The characteristic bands in
the resulting spectrum are the same as in regular FTIR spectra.
2.7 Contact Angle Measurement
The wetting behaviour of the substrates can be investigated with a contact angle measurement. For this a
liquid drop is placed on the surface. The contact angle is defined by the intersection of the liquid-solid
interface and the liquid-vapor interface. A contact angle less than 90° indicates a favourable wetting,
whereas is it unfavourable with an angle larger than 90°. In that case the liquid will minimize the contact
with the surface resulting in a more compact drop.
2.8 Gel Permeation Chromatography
The polydispersity index (PDI) of a polymer can be determined using Gel Permeation Chromatography
(GPC). This technique makes use of a gel-packed column to sort the molecules. The sorting is based on
size exclusion as smaller molecules can enter the structured porous gel and the bigger molecules primarily
travels around the gel beads. A solvent is pumped through the gel and the column continuously and a
solution of a polymer sample is injected at the beginning of the column. The high molar mass molecules
leave the column first and the distribution of the different molecular sizes leaving the column in time
provides the information on the molar mass distribution (PDI). 33
9
Chapter 3
Experimental
The different reactions that are described in this chapter were performed following known procedures
found in literature. The details of the instruments that are used for characterization purposes are given
below.
Characterization Techniques. 1H and 13C NMR spectra were recorded on a Bruker Avance III 400 MHz
instrument at 400.1 and 100.6 MHz, respectively, in CDCl3, DMSO-d6, THF-d8 or toluene-d8. 1H and 13C
chemical shifts were based on the solvent residual signals. 34 GPC measurements were carried out in THF
(flow rate 2.025 mL min−1) at 30°C, using microstyragel columns (bead size 10 µm) with pore sizes of 106,
105, 104 and 103 Å (Waters) and a dual detection system consisting of a differential refractometer (Waters
model 410) and a differential viscomefter (Viscotek model H502). Molar masses were determined relative to
narrow polystyrene standards. Electrochemical measurements were carried out using an Autolab, PGSTAT
10 electrochemical workstation. Cyclic voltammograms were recorded between 0 and +0.8 and +0.9 V
at scan rates of 50 mV s−1, using a Ag/AgCl reference electrode, a Pt counter electrode, and a Pt working
electrode. FTIR spectra were measured with a Bruker ALPHA on the obtained samples. The monolayers
were analyzed by a Bruker Vertex 70v by using grazing angle FTIR. Contact angle measurements were done
with a Telescope-Goniometer.
Materials. Eaton’s reagent (phosphorus pentoxide, 7.7 wt.% in methanesulfonic acid), acetic acid (ACS
reagent, ≥ 99.8%), benzo-18-crown-6 (98%), 4’-aminobenzo-18-crown-6 (technical), 3-chloroperbenzoic
acid (77%), phosphazene base P1-t-Bu-tris(tetramethylene) (≥ 97%), lithium hydroxide monohydrate
(ACS reagent, ≥ 98%), sodium bicarbonate, anhydrous tetrahydrofuran and anhydrous dimethylsulfoxide
(DMSO) were purchased from Sigma-Aldrich. Dichloromethane, dimethylformamide (DMF), methanol
and tetrahydrofuran (THF) were obtained from Biosolve, The Netherlands. Milli-Q water was obtained
from a Millipore dispensing system.
10
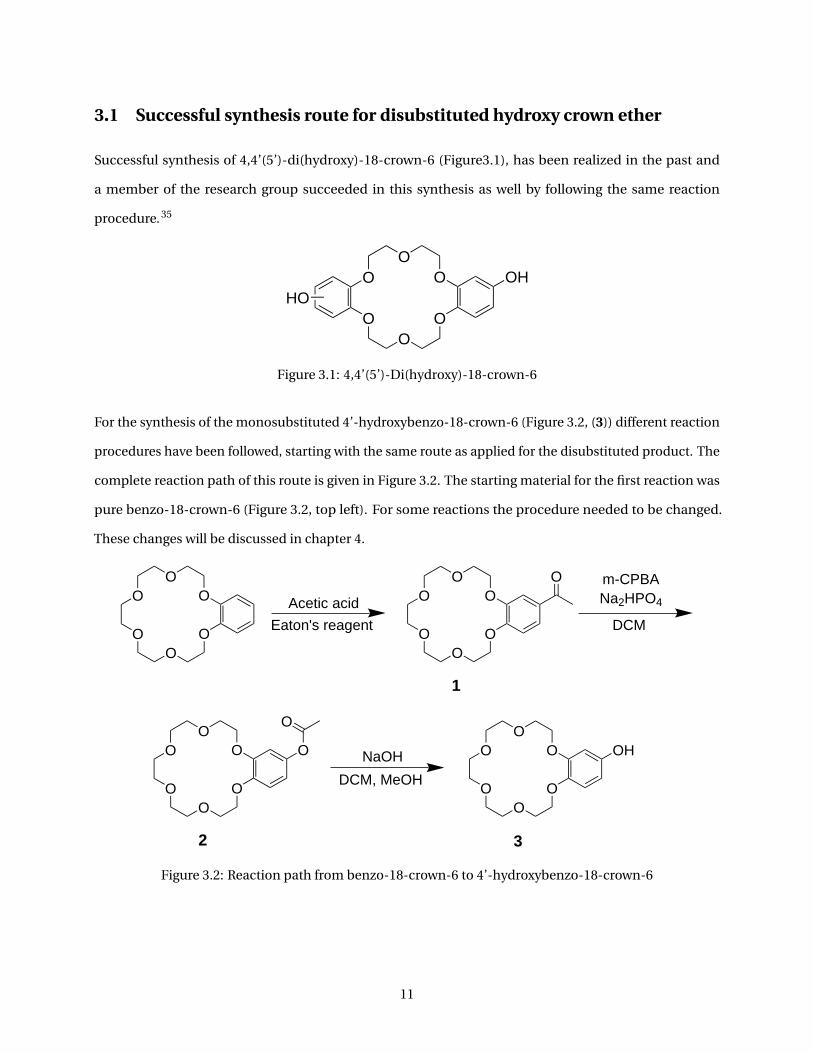
3.1 Successful synthesis route for disubstituted hydroxy crown ether
Successful synthesis of 4,4’(5’)-di(hydroxy)-18-crown-6 (Figure3.1), has been realized in the past and
a member of the research group succeeded in this synthesis as well by following the same reaction
procedure. 35
OO
O
OOO
OHHO
Figure 3.1: 4,4’(5’)-Di(hydroxy)-18-crown-6
For the synthesis of the monosubstituted 4’-hydroxybenzo-18-crown-6 (Figure 3.2, (3)) different reaction
procedures have been followed, starting with the same route as applied for the disubstituted product. The
complete reaction path of this route is given in Figure 3.2. The starting material for the first reaction was
pure benzo-18-crown-6 (Figure 3.2, top left). For some reactions the procedure needed to be changed.
These changes will be discussed in chapter 4.
OO
O
OOO
Acetic acid
Eaton's reagentO
OO
O OO O m-CPBA
Na2HPO4
DCM
OO
O
OOO
O
DCM, MeOH
O
NaOH
OO
O
O OO
OH
1
2 3
Figure 3.2: Reaction path from benzo-18-crown-6 to 4’-hydroxybenzo-18-crown-6
11
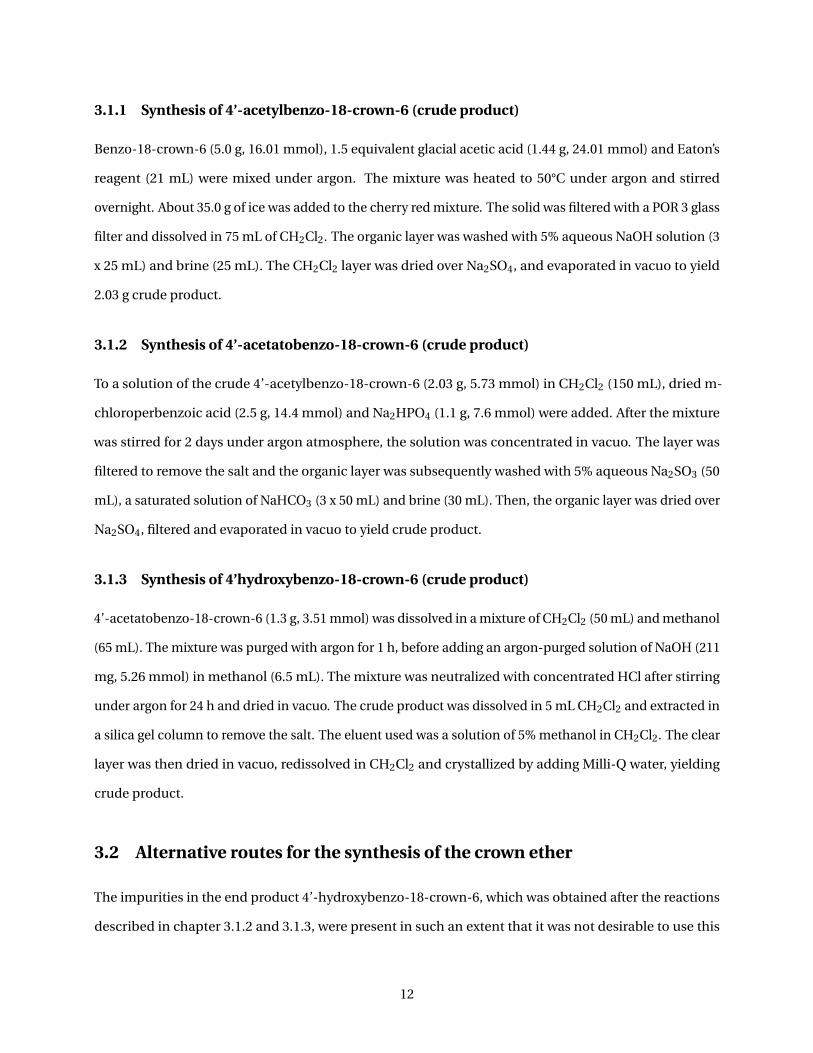
3.1.1 Synthesis of 4’-acetylbenzo-18-crown-6 (crude product)
Benzo-18-crown-6 (5.0 g, 16.01 mmol), 1.5 equivalent glacial acetic acid (1.44 g, 24.01 mmol) and Eaton’s
reagent (21 mL) were mixed under argon. The mixture was heated to 50°C under argon and stirred
overnight. About 35.0 g of ice was added to the cherry red mixture. The solid was filtered with a POR 3 glass
filter and dissolved in 75 mL of CH2Cl2. The organic layer was washed with 5% aqueous NaOH solution (3
x 25 mL) and brine (25 mL). The CH2Cl2 layer was dried over Na2SO4, and evaporated in vacuo to yield
2.03 g crude product.
3.1.2 Synthesis of 4’-acetatobenzo-18-crown-6 (crude product)
To a solution of the crude 4’-acetylbenzo-18-crown-6 (2.03 g, 5.73 mmol) in CH2Cl2 (150 mL), dried m-
chloroperbenzoic acid (2.5 g, 14.4 mmol) and Na2HPO4 (1.1 g, 7.6 mmol) were added. After the mixture
was stirred for 2 days under argon atmosphere, the solution was concentrated in vacuo. The layer was
filtered to remove the salt and the organic layer was subsequently washed with 5% aqueous Na2SO3 (50
mL), a saturated solution of NaHCO3 (3 x 50 mL) and brine (30 mL). Then, the organic layer was dried over
Na2SO4, filtered and evaporated in vacuo to yield crude product.
3.1.3 Synthesis of 4’hydroxybenzo-18-crown-6 (crude product)
4’-acetatobenzo-18-crown-6 (1.3 g, 3.51 mmol) was dissolved in a mixture of CH2Cl2 (50 mL) and methanol
(65 mL). The mixture was purged with argon for 1 h, before adding an argon-purged solution of NaOH (211
mg, 5.26 mmol) in methanol (6.5 mL). The mixture was neutralized with concentrated HCl after stirring
under argon for 24 h and dried in vacuo. The crude product was dissolved in 5 mL CH2Cl2 and extracted in
a silica gel column to remove the salt. The eluent used was a solution of 5% methanol in CH2Cl2. The clear
layer was then dried in vacuo, redissolved in CH2Cl2 and crystallized by adding Milli-Q water, yielding
crude product.
3.2 Alternative routes for the synthesis of the crown ether
The impurities in the end product 4’-hydroxybenzo-18-crown-6, which was obtained after the reactions
described in chapter 3.1.2 and 3.1.3, were present in such an extent that it was not desirable to use this
12
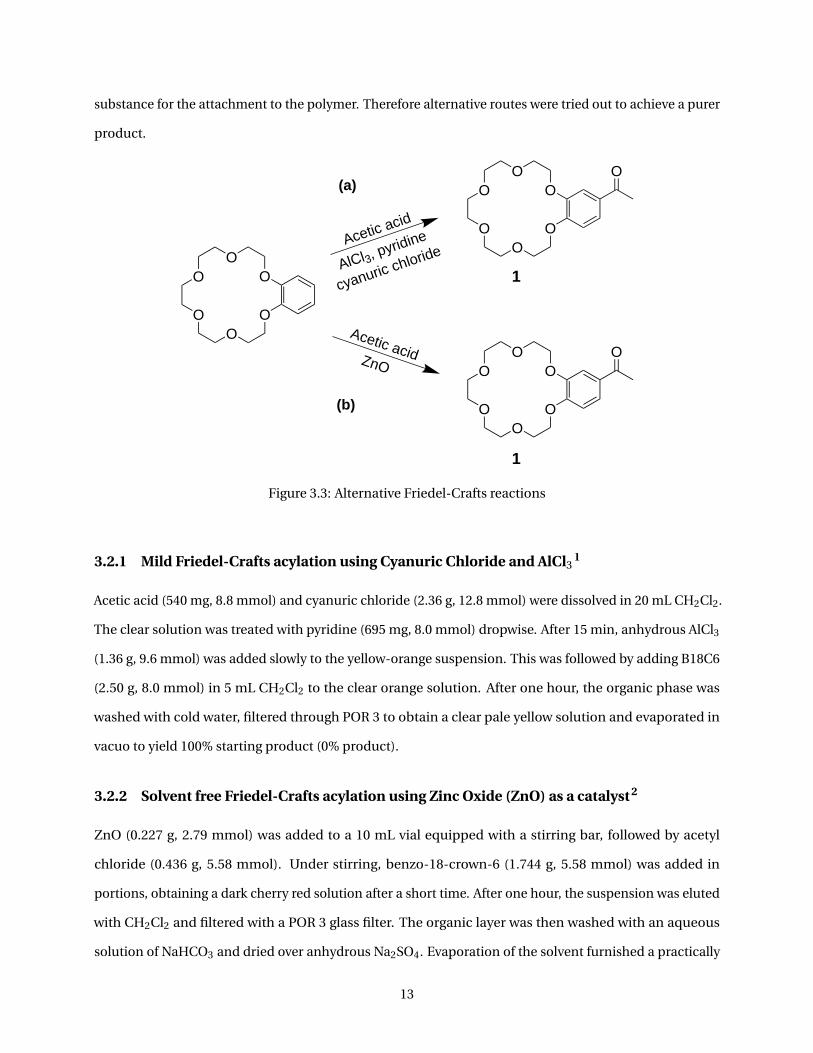
substance for the attachment to the polymer. Therefore alternative routes were tried out to achieve a purer
product.
OO
O
OOO
Acetic acid
AlCl3, pyridine
cyanuric chloride
OO
O
O OO O
1
Acetic acid
OO
O
O OO O
1
ZnO
(a)
(b)
Figure 3.3: Alternative Friedel-Crafts reactions
3.2.1 Mild Friedel-Crafts acylation using Cyanuric Chloride and AlCl31
Acetic acid (540 mg, 8.8 mmol) and cyanuric chloride (2.36 g, 12.8 mmol) were dissolved in 20 mL CH2Cl2.
The clear solution was treated with pyridine (695 mg, 8.0 mmol) dropwise. After 15 min, anhydrous AlCl3
(1.36 g, 9.6 mmol) was added slowly to the yellow-orange suspension. This was followed by adding B18C6
(2.50 g, 8.0 mmol) in 5 mL CH2Cl2 to the clear orange solution. After one hour, the organic phase was
washed with cold water, filtered through POR 3 to obtain a clear pale yellow solution and evaporated in
vacuo to yield 100% starting product (0% product).
3.2.2 Solvent free Friedel-Crafts acylation using Zinc Oxide (ZnO) as a catalyst2
ZnO (0.227 g, 2.79 mmol) was added to a 10 mL vial equipped with a stirring bar, followed by acetyl
chloride (0.436 g, 5.58 mmol). Under stirring, benzo-18-crown-6 (1.744 g, 5.58 mmol) was added in
portions, obtaining a dark cherry red solution after a short time. After one hour, the suspension was eluted
with CH2Cl2 and filtered with a POR 3 glass filter. The organic layer was then washed with an aqueous
solution of NaHCO3 and dried over anhydrous Na2SO4. Evaporation of the solvent furnished a practically
13
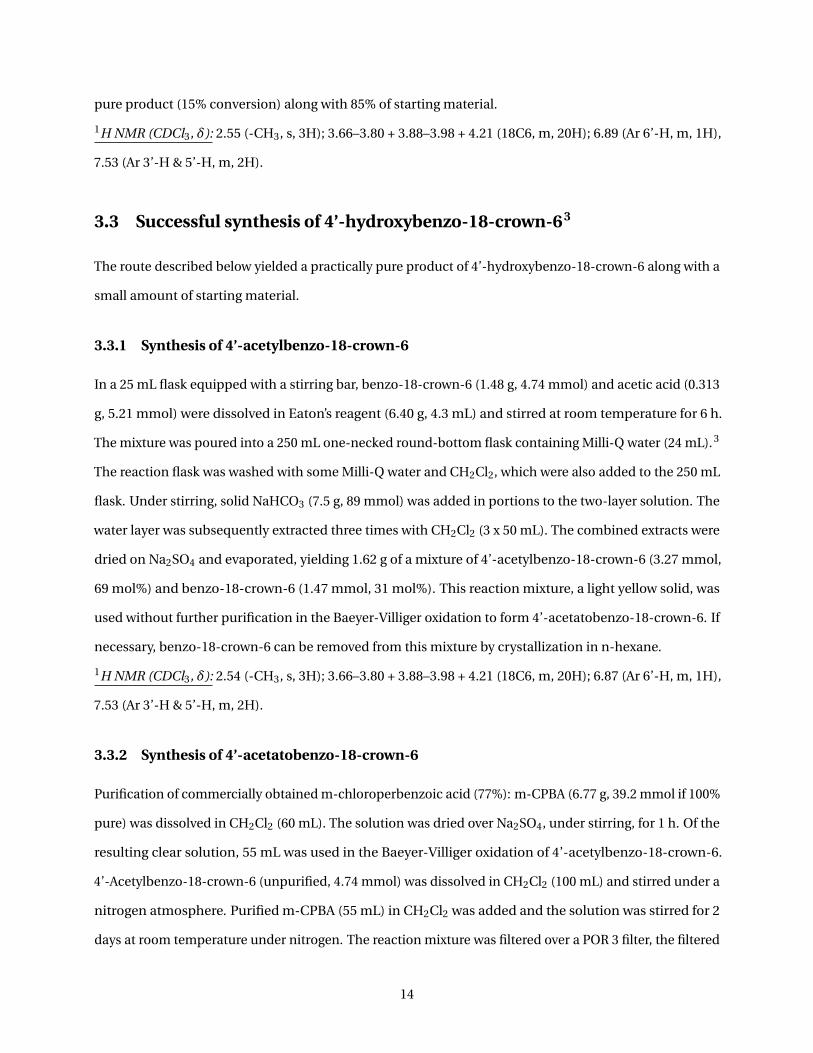
pure product (15% conversion) along with 85% of starting material.
1H NMR (CDCl3, δ): 2.55 (-CH3, s, 3H); 3.66–3.80 + 3.88–3.98 + 4.21 (18C6, m, 20H); 6.89 (Ar 6’-H, m, 1H),
7.53 (Ar 3’-H & 5’-H, m, 2H).
3.3 Successful synthesis of 4’-hydroxybenzo-18-crown-63
The route described below yielded a practically pure product of 4’-hydroxybenzo-18-crown-6 along with a
small amount of starting material.
3.3.1 Synthesis of 4’-acetylbenzo-18-crown-6
In a 25 mL flask equipped with a stirring bar, benzo-18-crown-6 (1.48 g, 4.74 mmol) and acetic acid (0.313
g, 5.21 mmol) were dissolved in Eaton’s reagent (6.40 g, 4.3 mL) and stirred at room temperature for 6 h.
The mixture was poured into a 250 mL one-necked round-bottom flask containing Milli-Q water (24 mL). 3
The reaction flask was washed with some Milli-Q water and CH2Cl2, which were also added to the 250 mL
flask. Under stirring, solid NaHCO3 (7.5 g, 89 mmol) was added in portions to the two-layer solution. The
water layer was subsequently extracted three times with CH2Cl2 (3 x 50 mL). The combined extracts were
dried on Na2SO4 and evaporated, yielding 1.62 g of a mixture of 4’-acetylbenzo-18-crown-6 (3.27 mmol,
69 mol%) and benzo-18-crown-6 (1.47 mmol, 31 mol%). This reaction mixture, a light yellow solid, was
used without further purification in the Baeyer-Villiger oxidation to form 4’-acetatobenzo-18-crown-6. If
necessary, benzo-18-crown-6 can be removed from this mixture by crystallization in n-hexane.
1H NMR (CDCl3, δ): 2.54 (-CH3, s, 3H); 3.66–3.80 + 3.88–3.98 + 4.21 (18C6, m, 20H); 6.87 (Ar 6’-H, m, 1H),
7.53 (Ar 3’-H & 5’-H, m, 2H).
3.3.2 Synthesis of 4’-acetatobenzo-18-crown-6
Purification of commercially obtained m-chloroperbenzoic acid (77%): m-CPBA (6.77 g, 39.2 mmol if 100%
pure) was dissolved in CH2Cl2 (60 mL). The solution was dried over Na2SO4, under stirring, for 1 h. Of the
resulting clear solution, 55 mL was used in the Baeyer-Villiger oxidation of 4’-acetylbenzo-18-crown-6.
4’-Acetylbenzo-18-crown-6 (unpurified, 4.74 mmol) was dissolved in CH2Cl2 (100 mL) and stirred under a
nitrogen atmosphere. Purified m-CPBA (55 mL) in CH2Cl2 was added and the solution was stirred for 2
days at room temperature under nitrogen. The reaction mixture was filtered over a POR 3 filter, the filtered
14
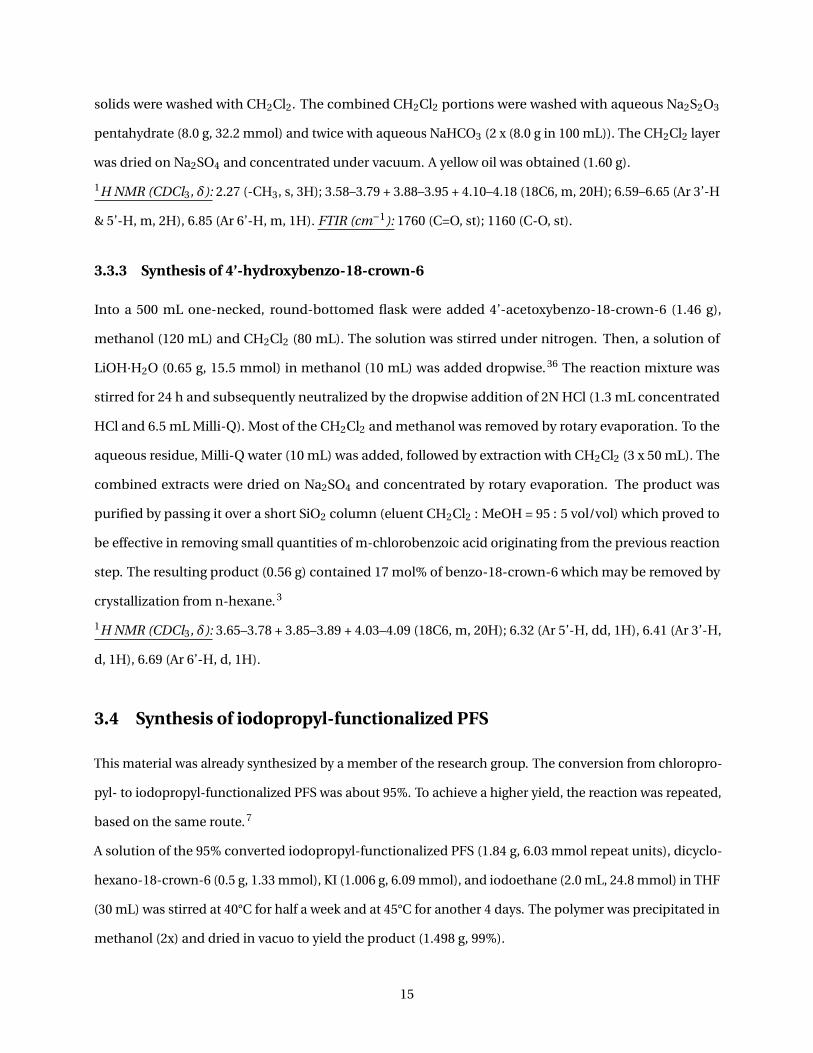
solids were washed with CH2Cl2. The combined CH2Cl2 portions were washed with aqueous Na2S2O3
pentahydrate (8.0 g, 32.2 mmol) and twice with aqueous NaHCO3 (2 x (8.0 g in 100 mL)). The CH2Cl2 layer
was dried on Na2SO4 and concentrated under vacuum. A yellow oil was obtained (1.60 g).
1H NMR (CDCl3, δ): 2.27 (-CH3, s, 3H); 3.58–3.79 + 3.88–3.95 + 4.10–4.18 (18C6, m, 20H); 6.59–6.65 (Ar 3’-H
& 5’-H, m, 2H), 6.85 (Ar 6’-H, m, 1H). FTIR (cm−1): 1760 (C=O, st); 1160 (C-O, st).
3.3.3 Synthesis of 4’-hydroxybenzo-18-crown-6
Into a 500 mL one-necked, round-bottomed flask were added 4’-acetoxybenzo-18-crown-6 (1.46 g),
methanol (120 mL) and CH2Cl2 (80 mL). The solution was stirred under nitrogen. Then, a solution of
LiOH·H2O (0.65 g, 15.5 mmol) in methanol (10 mL) was added dropwise.36 The reaction mixture was
stirred for 24 h and subsequently neutralized by the dropwise addition of 2N HCl (1.3 mL concentrated
HCl and 6.5 mL Milli-Q). Most of the CH2Cl2 and methanol was removed by rotary evaporation. To the
aqueous residue, Milli-Q water (10 mL) was added, followed by extraction with CH2Cl2 (3 x 50 mL). The
combined extracts were dried on Na2SO4 and concentrated by rotary evaporation. The product was
purified by passing it over a short SiO2 column (eluent CH2Cl2 : MeOH = 95 : 5 vol/vol) which proved to
be effective in removing small quantities of m-chlorobenzoic acid originating from the previous reaction
step. The resulting product (0.56 g) contained 17 mol% of benzo-18-crown-6 which may be removed by
crystallization from n-hexane. 3
1H NMR (CDCl3, δ): 3.65–3.78 + 3.85–3.89 + 4.03–4.09 (18C6, m, 20H); 6.32 (Ar 5’-H, dd, 1H), 6.41 (Ar 3’-H,
d, 1H), 6.69 (Ar 6’-H, d, 1H).
3.4 Synthesis of iodopropyl-functionalized PFS
This material was already synthesized by a member of the research group. The conversion from chloropro-
pyl- to iodopropyl-functionalized PFS was about 95%. To achieve a higher yield, the reaction was repeated,
based on the same route. 7
A solution of the 95% converted iodopropyl-functionalized PFS (1.84 g, 6.03 mmol repeat units), dicyclo-
hexano-18-crown-6 (0.5 g, 1.33 mmol), KI (1.006 g, 6.09 mmol), and iodoethane (2.0 mL, 24.8 mmol) in THF
(30 mL) was stirred at 40°C for half a week and at 45°C for another 4 days. The polymer was precipitated in
methanol (2x) and dried in vacuo to yield the product (1.498 g, 99%).
15
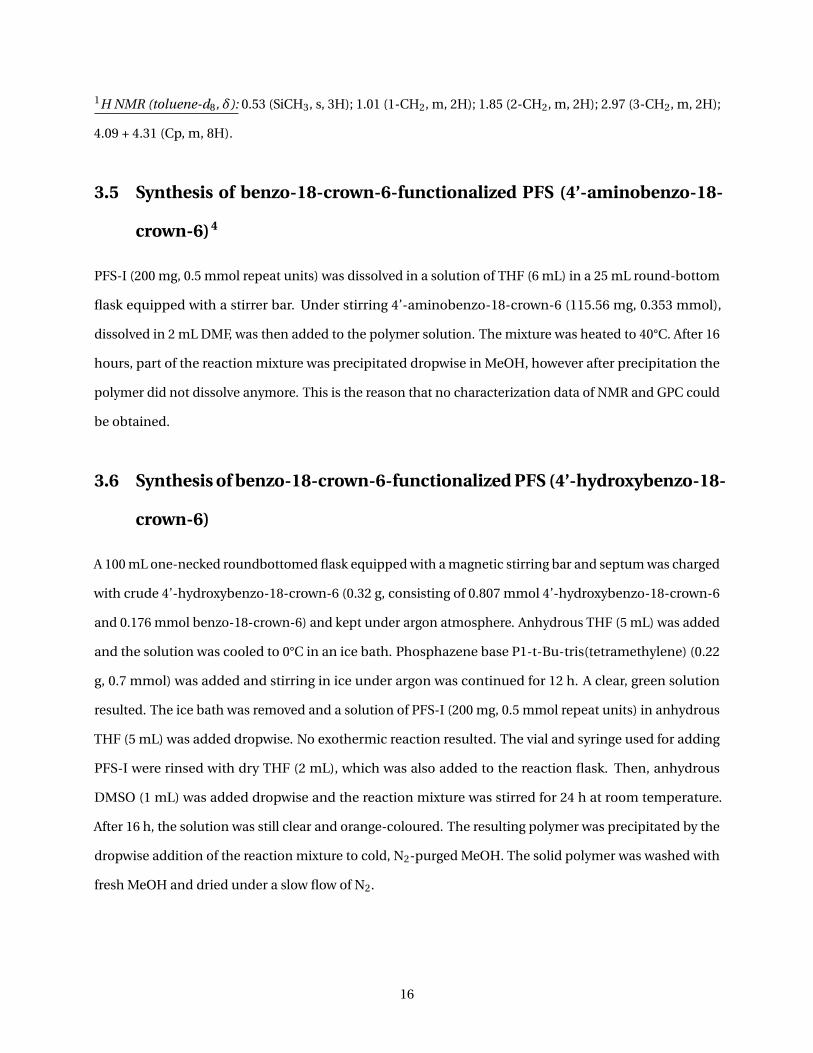
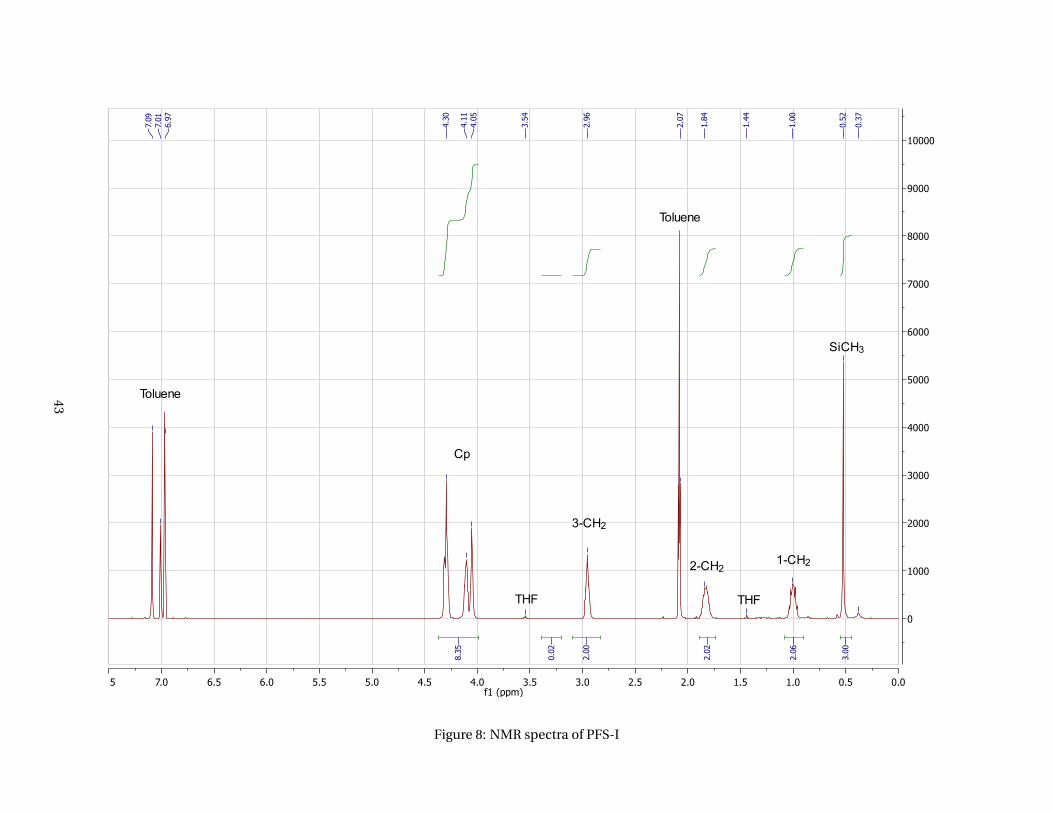
1H NMR (toluene-d8, δ): 0.53 (SiCH3, s, 3H); 1.01 (1-CH2, m, 2H); 1.85 (2-CH2, m, 2H); 2.97 (3-CH2, m, 2H);
4.09 + 4.31 (Cp, m, 8H).
3.5 Synthesis of benzo-18-crown-6-functionalized PFS (4’-aminobenzo-18-
crown-6)4
PFS-I (200 mg, 0.5 mmol repeat units) was dissolved in a solution of THF (6 mL) in a 25 mL round-bottom
flask equipped with a stirrer bar. Under stirring 4’-aminobenzo-18-crown-6 (115.56 mg, 0.353 mmol),
dissolved in 2 mL DMF, was then added to the polymer solution. The mixture was heated to 40°C. After 16
hours, part of the reaction mixture was precipitated dropwise in MeOH, however after precipitation the
polymer did not dissolve anymore. This is the reason that no characterization data of NMR and GPC could
be obtained.
3.6 Synthesis of benzo-18-crown-6-functionalized PFS (4’-hydroxybenzo-18-
crown-6)
A 100 mL one-necked roundbottomed flask equipped with a magnetic stirring bar and septum was charged
with crude 4’-hydroxybenzo-18-crown-6 (0.32 g, consisting of 0.807 mmol 4’-hydroxybenzo-18-crown-6
and 0.176 mmol benzo-18-crown-6) and kept under argon atmosphere. Anhydrous THF (5 mL) was added
and the solution was cooled to 0°C in an ice bath. Phosphazene base P1-t-Bu-tris(tetramethylene) (0.22
g, 0.7 mmol) was added and stirring in ice under argon was continued for 12 h. A clear, green solution
resulted. The ice bath was removed and a solution of PFS-I (200 mg, 0.5 mmol repeat units) in anhydrous
THF (5 mL) was added dropwise. No exothermic reaction resulted. The vial and syringe used for adding
PFS-I were rinsed with dry THF (2 mL), which was also added to the reaction flask. Then, anhydrous
DMSO (1 mL) was added dropwise and the reaction mixture was stirred for 24 h at room temperature.
After 16 h, the solution was still clear and orange-coloured. The resulting polymer was precipitated by the
dropwise addition of the reaction mixture to cold, N2-purged MeOH. The solid polymer was washed with
fresh MeOH and dried under a slow flow of N2.
16
3.7 Preparation of gold substrates for electrochemical measurements5
Gold electrodes were decorated with PFS-I chains by a simple “grafting to” method. The single modification
steps that needed to be taken to realize covalent attachment of PFS chains to the surfaces up to anchoring
of the crown ethers are described below.
3.7.1 Formation of cysteamine self-assembled monolayers (SAMs)
Gold substrates (100 nm Au on 10 nm Cr on silicon) were cleaned with piranha solution for 30 s and rinsed
with water and ethanol (3x). The cleaned substrates were immersed in 2 mL ethanol solution (containing
0.1 wt% cysteamine) for 16 h. The substrates were rinsed with ethanol and dried in a stream of N2. PFS
attachment needs to be done immediately after.
3.7.2 Surface attachment of PFS chains
A solution of PFS-I in THF (1 mg mL−1, 0.5 mL) was spread out onto the gold surfaces. After 30 min another
0.5 mL of the solution was deposited onto the substrates. They were left to react overnight at 50°C in a
vacuum oven. Physisorbed polymer chains were removed by soaking the PFS-I substrates three times in
THF for 30 min.
3.7.3 Attachment of 4’-aminobenzo-18-crown-6 to PFS modified substrates
The same reaction steps as described in chapter 3.5 were done for the surface attachment of the crown
ether to the substrates.
The PFS-functionalized substrates were immersed in THF (3.75 mL) and the solution was purged with
nitrogen for 20 minutes. 4’-Aminobenzo-18-crown-6 (20 mg, 0.061 mmol) was dissolved in DMF (1.5 mL)
and added to THF solution. They were left to react overnight at 40°C. Some part of the substrates was
rinsed with DMF and THF and dried in a stream of N2 immediately after the reaction. The other part of
the substrates was treated with the base diisopropylethylamine to remove protons present on the nitrogen
creating a positive charge on the atom. After one hour these substrates were rinsed with DMF and THF as
well and then dried in a stream of N2.
17
Chapter 4
Results and Discussion
For successful synthesis of pure 4’-hydroxybenzo-18-crown-6 several attempts were needed. The first
route that was tried did not work for our molecule as it seemed that by-products were formed during the
acylation reaction. These impurities could not be removed in the steps following.
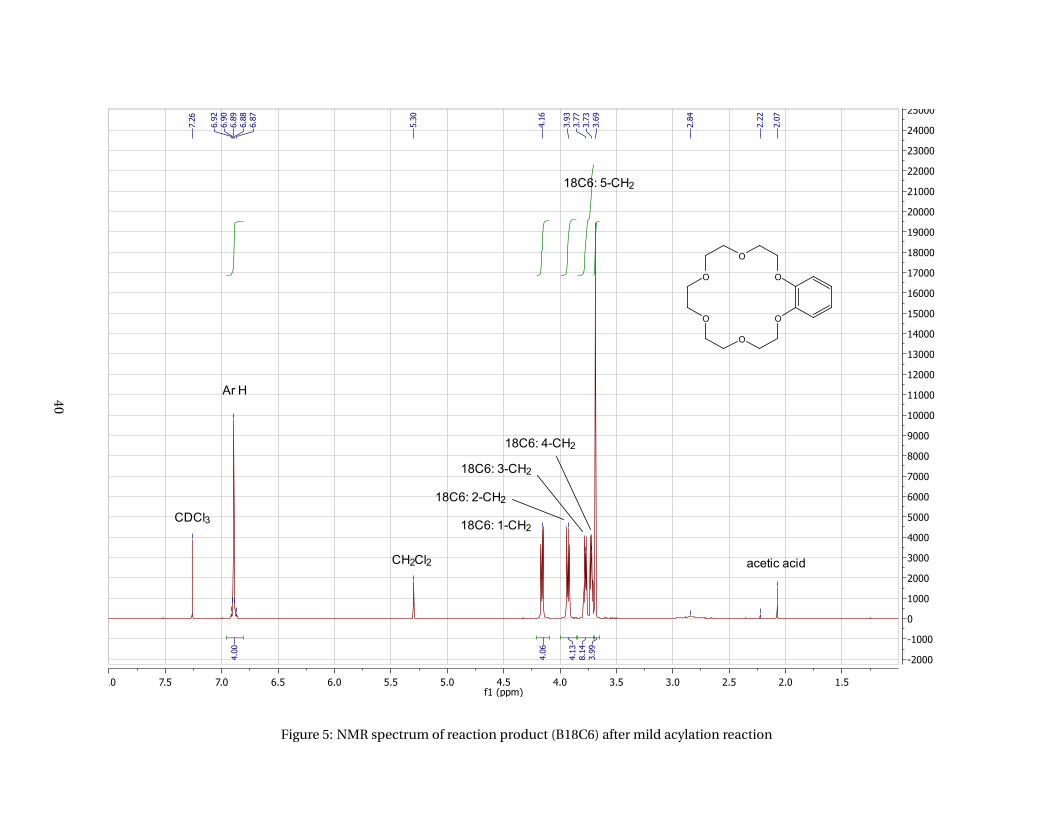
Benzo-18-crown-6, a white solid, did undergo a Friedel-Crafts acylation reaction at 50°C with acetic
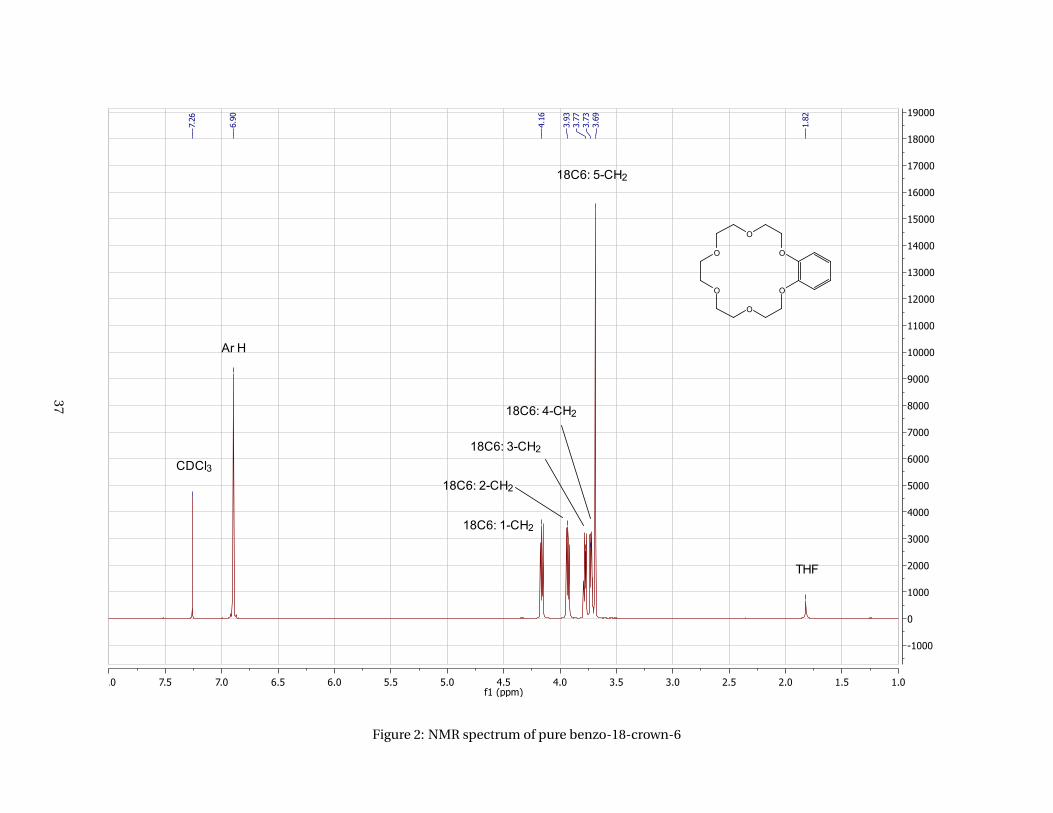
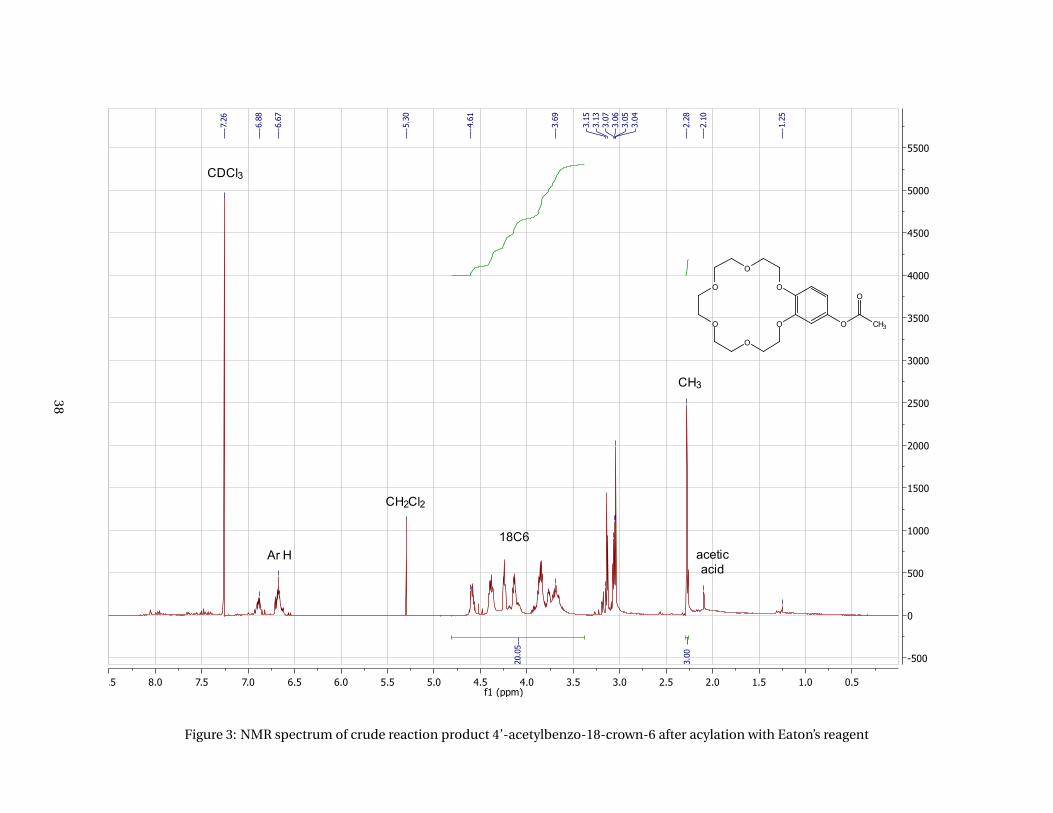
acid and Eaton’s reagent to form a crude product of 4’-acetylbenzo-18-crown-6. The NMR spectrum
(appendices, Figure 3) shows a very broad multiplet from about 3.25 to 4.75 ppm which should have been
simpler and less broad in case pure product had been obtained. An additional multiplet from 2.75 to 3.3
ppm should not be in the spectrum either as these signals do not belong to the benzene ring or crown
ether.
The second synthesis was done starting with this crude product in the hope of losing the impurities in the
next steps. The original workup procedure after the oxidation reaction to form 4’-acetatobenzo-18-crown-6
introduced some problems and because of this the procedure needed some changing.
The salts that were present in the mixture needed to be washed out. Originally this would have been done
by dissolving the product in methanol and then adding CH2Cl2 to the solution, causing precipitation of the
salts. The problem was that nearly no solids precipitated and this washing step needed to be changed. A
good alternative was to use a silica gel column to separate the product from the salts present. The polarity
of the gel causes the less polar product to elute before the polar salts which separates them from each
other. The clear solution which was obtained after the usage of the column was dried in vacuo.
The last washing step was the crystallization of the crude product to yield pure product, however for us
this was not the case. In the first place no crystallization occurred as the obtained products after each
reaction were thick, oily liquids. One of the alternative reactions, described in chapter 3.2.1, showed no
conversion at all and only starting material was present in the mixture. The washed and dried sample did
not form a solid again, however pure benzo-18-crown-6 is a white solid as mentioned above. This meant
18
that it might be possible after all to crystallize the crude product 4’-hydroxybenzo-18-crown-6 to obtain
pure product.
The crude product was first dissolved in CH2Cl2. Oily droplets formed at the wall which did not dissolve (oil
1). The other part of the solution was used for the crystallization in Milli-Q water. Another oily substance
formed at the walls of the flask (oil 2). The solution was filtered first with POR 3 (residue 1) and second
with POR 5 (residue 2) because the filtrate was not a clear solution after the first step. Both solids were
collected and of both oily products and solids an NMR spectrum was taken.
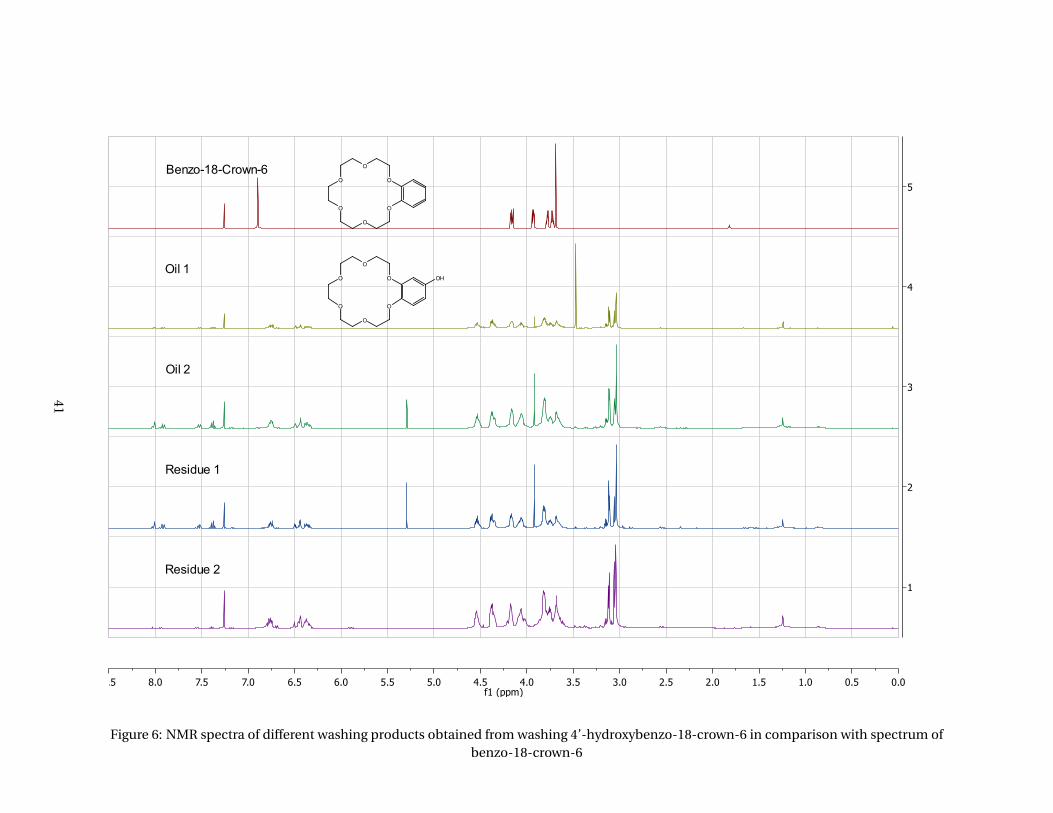
The stacked spectrum, given in the appendices (Figure 6), shows the spectra of all substances obtained
from the washing of the crude product 4’-hydroxybenzo-18-crown-6 and the spectrum of the starting
material benzo-18-crown-6. A wide range of multiplets from 3.67 to 4.45 ppm are visible in spectra 1
to 4, which are the signals from the crown ether. When pure product would have been obtained, these
multiplets would have been much simpler, more looking like the signals as visible in spectrum 5. This
is a sign that by-products are present in all washing products. In addition, all spectra look very much
alike, which means that washing had only very little effect on separation purposes. Another concern
is the multiplet present at 3.08 ppm, which should not be there in the pure product. When looking at
the integration of these multiplets compared to the integration of the signal of the three protons of the
benzene ring (6-7 ppm) the ratio is about the same every time. This probably means that this impurity is
attached to the crown ether. Because of this we decided to use pure 4’-aminobenzo-18-crown-6 instead of
the home-made 4’-hydroxybenzo-18-crown-6 for the attachment to the PFS substrates.
Several alternative routes have been reported in literature to obtain pure acetylbenzo-18-crown-6 with
a high yield. The acylation reaction seems to be a crucial step in the whole reaction sequence from
benzo-18-crown-6 to hydroxybenzo-18-crown-6 with respect to the formation of by-products. For the first
reaction mixture it seems that overacylation took place as no nice signals of the crown ether were observed
and the multiplets were very broad. One of the by-products which can be formed when overacylation
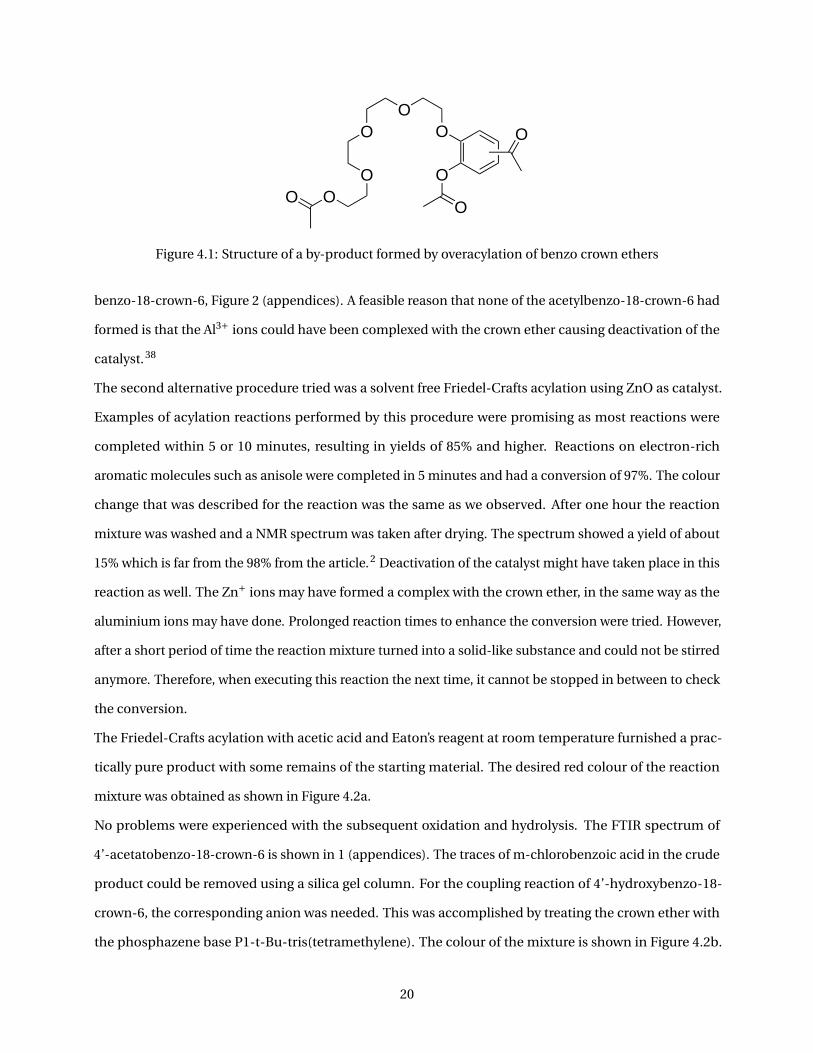
takes place is a triacetyl derivative as shown in Figure 4.1. 37
All methylene groups in the broken ring give a signal with a different shift, which would give a very broad
multiplet. It is possible that during the first reaction a structure as depicted in Figure 4.1 was formed.
The alternative route that was tested first was a mild Friedel-Crafts acylation using cyanuric chloride, and
AlCl3 as catalyst. Everything seemed to go very well with this reaction, however the NMR spectrum, Figure
5 (appendices), indicated that no reaction had taken place as it showed exactly the same signals as for
19
OO
O
OO
O
OOO
Figure 4.1: Structure of a by-product formed by overacylation of benzo crown ethers
benzo-18-crown-6, Figure 2 (appendices). A feasible reason that none of the acetylbenzo-18-crown-6 had
formed is that the Al3+ ions could have been complexed with the crown ether causing deactivation of the
catalyst. 38
The second alternative procedure tried was a solvent free Friedel-Crafts acylation using ZnO as catalyst.
Examples of acylation reactions performed by this procedure were promising as most reactions were
completed within 5 or 10 minutes, resulting in yields of 85% and higher. Reactions on electron-rich
aromatic molecules such as anisole were completed in 5 minutes and had a conversion of 97%. The colour
change that was described for the reaction was the same as we observed. After one hour the reaction
mixture was washed and a NMR spectrum was taken after drying. The spectrum showed a yield of about
15% which is far from the 98% from the article. 2 Deactivation of the catalyst might have taken place in this
reaction as well. The Zn+ ions may have formed a complex with the crown ether, in the same way as the
aluminium ions may have done. Prolonged reaction times to enhance the conversion were tried. However,
after a short period of time the reaction mixture turned into a solid-like substance and could not be stirred
anymore. Therefore, when executing this reaction the next time, it cannot be stopped in between to check
the conversion.
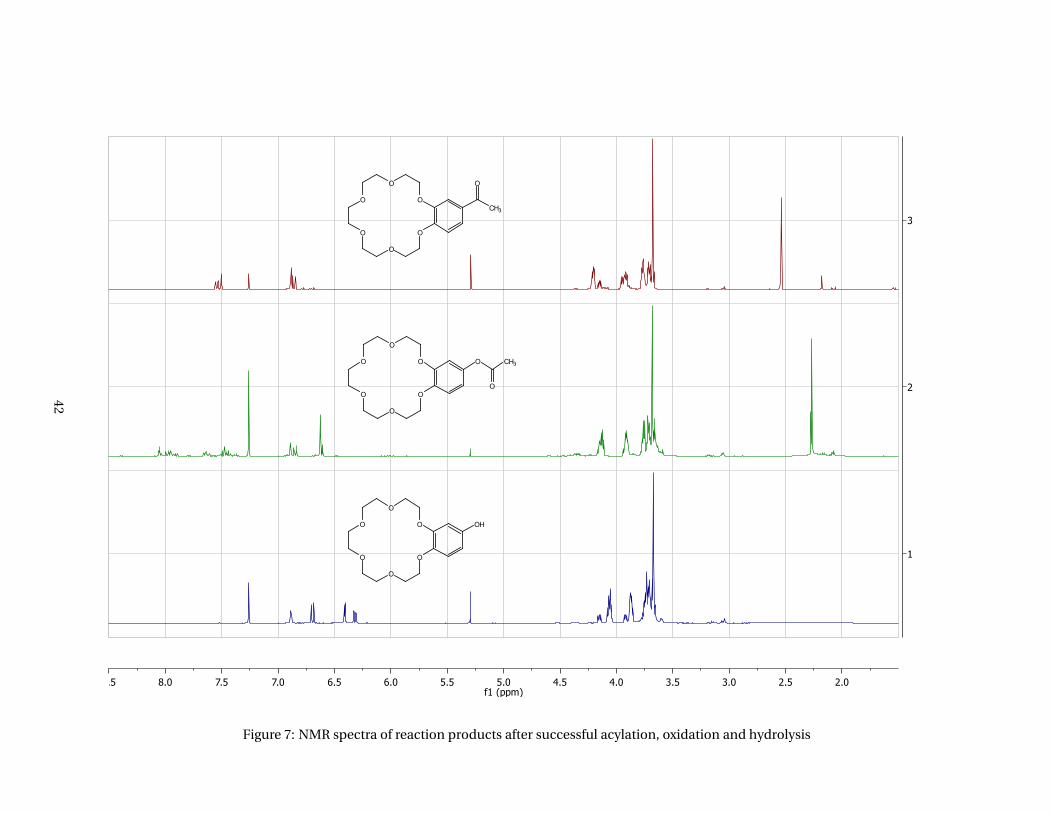
The Friedel-Crafts acylation with acetic acid and Eaton’s reagent at room temperature furnished a prac-
tically pure product with some remains of the starting material. The desired red colour of the reaction
mixture was obtained as shown in Figure 4.2a.
No problems were experienced with the subsequent oxidation and hydrolysis. The FTIR spectrum of
4’-acetatobenzo-18-crown-6 is shown in 1 (appendices). The traces of m-chlorobenzoic acid in the crude
product could be removed using a silica gel column. For the coupling reaction of 4’-hydroxybenzo-18-
crown-6, the corresponding anion was needed. This was accomplished by treating the crown ether with
the phosphazene base P1-t-Bu-tris(tetramethylene). The colour of the mixture is shown in Figure 4.2b.
20
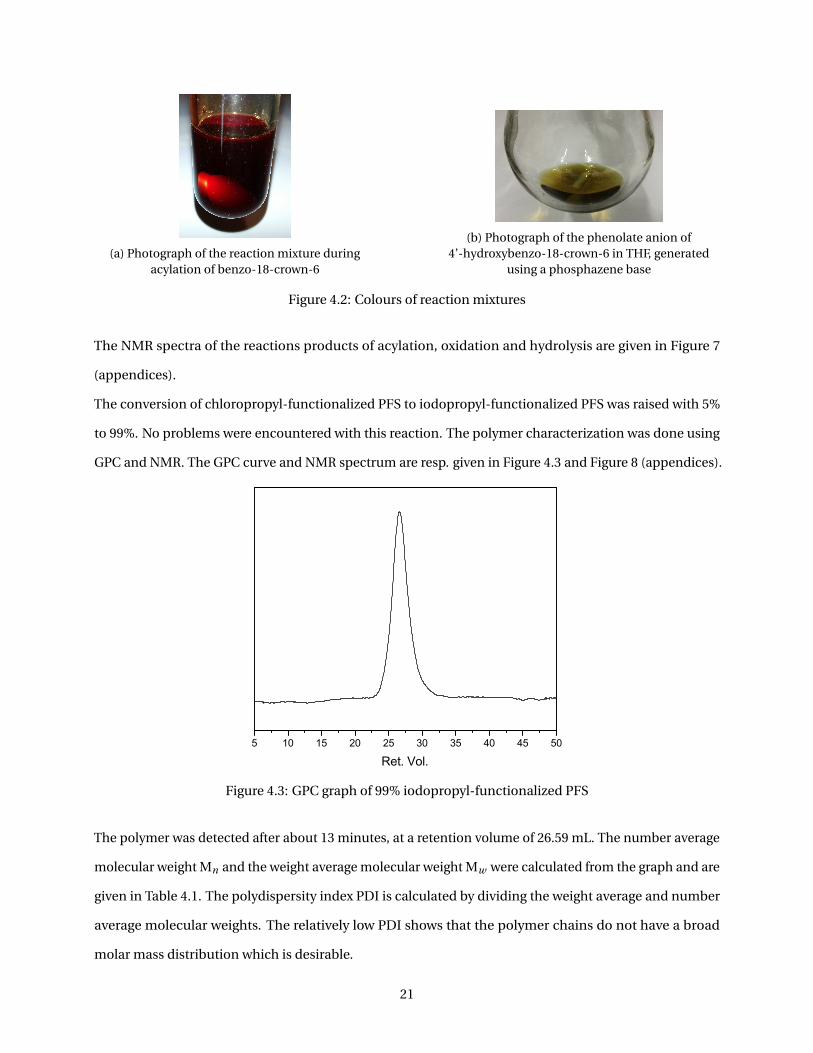
(a) Photograph of the reaction mixture duringacylation of benzo-18-crown-6
(b) Photograph of the phenolate anion of4’-hydroxybenzo-18-crown-6 in THF, generated
using a phosphazene base
Figure 4.2: Colours of reaction mixtures
The NMR spectra of the reactions products of acylation, oxidation and hydrolysis are given in Figure 7
(appendices).
The conversion of chloropropyl-functionalized PFS to iodopropyl-functionalized PFS was raised with 5%
to 99%. No problems were encountered with this reaction. The polymer characterization was done using
GPC and NMR. The GPC curve and NMR spectrum are resp. given in Figure 4.3 and Figure 8 (appendices).
5 10 15 20 25 30 35 40 45 50
Ret. Vol.
Figure 4.3: GPC graph of 99% iodopropyl-functionalized PFS
The polymer was detected after about 13 minutes, at a retention volume of 26.59 mL. The number average
molecular weight Mn and the weight average molecular weight Mw were calculated from the graph and are
given in Table 4.1. The polydispersity index PDI is calculated by dividing the weight average and number
average molecular weights. The relatively low PDI shows that the polymer chains do not have a broad
molar mass distribution which is desirable.
21
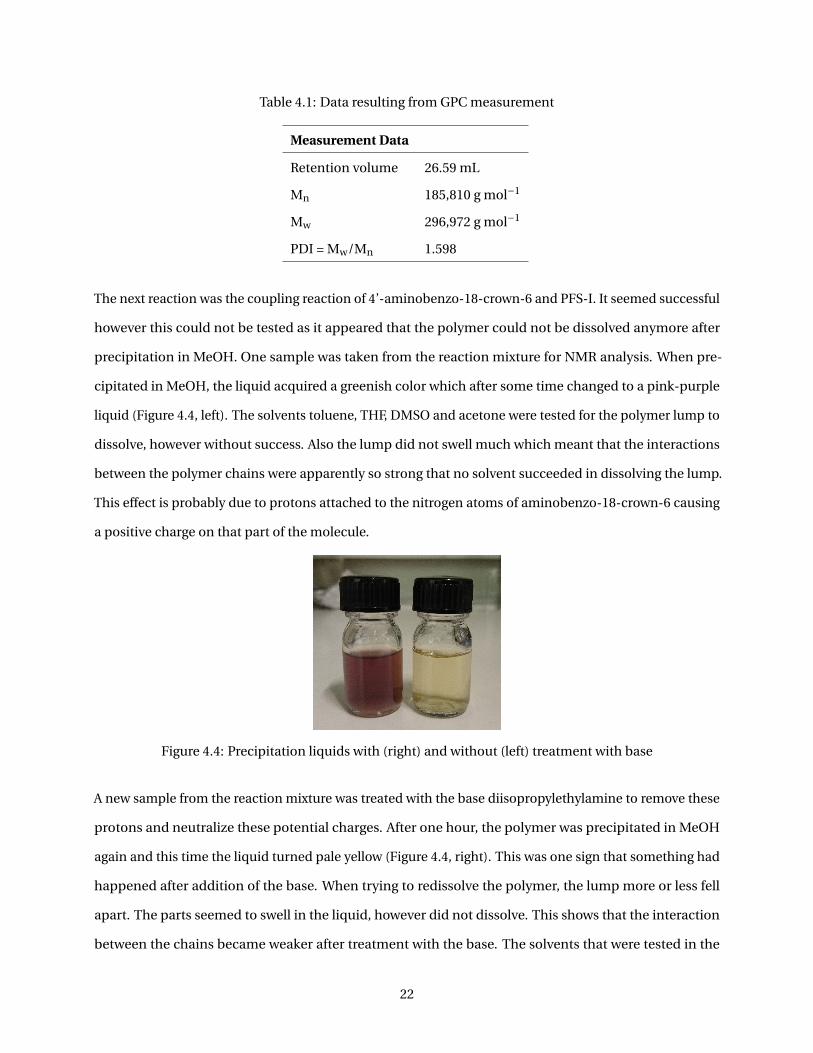
Table 4.1: Data resulting from GPC measurement
Measurement Data
Retention volume 26.59 mL
Mn 185,810 g mol−1
Mw 296,972 g mol−1
PDI = Mw/Mn 1.598
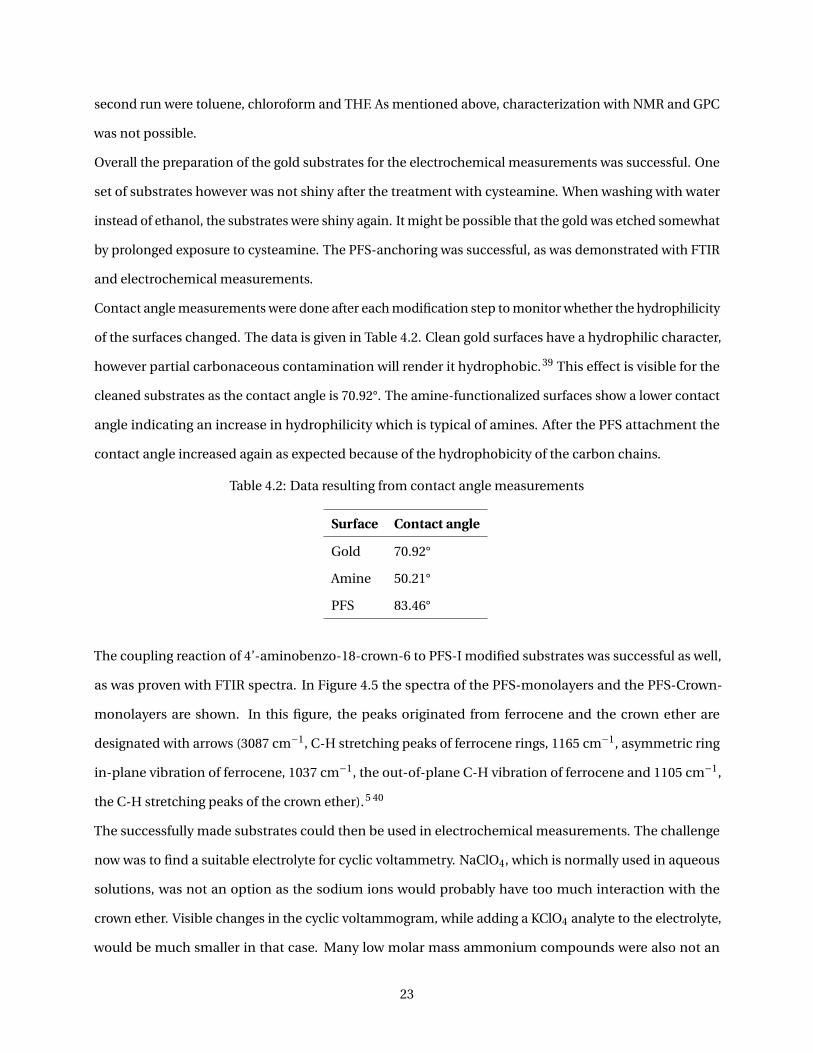
The next reaction was the coupling reaction of 4’-aminobenzo-18-crown-6 and PFS-I. It seemed successful
however this could not be tested as it appeared that the polymer could not be dissolved anymore after
precipitation in MeOH. One sample was taken from the reaction mixture for NMR analysis. When pre-
cipitated in MeOH, the liquid acquired a greenish color which after some time changed to a pink-purple
liquid (Figure 4.4, left). The solvents toluene, THF, DMSO and acetone were tested for the polymer lump to
dissolve, however without success. Also the lump did not swell much which meant that the interactions
between the polymer chains were apparently so strong that no solvent succeeded in dissolving the lump.
This effect is probably due to protons attached to the nitrogen atoms of aminobenzo-18-crown-6 causing
a positive charge on that part of the molecule.
Figure 4.4: Precipitation liquids with (right) and without (left) treatment with base
A new sample from the reaction mixture was treated with the base diisopropylethylamine to remove these
protons and neutralize these potential charges. After one hour, the polymer was precipitated in MeOH
again and this time the liquid turned pale yellow (Figure 4.4, right). This was one sign that something had
happened after addition of the base. When trying to redissolve the polymer, the lump more or less fell
apart. The parts seemed to swell in the liquid, however did not dissolve. This shows that the interaction
between the chains became weaker after treatment with the base. The solvents that were tested in the
22
second run were toluene, chloroform and THF. As mentioned above, characterization with NMR and GPC
was not possible.
Overall the preparation of the gold substrates for the electrochemical measurements was successful. One
set of substrates however was not shiny after the treatment with cysteamine. When washing with water
instead of ethanol, the substrates were shiny again. It might be possible that the gold was etched somewhat
by prolonged exposure to cysteamine. The PFS-anchoring was successful, as was demonstrated with FTIR
and electrochemical measurements.
Contact angle measurements were done after each modification step to monitor whether the hydrophilicity
of the surfaces changed. The data is given in Table 4.2. Clean gold surfaces have a hydrophilic character,
however partial carbonaceous contamination will render it hydrophobic.39 This effect is visible for the
cleaned substrates as the contact angle is 70.92°. The amine-functionalized surfaces show a lower contact
angle indicating an increase in hydrophilicity which is typical of amines. After the PFS attachment the
contact angle increased again as expected because of the hydrophobicity of the carbon chains.
Table 4.2: Data resulting from contact angle measurements
Surface Contact angle
Gold 70.92°
Amine 50.21°
PFS 83.46°
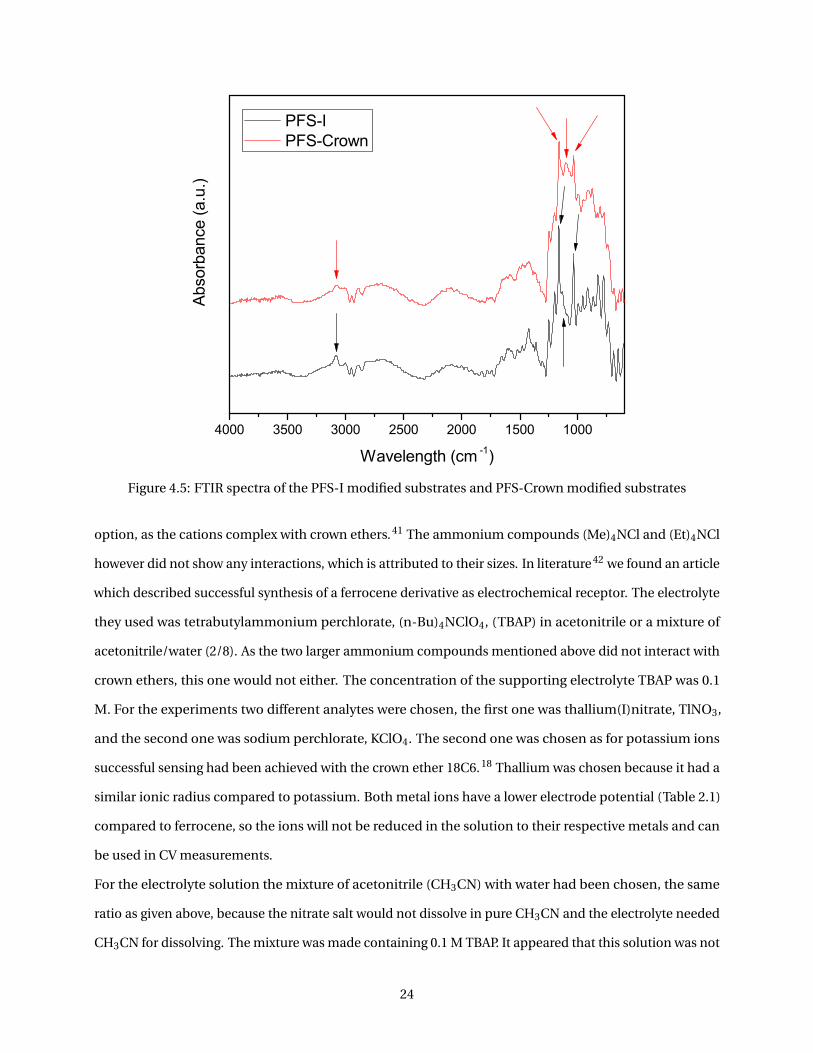
The coupling reaction of 4’-aminobenzo-18-crown-6 to PFS-I modified substrates was successful as well,
as was proven with FTIR spectra. In Figure 4.5 the spectra of the PFS-monolayers and the PFS-Crown-
monolayers are shown. In this figure, the peaks originated from ferrocene and the crown ether are
designated with arrows (3087 cm−1, C-H stretching peaks of ferrocene rings, 1165 cm−1, asymmetric ring
in-plane vibration of ferrocene, 1037 cm−1, the out-of-plane C-H vibration of ferrocene and 1105 cm−1,
the C-H stretching peaks of the crown ether). 5 40
The successfully made substrates could then be used in electrochemical measurements. The challenge
now was to find a suitable electrolyte for cyclic voltammetry. NaClO4, which is normally used in aqueous
solutions, was not an option as the sodium ions would probably have too much interaction with the
crown ether. Visible changes in the cyclic voltammogram, while adding a KClO4 analyte to the electrolyte,
would be much smaller in that case. Many low molar mass ammonium compounds were also not an
23
4000 3500 3000 2500 2000 1500 1000
Abso
rban
ce (a
.u.)
Wavelength (cm -1)
PFS-I PFS-Crown
Figure 4.5: FTIR spectra of the PFS-I modified substrates and PFS-Crown modified substrates
option, as the cations complex with crown ethers. 41 The ammonium compounds (Me)4NCl and (Et)4NCl
however did not show any interactions, which is attributed to their sizes. In literature 42 we found an article
which described successful synthesis of a ferrocene derivative as electrochemical receptor. The electrolyte
they used was tetrabutylammonium perchlorate, (n-Bu)4NClO4, (TBAP) in acetonitrile or a mixture of
acetonitrile/water (2/8). As the two larger ammonium compounds mentioned above did not interact with
crown ethers, this one would not either. The concentration of the supporting electrolyte TBAP was 0.1
M. For the experiments two different analytes were chosen, the first one was thallium(I)nitrate, TlNO3,
and the second one was sodium perchlorate, KClO4. The second one was chosen as for potassium ions
successful sensing had been achieved with the crown ether 18C6. 18 Thallium was chosen because it had a
similar ionic radius compared to potassium. Both metal ions have a lower electrode potential (Table 2.1)
compared to ferrocene, so the ions will not be reduced in the solution to their respective metals and can
be used in CV measurements.
For the electrolyte solution the mixture of acetonitrile (CH3CN) with water had been chosen, the same
ratio as given above, because the nitrate salt would not dissolve in pure CH3CN and the electrolyte needed
CH3CN for dissolving. The mixture was made containing 0.1 M TBAP. It appeared that this solution was not
24
a good choice as two phases formed after mixing. In literature 43 we found that we exceeded the solubility
limit of TBAP when employing a solution with ratio 2/8. In literature this solution must have been made
using a solution of 0.1 M TBAP in pure CH3CN and then adding water to attain the ratio mentioned causing
the concentration of the electrolyte to decrease.
The next attempt was to prepare an electrolyte solution with a ratio of 8/2 since in that case the solubility
limit would not have been exceeded. The electrolyte and analyte solution were obtained well mixed and
could be used for cyclic voltammetry. The concentration of the analyte was 2×10⁻⁴ M. The choice was
based on the surface coverage of the substrates. The aim was to add such quantities of the analyte to the
electrolyte solution that the concentration of the crown ethers and the ions in solution were about the
same.
For the first run, using CH3CN/water (8/2) which contained 0.1 M TBAP, a PFS-modified substrate was
used. The measurement looked fine first, however when repeating, the signals coming from the ferrocene
decreased and after four measurements with 3 runs no remaining signals were left. This was surprising
because in literature surface-anchored films were stable and showed stable signals. It seems that CH3CN in
the solution damages our modified substrates. It probably does not damage the PFS itself, as in literature 42
a ferrocene derivative was tested as well, however it could be that it infringes the cysteamine monolayer,
causing the PFS layer to come off too. This conclusion is drawn as the part of the substrate which had not
been immersed in the solution still showed a good CV when repeating the measurement in NaClO4.
We therefore continued with an aqueous solution. This meant that TBAP could not be used as electrolyte
anymore. To obtain a minimum interaction of the electrolyte solution with the crown ethers attached
of the substrates, LiClO4 was chosen for further measurements. All aqueous solutions were successfully
made and used for measurements on the PFS-Crown ether surfaces.
Two series of measurements were performed, using a low concentration and a higher concentrated
KClO4 analyte, resp. 2×10⁻⁴ M and 3.4×10⁻³ M, as for these ions successful sensing had already been
demonstrated. All measurements were done on the same sample. The first measurement was done in
pure electrolyte, without added potassium ions. After that each time a volume of 6.86 µL, containing
1.4×10⁻⁹ mol K+ ions, was added to the electrochemical cell. The surface coverage of an earlier tested
sample was 1.53×10⁻¹⁰ mol cm−2, calculated using equations 2.2 and 2.3. The starting concentration of
the analyte was chosen to be a little higher than this. The results of the measurements for the analyte with
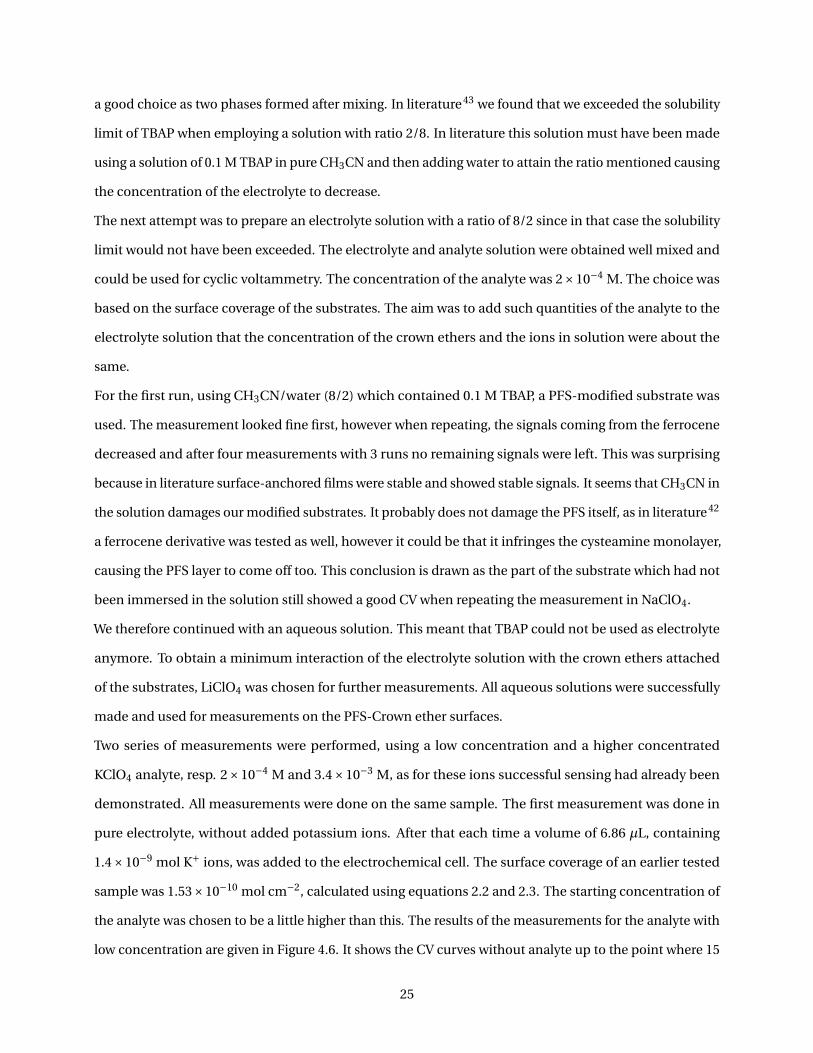
low concentration are given in Figure 4.6. It shows the CV curves without analyte up to the point where 15
25
drops had been added.
0,0 0,2 0,4 0,6 0,8 1,0
-15
-5
5
15
25
-20
-10
0
10
20
30 Without analyte 3 6 9 12 15
Cur
rent
(A)
Potential against Ag/AgCl reference (V)
Figure 4.6: Changes in cyclic voltammograms of PFS-Crown substrates when adding a KClO4 analyte(2.4×10⁻⁴ M) in portions
The peak current of the first and second oxidation peaks, resp. 0.5 and 0.6 V, decrease with each time that
potassium ions are added to the solution while a new peak seems to form around 0.8 V. With an upcoming
new oxidation peak, one would expect a new reduction peak as well however that one is not visible.
Halfway through the series of measurements, the substrate was taken out of the electrochemical cell for
rinsing and afterwards it was put back into the solution. This action probably led to a change in the active
surface area since positioning the substrate exactly the same into the solution is nearly impossible. The
active area is linearly related to the charge, or the current, as shown in equations 2.2 and 2.3, therefore the
divergent shape between the first and last curves at 0 V could be explained. Further explanations on the
changing shape of the CV curves will therefore be done with reference to the second results, where the
higher concentrated analyte was used. Before the second series, the sample was rinsed with Milli-Q water.
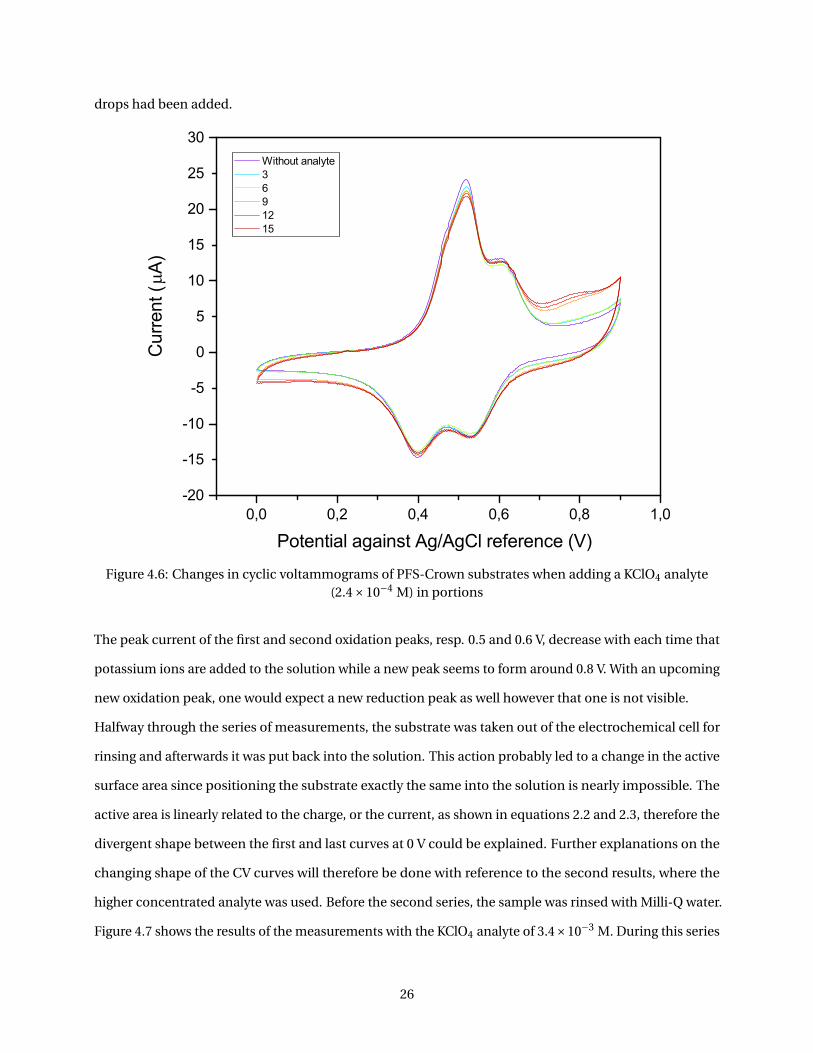
Figure 4.7 shows the results of the measurements with the KClO4 analyte of 3.4×10⁻³ M. During this series
26
no rinsing had been done, so the position of the sample remained the same. This was a good choice
because the graph shows a nice trend where all curves pass through the same point at 0 V.
0,0 0,2 0,4 0,6 0,8 1,0-15
-5
5
15
-10
0
10
20C
urre
nt (
A)
Potential against Ag/AgCl reference (V)
Without analyte 4 8 12 16 20
Figure 4.7: Changes in cyclic voltammograms of PFS-Crown substrates when adding a KClO4 analyte(3.4×10⁻³ M) in portions
The same trend described for the first series of measurements is visible in this experiment. The height
of the first two oxidation peaks decreases as analyte was added to the electrolyte solution and a third
oxidation peak around 0.8 V formed. A new reduction peak was not present in this graph either. The
area underneath the oxidation and reduction current peaks is a measure of the amount of PFS that is
oxidized and reduced. While the two reduction peaks reduce in height, the first peak became broader at
the beginning of the reduction curve. There is a chance that a new reduction peak is present, however due
to overlapping with the first peak it may not be visible. This would explain the effect of the broader peak
after each time that analyte had been added to the solution as the area represents the amount of material
that is reduced. The area of the new oxidation peak must be present somewhere at the reduction side. To
ensure that this observed trend is a real response and to be able to tell whether a reduction peak is or is not
27

present underneath the first visible one, area calculations should be done. It is clear however that adding
analyte to the electrolyte solution results in the forming of a new oxidation signal. The shift towards a
higher potential means that oxidation of the ferrocene becomes harder in the presence of potassium ions.
A logical explanation for this is that the ions complex with the crown ethers which are attached to the PFS
resulting in an increase of positive charge around the ferrocene units and therefore oxidation of ferrocene
itself will be require a higher potential.
28
Chapter 5
Conclusion
Successful synthesis of 4’-hydroxybenzo-18-crown-6 from benzo-18-crown-6 has been achieved by execut-
ing three consecutive reactions, starting with an acylation reaction, followed by an oxidation and finally a
hydrolysis. The first reaction was the crucial step in view of obtaining a clean product. The acylation per-
formed at room temperature using Eaton’s reagent as catalyst yielded 69% of 4’-acetylbenzo-18-crown-6
without by-products. The following two steps, Baeyer-Villiger oxidation and hydrolysis, produced 4’-
hydroxybenzo-18-crown-6 with an overall yield of about 58%. The formed 4’-hydroxybenzo-18-crown-6
contained 17% of unfunctionalized crown ether starting material, which remained present after all wash-
ing steps. A pure product can be obtained by crystallizing it in n-hexane. PFS-crown ether modified
gold substrates were successfully made and with cyclic voltammetry it has been demonstrated that these
electrodes can possibly be used as an electrochemical sensor for potassium ions in aqueous solution as
they do respond to very low potassium ion concentrations in the solution.
29
Chapter 6
Outlook
Many washing steps were needed after the second and third reaction to obtain a mostly pure product of
4’-hydroxybenzo-18-crown-6. The last remainders of m-chlorobenzoic acid which were present in the
crude product could be effectively removed using a silica gel column. This implicates that the number
of extractions done earlier, to remove this compound, can be reduced and at the end a silica gel column
can be used to remove any m-chlorobenzoic acid traces. The addition of this step will simply the washing
procedure. The mostly pure product which still contains some starting material can be crystallized in
n-hexane to wash away the benzo-18-crown-6 and to yield pure 4’-hydroxybenzo-18-crown-6.
The electrochemical measurements have shown some change when adding a KClO4 analyte to the electro-
chemical cell, however compared to literature the change was small. New PFS-Crown ether modified gold
substrates could be made for repeating the measurements already done. Furthermore the samples should
be tested with CV in pure electrolyte, repeating the experiments more times to be able to see whether
the heights of the current peaks decrease with increasing number of measurements as well. Next, the
measurements where analyte is added after every measurement should be done using an analyte with
a higher concentration and finally the samples should be tested in pure analyte. In this last case a big
change in CV curves should be evident as low concentrations of the analyte already show changes as
demonstrated in this study.
The CV curves showed that a new oxidation peak was forming the more analyte was added to the electrolyte
solution. To be able to tell whether a new reduction peak is overlapping with one already present in
the graph, integrations should be done for the different current peaks. The calculated areas will give
information about the relationship between the peaks. To be able to compare this electrochemical system
with the ones found in literature on ferrocene derivatives, bulk measurements should be done. This would
require the synthesis of a PFS polymer featuring benzo-18-crown-6 side groups, accessible by connecting
4’-hydroxybenzo-18-crown-6 groups to PFS-I chains.
30
Bibliography
[1] Cyrous O. Kangani and Billy W. Day. Mild, efficient friedel-Crafts acylations from carboxylic acids
using cyanuric chloride and AlCl3. Organic Letters, 10(13):2645–2648, 2008. doi: 10.1021/ol800752v.
[2] Mona Hosseini Sarvari and Hashem Sharghi. Reactions on a Solid Surface . A Simple , Economical
and Efficient Friedel - Crafts Acylation Reaction over Zinc Oxide ( ZnO ) as a New Catalyst. Journal of
Organic Chemistry, 69:6953–6956, 2004. doi: 10.1021/jo0494477.
[3] W. Wesley Parish, Paul E. Scott, and Calvin W. McCausland. Modified crown ether catalysts. 1.
Synthesis of alkanoyl-, aroyl-, and .alpha.-hydroxyalkylbenzo Crown ethers. Journal of Organic
Chemistry, 43(24):4577–4581, 1978. doi: 10.1021/jo00418a006.
[4] Safdar Hayat, Atta-Ur-Rahman, M. Iqbal Choudhary, Khalid Mohammed Khan, Wilhelm Schumann,
and Ernst Bayer. N-Alkylation of anilines, carboxamides and several nitrogen heterocycles using
CsF-Celite/alkyl halides/CH3CN combination. Tetrahedron, 57(50):9951–9957, 2001. doi: 10.1016/
S0040-4020(01)00989-9.
[5] Xueling Feng. Smart organometallic polymer platforms for redox sensing and as metal nanoparticle
foundry.
[6] Ruoli Sun, Li Wang, Haojie Yu, Zain-ul Abdin, Yongsheng Chen, Jin Huang, and Rongbai Tong.
Molecular Recognition and Sensing Based on Ferrocene Derivatives and Ferrocene-Based Polymers.
Organometallics, 33:4560–4573, 2014. doi: 10.1021/om5000453.
[7] Mark A. Hempenius, Fabiane F. Brito, and G. Julius Vancso. Synthesis and characterization of anionic
and cationic poly(ferrocenylsilane) polyelectrolytes. Macromolecules, 36(17):6683–6688, 2003. doi:
10.1021/ma034432g.
[8] Arunabha Thakur, Sinjinee Sardar, and Sundargopal Ghosh. Click-generated triazole based ferrocene-
carbohydrate bioconjugates: A highly selective multisignalling probe for Cu(II) ions. Journal of
Chemical Sciences, 124(6):1255–1260, 2012. doi: 10.1007/s12039-012-0321-6.
31
[9] Núria Serrano, Andreu González-Calabuig, and Manel del Valle. Crown ether-modified electrodes for
the simultaneous stripping voltammetric determination of Cd(II), Pb(II) and Cu(II). Talanta, 138:
130–137, 2015. doi: 10.1016/j.talanta.2015.01.044.
[10] Vasilios Bellas and Matthias Rehahn. Polyferrocenylsilane-based polymer systems. Angewandte
Chemie - International Edition, 46(27):5082–5104, 2007. doi: 10.1002/anie.200604420.
[11] Xiaofeng Sui, Xueling Feng, Jing Song, Mark a. Hempenius, and G. Julius Vancso. Electrochemical
sensing by surface-immobilized poly(ferrocenylsilane) grafts. Journal of Materials Chemistry, 22(22):
11261–11267, 2012. doi: 10.1039/c2jm30599b.
[12] What is a crown ether? URL http://www.dupont.com/corporate-functions/our-approach/
science/scientists-engineers/awards-and-recognition/articles/pederson/
crown-ether.html.
[13] C D Tran and W Zhang. Luminescence detection of rare-earth ions by energy transfer from coun-
teranion to crown ether-lanthanide ion complexes. Analytical Chemistry, 62(8):835–840, 1990. doi:
10.1021/ac00207a013.
[14] Marc Humphries. Rare Earth Elements : The Global Supply Chain. Technical report, 2013.
[15] M Casimiro, C Popovici, F L Ortiz, and F J Arregui. Europium(III) ion detection in water by a new
luminescent optical fibre sensor. The 14th International Meeting on Chemical Sensors, 14:939–941,
2012. doi: 10.5162/IMCS2012/P1.3.5.
[16] Saisunee Liawruangrath and Singto Sakulkhaemaruethai. Flow Injection Spectrophotometric Deter-
mination of europium using chlortetracycline. Talanta, 59:9–18, 2003. doi: 10.1081/TMA-120017896.
[17] F. a. Shehata, M. F. Attallah, E. H. Borai, M. a. Hilal, and M. M. Abo-Aly. Sorption reaction mechanism
of some hazardous radionuclides from mixed waste by impregnated crown ether onto polymeric
resin. Applied Radiation and Isotopes, 68(2):239–249, 2010. doi: 10.1016/j.apradiso.2009.10.040.
[18] Nicolas Schüwer and Harm Anton Klok. A potassium-selective quartz crystal microbalance sensor
based on crown-ether functionalized polymer brushes. Advanced Materials, 22(30):3251–3255, 2010.
doi: 10.1002/adma.201000377.
32
[19] A J Bard and L R Faulkner. Electrochemical methods: fundamentals and applications.
[20] Electrochemical series. URL http://downloads.gphysics.net/UACh/Medicina/TablasIones.
pdf.
[21] Larry R Faulkner. Understanding electrochemistry: Some distinctive concepts. Journal of Chemical
Education, 60(4):262–264, 1983. doi: 10.1021/ed060p262.
[22] M. Peter. Engineering of surfaces with organometallic poly(ferrocenylsilanes).
[23] Simin Maleknia and Jennifer Brodbelt. Cavity-Size-Dependent Dissociation of Crown
Ether/Ammonium Ion Complexes in the Gas Phase. Journal of the American Chemical Society,
115(8):2837–2843, 1993. doi: 10.1021/ja00060a034.
[24] Yoshiya Inokuchi, Takayuki Ebata, Thomas R. Rizzo, and Oleg V. Boyarkin. Microhydration effects
on the encapsulation of potassium ion by dibenzo-18-crown-6. Journal of the American Chemical
Society, 136(5):1815–1824, 2014. doi: 10.1021/ja4086066.
[25] P Redant. Opsporen van ziektemerkers in biofluids door middel van nmr spectroscopie.
[26] P Y Bruice. Organic Chemistry.
[27] Miquel Feliz, Maria Antònia Molins, Margarida Gairi, Victòria Muñoz Terrero, and Teresa Gonzalez.
Nuclear magnetic resonance. In Handbook of instrumental techniques from CCiTU, pages 1–14.
[28] Susanta Das. Dynamic nuclear magnetic resonance spectroscopy. Technical report, 2004.
[29] J H van der Maas. Basic Infrared Spectroscopy.
[30] J B Bates. Fourier transform infrared spectroscopy. Science, 191(4222):31–37, 1976. doi: 10.1007/
s11120-009-9439-x.
[31] Measurement of Monomolecular Layers Using Specialized FTIR Grazing Angle Accessories, 2005.
[32] Theresa A Hoffard. Grazing-Angle Fourier Transform Infrared Spectroscopy for Surface Cleanliness
Verification. Technical report, 2003.
[33] Donald D. Bly. Gel Permeation Chromatography. Science, 168(3931):527–533, 1970. doi: 10.1126/
science.168.3931.527.
33
[34] Gregory R. Fulmer, Alexander J M Miller, Nathaniel H. Sherden, Hugo E. Gottlieb, Abraham Nudelman,
Brian M. Stoltz, John E. Bercaw, and Karen I. Goldberg. NMR chemical shifts of trace impurities: Com-
mon laboratory solvents, organics, and gases in deuterated solvents relevant to the organometallic
chemist. Organometallics, 29(9):2176–2179, 2010. doi: 10.1021/om100106e.
[35] Jaewook Nam. Synthesis of new separating agents for nuclear materials. PhD thesis, Texas Tech
University, 1998.
[36] B. Dayal, G. Salen, B. Toome, G. S. Tint, S. Shefer, and J. Padia. Lithium hydroxide/aqueous methanol:
Mild reagent for the hydrolysis of bile acid methyl esters. Steroids, 55(5):233–237, 1990. doi: 10.1016/
0039-128X(90)90021-3.
[37] K. Biró, S. Békássy, B. Ágai, and F. Figueras. Heterogeneous catalysis for the acetylation of benzo
crown ethers. Journal of Molecular Catalysis A: Chemical, 151(1-2):179–184, 2000. doi: 10.1016/
S1381-1169(99)00238-1.
[38] F. Wada, R. Arata, T. Goto, K. Kikukawa, and T. Matsuda. New Application of Crown Ethers. III. Synthe-
sis og 4’-Hydroxybenzocrown Ether and Their Bis(benzocrown ether)s Linker be Poly(oxyethylene)
Chain. Bulletin of the Chemical Society of Japan, 53(7):2061–2063, 1980. doi: 10.1246/bcsj.53.2061.
[39] Tennyson Smith. The hydrophilic nature of a clean gold surface. Journal of Colloid and Interface
Science, 75(1):51–55, 1980. doi: 10.1016/0021-9797(80)90348-3.
[40] Ernö Pretsch, Philippe Bühlmann, and Martin Badertscher. Structure determination of organic
compounds. 2009. ISBN 9783540938095. doi: 10.1007/978-3-540-93810-1.
[41] V Rüdiger, H J Schneider, V P Solov’ev, V P Kazachenko, and O a Raevsky. Crown ether-ammonium
complexes: Binding mechanisms and solvent effects. European Journal of Organic Chemistry, (8):
1847–1856, 1999. doi: 10.1002/(SICI)1099-0690(199908)1999:8<1847::AID-EJOC1847>3.0.CO;2-Q.
[42] Arunabha Thakur and Sundargopal Ghosh. An efficient ferrocene derivative as a chromogenic, optical,
and electrochemical receptor for selective recognition of Mercury(II) in an aqueous environment.
Organometallics, 31(3):819–826, 2012. doi: 10.1021/om201073g.
[43] Tetraethylammonium perchlorate. URL http://www.sigmaaldrich.com/catalog/product/
fluka/86646?lang=en®ion=NL.
34

Appendices
35
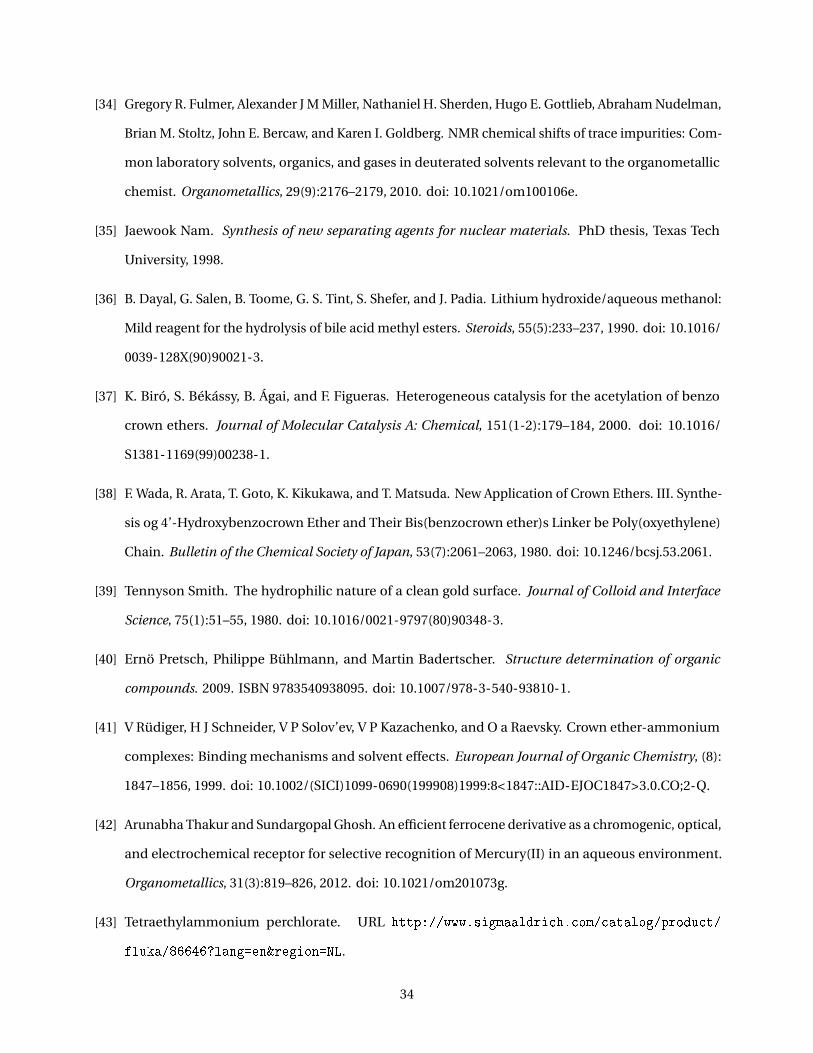
4000 3500 3000 2500 2000 1500 1000 500
Abso
rban
ce (a
.u.)
Wavelength (cm -1)Figure 1: FTIR characterization of 4’-acetatobenzo-18-crown-6
36
1.01.52.02.53.03.54.04.55.05.56.06.57.07.58.0f1 (ppm)
-1000
0
1000
2000
3000
4000
5000
6000
7000
8000
9000
10000
11000
12000
13000
14000
15000
16000
17000
18000
19000
1.82
3.69
3.73
3.77
3.93
4.16
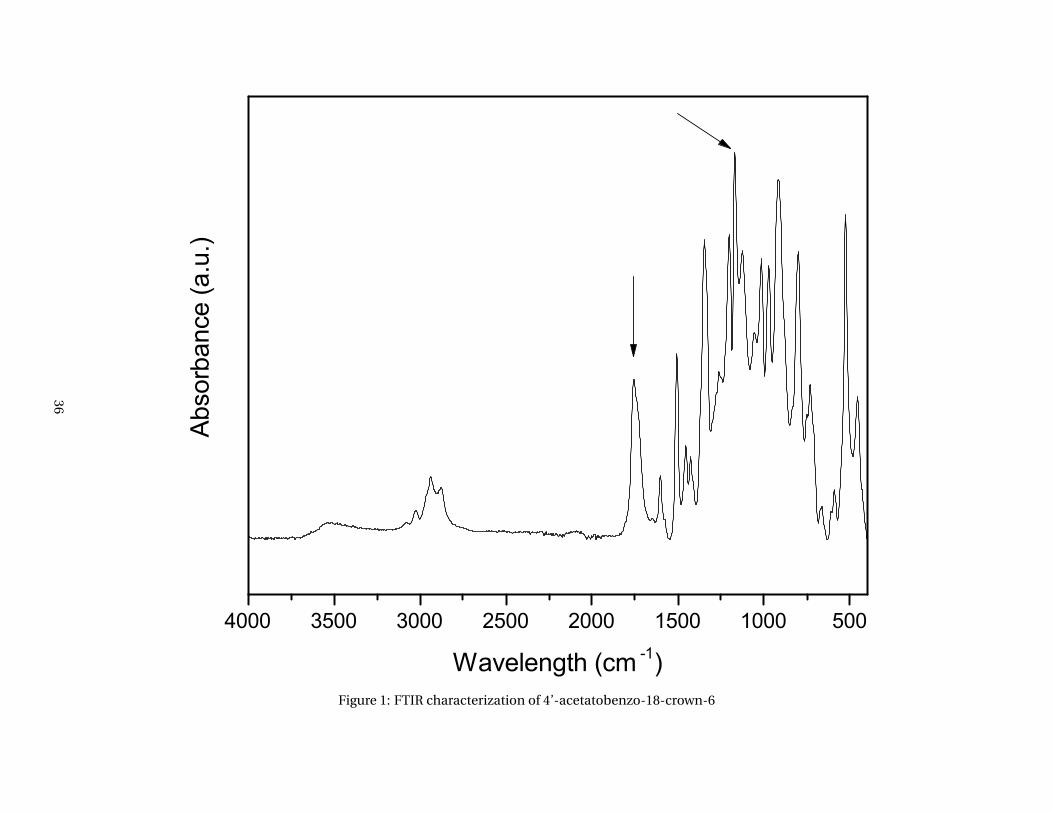
6.90
7.26
CDCl3
Ar H
18C6: 1-CH2
18C6: 2-CH2
18C6: 3-CH2
18C6: 4-CH2
18C6: 5-CH2
THF
O
O
O
O
O
O
Figure 2: NMR spectrum of pure benzo-18-crown-6
37
0.51.01.52.02.53.03.54.04.55.05.56.06.57.07.58.08.5f1 (ppm)
-500
0
500
1000
1500
2000
2500
3000
3500
4000
4500
5000
5500
3.00
20.0
5
1.25
2.10
2.28
3.04
3.05
3.06
3.07
3.13
3.15
3.69
4.61
5.30
6.67
6.88
7.26
CDCl3
CH2Cl2
CH3
18C6Ar H acetic
acid
O
O
O
O
O
O
O CH3
O
Figure 3: NMR spectrum of crude reaction product 4’-acetylbenzo-18-crown-6 after acylation with Eaton’s reagent
38

0.51.01.52.02.53.03.54.04.55.05.56.06.57.07.58.08.5f1 (ppm)
-500
0
500
1000
1500
2000
2500
3000
3500
4000
4500
5000
5500
3.00
20.0
5
1.25
2.10
2.28
3.04
3.05
3.06
3.07
3.13
3.15
3.69
4.61
5.30
6.67
6.88
7.26
CDCl3
CH2Cl2
CH3
18C6Ar CH2 acetic
acid
O
O
O
O
O
O
O CH3
O
Figure 4: NMR spectrum of crude reaction product 4’-acetatobenzo-18-crown-6 after oxidation reaction
39
1.52.02.53.03.54.04.55.05.56.06.57.07.58.0f1 (ppm)
-2000
-1000
0
1000
2000
3000
4000
5000
6000
7000
8000
9000
10000
11000
12000
13000
14000
15000
16000
17000
18000
19000
20000
21000
22000
23000
24000
25000
3.99
8.14
4.13
4.06
4.00
2.07
2.22
2.84
3.69
3.73
3.77
3.93
4.16
5.30
6.87
6.88
6.89
6.90
6.92
7.26
CH2Cl2
CDCl3
acetic acid
Ar H
18C6: 1-CH2
18C6: 2-CH2
18C6: 3-CH2
18C6: 4-CH2
18C6: 5-CH2
O
O
O
O
O
O
Figure 5: NMR spectrum of reaction product (B18C6) after mild acylation reaction
40
0.00.51.01.52.02.53.03.54.04.55.05.56.06.57.07.58.08.5f1 (ppm)
1
2
3
4
5
Benzo-18-Crown-6
Oil 1
Oil 2
Residue 1
Residue 2
O
O
O
O
O
O
O
O
O
O
O
O OH
Figure 6: NMR spectra of different washing products obtained from washing 4’-hydroxybenzo-18-crown-6 in comparison with spectrum ofbenzo-18-crown-6
41
2.02.53.03.54.04.55.05.56.06.57.07.58.08.5f1 (ppm)
1
2
3
O
O
O
O
O
OCH3
O
O
O
O
O
O
O O
O
CH3
O
O
O
O
O
O OH
Figure 7: NMR spectra of reaction products after successful acylation, oxidation and hydrolysis
42
0.00.51.01.52.02.53.03.54.04.55.05.56.06.57.07.5f1 (ppm)
0
1000
2000
3000
4000
5000
6000
7000
8000
9000
10000
3.00
2.06
2.02
2.00
0.02
8.35
0.37
0.52
1.00
1.44
1.84
2.07
2.96
3.54
4.05
4.11
4.30
6.97
7.01
7.09
THF
Toluene
Toluene
SiCH3
1-CH2
3-CH2
2-CH2
THF
Cp
Figure 8: NMR spectra of PFS-I
43