Embed Size (px)
Citation preview

This is a repository copy of Reclamation of reactive metal oxides from complex minerals using alkali roasting and leaching- an improved approach to process engineering.
White Rose Research Online URL for this paper:http://eprints.whiterose.ac.uk/84078/
Version: Accepted Version
Article:
Sanchez Segado, S, Makanyire, T, Escudero-Castejon, L et al. (2 more authors) (2015) Reclamation of reactive metal oxides from complex minerals using alkali roasting and leaching- an improved approach to process engineering. Green Chemistry, 17 (4). 2059 - 2080. ISSN 1463-9262
https://doi.org/10.1039/C4GC02360A
[email protected]://eprints.whiterose.ac.uk/
Reuse
Unless indicated otherwise, fulltext items are protected by copyright with all rights reserved. The copyright exception in section 29 of the Copyright, Designs and Patents Act 1988 allows the making of a single copy solely for the purpose of non-commercial research or private study within the limits of fair dealing. The publisher or other rights-holder may allow further reproduction and re-use of this version - refer to the White Rose Research Online record for this item. Where records identify the publisher as the copyright holder, users can verify any specific terms of use on the publisher’s website.
Takedown
If you consider content in White Rose Research Online to be in breach of UK law, please notify us by emailing [email protected] including the URL of the record and the reason for the withdrawal request.

This is an Accepted Manuscript, which has been through the
Royal Society of Chemistry peer review process and has been
accepted for publication.
Accepted Manuscripts are published online shortly after
acceptance, before technical editing, formatting and proof reading.
Using this free service, authors can make their results available
to the community, in citable form, before we publish the edited
article. We will replace this Accepted Manuscript with the edited
and formatted Advance Article as soon as it is available.
You can find more information about Accepted Manuscripts in the
Information for Authors.
Please note that technical editing may introduce minor changes
to the text and/or graphics, which may alter content. The journal’s
standard Terms & Conditions and the Ethical guidelines still
apply. In no event shall the Royal Society of Chemistry be held
responsible for any errors or omissions in this Accepted Manuscript
or any consequences arising from the use of any information it
contains.
Accepted Manuscript
GreenChemistry
www.rsc.org/greenchem
View Article OnlineView Journal
This article can be cited before page numbers have been issued, to do this please use: S. Sanchez-
Segado, T. Makanyire, L. Escudero-Castejon, Y. R. S. Hara and A. Jha, Green Chem., 2015, DOI:

This review highlights the alkali roasting of aluminium, chromium and titanium minerals as an
alternative to mitigate the environmental pressure associated with their mineral processing.
Cr
Al2O3
Cr2O3
TiO2 ��������������
�������
��������
�������
��������
Al
Ti
Page 1 of 28 Green Chemistry
GreenChemistryAcceptedManuscript
Publ
ishe
d on
10
Mar
ch 2
015.
Dow
nloa
ded
by U
nive
rsity
of
Lee
ds o
n 10
/03/
2015
10:
04:3
4.
View Article Online
DOI: 10.1039/C4GC02360A

Journal Name
��������������� �� ���� �� ��
�������������������
��������������������►
����������
����!�"��������#� ���$�����%��������&�����������'����(� ��������)�'����()��� ��)� * ��+��
������������ ��������������������� ������������ ����
������������ ������������������������ ������� ������
� ���������� ���
�������������������������� �
������ ����� �!����"
���#��$� �
������%��&��
��
'������� ��� �����5
��������������� ����������������������������������������������������������� !"���#��$%��&�����$��$ '�
���������������� ����������� ��� ������
()*+�,-�,-./01------��
In nature, commonly occurring reactive metal oxides of titanium, chromium, aluminium, and
vanadium often chemically combine with the transition metal oxides, such as iron oxides and 10
form complex minerals. Physico"chemical separation of transition metal oxides from the
remaining reactive metal oxides is therefore an important step in the purification of reactive
oxide constituents. Each purification step is quite demanding in energy at present. Current
practice in industry yields sulphate and neutralized chloride waste from titanium dioxide
enrichment, red mud from bauxite refining, slag and leach residues from vanadium extraction 15
and chromite ore process residue (COPR) from chromate processes. In this review article, a
novel alkali"based oxidative roasting and aqueous leaching for the extraction of mineral
oxides is explained in the context of original work of Le Chatelier in 18501,2, which was
unsuccessful in the industrialization of bauxite processing for alumina extraction. However,
much later in the 19th century the alkali"based oxidative mineral roasting was successfully 20
developed for industrial scale manufacturing of chromate chemicals, which yields COPR.
The crystal chemistry of mineral oxides, namely alumina, titanium dioxide, and chromium
oxide in naturally occurring minerals is briefly reviewed in the context of chemical
extraction, which is then developed as a model for developing thermodynamic chemical
equilibrium principles for analyzing the physical separation and enrichment of such reactive 25
metal oxides by forming water"soluble and water"insoluble alkali complexes. The implication
of alkali roasting chemistry of non"magnetic titaniferous mineral waste is also reported for
the initial separation of rare"earth oxide mixtures for subsequent separation of individual
oxides. The paper concludes with a generic approach to process chemistry which minimizes
waste generation and therefore helps in reducing the overall process and energy costs. 30
Examples of recovering alkali from high pH solution are also demonstrated by using carbon
dioxide.
,��*� ������33
Climate change is forcing nations worldwide to develop a low carbon economy by curtailing the energy consumption and 34
waste generation in the state"of"the"art mineral and materials processing. In this respect, although the steel and aluminium 35
industries are leading the way by cutting down the energy consumption, the reduction in energy and waste in metal industry 36
in general remains far from satisfactory, as shown in Table 1. For example, in steel industry the energy consumption has 37
reduced from 35 GJ per tonne of metal in the middle of 1990s to less than 25 GJ per tonne at present. The trend for steel 38
manufacturing is to reduce energy below 20 GJ in the next 10 years3. Three factors which have contributed to achieving 39
these targets are: the use of high"grade minerals with low phosphorus, coal and gas containing low sulphur and steel scrap 40
recycling. In aluminium industry, the main driver for energy reduction has been through recycling of aluminium scrap which 41
has increased to more than 25% of the current production4. Since steel and aluminium metals and alloys are derived from 42
two of the most abundant elemental metals present in the earth’s crust, the volume of waste and energy consumed is far less 43
compared with other less common metals, such as titanium, vanadium and chromium, which are less abundant. 44
Consequently, the entropy factor of dilution of mineral concentrates of titanium, chromium, rare"earth elements and 45
associated minor elements such as niobium, tantalum and vanadium, forces process design to invest more energy for 46
retrieving such elements of importance for developing low"carbon economy. Such an irony in engineering and process 47
Page 2 of 28Green Chemistry
GreenChemistryAcceptedManuscript
Publ
ishe
d on
10
Mar
ch 2
015.
Dow
nloa
ded
by U
nive
rsity
of
Lee
ds o
n 10
/03/
2015
10:
04:3
4.
View Article Online
DOI: 10.1039/C4GC02360A

��������������������������������������������������������������� ��!������ ���"�����" ����������
ARTICLE TYPE www.rsc.org/xxxxxx | XXXXXXXX
2|Journal Name, [year], [vol], 00–00 This journal is © The Royal Society of Chemistry [year]
design has so far dominated our thinking, which implies that with our current approach the development of a low"carbon 1
economy and manufacturing might be an uphill task. Since the critical metals and mineral oxides play an important role in 2
the supply chain of energy related devices for supporting the low"carbon infrastructure such as wind turbines and efficient 3
lighting, their demand has been rising for the last 10 years5, which increases the risk in supply chain. 4
A recent published paper6 has assessed the life cycle analysis (LCA) of selected wastes in metallurgical industry. The data 5
shows that in 2008, the metal industry accounted for 49 exa"joules (EJ) of energy, which corresponds to a 9.5% of global use 6
in 2008, and GHG of 3.4 Gt CO2"eq per year (10% global emissions). Table 1shows the breakdown of global cumulative 7
energy demand and carbon dioxide emissions on the basis of the production of each metal processed in 2008, from which it 8
is evident that the production of iron and aluminium represent more than 80% of the global emissions. Solid industrial 9
wastes, such as the red mud from the bauxite plant have been used for carbon dioxide capture and as catalyst for 10
hydrogenation and hydro"dechlorinationreactions7,8. However, so far none of these industrial wastes have ever been 11
commercialised for any industrial reuse, which implies that there has not been any solution for large scale reuse of red mud. 12
Table 1. Global CO2 emissions and cumulative energy demand of selected metals in 20086. 13
Metal Emissions
Gt CO2"eq/yr Emissions
KgCO2"eq/Kg metal Energy demand
PJ"eq/yr Energy demand
MJ"eq/Kg
Fe 2.40 1.50 36,043 23.10 Al 0.40 8.20 5,974 131.00 Cu 0.05 2.80 1,062 53.70 Ti 0.04 8.10 569 115.00 Zn 0.04 3.10 619 52.90 Au 0.04 12,500.00 718 208,000.00 Cr 0.02 2.40 306 40.20 Pb 0.02 1.30 225 18.90 Ni 0.02 6.50 345 111.00 Mn 0.01 1.00 340 23.70
Other 0.36 2,799
14
Other examples of energy consumption and waste generation for metals listed in Table 1 may also be found elsewhere in 15
literature9"13. In summary, it is imperative that a more pragmatic approach for process steps, which significantly reduce waste 16
emission, may be more favourable in future. In this context, the alkali roasting and leaching as a novel approach for alumina, 17
chromium oxide, titanium dioxide, rare"earth and vanadium pentoxide recovery is presented and discussed with examples for 18
the separation of metal values. 19
2��*���� �������� ��20
Louis Le Chatelier, in 1887 investigated the oxidative roasting of bauxite mineral with alkali above 1200ºC in air to produce 21
water"soluble NaAlO2, which he attempted to separate by bubbling CO2 into the leachate medium at pH above 1014. The 22
hydroxide of alumina, Al(OH)3 formed in Le Chatelier’s method, was extremely difficult to separate via filtration at an 23
industrial scale, because of the gelatinous nature of the precipitates15. By contrast, the success of Bayer process was possible 24
as a result of alumina precipitation below 175oC, leading to industrialization of alumina refinery. In an earlier article16, other 25
technological factors, besides the filtration of gelatinous materials, such as the kiln design and surface chemistry, were 26
explained for overcoming the main barriers of industrial scale manufacturing of alumina. Much later in 19th century Le 27
Chatelier applied the alkali roasting chemistry for chromite minerals and successfully demonstrated the large"scale industrial 28
manufacturing of sodium chromate, from which the dichromate is made. 29
.����� ��������� ������������� ���30
The oxide minerals of aluminium, titanium and chromium are complex in nature and are frequently associated with 31
ferrous/ferric oxides, vanadium, niobium and tantalum oxides and rare"earth bearing oxides during natural mineralogical 32
processes over geological time scales. For example, bauxite is an ore body which chiefly contains aluminium hydroxide (e.g. 33
gibbsite), iron hydroxides and iron"oxide rich clays16. On the other hand, a vast majority of beach sand based titanium oxide 34
minerals combine with iron"manganese oxides in natural rutile, anatase and ilmenite17. The crystal structures of alumina, 35
gibbsite, kaolinite (an alumino"silicate) and ilmenite, for example, are shown in Figures 1a, 1b, 1c and 1d, respectively, and 36
these structures demonstrate the chemical moieties, essential for the thermodynamic stability of minerals in natural 37
environment. In the structure of alumina, the Al3+ ions are 6"fold coordinated with oxygen ions, which is preserved in the 38
gibbsite (hydrated oxide in Fig.1b) and kaolinite structures (in Fig.1c). In ilmenite, the Ti4+ ions are 6"fold coordinated, with 39
Fe2+ ions in tetrahedral sites. This combination of 6"fold co"ordination for Ti4+ and 4"fold for Fe2+ favours the solid solution 40
formation in chromite spinels, which form a wide range of solid"solutions with other iron and non"iron bearing spinels 41
(M3O4) structures, as shown in Figure 1e. In the spinel structure, the Cr3+ and Al3+ ions have large octahedral site preference 42
energies (OSPE)(157.8 kJ mol"1)18which is why other similar ions with comparable OSPE are substituted to form 43
multicomponent spinels. A similar ionic substitution process may be observed in rutile (TiO2), where the differences 44
between the ionic radii of six"coordinate octahedral ions of titanium (0.0745 nm for Ti4+) and vanadium (0.0680 nm for 45
Page 3 of 28 Green Chemistry
GreenChemistryAcceptedManuscript
Publ
ishe
d on
10
Mar
ch 2
015.
Dow
nloa
ded
by U
nive
rsity
of
Lee
ds o
n 10
/03/
2015
10:
04:3
4.
View Article Online
DOI: 10.1039/C4GC02360A

Journal Name
��������������� �� ���� �� ��
�������������������
��������������������►
����������
This journal is © The Royal Society of Chemistry [year] Journal Name, [year], [vol], 00–00 |3
V5+and 0.0720 nm for V4+) are less than 15% which makes substitution of the Ti4+ ions by V4+ and V5+ ions possible in rutile 1
and ilmenite lattices at the octahedral sites18. Such dissimilar ionic substitution may promote the differences in cationic 2
charge leading to distortion, which is either compensated by cation vacancies or via a combination of 2+ and 3+ states in the 3
structure. The occurrence of chromite minerals worldwide with Ti4+ and V4+,5+substitutions at the octahedral sites is a classic 4
example of OSPE concept favouring complexity in ilmenite, chromite, and rutile minerals. 5
6
Naturally occurring chromite minerals found worldwide may be summarized using the Deer’s net diagram19 in Figure 2, 7
which is a representation of quaternary solid solution of four binary spinels: FeAl2O4, MgAl2O4, MgCr2O4, and FeCr2O4, 8
represented as reciprocal salt mixture for cation exchange. In this diagram, the possible solid solution composition range 9
within this quaternary is designated by the constant density and lattice constant lines, which vary in the range 3600"5000 10
kg.m"3 and 0.815"0.835 nm, respectively. In Figure 2, several chromite compositions from South Africa, India, Indonesia, 11
Philippines, and China are mapped20, which are discussed below in determining the extraction efficiency of chromium oxide 12
as water"soluble sodium chromate after lime"free alkali roasting. 13
�14
�15
�16
�17
�18
�19
Figure 1: Crystal structures of minerals showing tetrahedral and octahedral cationic sites: a) alumina (red O2"(0.140nm), blue 20
Al3+(0.051 nm)), b) gibbsite (red O2", blue Al3+, white H+), c) kaolinite (red O2", blue Al3+, yellow Si4+(0.054 nm), d) ilmenite 21
(red O2", blue Ti4+(0.075 nm), yellow Fe2+(0.075 nm), purple V5+(0.068nm)), and e) chromite spinel (red O2", blue Al3+, 22
yellow Ti4+ orange Fe2+, white Mg2+(0.066 nm), brown Cr3+(0.076nm))21. 23
�24
In Figure 1, the hydroxyl bonds in the gibbsite stands out amongst the crystal structures compared herein. The presence of 25
hydroxyl bonds in gibbsite, for example, plays an important role in controlling the selective leaching of superficial 26
aluminium hydroxide and hydrated silicate in bauxite during alkali leaching, used in the Bayer process1,2,15,16. By 27
comparison, in the kaolinite structure, the silica is also present as [SiO4]4" units, which replaces some of the [AlO3]
3" units. 28
For each of these substitutions in kaolinite, an excess negative charge builds in the structure, which must be compensated via 29
the incorporation of a positive charge; e.g. a Na+ ion. Consequently, from the resulting change in Coulombic interaction the 30
OH" ions become less prevalent in the modified alumino"silicate structure, when compared with, say, gibbsite. Due to lesser 31
prevalence of OH" ions as hydroxides in the kaolinite structure, the low"temperature leaching adopted in Bayer process never 32
liberates alumina from alumina"silicate, and this is evident from the mineralogy of red mud, discussed below. 33
34
35
36
37
38
39
40
41
42
43
44
45
46
47
Page 4 of 28Green Chemistry
GreenChemistryAcceptedManuscript
Publ
ishe
d on
10
Mar
ch 2
015.
Dow
nloa
ded
by U
nive
rsity
of
Lee
ds o
n 10
/03/
2015
10:
04:3
4.
View Article Online
DOI: 10.1039/C4GC02360A

��������������������������������������������������������������� ��!������ ���"�����" ����������
ARTICLE TYPE www.rsc.org/xxxxxx | XXXXXXXX
4|Journal Name, [year], [vol], 00–00 This journal is © The Royal Society of Chemistry [year]
1
�2
�3
�4
�5
�6
�7
�8
�9
�10
Figure 2: The Deer’s net superimposed on reciprocal salt diagram for chromite ores. The dash lines (" " " ") are for constant 11
lattice parameter compositions ranging from 0.815 nm to 0.835 nm, whereas the constant density (dotted ….) lines of 12
mineral changes from 3.60 gcm"3 (=3600 kg.m"3) to 5.0 (=5000 kg.m"3) in the quaternary composition19,20. 13
3�� �� ���������������������14
Aluminium oxide is produced from bauxite concentrates using the Bayer process, in which the hydrothermal leaching of 15
aluminium hydroxide occurs at 200oC in the presence of NaOH solution at pH>10. The process has remained generically 16
unaltered since its invention. The main reaction between the mineral and the leachate is limited to the presence of hydrated 17
alumina, leaving behind the unaltered complex aluminium silicates thereby enhancing the filterability of the solution. This 18
was a significant finding by Bayer in making the process successful, compared to Le Chatelier’s process, which involved 19
unfilterable gelatinous materials formed as a result of leaching the alkali roasted bauxite concentrate well above 1000oC in 20
air. The aluminium hydroxide is precipitated from the alkaline sodium aluminate solution, allowing sodium hydroxide to be 21
recycled. High purity alumina is produced after several hours of calcination of the precipitated aluminium hydroxide in 22
air13,22. 23
As explained in the crystal models of gibbsite and kaolin, the presence of hydroxyl bond in the structures create sites for 24
chemical attack in the gibbsite structure, however since the unreacted bauxite is also rich in kaolinite, the yield of aluminium 25
hydroxide is usually limited to less than 50% depending on the grade of gibbsite. The generated leach residue is known as 26
red mud and the tonnage produced in alumina refineries across the world depends on the grades of bauxite used. For each 27
tonne of alumina produced, the red mud quantity may vary from 0.3 tonnes for high"grade bauxite to 2.5 tonnes for very low 28
grade23.The chemical and physical properties of red mud depend primarily on the bauxite used and, to a lesser extent, the 29
manner in which it is processed. Red mud has a variable composition of complex aluminium silicates (10"45 wt% Al2O3and 30
1"16 wt% SiO2), titanium dioxide (5"20 wt%), iron oxide/hydroxides (5"65 wt%) and less than 10 wt% alkali, which are all 31
dumped in ponds and is a major industrial waste. With growing global demand for aluminium, the red mud tonnage is 32
increasing every year24 and in 2011, it exceeded 3 billion tonnes. Disposal of the red mud is a major problem due to its 33
highly alkaline nature with pH>10. The percolation of alkaline leachate into surface and ground water and dust from 34
improperly maintained landfill sites creates severe environmental problems. Red mud is also an important source of critical 35
metals, namely gallium, germanium, and scandium. 36
Although a number of lab"scale technologies have been developed for the recovery of alkali, alumina, Fe/Fe2O3, TiO2, SiO2 37
and other materials from the red mud for uses such as manufacturing of bricks and refractories25"27, most of these techniques 38
are uneconomical and hence not used commercially. In alumina refineries across the world, the most common practice for 39
red mud disposal is deep thickening to recover alumina and soda, followed by the storage of wet"slurry or dry red mud by 40
capping28,29. Where permissible, red mud slurry is also disposed at sea or river basins, however this practice is gradually 41
curtailed due to long term effects on marine eco"system30. 42
Considering the limitations of Bayer process, increasing demand on energy in aluminium industry and tighter environmental 43
regulations related with the disposal of red mud, the results from alkali"based roasting process for the extraction of alumina 44
from red mud and bauxite are described in section 7.3.3. 45
4�� �� ����������������������46
Titanium is the ninth most abundant element in the earth´s crust. The main titanium containing minerals are summarized in 47
Table 2. Among them, ilmenite supplies about 91% of the world´s demand for titanium minerals31,32. As a result of natural 48
weathering, the ilmenite minerals demonstrate a range of concentrations of iron, titanium and related transition metal oxides 49
Page 5 of 28 Green Chemistry
GreenChemistryAcceptedManuscript
Publ
ishe
d on
10
Mar
ch 2
015.
Dow
nloa
ded
by U
nive
rsity
of
Lee
ds o
n 10
/03/
2015
10:
04:3
4.
View Article Online
DOI: 10.1039/C4GC02360A

Journal Name
��������������� �� ���� �� ��
�������������������
��������������������►
����������
This journal is © The Royal Society of Chemistry [year] Journal Name, [year], [vol], 00–00 |5
in the structure due to the variations in the geological hydrothermal processes at the sea bed and on sub"surfaces33 1
Table 2. Main titanium containing minerals34 2
Mineral Composition TiO2 (%)
Rutile TiO2 (tetragonal, twinned) 95% Anatase TiO2 (tetragonal, near octahedral) 95% Brookite TiO2 (orthorhombic) 95% Ilmenite FeTiO3 40"65%
Leucoxene Fe2O3·nTiO2 65% Arizonite Fe2O3·nTiO2·mH2O 59% Perovskite CaTiO3 58% Geikielite MgTiO3 66% Titanite CaTiSiO5 41%
3
The main consumer of TiO2 is the pigments industry. There are several commercialized processes to manufacture pigment 4
grade synthetic rutile, which are summarized in Table 3. All of them are based on a combination of thermal oxidation and 5
reduction by roasting, leaching and physical separation. The most adopted industrial processes are the sulphate process 6
(Becher process) and the chloride process (Benelite process)35. In recent times, the chloride process has been imposed over 7
the sulphate one because of some advantages in costs and waste management36. The sulphate process however allows for the 8
treatment of low"grade titanium ores and the chloride process is restricted to high grade minerals37. 9
Table 3.Commercialized processes for the production of synthetic rutile from ilmenite minerals36. 10
Process Thermal treatment Leaching TiO2 grade (%)
Becher Iron oxidation to Fe2O3 and reduction to Fe at 1200ºC 1. NH4Cl/O2
2. 0.5M H2SO4 93%
Benelite Carbo"thermic reduction of iron to Fe(II) 18"20% HCl 93% Murso Similar to Becher process but in fluidized beds 20% HCl 93%
Laporte Conversion of iron to FeO at 900ºC under controlled CO2 atmosphere 18% HCl 93% Auspact Magnetization of ilmenite at 800"1000ºC 25% HCl 97%
Dunn Selective chlorination of iron with Cl2 _ 93% Kataoka Reduction of iron to FeO H2SO4 95%
11
Since the ilmenite minerals often co"exist with rare"earth containing zircon and monazite minerals in the form of exsolved 12
phases within the matrix of natural ilmenite and anatase minerals, the proportions of such lanthanide containing secondary 13
phases (zircon, monazite, and xenotime) determine the grade or purity of the ilmenite, natural rutile, and anatase mineral 14
concentrates. The physically liberated particles of minerals and those which are quite rich in zircon, monazite, and 15
perovskite have different density, electro"static and magnetic properties, and, therefore, these minor minerals can be 16
separated by a combination of physical separation techniques, for further enriching ilmenite concentrate. However, the 17
exsolved zircon, monazite, and perovskite within the matrix of ilmenite are very difficult to separate by physical means. The 18
Becher process38 does not permit handling of lower grades of titaniferous minerals with higher concentrations of rare"earth 19
and actinides. 20
The growth of the aerospace, defence and other industrial sectors is pushing the demand for high grade TiO2. As it has been 21
described the upgrading processes involve multi steps of energy sensitive thermo reductive conversions (e.g. in the direct arc 22
electric furnaces) and leaching to remove iron impurities39"41. For this reason the titanium dioxide rich slag making plants are 23
often strategically located in the parts of the world where the energy costs are relatively low. 24
In this review, the processing of titanium dioxide concentrates with high content of lanthanides and actinides is discussed 25
using alkali roasting and reductive leaching with organic acids, showing the process, energy and environmental benefits. 26
5�� �� ��������� ����������27
Chromium and its compounds are essential for the metal making, chemical and refractory industry, however the current 28
techniques employed for sodium chromate chemicals manufacturing pose major environment management problems, 29
threatening air, land and water pollution. Although several chromium based minerals, such as crocoite (PbCrO4), 30
vauquelinite (Pb2Cu[CrO4][PO4]), uvarovite (Ca3Cr2[SiO4]3) and merumite (4(Cr,Al)2O3 3H2O)42 are known as the natural 31
source for chromium, only the chromite ores with spinel structure (Fe2+,Mg)[Cr,Al,Fe3+]2O4,areused as main sources for 32
chromium chemical manufacturing. As explained above, the traditional process for treating chromite ores is based on the 33
alkali roasting with soda ash, lime and dolomite in an oxidizing atmosphere at 1200ºC, which yields water soluble sodium 34
chromate9. The sodium chromate is acidified with sulphuric acid to make sodium dichromate which is crystallized and sold 35
Page 6 of 28Green Chemistry
GreenChemistryAcceptedManuscript
Publ
ishe
d on
10
Mar
ch 2
015.
Dow
nloa
ded
by U
nive
rsity
of
Lee
ds o
n 10
/03/
2015
10:
04:3
4.
View Article Online
DOI: 10.1039/C4GC02360A

��������������������������������������������������������������� ��!������ ���"�����" ����������
ARTICLE TYPE www.rsc.org/xxxxxx | XXXXXXXX
6|Journal Name, [year], [vol], 00–00 This journal is © The Royal Society of Chemistry [year]
or is roasted with ammonium sulphate to produce chromium (III) oxide43. The extraction efficiency of chromium chemicals 1
is dependent on the mineralogy and in general, the silica and hydroxide rich minerals produce low temperature liquid within 2
the pores of minerals and reduce the process yield20. Across the broad spectrum of chromite minerals, the South African ore 3
deposits from Bushveld region provide the best yield of ~85"90% in optimized kiln operations44"46. The residue from 4
leaching of sodium chromate remains laden with Cr6+ in the pores and interstitials, which cannot be leached out even with 5
hot water. The chromium oxide process residue (COPR) as it is known in industry is classed as a hazardous material and 6
must be disposed safely by capping the landfill site. The residual concentrations of Cr6+ in COPR may vary between 1.5 to 7
5 wt%, which is 9 orders of magnitude larger than the permissible exposure limit of Cr6+ in water45. For this reason the 8
COPR is partly recycled up to 15% in the roasting process by substituting lime/dolomite, which is used to flux silica, reduce 9
alkali consumption, and enhance oxygen diffusivity in the kiln bed47. The lime addition in chromate process is now banned 10
in the developed and emerging economies of the world, because at high temperatures CaCrO4 forms a vapour phase which 11
on condensation can readily spread into the surrounding environment48"52.Chromium (VI) is a carcinogenic and mutagenic 12
substance with detrimental effects on mammals, flora and fauna. Among other health risks, it causes chromosome aberration 13
and DNA defects53. 14
The replacement of sodium carbonate with sodium hydroxide"sodium nitrate mixtures increases the yield of water"soluble 15
chromate to more than 95% 54,55. The hydrothermal leaching of chromites has also been studied, particularly for the low 16
grade ores; key findings from literature are summarized in Table 4. 17
Table 4.Summary of research on direct leaching of chromites 18
Origin Leaching agent T (ºC) t (h) Yield Oxidant Ref.
Egypt H2SO4
(50% w/w) 250 0.5 90% none 56
South Africa H2SO4
(77% w/w) 210 6 70% none 57
South Africa H2SO4
(82% w/w) 210 6 99%
HClO4 (1.5%w/w)
57
Egypt NaOH
(20% w/w) 240 2 90% O2 10 bar 58
India NaOH
(60% w/w) 250 5 99% O232 bar 59
Philippine KOH
(70% w/w) 220 5 99% O210 bar 60
�19
All of the leaching processes listed in Table 4 operate under highly oxidative conditions and their industrial feasibility is at 20
present unknown. 21
6����������������������� �������� ����������� ����� ��������������� ���������������22
�������23
As discussed before, refining processes for the production of alumina, titanium dioxide and chromium oxide chemicals are 24
currently facing significant environmental challenges, especially when the landfilling levies are rising steadily. Although 25
some of the process and environment related solutions may have been developed on a laboratory scale, three important 26
factors which ultimately determine the acceptance of technology implementation are " the cost of capital investment, high 27
risk involved in committing capital to unproven technology, and risk of adapting the new technology with the state"of"the"art 28
operation61.The aim in this review article is to demonstrate whether the alkali roasting and leaching may be implemented as 29
a disruptive, or adaptive technology for current manufacturing of above metals and minerals. In this context for each mineral 30
case we explain below significant advantages over the state"of"the"art. 31
6�,���� ����������������������32
The compositions of minerals are listed in Table 5 with their origins. The X"ray powder diffraction technique using Cu"K� 33
radiation over an angle (2θ) range of 10 to 80owith the support of X’Pert High Score plus software, was used for 34
characterization of phases present in the minerals, and these are summarized in Table 5. For the chemical analysis of 35
minerals and ores samples used for metal oxide extraction, two techniques were adopted depending upon the suitability of 36
each technique for the mineral type. For example, X"ray fluorescence (XRF) was predominantly adopted for magnetic and 37
non"magnetic fractions of ilmenite concentrates, whereas for chromite, bauxite and red mud, both XRF and AAS (Varian 38
AA240FS) were used. The quantitative chemical analysis data, obtained using XRF and AAS, were also compared with the 39
elemental energy"dispersive X"ray (EDX) analysis during the scanning electron microscopic (Carl Zeiss EVO MA15) 40
analysis of minerals before and after reaction, which yielded a comprehensive understanding of the roasting and leaching 41
reaction mechanisms. 42
�43
�44
Page 7 of 28 Green Chemistry
GreenChemistryAcceptedManuscript
Publ
ishe
d on
10
Mar
ch 2
015.
Dow
nloa
ded
by U
nive
rsity
of
Lee
ds o
n 10
/03/
2015
10:
04:3
4.
View Article Online
DOI: 10.1039/C4GC02360A

Journal Name
��������������� �� ���� �� ��
�������������������
��������������������►
����������
This journal is © The Royal Society of Chemistry [year] Journal Name, [year], [vol], 00–00 |7
6�2�� ��� �������1
6�2�,��7 ���������1���������� �������2
3
The bauxite and red mud powder samples were roasted with stoichiometric amounts of sodium carbonate required for the 4
alkali fusion reaction (2a) in section 7.3.2.For each roasting and leaching experiment, a batch of 50g of mineral sample was 5
mixed with sodium carbonate thoroughly in a mortar/pestle mixer, after which the mixture was transferred into an alumina 6
crucible. The crucible was then placed inside a MoSi2 resistance furnace maintained at a pre"selected temperature; e.g. at 7
750oC for 2 hours with a stagnant air atmosphere inside the furnace. The sample temperature was recorded using a Pt"8
Pt13%Rh thermocouple. After the reaction, the crucible was withdrawn from the furnace and allowed to cool in air. A 9
sample of the roasted material was saved for detailed phase analysis before leaching in hot distilled water. After leaching, the 10
solution was filtered using Whatman 541 filter paper. The leach solution contains soluble sodium aluminate, from which 11
aluminium hydroxide was precipitated by bubbling CO2 gas through the filtered solutions at room temperature. The 12
precipitated hydroxide of alumina was filtered, washed with distilled water, dried and calcined at 1125ºC for 4 hours in air 13
before chemical and particle size analysis. 14
Table 5: Chemical composition (wt%) of the minerals investigated and their analysed phase constitution 15
Oxide Red mud
Bauxite Ilmenite magnetic
Bomar Ilmenite Non"magnetic
Non"magnetic ilmenite"RE
Chromite
Al2O3 22.0 55.0 0.5 1.2 5.8 14.1 SiO2 8.0 3.0 1.2 2.2 8.8 4.3 TiO2 6.0 2.0 61.0 75.6 16.4 " Cr2O3 " " 0.2 0.2 0.1 42.4 Fe2O3 46.0 12.0 8.4 15.5 3.9 27.3 FeO " " 28.4 0.1 " ". MgO " " 0.1 0.4 0.6 10.2 CaO 1.0 " 0.1 0.1 3.2 0.5 Y2O3 " " " " 1.3 " La2O3 " " " 0.3 6.5 " CeO2 " " " 0.9 13.5 " Nd2O3 " " " n.a 5.0 " Pr2O3 " " " n.a 1.4 " P2O5 " " " 0.9 15.9 "
Mn3O4 " " 0.2 0.3 0.4 " SnO2 " " " " 7.1 " Alkali (Na,K)
8.0 <2 " <1.4 0.7
1.2
Zr,Nb oxides " " " n.a 4.1 " (U,Th)O2 " " " <0.2 3.0 "
LoI 9.0 25.5 <0.1 1.7 0.7 oxidation Trace oxides " n.a. n.a n.a 2.3 " n.a.: not analysed or not detected 16
Minerals/ores Phases identified in as received minerals/ores
Chromite ore (S Africa) (Fe0.51
Mg0.49
)(Cr0.73
Al0.27
)2O
4
Magnetic ilmenite Fe2Ti3O9,Al(PO4), Al2O3·54SiO2, Fe(FeTiO4)
Non"magnetic ilmenite TiFe2O4,TiO2,(Ce, La, Th, Nd)PO4,Zr(SiO4), La1.3(Al4Si12O32),
Al2(SiO4)O, SiO2, Al(PO4), Fe0.924O, FePO4
Bauxite Al(OH)3, FeO(OH), CaAl2Si7O18*7.5H2O, Fe2O3
Red mud62 Fe2O3, TiFeO3, AlO1.06(OH)0.94,1.08Na2O*Al2O3*1.68SiO2*1.8H2O,
FeO(OH), Al(OH)3, 5Al2O3*H2O, SiO2, TiO2
17
6�2�2��7 �������������������� ����18
19
Two different types of non"magnetic ilmenite concentrates, one of which is particularly rich in rare"earth, were investigated 20
and their compositions are summarized in Table 5.Bomar ilmenite was magnetically separated for collecting the magnetic 21
fraction for which the composition is shown in Table 5. After magnetic separation, the magnetic and non"magnetic fractions 22
and the loss on belt were 0.50±0.05, 0.35±0.05, and 0.15±0.02, respectively. Pre"analysis calibration was done using pure 23
standards before XRF analysis of the rare earth elements. Approximately 10 grams of non"magnetic Bomar ilmenite were 24
collected from the magnetic separator and then divided into two parts. The first part was mixed with sodium carbonate by 25
Page 8 of 28Green Chemistry
GreenChemistryAcceptedManuscript
Publ
ishe
d on
10
Mar
ch 2
015.
Dow
nloa
ded
by U
nive
rsity
of
Lee
ds o
n 10
/03/
2015
10:
04:3
4.
View Article Online
DOI: 10.1039/C4GC02360A

��������������������������������������������������������������� ��!������ ���"�����" ����������
ARTICLE TYPE www.rsc.org/xxxxxx | XXXXXXXX
8|Journal Name, [year], [vol], 00–00 This journal is © The Royal Society of Chemistry [year]
meeting the stoichiometric requirements of reaction (2b). In the mixture 5% w/w of alumina was added for studying the 1
separation tendency of rare"earth containing minerals. The concentration of sodium carbonate was adjusted accordingly for 2
the potential reaction between alumina and alkali. The weighed mixture was ground and mixed before isothermal heating at 3
900ºC for 4 hours. The second half of non"magnetic ilmenite fraction was mixed with K2CO3 for studying the preferential 4
reactivity during roasting in air at 825ºC for 4 hours. K2CO3roasting was done at 825 oC because the mixture tends to melt 5
above 850oC. The isothermally roasted samples were cooled in air by taking the alumina crucible out of the muffle furnace. 6
Leaching of roasted materials was carried out with deionized water for 30 minutes on a stirred hot plate at room temperature, 7
which helps in separating the released rare"earth constituents from the reacted ilmenite matrix. Alkali titanate formed as a 8
result of roasting separates after leaching by setting at the bottom of reaction vessel, whereas the rare"earth constituents 9
predominantly form a colloidal suspension which floats at the top, as shown in Figure 15. The pH of the solution during 10
leaching and post"washing was more than 12.After settling, the colloidal rare earths mixture was separated from the alkali 11
titanates, which were subsequently leached in a mixture of 0.3M oxalic acid and 0.01M ascorbic acid in a 900 ml reactor at 12
70 oC and a stirring speed of 500 rpm for 5 hours. Elements present in leachate solution were analysed by AAS. 13
�14
6�2�.��7 ����������� �������� ����15
16
Chromite ore with composition shown in Table 5 was roasted with different potassium and sodium based alkali salts. Due to 17
the low yields reported in the literature,44"46 an alkali/mineral ratio of 1.11 was used. The effect of roasting with a mixture of 18
different alkali salts was also studied by mixing carbonates, hydroxides and bicarbonates in variable proportions. In all the 19
experiments, 10 g of mixture was placed in an alumina crucible and roasted at 1000oC for 2 hours in air inside a MoSi2 20
resistance furnace. After roasting, the samples were leached in hot water (50oC) for approximately 45 minutes. We have not 21
included the XRPD data after alkali roasting of chromite because the roasted sample contains a fine dispersion of Cr6+ salts 22
which poses a potential risk of contamination of the equipment work area and personnel, which is why we are unable to 23
include this data. However, the comparison of XRPD data before roasting and after leaching shows a conclusive evidence 24
for a substantial decrease in chromium"rich spinel phases. For all XRPD data, the peaks are compared with the JCPDS data 25
and these correspond to JCPDS references therein. The analysis also included post leach solution and residues using XRPD, 26
XRF and SEM"EDX. The leachates were analysed for soluble chromium and iron too. 27
�28
6�2�3��(������������������������������ ����������� �������29
30
To analyse the microstructure, and understand the extent of vanadium dissolution in rutile and other TiO2 containing 31
minerals, as well as its leachability form the solvent rutile matrix, binary mixtures of TiO2 –V2O5with various compositions 32
(1.3 – 8.6 mol% V2O5) were pelletized and sintered at 1100 oC for 24 hours using ���(���)� � grade reagents. The pellets 33
were leached in 2M NaOH solutions at 60 oC for 3 hours. The Rietveld refinement method was used for determining rutile 34
lattice parameters for different concentrations of V2O5 in rutile. 35
6�.���������36
6�.�,��!�������������� �� ���� �������������������� ����������������37
38
The chemical composition of bauxite concentrate and red mud from ALCAN (UK) is shown in Table 5, where the balance 39
was volatile material such as water and organic compounds. An SEM micrograph of ALCAN red mud is shown in Figure 3.�40
�41
�42
�43
�44
�45
�46
�47
�48
�49
Figure 3: A back"scattered scanning electron image of red mud showing three different phases (A, B, and C) in the 50
micrograph (100 µm). 51
52
53
8!
%
Aluminium"iron rich (B)
Titanium rich (C)
Aluminium rich (A)
Page 9 of 28 Green Chemistry
GreenChemistryAcceptedManuscript
Publ
ishe
d on
10
Mar
ch 2
015.
Dow
nloa
ded
by U
nive
rsity
of
Lee
ds o
n 10
/03/
2015
10:
04:3
4.
View Article Online
DOI: 10.1039/C4GC02360A

Journal Name
��������������� �� ���� �� ��
�������������������
��������������������►
����������
This journal is © The Royal Society of Chemistry [year] Journal Name, [year], [vol], 00–00 |9
Figure 3 shows that the red mud mainly consists of three phases, marked A, B, and C where phase A is rich in aluminium, 1
and phases B and C are rich in iron and titanium, respectively. The EDX analyses of these three phases are also compared in 2
Figure 3, which are prevalent in Figure 4. The XPRD of dry red mud is shown in Figure 4 in which three complex phases, A 3
(aluminium"rich), B (iron"rich) and C (titanium"rich) are identified as sodium alumina"silicate, Fe2O3/Fe5TiNa2Si6O20and 4
FeTiO3/TiO2, respectively. It is apparent that alumina, silica, iron oxide, and titanium dioxide are present in complex 5
mineralogical forms in red mud, which are very different from the starting bauxite concentrates. 6
�7
�8
�9
�10
�11
�12
�13
14
15
16
17
18
Figure 4: (a) X"ray powder diffraction of dry as"received red mud. (b) X"ray powder diffraction of as"received bauxite. The 19
diffraction data compares well with the ICDD references for the dominant phases: 04"015"9569 Fe2O3, 00"021"1272 TiO2, 20
01"074"6248 AlO1.06(OH)0.94, 00"031"1271 1.08Na2O*Al2O3*1.68SiO2*1.8H2O, 00"003"0251 FeO(OH), 00"007"0324 21
Al(OH)3, 00"017"0540 5Al2O3*H2O, 04"015"7167 SiO2, 04"012"1148 TiFeO3, 00"029"0041 Al(OH)3, 04"015"8189 22
FeO(OH), 00"019"0211 CaAl2Si7O18*7.5H2O and 01"073"3825 Fe2O3. 23
24
The scanning electron microstructure with EDX and X"ray powder diffraction (XRPD) analyses of the magnetic and non"25
magnetic ilmenite fractions are shown in Figures 5 and 6, respectively. 26
27
28
�29
�30
�31
�32
�33
�34
�35
�36
Figure 5: Back"scattered scanning electron image of Bomar ilmenite showing the different mineral constituents: (a): Non 37
Magnetic fraction (50 µm)(b): Magnetic fraction (50 µm).�38
Monazite
�� 1�
Ilmenite matrix
Zirconium silicate
Na"Al Silicate
� , � - . / 0 1
2�)2 �3���)2
�3�)2
3��)�
�
�)3)�)2
3)2
3�����
�
�
�
$�����4��������������"�
,�52������6
�77��586�
3779�,
�
�77����,%�
0
�1:0�.8
,
��#�
2779�586
� , � - . / 0 1
3)�)�)�
���
�)�)�)�
���3)�)�)�
���
�)�)�
���
�)3)&)�
����)2)&)�
�
���
3)�)�
�)3
�)�
�)�3
�
�&
2)�)�
���
�)�)�
�)&)�
�)�)�3)&
�)�
2
�)�)�
���
�
&)�
���
������
���
$�����4��������������"�
,�52������6
�779�,
�377� �
,�77��
�� /586
��-
277�� 1;�,:��
,
�:��/1%�
,:��18
,
�779�586 &77��586�
�77.��,
�:8
, �77%�
,
�77 �9��
���
2
�)� &)�)�
�)&)�)�)�
����77������2����&��2
�)2)�
3
�)�
�
�)&
���
3)�)�)�
�$�
Page 10 of 28Green Chemistry
GreenChemistryAcceptedManuscript
Publ
ishe
d on
10
Mar
ch 2
015.
Dow
nloa
ded
by U
nive
rsity
of
Lee
ds o
n 10
/03/
2015
10:
04:3
4.
View Article Online
DOI: 10.1039/C4GC02360A
��������������������������������������������������������������� ��!������ ���"�����" ����������
ARTICLE TYPE www.rsc.org/xxxxxx | XXXXXXXX
10|Journal Name, [year], [vol], 00–00 This journal is © The Royal Society of Chemistry [year]
1
2
3
�4
�5
�6
�7
�8
�9
�10
Figure 6: (a) X"ray powder diffraction of the non"magnetic fraction of Bomar ilmenite. (b)X"ray powder diffraction of the 11
magnetic fraction of Bomar ilmenite. The diffraction data compares well with the ICDD references: 04"002"5680 TiFe2O4, 12
01"075"1537 TiO2, 00"029"0403 (Ce, La, Th, Nd)PO4, 04"002"2545 Zr(SiO4), 01"076"0617 La1.3(Al4Si12O32), 04"012"6183 13
Al2(SiO4)O, 04"007"1808 SiO2, 04"011"7948 Al(PO4), 04"003"1444 Fe0.924O, 00"050"1635 FePO4, 00"047"1777 Fe2Ti3O9, 14
00"044"0003 Al2O3·54SiO2, 01"082"2733Fe(FeTiO4). 15
The detailed analytical microscopy presents profound evidence for the presence of both monazite and zircon, Figures 5 and 16
6, in which the X"ray energies for at least three most common rare"earth elements: La, Ce, Nd and the actinide Th are 17
apparent. These four elements appear to be associated with the presence of phosphorus, relating to the association with 18
monazite Al(Ln,Ac)PO4, where Ln and Ac represent the lanthanide and actinide elements respectively. The mineral phase 19
also shows small quantities of Al, Si, and Ca, confirming the presence of a calcium aluminium silicate based mineral. It 20
should be noted from the EDX analysis of minerals that the rare"earth and actinide oxides are predominantly hosted in the 21
monazite Al(Ln,Ac)PO4 and zircon (ZrSiO4) crystalline matrices. These two minerals do not dissolve in the iron"rich 22
ilmenite crystalline phase, as evident from the microstructure in Figure 6. 23
24
The microstructural analysis of the chromite concentrate is shown in Figures 7a and 7b. As it can be seen, the mineral is a 25
complex solid solution of the pure spinel end members (FeCr2O4, Fe3O4, FeAl2O4, MgCr2O4, MgAl2O4 and MgFe2O4) with 26
free silica particles (SiO2) that are not detected in the XRPD pattern. Natural chromite and Cr"bearing spinels are chemically 27
complex and, therefore, offer the possibility of a variety of cation ordering schemes which can be explained in terms of the 28
crystal field stabilization energies. In the spinel structure, there are 8 tetrahedral sites occupied by divalent cations and 16 29
octahedral sites which host trivalent cations according to their respective octahedral and tetrahedral site preference energies. 30
However, the cations Fe3+ and Mn2+, have near zero value for both preference energies, which implies that these two ions 31
may occupy both tetrahedral and octahedral sites. This energetically favoured site preference is one of the reasons behind the 32
stability of the chromite minerals, and the tendency for forming a wide range of solid solutions, which then demonstrate 33
different response to alkali roasting45,46 and metallurgical treatment44. Following the mineral structure analysis, based on the 34
point defects in spinel and ilmenite structures, it is evident that the Mn3+, Cr3+ and Al3+ compete for the available octahedral 35
sites, as well as the tetrahedral sites, which is predominantly occupied by Fe2+33,63. As in a spinel structure, the divalent Ca2+, 36
Mg2+ compete for Fe2+ tetrahedral sites, which is why the presence of Fe2+ often leads to the incorporation of Cr2O3, MgO, 37
Al2O3 and small amounts of CaO30, as evident in Table 5. 38
39
40
41
42
43
44
45
46
47
48
49
�50
� , � - . / 0 1
�
2��)22
2�2�
�232
�)2�)2
�)3)2
�
$�����4���������������"�
,�52������6
�
3)2
3
3
3)�
�
32
�
�#��77��
,
�:.-%�
,
�779�59� �-6
3779�, �
�
�
277��5<-6
� , � - . / 0 1
�)&)�
&
����
�)&)�
�
3)�)&)�
����
3
2
�����)&)�
&)�)�
�)&
�)3)2)&)�
�)�)�)!
&)�
&)�&
�)�)�&)�
�)&)�
3
�)3)&)�)�
�
�)&)�3)2)�)&)!
�)2)�)�
!
�)�)&)�)�
��)&)!
�
2
�)&
���
2
�
�
�)&
�)&
�
�
�
&
�
377=�%�-
�775��)��) �);26<-
$�����4���������������"�
,�52������6
�77 �9�,
- 277 �,�77%�
, &77�����5��
-%�
�,
�,6
�77��5<-6 �77��
,5%�
-6 �779�
��,- !779�<
-
&
�)3)�)�)!
�)2)&)�)��)2)�
����77������2����&��2
����
�)3)&)�)�
�$�
Page 11 of 28 Green Chemistry
GreenChemistryAcceptedManuscript
Publ
ishe
d on
10
Mar
ch 2
015.
Dow
nloa
ded
by U
nive
rsity
of
Lee
ds o
n 10
/03/
2015
10:
04:3
4.
View Article Online
DOI: 10.1039/C4GC02360A

Journal Name
��������������� �� ���� �� ��
�������������������
��������������������►
����������
This journal is © The Royal Society of Chemistry [year] Journal Name, [year], [vol], 00–00 |11
9�:�
�1
�2
�3
�4
�5
�6
7
8
9
10
11
12
13
14
15
Figure 7: (a). Back"scattered scanning electron image of Chromite concentrate showing the different mineral constituents 16
(100µm). (b).The X"ray powder diffraction of as received South African chromite concentrate compares well with the ICDD 17
reference: 01"070"6389(Fe0.51
Mg0.49
)(Cr0.73
Al0.27
)2O
4. 18
6�.�2����� �������� ��������������� ������19
20
From the phase analysis the dominant phases in each mineral is considered for the analysis of equilibrium conditions during 21
alkali roasting in oxidizing conditions. In red mud, for example, the hydrated aluminium silicate which is also present in 22
bauxite, is considered below for the analysis of equilibrium for phase decomposition and alkali reaction. Red mud also 23
consists of ilmenite and anatase/rutile which react with alkali under oxidizing condition after decomposition. The chromium 24
bearing constituents of chromite ore are MgCr2O4 and FeCr2O4, which thermally decompose over a range of redox 25
conditions, as identified earlier 9, 20, 44"46 before combining with alkali. The computed values of Gibbs free energy change 26
over a range of temperatures between 0oC and 1400oC are plotted as a function of temperature. The roasting of the materials 27
in a specified atmosphere leads to their thermal decomposition. For example, let us analyse the thermal decomposition of the 28
minerals under study in terms of their Gibbs energy plotted in Figure 8. 29
30
Al2Si2O5(OH)4 → Al2O3 + 2SiO2 + 2H2O(g) (1a) 31
FeTiO3 + ¼ O2(g) → ½ Fe2O3 + TiO2 (1b) 32
FeCr2O4 + ¼O2(g) → Cr2O3 + ½ Fe2O3 (1c) 33
MgCr2O4 → Cr2O3 + MgO (1d) 34
�35
�36
�37
�38
39
40
41
42
Chromite
Silica
� , � - . / 0 1
�
�
� ��
��
�
���
�
�
�
$�����4��������������"�
,ο52������)
�
�777�59� �.�>�
�-�65��
�0���
�,06,
-
�#�
Page 12 of 28Green Chemistry
GreenChemistryAcceptedManuscript
Publ
ishe
d on
10
Mar
ch 2
015.
Dow
nloa
ded
by U
nive
rsity
of
Lee
ds o
n 10
/03/
2015
10:
04:3
4.
View Article Online
DOI: 10.1039/C4GC02360A

��������������������������������������������������������������� ��!������ ���"�����" ����������
ARTICLE TYPE www.rsc.org/xxxxxx | XXXXXXXX
12|Journal Name, [year], [vol], 00–00 This journal is © The Royal Society of Chemistry [year]
�1
2
3
4
5
6
7
8
9
10
Figure 8: a) A plot of the standard Gibbs energy change (�Go, kJ.mol"1) per mol of mineral against temperature (ToC) for: (a) 11
thermal decomposition reactions (1a)"(1d), and (b) alkali roasting reactions (2a)"(2e). 12
�13
From Figure 8a, it is evident from plots of decomposition reactions 1a"1d that equations (1b) and (1c) naturally occur. 14
Reactions (1a) and (1d) occur at and above 200ºC and 1200oC, respectively. If water is removed in reaction (1a), from Le 15
Chatelier principle the reaction will shift in the forward direction. Similarly in reactions (1b) and (1c), if Fe2O3 is removed 16
by forming alkali ferrite during roasting, then the equilibrium will shift in the forward direction. If one of NaOH, NaHCO3 or 17
Na2CO3, is present as an alkali source in above reactions, the following equilibria will determine phase combinations which 18
will favour preferential separation during leaching by solubilizing one or more of the water"soluble phases. 19
20
Al2Si2O5(OH)4 + 3Na2CO3→ Na2O.Al2O3 + 2Na2SiO3 + 2H2O(g) + 3CO2(g) (2a) 21
FeTiO3 + Na2CO3 + 1/4O2(g) → 1/2Na2O.Fe2O3 + 1/2Na2O.2TiO2 + CO2(g) (2b) 22
Cr2FeO4 + 5NaOH + 7/4O2(g) → 1/2Na2O.Fe2O3 + 2Na2CrO4 + 5/2H2O(g) (2c) 23
Cr2MgO4+ 4NaOH + 3/2O2(g) → 2Na2CrO4 + MgO + 2H2O(g) (2d) 24
Cr2FeO4 + 4NaOH + 7/4O2(g) + 1/2MgO→ 1/2MgFe2O4 + 2Na2CrO4 + 2H2O(g) (2e) 25
26
In Figure 8b, the Gibbs energy change for alkali reactions 2a"2e, is plotted from which it is evident that all reactions are 27
thermodynamically feasible above 400oC. The magnitudes of Gibbs energy change also suggest that these reactions may be 28
exothermic with significant positive entropy change due to the evolution of gaseous species CO2 and H2O. Amongst the 29
products formed, sodium ferrite, aluminate and chromate are readily soluble in hot or cold water whereas sodium titanate 30
and MgO or Mg(OH)2and MgFe2O4 are insoluble in water. The preferential condition for solubility of phases implies that if 31
the alkali roasting of these minerals is performed in oxidizing atmosphere, selective separation of aluminate, titanate and 32
chromate may be feasible. 33
�34
6�.�.��7 ���������1���������� �������35
36
As shown in Figure 9, after alkali roasting, the reaction products were analysed and found to have water"soluble, as sodium 37
aluminate and insoluble components namely sodium titanate and silicates. Using the XRPD technique the phase 38
compositions of the roasted material were analysed and the phases identified are shown in Figure 10.The sodium aluminate 39
present was extracted by solubilizing it into hot water at 50ºC. The filtrate consists of water"soluble sodium aluminate, 40
whereas the remaining insoluble materials are the oxides and hydroxides of iron, titanium dioxide and other impurities left as 41
the unreacted part of red mud and bauxite. In Figure 9, the micrograph of porous solid residue shows iron"rich and titanium"42
rich phases. The presence of aluminium oxide is barely detectable in the EDX, since nearly all of alumina was extracted as 43
sodium aluminate, which is converted to Al(OH)3 via the acidification reaction (3) with carbon dioxide as shown in Figure 44
1164,65: 45
46
47
48
49
50
51
52
53
Page 13 of 28 Green Chemistry
GreenChemistryAcceptedManuscript
Publ
ishe
d on
10
Mar
ch 2
015.
Dow
nloa
ded
by U
nive
rsity
of
Lee
ds o
n 10
/03/
2015
10:
04:3
4.
View Article Online
DOI: 10.1039/C4GC02360A

Journal Name
��������������� �� ���� �� ��
�������������������
��������������������►
����������
This journal is © The Royal Society of Chemistry [year] Journal Name, [year], [vol], 00–00 |13
1
2
3
4
5
6
7
8
9
10
11
12
13
14
Figure 9: The microstructure (10 µm) of porous insoluble residues left after alkali roasting of bauxite and red mud at 775oC 15
in air and leaching with hot distilled water above 50oC. Time of roasting – 2 hours.�16
17
18
Na2O.Al2O3(s) + CO2(g) + 3H2O(l) → 2 Al(OH)3(s) + Na2CO3(a) (3) 19
�20
�21
�22
�23
�24
�25
�26
�27
28
29
30
31
32
Figure 10: X"ray powder diffraction of alkali roasted red mud and bauxite samples at 775oC in air before water leaching.The 33
diffraction data compares well with the ICDD references: 01"072"0587(Na2O(Al2O3)11), 04"011"8808 (TiFeO3),04"002"34
8136(Ti0.25Al1.75O3),04"017"0197 (Fe0.2Mn0.8TiO3) 00"030"1148 (Na2O.Al2O3.SiO2), 04"004"3579 (TiO2) , 04"011"8342 35
(CaTiO3), and 00"037"1460 Na2.58Al21.81O34 36
37
�38
39
�40
B
C
Fe,Ti,Na,Al –rich Na,Ti,Fe –rich phase
� , � - . / 0 1
����
����
�)2)�)�
�)�
�)3)&
�2 �)�)���)�
&&
��2
�
3
3
3 �
�
$�����4����������������"
,0(2������ )
�77�;�,5��
,
�6��
�
377�;�,:��
,
�:%�
,
�7759� �,>�
�165 �
�6
2
277�� ��
�77 �,
&77;�,�.1��
,��1�
�-
�77� �9��
�77 � �,.��
��0.
�
�)�)�
����
����77������2����&��2
Page 14 of 28Green Chemistry
GreenChemistryAcceptedManuscript
Publ
ishe
d on
10
Mar
ch 2
015.
Dow
nloa
ded
by U
nive
rsity
of
Lee
ds o
n 10
/03/
2015
10:
04:3
4.
View Article Online
DOI: 10.1039/C4GC02360A

��������������������������������������������������������������� ��!������ ���"�����" ����������
ARTICLE TYPE www.rsc.org/xxxxxx | XXXXXXXX
14|Journal Name, [year], [vol], 00–00 This journal is © The Royal Society of Chemistry [year]
1
2
3
4
5
6
7
8
9
10
Figure 11(a) Eh"pH diagram of the system Na"Al"Fe"H2O at 50ºC and 1 atm. (b) Eh"pH diagram of the system Na"Al"Si"H2O 11
at 50ºC and 1 atm66. 12
13
Focussing on the stability region of water (dashed lines); it is evident from Figure 11a that iron does not present a problem 14
for the precipitation of aluminium as hydroxide. However, when silica is in the aqueous media, a series of complex sodium 15
aluminium silicates are the most stable phases at pH values higher than 6, leading to lower aluminium yields and gelatinous 16
precipitates which are rather difficult to filter. Bubbling CO2 through the solution allows the recovery of the excess of alkali 17
via reaction (3) yielding aluminium hydroxide via the carbonic acidification in the aqueous medium. The Al(OH)3 18
precipitated was calcined at 1125oC for producing pure and crystalline alumina (Al2O3). The micrograph and particle size 19
distribution of calcined alumina, extracted from the red mud/bauxite mixture are shown in Figures 12a and 12b, respectively. 20
The SEM micrographs show aggregated particles, size range of which is consistent with the measured bimodal particle size 21
distribution of calcined alumina in Figure 12b.From our investigation, it was possible to control the particle size distribution 22
by controlling the rate of CO2 ingestion in the sodium aluminate solution, temperature, and the overall control of pH. 23
�24
25
26
27
28
29
30
31
32
33
34
35
36
37
Figure 12: (a) Scanning electron micrograph of the alumina extracted (100µm). (b) Cumulative distribution values with 38
bimodal particle size distribution of calcined alumina. 39
40
The concentrations of aluminium tri" and mono"hydrate in bauxite determines the operation of the Bayer process, and 41
consequently most of the Bayer plants are designed for processing of specific types of bauxite concentrates. For example, 42
the digestion of mono"hydrates requires high temperature and higher concentration of soda, compared to a tri"hydrate. The 43
presence of reactive silica (kaolinite) and other impurities also influence the process parameters and the amount of red mud 44
generated23"30. Besides the control of hydroxide solubility, the corrosive alkaline solution is a limiting factor for rising 45
reaction temperature and pressure. These problems limit the yield of alumina and consequently, a substantial amount of 46
alumina (15–25%) and soda (5–10%) remain locked in the red mud. Such feedstock and operational issues do not appear to 47
be the determining factor for the high temperature oxidative alkali roasting, followed by leaching, which is why the approach 48
may be more suitable for the extraction of alumina from a wide range of bauxite concentrates, red mud and perhaps 49
kaolinites; which are highly undesirable in the Bayer process. 50
�51
�52
9�:� 91:�
91:�9�:�
Page 15 of 28 Green Chemistry
GreenChemistryAcceptedManuscript
Publ
ishe
d on
10
Mar
ch 2
015.
Dow
nloa
ded
by U
nive
rsity
of
Lee
ds o
n 10
/03/
2015
10:
04:3
4.
View Article Online
DOI: 10.1039/C4GC02360A

Journal Name
��������������� �� ���� �� ��
�������������������
��������������������►
����������
This journal is © The Royal Society of Chemistry [year] Journal Name, [year], [vol], 00–00 |15
6�.�3��7 ��������������������� ����1
�2
The roasting characteristics of the non"magnetic fraction of ilmenite with sodium bicarbonate were investigated for 3
determining the physical and chemical liberation of rare earth compounds. Major phases in the material roasted at 900 oC 4
for 4 hours were identified by XRPD and are presented in Figure 13b, from which it is evident that the exogenous alumina 5
forms a complex phase, Na2Al0.5Fe9.5O15. Sodium carbonate on decomposition reacts with TiO2 and forms one of the many 6
types of known sodium titanates, namely Na2TiO3, which coexists with Na2Al0.5Fe9.5O15. 7
8
�9
�10
�11
�12
�13
14
15
Figure 13: (a). Backscattered micrograph of the roasted non"magnetic ilmenite at 900oC for 4 hours in air with sodium 16
carbonate (100µm).(b). XRPD data of the roasted non"magnetic ilmenite at 900oC for 4 hours in air with sodium carbonate. 17
The diffraction data compares well with the ICDD references:40"0024 (Na2Al0.5Fe9.5O15), 50"0110 (Na2TiO3)00"029"0403 18
(Ce, La, Th, Nd)PO4, 00"039"0382 Na2Si4O9, 04"013"3453 Ti0.8Fe1.2O3, 04"015"6618 Na2Zr(Si2O7), 01"076"5977 Al(PO4) 19
and 00"035"0424 NaAlSiO4. 20
In Figure 13a, the atomic number contrast indicates a strong segregation of rare"earth elements in the bright grey areas of the 21
microstructure along the cracks within the original granular structure of ilmenite. Dark grey areas, rich in Ti, Ca, Fe, Al, Si, 22
and Na elements surround the bright grey REE rich phases. The microstructural abundance of sodium"iron"aluminium 23
complex phases is evident from this microscopic analysis. The EDX spectrum of the bright areas is dominated by 24
neodymium X"ray emissions with significant proportions of cerium and thorium. Titanium was identified in the spectra of 25
the bright phases; nevertheless, this element is not present because the X"ray K"alpha line of Ti at 4.5 KV overlaps with that 26
Nd L"lines at 4.3KV, confirming that the main peak is that of Nd and not Ti. In Figure 14, the X"ray powder diffraction 27
pattern of the reaction products obtained after roasting of ilmenite with K2CO3 at 825 oC for 4 hours in air, shows the 28
presence of complex phases, namely the K2O.8TiO2 and the non"stoichiometric K2.3Fe2.3Ti5.7O16phases63,67. Strong 29
segregation of rare"earth elements was also observed, as was during the roasting of minerals with sodium carbonate. 30
�31
�32
�33
�34
�35
�36
37
Figure 14: X"ray powder diffraction pattern of the reaction product formed as a result of chemical reaction between K2CO3 38
and FeTiO3 at 825oC for 4 hours in air. The main phases compare well with the ICDD references:00"041"1100 39
K2O.8TiO200"040"0960 K2.3Fe2.3Ti5.7O16, 00"032"0731 K1.25Al1.25Si0.75O4, 00"046"1295 (Ce, La, Nd)PO4 and 04"009"5769 40
Al(PO4) 41
� , � - . / 0 1
�
�)�
����
������
����2
��22
�)�
22
2
2
����
���
����
�
3777? �1
�/�.
3
3)2
3)2
3
3
3)�
3
�)�
�
�
�
�
$�����4��������������"�
,�52������6
�
�777?,��9�
,�� �
.�0
�/
�77?��,.��
��,.%�
�0.
-
2775��)��);26<-
�77��<-
����77������2����&��2
Page 16 of 28Green Chemistry
GreenChemistryAcceptedManuscript
Publ
ishe
d on
10
Mar
ch 2
015.
Dow
nloa
ded
by U
nive
rsity
of
Lee
ds o
n 10
/03/
2015
10:
04:3
4.
View Article Online
DOI: 10.1039/C4GC02360A

��������������������������������������������������������������� ��!������ ���"�����" ����������
ARTICLE TYPE www.rsc.org/xxxxxx | XXXXXXXX
16|Journal Name, [year], [vol], 00–00 This journal is © The Royal Society of Chemistry [year]
Water leaching of the roasted materials at room temperature allows physical separation by forming three unique phases: a 1
solution in which the alkali containing ferrite dissolves together with the soluble aluminium as potassium or sodium 2
aluminate. The alkali titanate complex settles at the bottom of the leaching vessel and a colloidal layer forms at the top 3
which remains submerged just below the top surface68 and separated from the settled residues. The colloidal layer, shown in 4
Figure 15, was filtered and analyzed by XRF and its chemical composition is presented in Table 6. 5
�6
7
Figure 15: The photograph of the leaching mixture (right) which was allowed to settle after roasting of ilmenite. The leaching was carried 8
out with the deionized water at room temperature for 30 minutes. The dried colloidal product (left) on filter paper is shown68. 9
Table 6: Chemical composition of the colloidal layer obtained after water leaching at room temperature. 10
Element Concentration (%w/w) Element Concentration (%w/w) Ca 69.80 Y 0.60 La 5.70 Fe 0.50 Ce 5.40 Sm 0.10 Si 5.00 Al 0.10 Th 3.80 Gd 0.10 Nd 3.00 Ti 0.05 Pr 1.90 V 0.04 P 1.70 Nb 0.09
11
During the water leaching process, the following reactions take place: 12
13
5 Na2TiO3(s) + H2O(l) → Na8Ti5O14(s) + 2NaOH(a) (4a) 14
Na2Fe2O4(a) + H2O(l) → Fe2O3(s) + 2NaOH(a) (4b) 15
Fe2O3(s) + 3H2O(l) → 2 Fe(OH)3(s) (4c) 16
17
Evidently the reactions (4a) and (4b) contribute to an increase in pH of the solution, from which a part of the alkali may be 18
recovered by CO2 bubbling into the solution. Using reaction (4c) iron hydroxide is precipitated from the alkali solution. In 19
order to remove the iron generated from the dissociation of sodium ferrite in eq.(4b), a second leaching step is required to 20
simultaneously reduce Fe3+ to Fe2+ with ascorbic acid, followed by complexing Fe2+ with oxalic acid which yields iron (II) 21
oxalate at pH below 4 as stated in Figure 1669. The shaded area in Figure 16, in the pH range 12"14 represents the conditions 22
occurring during water leaching, and the region between pH 0"4 corresponds to the organic acid leaching. During the acid 23
leaching process, the following reactions take place: 24
25
Na8Ti5O14(s) + 4H2C2O4(a) → 5TiO2(s) + 4Na2C2O4(a) + 4H2O(l) (5a) 26
Fe(OH)2(s) + H2C2O4(a) → FeC2O4(a) + 2H2O(l) (5b) 27
28
Similar reactions may be employed for roasting with potassium carbonate. In both cases, synthetic rutile with a purity of 29
97wt% with respect to TiO2 was achieved on laboratory scale experiments, the chemical analysis of synthetic rutile is shown 30
below in Table 7. 31
32
Table 7. Chemical analysis of the leached product after organic acid leaching 33
Oxide Concentration (%wt) TiO2 97.0 FeO 0.0
Fe2O3 1.3 CeO2 0.0 La2O3 0.0
�34
$���������������� ���
!����������� �
%������ ����������
( ���������������� �
Page 17 of 28 Green Chemistry
GreenChemistryAcceptedManuscript
Publ
ishe
d on
10
Mar
ch 2
015.
Dow
nloa
ded
by U
nive
rsity
of
Lee
ds o
n 10
/03/
2015
10:
04:3
4.
View Article Online
DOI: 10.1039/C4GC02360A

Journal Name
��������������� �� ���� �� ��
�������������������
��������������������►
����������
This journal is © The Royal Society of Chemistry [year] Journal Name, [year], [vol], 00–00 |17
�1
�2
�3
�4
�5
�6
�7
�8
�9
Figure 16: The Eh"pH diagram of the system Na"Ti"Fe"O calculated by Fact"Sage 6.4 software at 70oC. NT3: Na2TiO3, NT8: 10
Na8Ti5O1466. 11
�12
6�.�4��7 ����������� ��������� ����13
�14
The percentage yield of water"soluble sodium chromate after roasting with different alkali salts are shown in Figure 17. 15
�16
�17
�18
�19
�20
�21
�22
Figure 17: (a) Chromium extraction yields after roasting at 1000oC for 2 hours in air and water leaching at 50oC for 45 23
minutes with different alkali salts. (b). Chromium extraction yields after roasting at 1000oC for 2 hours and water leaching at 24
50oC for 45 minutes with different alkali salts in richer oxygen atmosphere with intermittent stirring. 25
26
As can be observed, the alkali hydroxides are more reactive than carbonates; nevertheless, low extraction yields were 27
achieved in all cases. One of the most important barriers to overcome during the processing of chromite minerals is to ensure 28
that the oxygen transport to reaction interface is maintained. The oxygen transfer is limited by the formation of a eutectic 29
liquid between Na2CrO4 and K2CrO4 and their respective Na or K alkali salt44"46. To overcome the oxygen transport barrier 30
in air, intermittent stirring was implemented and the results are shown in Figure 17b. It is worthy to note that the 31
performance of potassium salts is lower than the sodium ones. This difference may be due to the higher viscosity of the 32
eutectic liquid20. On the other hand, roasting with sodium hydroxide significantly increased the extraction with maximum 33
recoveries above 97%. Figures18a and18cpresents the XRPD patterns of the roasted samples, which shows that the leached 34
waste has unreacted chromite. This is not the case for the samples roasted in richer oxygen atmosphere, where the residual 35
unreacted chromium is low. After chromium reaction, magnesium, aluminium iron spinel Mg(Fe0.5Al0.5)2O4 is formed and 36
further decomposed into (Mg0.99Fe0.01)O, water soluble NaAlO2 and Fe3O4. The presence of magnetite (Fe3O4) is a clear 37
evidence of the lack of oxygen during the roasting reaction, in contrast with the presence of Fe2O3 in the samples roasted in 38
richer oxygen atmosphere (Figure18b).The microstructural analysis of the samples with and without stirring does not show 39
significant differences amongst them after water leaching. For example, the SEM microstructure of hydroxide roasted 40
;�8 ?8 ;�,�� ?,��
,
-
/
1
�
������������������2�5@6
9�:�
;�8 ?8 ;�,�� ?,��
,
-
/
1
�
������������������2�5@6
91:�
Page 18 of 28Green Chemistry
GreenChemistryAcceptedManuscript
Publ
ishe
d on
10
Mar
ch 2
015.
Dow
nloa
ded
by U
nive
rsity
of
Lee
ds o
n 10
/03/
2015
10:
04:3
4.
View Article Online
DOI: 10.1039/C4GC02360A

��������������������������������������������������������������� ��!������ ���"�����" ����������
ARTICLE TYPE www.rsc.org/xxxxxx | XXXXXXXX
18|Journal Name, [year], [vol], 00–00 This journal is © The Royal Society of Chemistry [year]
sample is shown in Figure 19. In this figure, the main structural feature which can be observed is the compact structure of 1
the particles roasted with sodium salts in contrast with the particles roasted with potassium salts which present extensive 2
breakage of the product layer, caused by intra"particle strain resulting from diffusion of larger K+ ions into the crystal lattice. 3
Apparently, a higher extraction yield would be expected for the roasting with potassium salts because the breakage of the 4
product layer increases the available reaction surface when compared with sodium salts roasting. However, putting into the 5
manifest a lower oxygen transport may become more severe with potassium ions because of the larger surface area of broken 6
particles, produced from chemical reaction. As a result the apparent tortuosity of oxygen transport is likely to increase, 7
compared to sodium"ion reacted chromite in which case the chromite particles do not disintegrate after reaction due to molar 8
volume change. 9
�10
11
12
13
14
15
16
17
18
19
20
21
22
23
24
25
26
27
28
Figure 18.XRPD pattern of the alkali roasted chromite (a) NaOH at 1000oC for 2 hours in air after water leaching at 50oC for 29
45 min without stirring, (b) NaOH at 1000oC for 2 hours in 30% O2 – 70% N2atmosphere after water leaching at 50oC for 45 30
min with stirring. (c)Na2CO3 at 1000oC for 2 hours in air after water leaching at 50oC for 45 min without stirring. The 31
diffraction data compares well with the ICDD references: 01"070"6389 ((Fe0.51Mg0.49)(Cr0.73Al0.27)2O4),01"080"3015 32
(Mg(Fe0.5Al0.5)2O4), 04"007"2718 (Fe3O4), 01"076"2586 ((Mg0.99Fe0.01)O), and 00"039"1346 (Fe2O3). 33
34
35
36
37
38
39
40
41
42
43
44
45
46
, � - . / 0 1
�)3)2
2
�
�)3)2
�)3)2
�
$�����4��������������"
,�52������6
�7759� �.�>�
�-�65��
�0,��
�,06,
-
377>�59� �.��
�.6,
-
�775>� ���9�
� �6
2779��
-
�)3)2
� �)3
� 22
3
�%�
, � - . / 0 1
�
3�
�775>� ���9�
� �6
�3
3�
377�9��
-3
�
�7759� �.�>�
�-�65��
�0,��
�,�6,
-
�
�
�
$�����4���������������"�
,�52������6
�
�$�
, � - . / 0 1
3 �3
��
3
3
3
3775>� ���9�
� �6
� �
�
3
3�
$�����4���������������"�
,�52������6
�779�,
��#�
Page 19 of 28 Green Chemistry
GreenChemistryAcceptedManuscript
Publ
ishe
d on
10
Mar
ch 2
015.
Dow
nloa
ded
by U
nive
rsity
of
Lee
ds o
n 10
/03/
2015
10:
04:3
4.
View Article Online
DOI: 10.1039/C4GC02360A

Journal Name
��������������� �� ���� �� ��
�������������������
��������������������►
����������
This journal is © The Royal Society of Chemistry [year] Journal Name, [year], [vol], 00–00 |19
�1
�2
�3
�4
�5
�6
�7
�8
�9
�10
11
12
13
Figure 19. Back scattered micrograph of the chromite concentrate roasted with sodium and potassium hydroxides. (a). 14
NaOH at 1000oC for 2 hours in air after water leaching at 50oC for 45 min without stirring. (b) KOH at 1000oC for 2 hours in 15
air after water leaching at 50oC for 45 min without stirring. (c) NaOH at 1000oC for 2 hours in 30% O2 – 70% N2atmosphere 16
after water leaching at 50oC for 45 min with stirring. (d) KOH at 1000oC for 2 hours in 30% O2 – 70% N2atmosphere after 17
water leaching at 50oC for 45 min with stirring. 18
Since sodium hydroxide ($500/t) is more expensive than bicarbonate and carbonates (<$100/t), a part of NaOH was replaced 19
by sodium carbonate and bicarbonate. The results are compared in Figure 20. 20
�21
�22
�23
�24
�25
�26
�27
�28
�29
Figure 20: Chromium extraction yields after roasting at 1000oC for 2 hours in 30%O2 – 70%N2atmosphere with intermittent 30
stirring and water leaching at 50oC for 45 minutes with different sodium salts. 31
32
The partial substitution of sodium hydroxide led to lower extraction yields. Only the substitution by 10% sodium bicarbonate 33
showed a slightly increase of the extraction yield. 34
35
NaOH NaOH"10% Na2CO3 NaOH"20% Na2CO3 NaOH" 10% NaHCO3 NaOH"20% NaHCO3
90
92
94
96
98
100
Ch
rom
ium
ex
trac
tio
n y
ield
(%
)
Page 20 of 28Green Chemistry
GreenChemistryAcceptedManuscript
Publ
ishe
d on
10
Mar
ch 2
015.
Dow
nloa
ded
by U
nive
rsity
of
Lee
ds o
n 10
/03/
2015
10:
04:3
4.
View Article Online
DOI: 10.1039/C4GC02360A

��������������������������������������������������������������� ��!������ ���"�����" ����������
ARTICLE TYPE www.rsc.org/xxxxxx | XXXXXXXX
20|Journal Name, [year], [vol], 00–00 This journal is © The Royal Society of Chemistry [year]
6�.�5��������������������� ����������� �����+��1
2
Figure 21shows the effects of vanadium concentration and sodium hydroxide leaching on rutile lattice parameters. 3
4
5
6
7
8
9
10
11
12
13
Figure 11: Effects of leaching and V2O5 concentration on rutile lattice parameter 'a'. Parameters were determined by the 14
Rietveld refinement method. 15
16
Doping rutile with V2O5led to a decrease in lattice parameters that followed Vegard’s law70 very well (R2 values of 0.985 17
and 0.995 for leached and unleached pellets respectively), confirming that the smaller vanadium ions are substituting the 18
larger titanium ions in the rutile lattice. The leached samples had larger lattice parameters than the ones which were not 19
leached, showing that leaching had to some extent dissolved vanadium from the rutile solid solution. Atomic Absorption 20
Spectrometry (AAS) was used to determine the amount of vanadium dissolved when the sintered pellets were leached in 2M 21
NaOH. The results are presented in Figure 22. 22
� , � - . / 0 1 �
�
,
�
-
.
�A�������2�4���2�"�
�$,�B� ����
C,
.���������2�5@6
DC,.
�5���@�C,
.��22�2���� �
,6
23
Figure 22: Leaching of vanadium from rutile lattice. Recovery was calculated from the amount of vanadium in solution after 24
leaching for 3 hours 71. 25
Figure 22 shows that after 3 hours of leaching in 2M NaOH, a maximum of 40% V2O5 could be recovered from pellets with 26
8.6 mol% V2O5. Vanadium could not be recovered from samples with 1.3 mol% V2O5 showing that NaOH solutions are not 27
suitable for complete removal of vanadium from rutile lattice. Both X"ray powder Diffraction (XRPD) and Scanning 28
Electron Microscopy (SEM) confirmed that vanadium was completely dissolved in the rutile phase, showing that vanadium 29
has a solubility limit greater than 8.6 mol% in rutile. Some researchers72 observed that vanadium does not precipitate 30
(exsolve) from the solvent rutile matrix for concentrations as high as 20 mol% vanadium pentoxide. 31
32
� , � - . / 0 1 �
-�.1,
-�.1-
-�.1/
-�.11
-�.�
-�.�,
$"�������������E����������)�5Å6�
DC,.
�5���@�C,
.��22�2���� �
,6
F�������2�E�����
�������2�E�����
�C����2G������5$,�B� ��1.6
�C����2G������5$,�B� ���.6
Page 21 of 28 Green Chemistry
GreenChemistryAcceptedManuscript
Publ
ishe
d on
10
Mar
ch 2
015.
Dow
nloa
ded
by U
nive
rsity
of
Lee
ds o
n 10
/03/
2015
10:
04:3
4.
View Article Online
DOI: 10.1039/C4GC02360A

Journal Name
��������������� �� ���� �� ��
�������������������
��������������������►
����������
This journal is © The Royal Society of Chemistry [year] Journal Name, [year], [vol], 00–00 |21
1
Figure 23: SEM images for the TiO2 – V2O5 mixtures after sintering at 1100 oC for 24 hours, 1.3 mol% V2O5 (left), 4.3 2
mol% V2O5 (middle), 8.6 mol% V2O5 (right). 3
4
SEM images in Figure 23 show a general increase in average particle sizes with increasing V2O5 content (left to right), with 5
a preferential orientation of the rod"like particles which shows that the crystals and particles grew preferentially along the ‘a’ 6
axis. The preferential growth was also confirmed by lattice parameter analysis where the increase in ‘c’ parameter was not as 7
marked as the increase in the ‘a’ parameter. 8
9
10
11
12
13
14
15
16
17
18
19
20
21
22
Figure 24 XRD patterns of sintered pellets with 1.3 (a), 4.3 (b) and 8.6 (c) mol% V2O5 before and after leaching. The 23
diffraction data compares well with the ICDD references: 04"008"7811 (TiO2). 24
�25
Figure 24 presents the XRD patterns for the sintered binary mixtures before and after leaching in 2M NaOH. The patterns 26
show that vanadium is completely dissolved in the rutile phase at all the compositions presented. It is also notable that 27
doping with vanadium enhances the intensity of XRD peaks, particularly the (110) peak. This can be a result of preferential 28
substitution of the Ti4+ ions, hence the preferential growth of the crystals along the ‘a’ axis. 29
;�� � ������� �����������������������30
Based on the chemical analyses presented in Table 5 and the phase and microstructural information provided by the XRPD 31
and SEM/EDX analysis of the ores, Table 8 presents the mineral compositions calculated for each concentrate. 32
�. , ,. � �. - -. . .. / /. 0
���
�
�
�
�
�
�
�
,°(2������)
��: �,��
�
$�����4��������������"
H�&������������
�
��
�
�
�
�
�
�
�
�
$�����4��������������"
��&�������������$� �
�. , ,. � �. - -. . .. / /. 0
�
��� �
� �
� �
,°(2������)
��: �,�
�
$�����4��������������"
H�&������������
���
�
�
�
�
�
�
�
�
�
$�����4��������������"
�&�������������%�
�. , ,. � �. - -. . .. / /. 0
���
��
���
�
�
,°(2������)
��� �,�5�"����6�
�
$�����4��������������"
H�&������������
�
��
�
�
��
�
�
�
�
�
$�����4��������������"
�&������������
�#�
Page 22 of 28Green Chemistry
GreenChemistryAcceptedManuscript
Publ
ishe
d on
10
Mar
ch 2
015.
Dow
nloa
ded
by U
nive
rsity
of
Lee
ds o
n 10
/03/
2015
10:
04:3
4.
View Article Online
DOI: 10.1039/C4GC02360A

��������������������������������������������������������������� ��!������ ���"�����" ����������
ARTICLE TYPE www.rsc.org/xxxxxx | XXXXXXXX
22|Journal Name, [year], [vol], 00–00 This journal is © The Royal Society of Chemistry [year]
Table 8. Mineral composition of bauxite, non"magnetic ilmenite and chromite concentrates (% wt)a. 1
Bauxite Non"magnetic ilmenite Chromite FeTiO3 0.0 34.0 0.0
Al2Si2O5(OH)4 6.4 0.0 0.0 TiO2 2.0 66.0 0.0 Fe2O3 12.0 0.0 16.2
Al(OH)3 79.6 0.0 0.0 MgSiO3 0.0 0.0 6.9 MgCr2O4 0.0 0.0 33.3 FeCr2O4 0.0 0.0 21.0 FeAl2O4 0.0 0.0 23.0
a. Those oxides which concentration is below 1% have not been taken into account to calculate the mineral composition 2
�3
;�,�����������4
Energy consumption in treating the mineral concentrates per kg of oxide produced from the alkali roasting process has been 5
compared with the most detailed data founded in literature. This section presents the energy balance analysis. 6
�7
;�,�,��8��� �� �����8
�9
In the Bayer process, a digestion of the bauxite concentrate is carried out at 200oC in NaOH solutions with a concentration of 10
140g/l. The iron compounds associated with the mineral does not react with the alkali, being incorporated to the red mud. 11
The aluminium minerals react with alkali following the reactions73 (6a) and (6b): 12
�13
Al2Si2O5(OH)4(s) + 2NaOH(a) → Na2Al2Si4O12(s) + 3H2O(l) (6a) 14
Al(OH)3(s) + NaOH(a) → NaAl(OH)4(a) (6b) 15
16
After digestion, the soluble sodium aluminate is precipitated as gibbsite at 95ºC according to reaction (6c). Then, the gibbsite 17
produced is calcined at 1000ºC to produce alumina. 18
�19
2NaAl(OH)4(a)→ Al2O3.3H2O(s) + 2NaOH(a) (6c) 20
Al2O3.3H2O(s)→ Al2O3(s) + H2O(g) (6d) 21
�22
;�,�2��8���� �� �����23
�24
In the Becher process, the ilmenite is digested with sulphuric acid at 200ºC, the digestion is carried out until the solution has 25
approximately 120 g/l TiO2 and 240 g/l free H2SO4. The reactions considered during ilmenite digestion are as follows74: 26
27
FeTiO3(s) + 2H2SO4(a) → TiOSO4(a) + FeSO4(s) + 2H2O(l) (7a) 28
TiO2(s) + H2SO4(a) → TiOSO4(a) + H2O(l) (7b) 29
30
Titanic acid is precipitated from solution by evaporation until the solution reaches a concentration of 200 g/l of TiO2 at 75ºC 31
and 270 g/l of free H2SO4 according to reaction (7c). Titanic acid is calcined at 900ºC to remove the excess sulphur 32
associated to the precipitate as SO2. 33
34
TiOSO4(a)+2H2O(l)→H2TiO3(s)+H2SO4(a) (7c) 35
H2TiO3(s)→TiO2(s)+H2O(g) (7d) 36
�37
;�,�.��$�� ��� ���������������� �����38
39
In this process, chromite concentrate is digested with a 60% w/w NaOH solution at 250ºC in an oxygen atmosphere with a 40
partial pressure of 3.2MPa. The following reactions take place during this process56: 41
42
MgSiO3(s) + 2NaOH(a) → MgO(s) + Na2SiO3(a) + H2O(l) (8a) 43
MgCr2O4(s) + 4NaOH(a) + 3/2O2(g) → MgO(s) + 2Na2CrO4(a) + H2O(l) (8b) 44
2FeCr2O4(s) + 10NaOH(a) + 7/2 O2(g) → Na2O.Fe2O3(a) + 4Na2CrO4(a) + 5H2O(l) (8c) 45
4FeAl2O4(s) + 12NaOH(a) + O2(g) + 14H2O(l) → Na2O.Fe2O3(a) + NaAl(OH)4(a) + 4H2O(l) (8d) 46
4Na2SiO3(a) + 2NaAl(OH)4(a) → Na2Al2Si4O12(s) + 8NaOH(a) (8e) 47
MgO(s) + Na2O.Fe2O3(a) + H2O(l) → MgFe2O4(s) + 2NaOH(a) (8f) 48
�49
;�,�3��%�������������50
51
Page 23 of 28 Green Chemistry
GreenChemistryAcceptedManuscript
Publ
ishe
d on
10
Mar
ch 2
015.
Dow
nloa
ded
by U
nive
rsity
of
Lee
ds o
n 10
/03/
2015
10:
04:3
4.
View Article Online
DOI: 10.1039/C4GC02360A

Journal Name
��������������� �� ���� �� ��
�������������������
��������������������►
����������
This journal is © The Royal Society of Chemistry [year] Journal Name, [year], [vol], 00–00 |23
The chemical reactions (1a) to (5b) have been considered for the alkali roasting of the minerals under study with particularity 1
that when Na2CO3 is used, CO2(g) is presented in the off"gases. 2
3
The operating conditions considered are summarized in Table 9.The theoretical energy requirements for the processes were 4
calculated using the HSC 5.1 software75. The following assumptions were made: 5
6
•� No heat losses were accounted. 7
•� The reactants go into the reaction chamber at 25oC and the products leave it at the temperature specified in Table 9 8
for each process step. 9
•� The off"gases were cooled down from the out temperature to 50oC to recover the heat. 10
•� The production of Cr2O3 was not taken into account, as there are not significant differences in the processes 11
considered. 12
•� Greenhouse gas emissions were calculated applying a conversion factor of 0.49 KgCO2"eq per kWh according to 13
the guidelines provided by the Department for Environment, Food & Rural Affairs (Defra)76 and taking into 14
account the difference between the amount of carbon dioxide generated during the roasting process and the 15
consumed during the alkali recovery step. 16
Page 24 of 28Green Chemistry
GreenChemistryAcceptedManuscript
Publ
ishe
d on
10
Mar
ch 2
015.
Dow
nloa
ded
by U
nive
rsity
of
Lee
ds o
n 10
/03/
2015
10:
04:3
4.
View Article Online
DOI: 10.1039/C4GC02360A
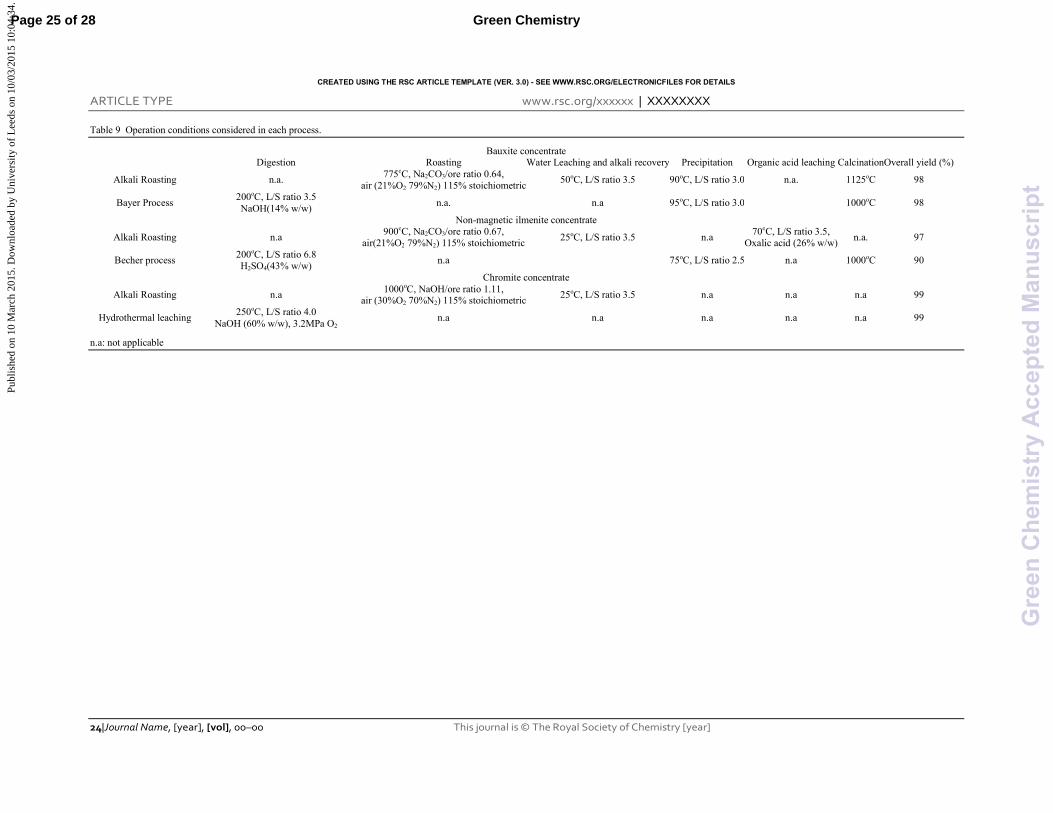
��������������������������������������������������������������� ��!������ ���"�����" ����������
ARTICLE TYPE www.rsc.org/xxxxxx | XXXXXXXX
24|Journal Name, [year], [vol], 00–00 This journal is © The Royal Society of Chemistry [year]
Table 9 Operation conditions considered in each process.
Bauxite concentrate Digestion Roasting Water Leaching and alkali recovery Precipitation Organic acid leaching CalcinationOverall yield (%)
Alkali Roasting n.a. 775oC, Na2CO3/ore ratio 0.64,
air (21%O2 79%N2) 115% stoichiometric50oC, L/S ratio 3.5 90oC, L/S ratio 3.0 n.a. 1125oC 98
Bayer Process 200oC, L/S ratio 3.5 NaOH(14% w/w)
n.a. n.a 95oC, L/S ratio 3.0 1000oC 98
Non"magnetic ilmenite concentrate
Alkali Roasting n.a 900oC, Na2CO3/ore ratio 0.67,
air(21%O2 79%N2) 115% stoichiometric 25oC, L/S ratio 3.5 n.a
70oC, L/S ratio 3.5, Oxalic acid (26% w/w)
n.a. 97
Becher process 200oC, L/S ratio 6.8 H2SO4(43% w/w)
n.a 75oC, L/S ratio 2.5 n.a 1000oC 90
Chromite concentrate
Alkali Roasting n.a 1000oC, NaOH/ore ratio 1.11,
air (30%O2 70%N2) 115% stoichiometric25oC, L/S ratio 3.5 n.a n.a n.a 99
Hydrothermal leaching 250oC, L/S ratio 4.0
NaOH (60% w/w), 3.2MPa O2 n.a n.a n.a n.a n.a 99
n.a: not applicable
Page 25 of 28 Green Chemistry
GreenChemistryAcceptedManuscript
Publ
ishe
d on
10
Mar
ch 2
015.
Dow
nloa
ded
by U
nive
rsity
of
Lee
ds o
n 10
/03/
2015
10:
04:3
4.

Journal Name
��������������� �� ���� �� ��
�������������������
��������������������►
����������
����!�"��������#� ���$�����%��������&�����������'����(� ��������)�'����()��� ��)� * ��+&'�
;�2����������
The results obtained after the energy and greenhouse gas analysis are presented in Table 10.
Table 10 Energy and greenhouse gas analysis
Reduction (%) Energy (kWh per Kg Oxide)Emissions (KgCO2"eq per Kg Oxide)EnergyEmissions
Bayer process 2.53 1.24 Bauxite roasting 1.64 0.82
35.2 34.0 Becher process 2.08 1.02
Ilmenite roasting 0.7 0.57 66.3 44.1
Chromite hydrothermal leaching 1.19 0.58 Chromite roasting 0.55 0.27
54.0 53.4
�
As can be observed, alkali roasting seems to be a sustainable method for the treatment of refractory oxides than the wet 5
chemistry routes. Reductions higher than 30% in energy consumption and GHG emissions can be achieved when roasting
route is selected as treatment method. However, it is important to bear in mind that the mineralogy of the concentrate will be
one of the main parameters that will determine the adequate processing scheme.
/��!�������
High temperature alkaline roasting process in air investigated herein demonstrates its potential for extraction of alumina 10
from red mud and bauxite. The phase analysis of the reaction product shows that the alumina locked into the crystalline
lattice of silicates is also chemically liberated by forming sodium aluminate at 775oC for example, at which both bauxite and
red mud remain reactive. More than 98% of alumina was extracted from the soluble sodium aluminate solution and at least
99% of alumina formed soluble sodium aluminate after alkali roasting. The alkali carbonate is recycled during the process,
making this extraction process commercially viable. The red mud generated during the process is less alkaline and can be 15
further processed for extraction of Fe2O3 and TiO2.
The alkali roasting of non"magnetic ilmenite in air was considered as an option for demonstrating the technique for selective
separation of synthetic rutile (predominantly titanium dioxide) from the valuable rare"earth and remaining less important
minerals. The non"magnetic concentrates were roasted with alkali (Na2CO3, KOH, K2CO3) for effecting chemical change in
the parent ilmenite lattice, which at temperatures above 800oC allows rapid alkali ion diffusion, yielding large lattice strain 20
between parent ilmenite and alkali titanate. The strain causes trans"granular and peripheral fracture. Such a fracture process,
induced by alkali diffusion, releases the exsolved monazite and zircon mineral phases to be released during water washing
and leaching. The alkali titanate was then leached with dilute organic acids at pH below 4, which yielded synthetic rutile of
97% purity. Leaching of vanadium from solvent rutile matrix with sodium hydroxide at 60 oC for 3 hours is not sufficient for
removing vanadium from the rutile phase for subsequent recovery, particularly at low concentrations of vanadium. This is 25
most likely because vanadium changes to the 4+ state when it substitutes the octahedrally coordinated Ti4+ ions in the rutile
lattice, rendering it less soluble in NaOH. Sodium hydroxide leaching is therefore not applicable for beneficiating natural
rutile or chloride process wastes when vanadium is present in the rutile matrix.
The literature review on long"standing chromate chemicals manufacturing suggests that the lime"based alkali treatment of
chromite ore as a process is obsolete, and its replacement with lime"free alkali roasting is adopted. The process efficiency is 30
very sensitive to feedstock. The alkali roasting is also dependent on the volume of liquid phase produced which in case of
silica"rich chromite yields poor efficiency, less than 40%. The use of a richer oxygen atmosphere (30% O2 70% N2)
combined with intermittent stirring allows the processing of low silica concentrates by lime"free alkali roasting with a
chromium extraction efficiency of 99%.
The energy and GHG emissions analysis showed that the alkali roasting should be considered as a “greener approach” for 35
the treatment of refractory oxides concentrates and mineral wastes in those cases where the mineralogy of the concentrate
allows it.
�
�
�40
Page 26 of 28Green Chemistry
GreenChemistryAcceptedManuscript
Publ
ishe
d on
10
Mar
ch 2
015.
Dow
nloa
ded
by U
nive
rsity
of
Lee
ds o
n 10
/03/
2015
10:
04:3
4.
View Article Online
DOI: 10.1039/C4GC02360A

26|Journal Name, [year], [vol], 00–00 This journal is © The Royal Society of Chemistry [year]
%��<����������
The authors acknowledge the financial supports from a consortium UK industry and the EPSRC standard grants
(GR/T19889/01 and GR/L95977/01) and PhD studentships for research which was initiated in 1997 at the University of
Leeds. A. Jha also acknowledges the support from the European Union’s Marie Curie Fellowship grant for Dr Sanchez"
Segado and from the NERC’s Catalyst Grant reference NE/L002280/1. 5
���� �����
1 F. Habashi, CIM Bulletin, 1988,;,, 70"74.
2 F.Habashi, CIM Bulletin 2004, /6, 61"64.
3 UK Steel Federation.� ��������*�2013, 1"17.
4 Organisation of European Aluminium Refiners and Remelters (OEA). �� "�� "� �������(� �� ��+�$� ���� ����� ��� ,�(�� - ������10
)��� ���, 2013, 1"51.
5 (EU), E.a.I.D.G., .����������*�"����������������� ��!���+�������������!����/��'�(�0�� +��������(������������*�"����������
6 P. Nuss and M.J. Eckelman, )����1�, 2014, /, e101298.
7C. Si, Y. Ma and C. Lin, �$�,�2���$������, 2013, 233=234, 54"59.
8 S. Sushil and V. S. Batra, Appl. Catal. B, 2008, 81, 64"77. 15
9 M.P. Antony, V.D. Tathavadkar, C.C. Calvert and A.Jha, ������������������3, 2001, .2, 987"995.
10 H.B. Xu, Y. Zhang, Z.H. Li, S.L. Zheng, Z.K. Wang, T. Qi and H.Q. Li, ��.����)���, 2006, ,3, 211"219.
11 R.D. van der Weijden, J.Mahabir, A. Abbadi and M.A. Reuter, ,����"����� �(�, 2002, 53, 131"146.
12 L. Zhao, L. Wang, T. Qi, D.Chen, H. Zhao and Y. Liu ,,����"����� �(�, 2014, 53, 106"109.
13 E.H.M. Moors ,��.����)���, 2006, ,3, 1121"1138. 20
14 G.B. Kaufmann,�.��" � �, 1991, 5;, 270.
15 A. Jha ,��������, 2011, 5., 39"42.
16 N. Adamson, E.J. Bloore and A.R. Car , Basic principles of Bayer process design, extractive metallurgy of aluminium, Vol. I, New York,
NY:Interscience, 1963.
17 G.E. Viens, R.A. Campdell and R.R. Rogers, ����$�.�$���$����(����$�1957, 5-, 405"410. 25
18 C. Klein and A. Philpotts, �����"���������4�����., New York: Cambridge University Press, 2013.
19 W.A. Deer, R.A. Howie and J. Zussman, ���'!���"�(���������5#�����6�!��������#������+����0�� +, Longmans, London, 1962.
20 V.D. Tathavadkar, M.P. Antony and A Jha, ����$��$�������, 2004, .., 65"75.
21Crystal Maker, (Sofware for advance chemicals & Materials structures modelling) version 6.0, Oxford University, 2012.
22 E.H.M. Moors, K.F. Mulder and P.J. Vergragt, ��.����)���, 2005, ,., 657"668. 30
23S Srikanth, A Bandopadhyay, T J Alex, and A Jha, An ������(������������"����(!��� ������������" �����������������������������
������, NML Conference on Recycling of Industrial Waste, editor A Bandopadhyay 8"10 Feb 2002, Jamshedpur, India.
24R.S. Thakur and S.N. Das, ����� �!����������� ����2����.New Delhi, India: Wiley Eastern Limited,1994.
25 B Mishra: �������(��������" �: REWAS’99, San Sebastian
26M. P. Antony, V. D. Tathavadkar and A. Jha, Patent GB : International application No. PCT/GB01/03370, 2001. 35
27 J Barnett and M.B.Mezner Patent: US 6248302B1, 2001.
28 ALCOA(http://www.Alcoa.com) (Access February 2014).
29J.Hausberg, U.Happel, F.M.Meyer, M.Mistry, M.Rohrlich, H.Koch,P.N.Martens, J. Schlimbach, G. Rombach, J. Kruger, ��$����� �����
($, 2000,/, 407"420
30 V Tathavadkar, M P Antony and A Jha, 7������������� "�� "�17�������"�3� 7������������ �, Annual Meeting of TMS, 2002, EPD 40
Symposium, Tennessee
31D. Knittel, ����� "��������� "�������, Encyclopaedia of Chemical Technology, John Wiley and Sons, 1983.
32J.Gambogi, ����� "��������� "����7�����"��������""������� ""�����, US Geological Survey,2010.
33 A. Jha, A. Lahiri and E.J. Kumari, ����$�)������$8 7��$������������., 2008, ,,6, 157"165.
34 Mineralogy Database, (http://webmineral.com/), (Access August 2014). 45
35 L. Harmor, Conference Proceedings.AusIMM, Perth, 1986, 143–146.
36 W. Zhang, Z. Zhu and C.Y. Cheng, ,����"����� �(�, 2011, ,-;, 177"188.
37 J.B. Rosebaum, �1�, 1982, .3, 76"80.
38 T.J. McDougall and A.K. Vaisey, Patent WO 2011 123 888, 2011.
39 E.A. Walpole and J.D. Winter, )�������(�����.�������������� �(�����������.����, 2002, 401–415. 50
40B.F. Bracanin, R.J. Clements and J.M. Darvey,� ����)����1980, 33–42.
41 S. Kataoka and S. Yamada,.��"$ ($�1973,;-,92–93.
42 N. Kanari, I. Gaballah and E. Allain,������������������3��1999,.-,577–587.
43 C. Arslan and G. Orhan,���������)��������1997,4-,87–96.
44V.D. Tathavadkar, M.P. Antony andA.Jha,������������������3��2001,.2,593–602. 55
45V.D. Tathavadkar, M.P. Antony andA.Jha,������������������3��2003,.3,555–563.
46 M.P. Antony, A.Jha and V.D. Tathavadkar,�����)������� 7����������2006,,,4,71–79.
47 B. Walawska and Z. Kowalski,/��������(��2000,2-,711–723.
48 Z. Kowalski and M. Gollinger"Tarajko,/��������(���2003,2.,771–783.
49 A.B. Mukherjee,���������� ������1998,2,6,9–19. 60
50 C.H. Weng, C.P. Huang, H.E. Allen, A.H"D Cheng and P.F. Sanders,���������� ������1994,,43,71–86.
51 G.R.C. Cooper,�++�0�����"��2002,,6,981–986.
52 M.K. Banks, A.P. Schwab and C. Henderson,.��"��+������2006,52,255–264.
53 K.P. Nickens, S.R. Patierno and S. Ceryak,.��"3������������2010,,;;,276–288.
54 Y. Zhang, S.L. Zheng, H.B. Xu, H.Du and Y. Zhang,���������)��������2010,/4,10–17. 65
55 A.K. Tripathy, H.S. Ray and P.K. Pattnayak,������������������3��1995,25,449–454.
56 A.M. Amer,,����"����� �(���1992,2;,29–43.
57 E. Vardar, R.H. Eric and F.K. Letowski,���� (��1994,6,605–617.
58 A.M. Amer and I.A. Ibrahim,,����"����� �(���1996,3.,307–316.
Page 27 of 28 Green Chemistry
GreenChemistryAcceptedManuscript
Publ
ishe
d on
10
Mar
ch 2
015.
Dow
nloa
ded
by U
nive
rsity
of
Lee
ds o
n 10
/03/
2015
10:
04:3
4.
View Article Online
DOI: 10.1039/C4GC02360A

This journal is © The Royal Society of Chemistry [year] Journal Name, [year], [vol], 00–00 |27
59 H. Zhang, H"B. Xu, X. Zhang, Y. Zhang and Y. Zhang, ,����"����� �(���2014, ,32, 47–55.
60 G. Chen, J. Wang, W. Xiaohui, S"L. Zheng, H. Du and Y. Zhang,,����"����� �(���2013,,./,46–53.
61 E.H.M. Moors, K.F. Mulder and P.J. Vergragt,��.����)�����2005,,.,657"668.
62 S. Srikanth, A.K. Ray, A. Bandopadhyay, B. Ravikumar, A. Jha, �$��"$.��"$������2005, ;;, 2396"2401.
63 A Lahiri and A Jha, ������������������3��2007,.;,939–948. 5
64 D A Palmer, P. Benezeth, and D J Wesolowski, 0�����"$.��"����"$����, 2001 54, 81"95.
65 P. Benezeth, D A Palmer, and D J Wesolowski, 0�����"$.��"����"$���� 2001 54, 2097–2111.
66 C.W. Bale, A.D. Pelton, W.T. Thompson, G. Eriksson, K.Hack, P. Chartrand, S. Decterov, I"H. Jung, J. Melancon and S. Petersen,
FactSage 6.4, Thermfact and GTT"Technologies, 2013.
67 A J Manhique, W Walter Focke and C Madivate, ,����"����� �(�, 2011, ,-/, 230–236. 10
68 A Lahiri and A Jha, ,����"����� �(�, 2009, /4, 254–261.
69D Sutter, S Banwart and W Stumm, ��(" ��, 1991, 6, 809"813.
70 L Vegard, Die Konstitution der Mischkristalle und die Raumfüllung der Atome, Zeitschrift für Physik, 1921, 4, 17"26.
71 T Makanyire, and A Jha,�������������������(�� 2014, 121""126.
72 H Guo, D Li, D Jiang, H Xiao, W Li, and Y Sun, .����������� 2010 , ,4;, 439"445. 15
73 F Habashi, in ,��9��'���� 7��������������� �(�, ed. Heidelberg, WILEY"VCH, Germany, 1997, vol.2, ch. 21, pp.1039"1129.
74 A N Eelikman, O E Krein and G V Samsonov, in ������ �(����������������, ed. L V Belyaevskaya, Russia, 1964, ch. 4, pp. 155"194.
75 A Roine, HSC Chemistry 5.1, Outokumpu Research Oy, 2002.
76 Department for Environment, Food & Rural Affairs (Defra), Guidelines to Defra/ DECC’s GHG Conversion Factors for Company
Reporting, London, 2012. 20
Page 28 of 28Green Chemistry
GreenChemistryAcceptedManuscript
Publ
ishe
d on
10
Mar
ch 2
015.
Dow
nloa
ded
by U
nive
rsity
of
Lee
ds o
n 10
/03/
2015
10:
04:3
4.
View Article Online
DOI: 10.1039/C4GC02360A